
Selective Survival of Protective Cultures during High-Pressure Processing by Leveraging Freeze-Drying and Encapsulation


Abstract
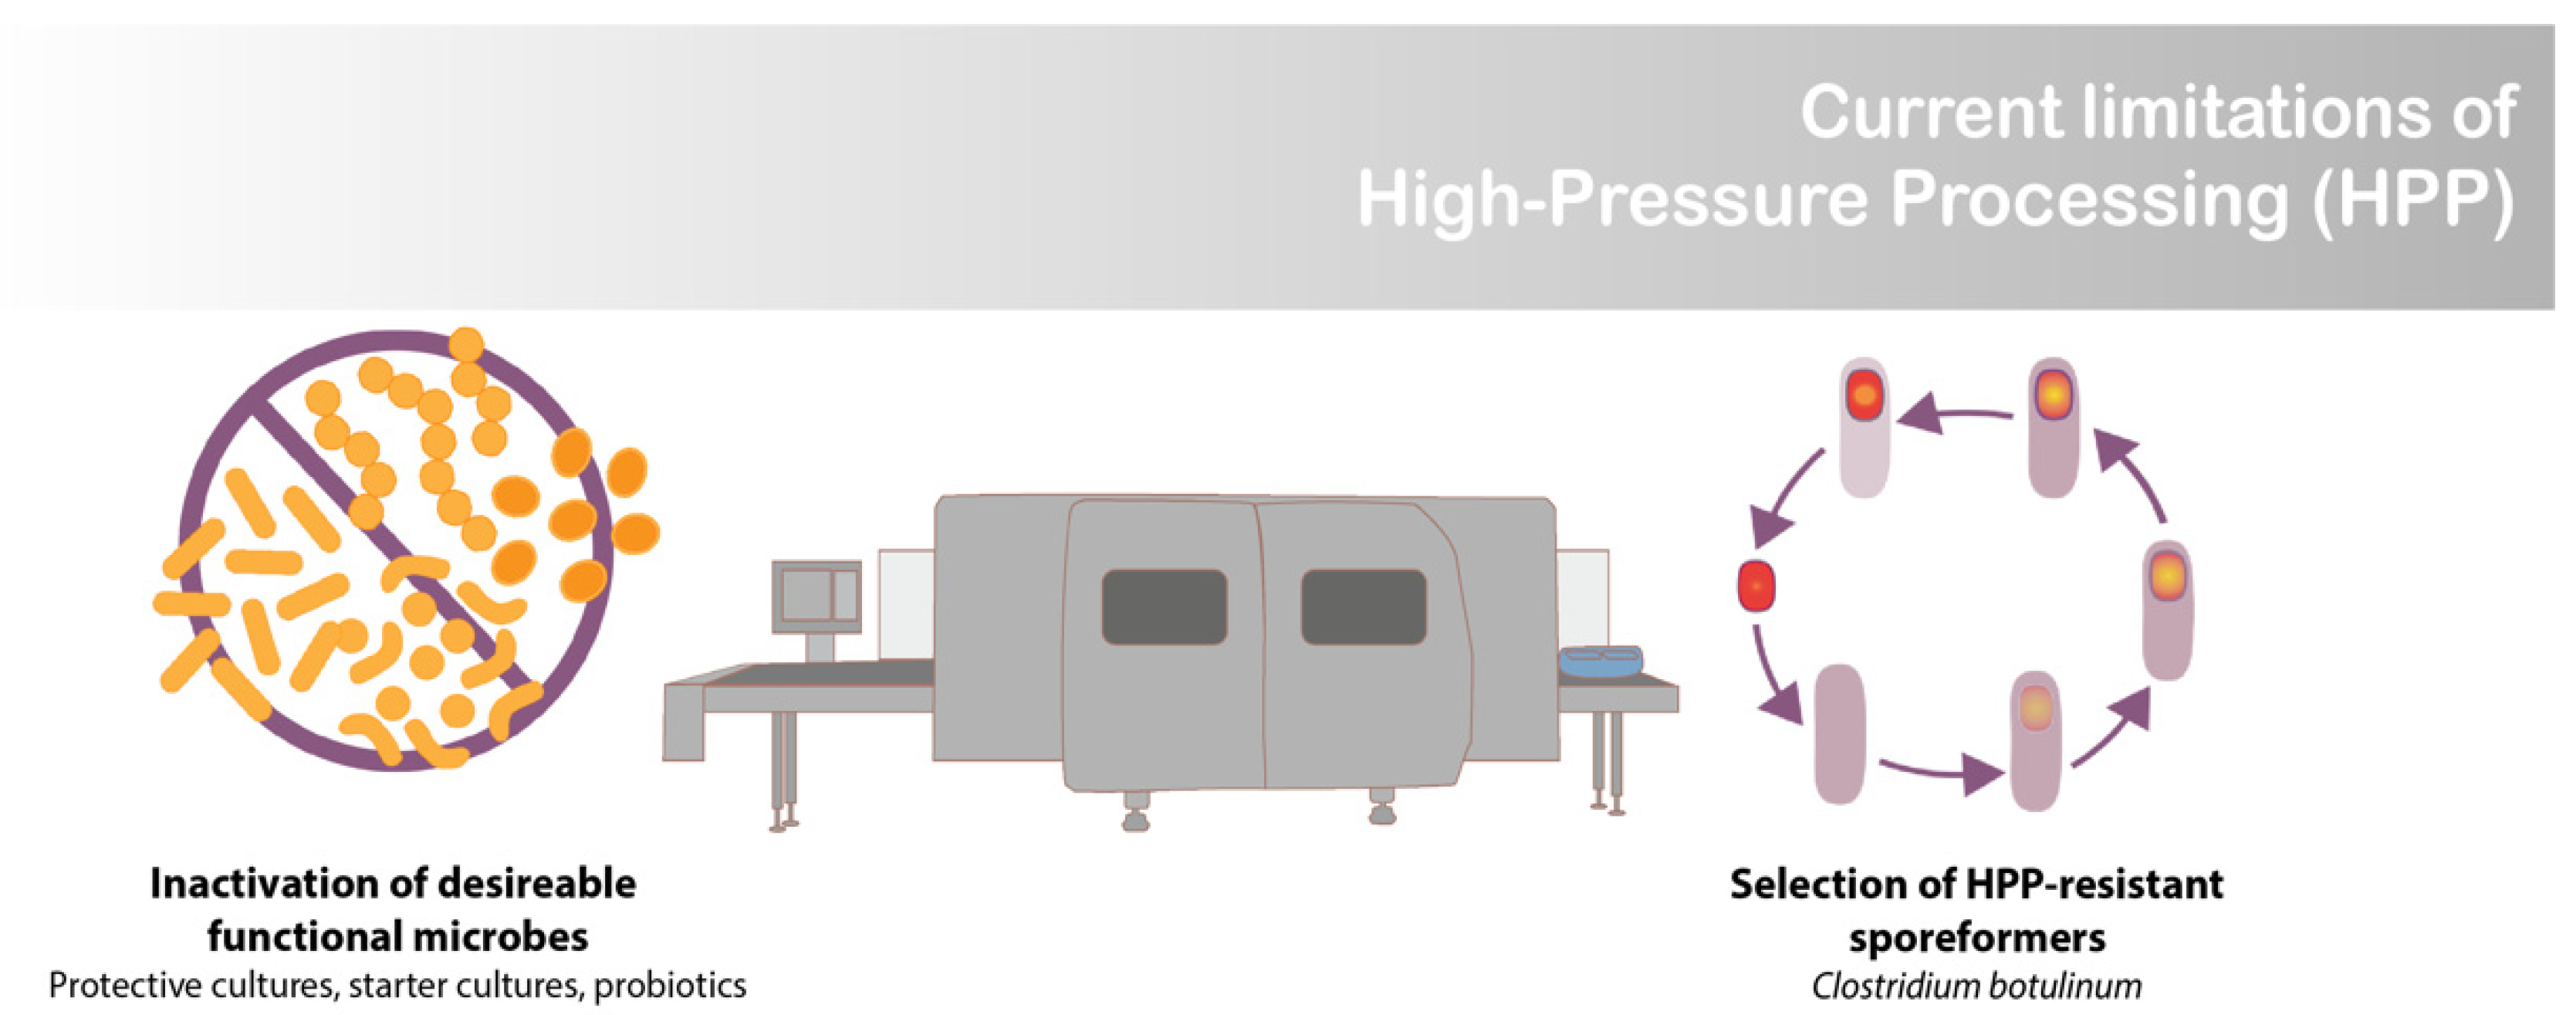
:1. Introduction
2. Materials and Methods
2.1. Cultures
2.2. HPP Treatment
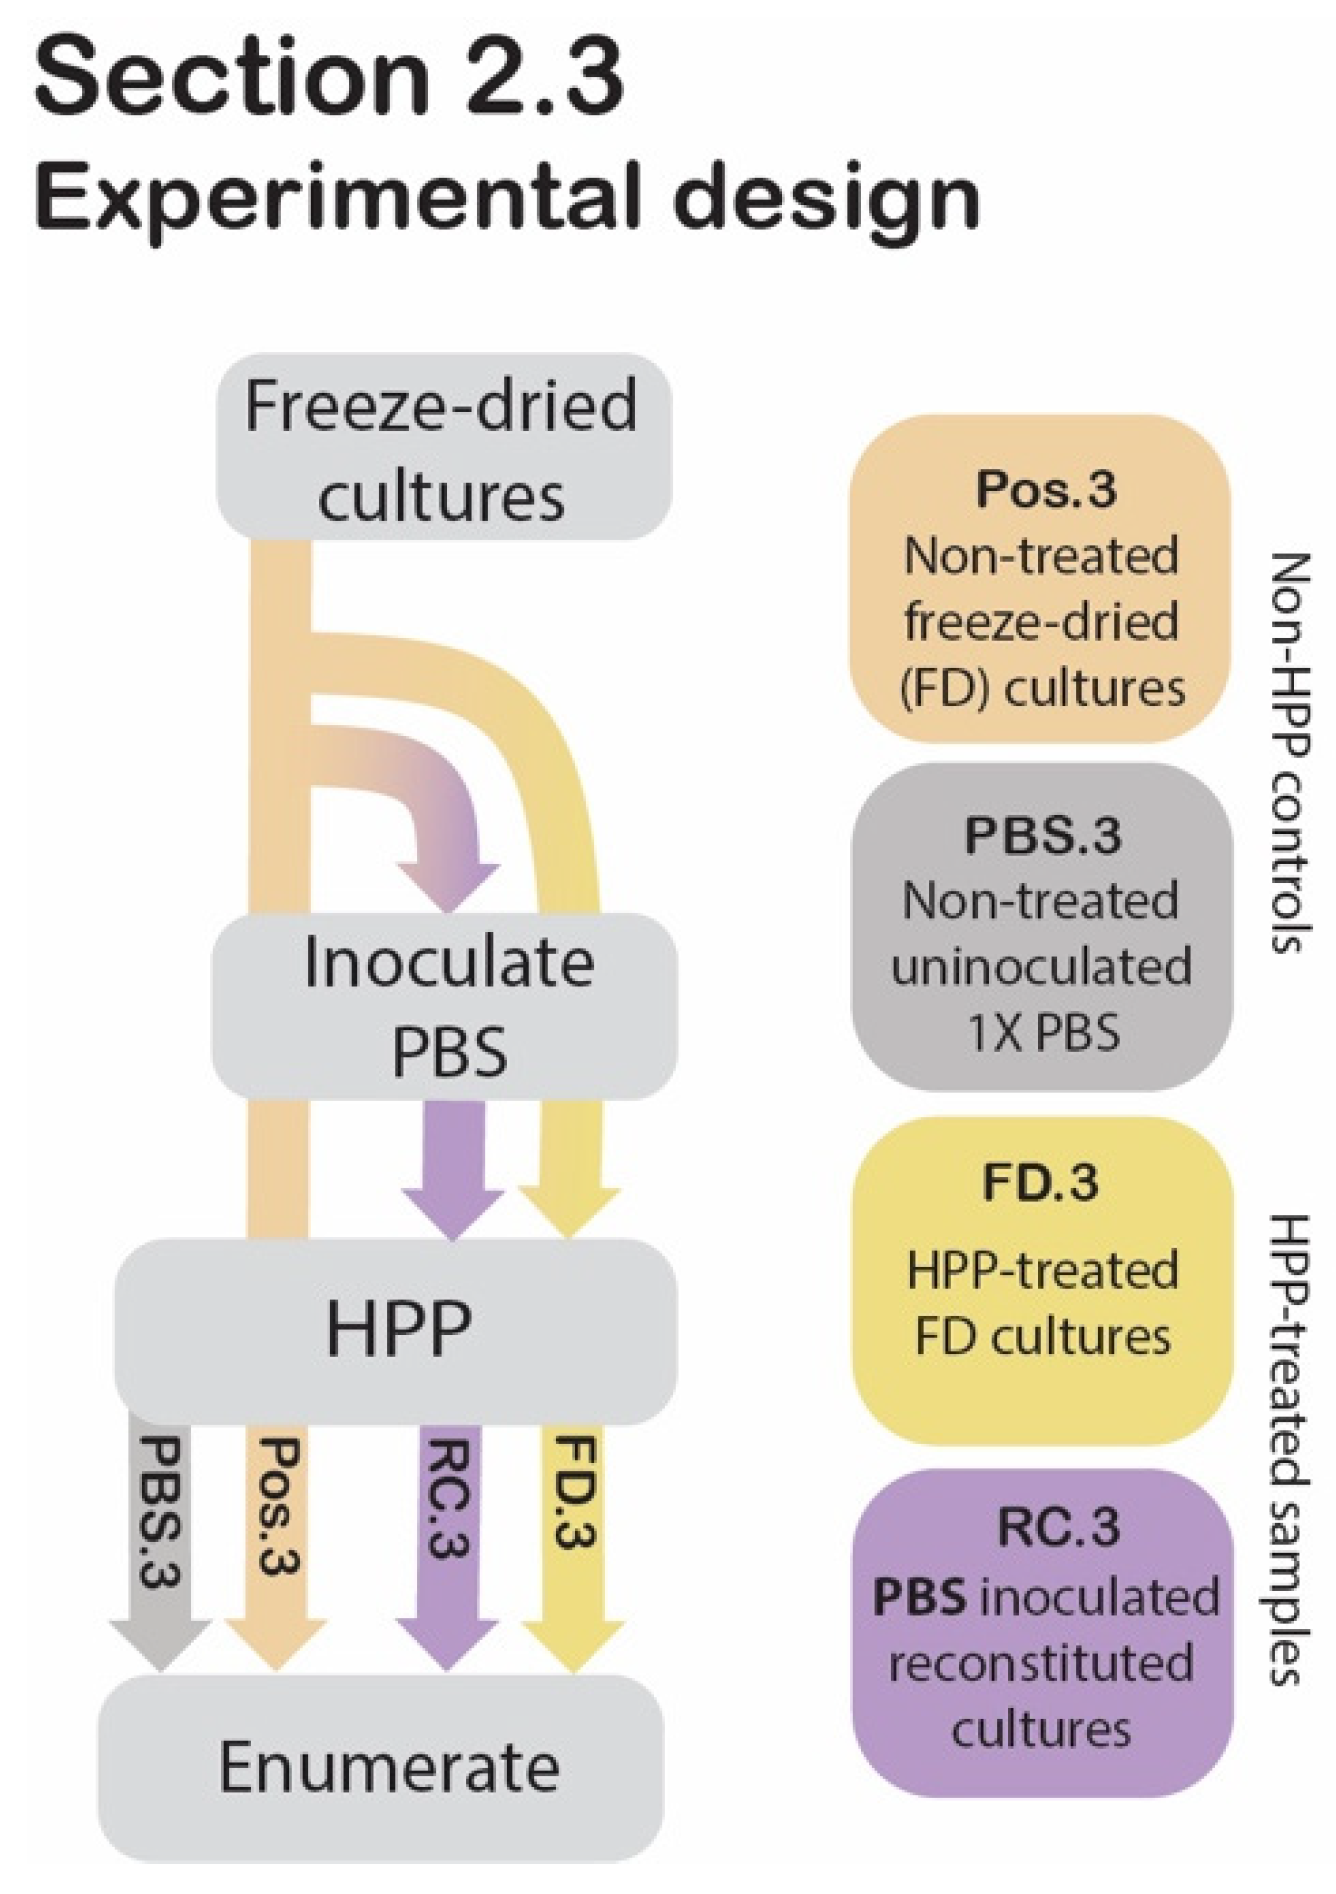
2.3. Assessing the Protective Effect of Freeze-Drying against HPP
2.3.1. Sample Preparation
2.3.2. Statistical Analysis
2.4. Optimization of Cocoa Butter Encapsulation by Homogenization Using Response Surface Methodology
2.4.1. Sample Preparation
2.4.2. Release, Suspension, and Data Collection for Encapsulated Cultures (EN)
2.4.3. Statistical Analysis
2.5. Encapsulation of Cultures in Preparation for HPP
2.6. Application in a High-Moisture Food Matrix
- the state of encapsulation
- liquid inoculum media
- pre-treatment storage time
- HPP treatment.
2.6.1. Sample Preparation
2.6.2. Release, Suspension, and Data Collection
2.6.3. Statistical Analysis
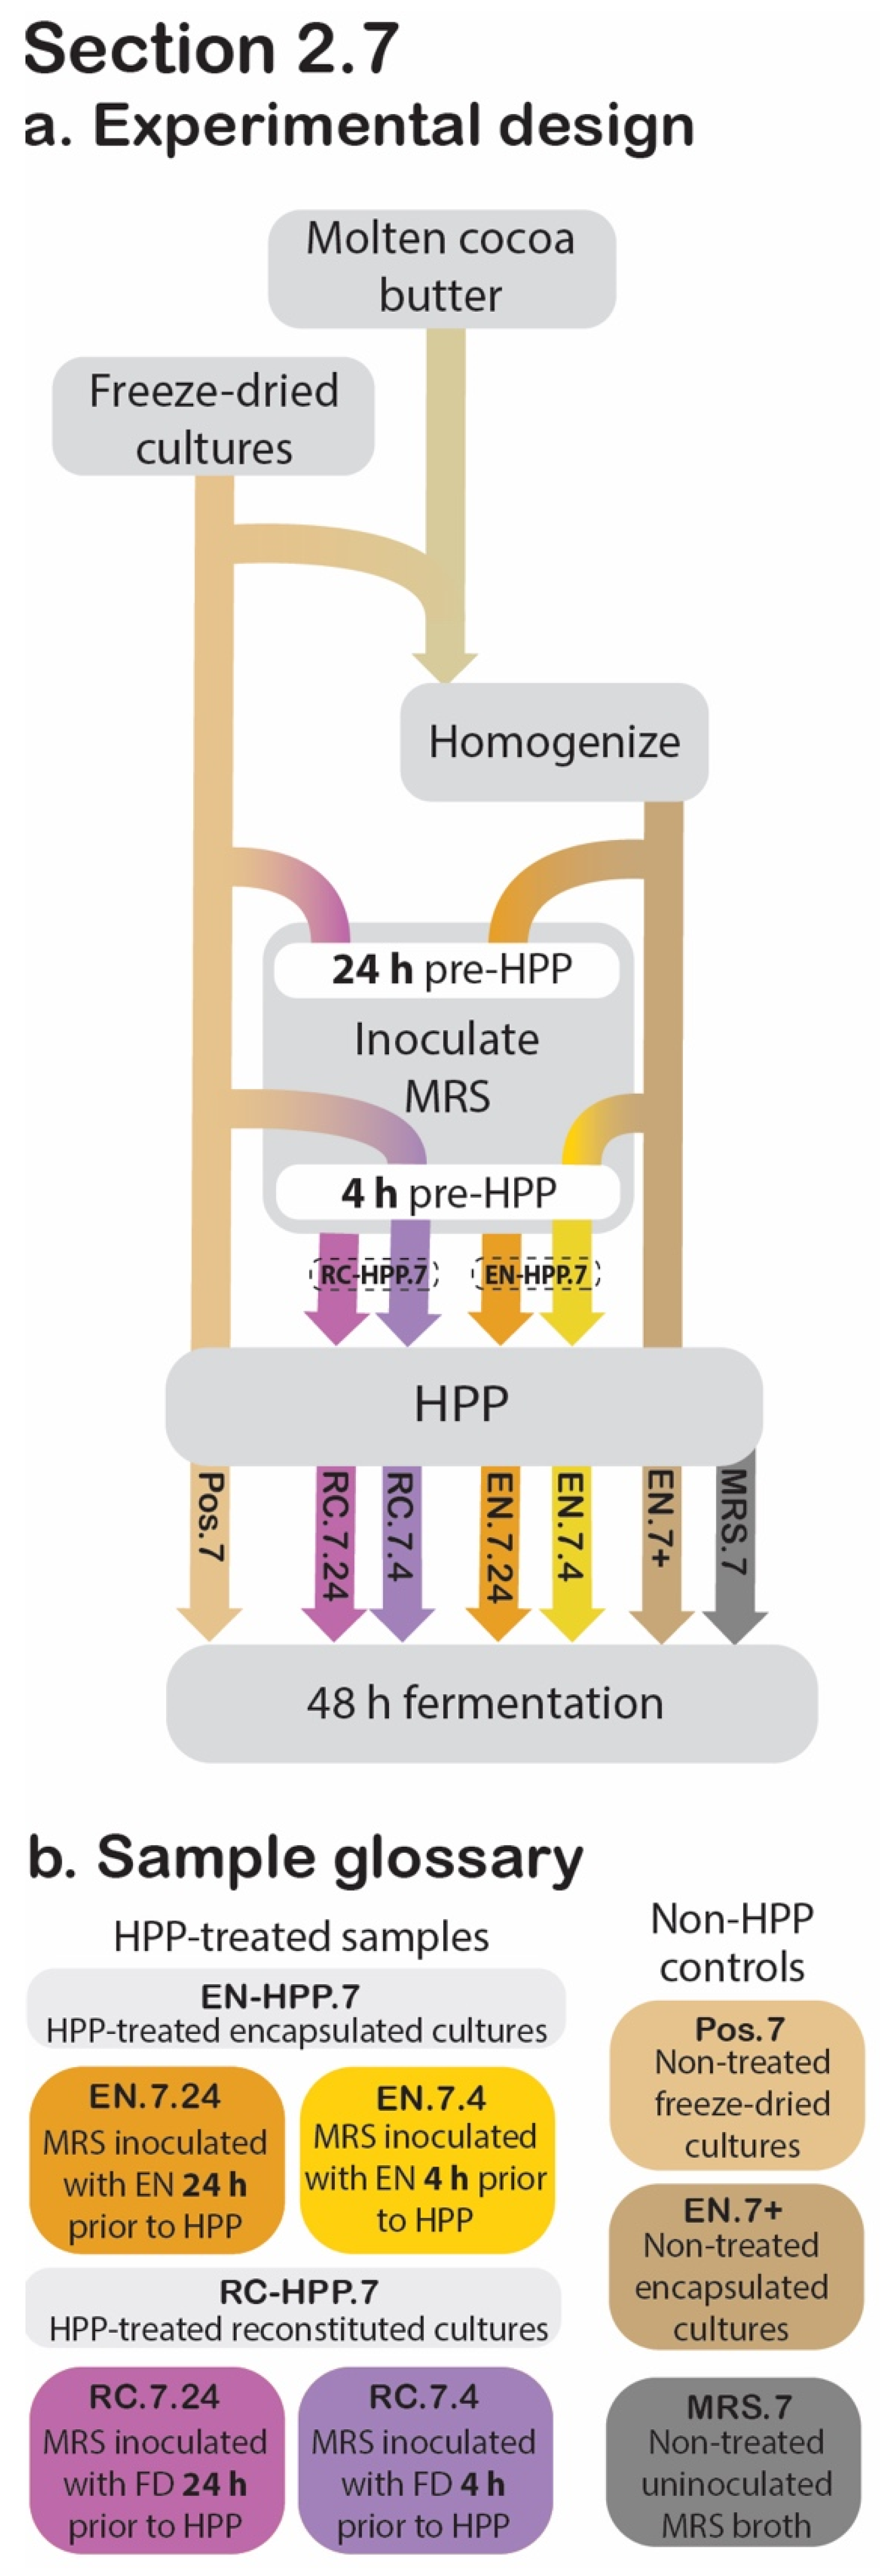
2.7. Acidification Activity
2.7.1. Modifications to Experiment Design Described in Section 2.6
2.7.2. Sample Preparation
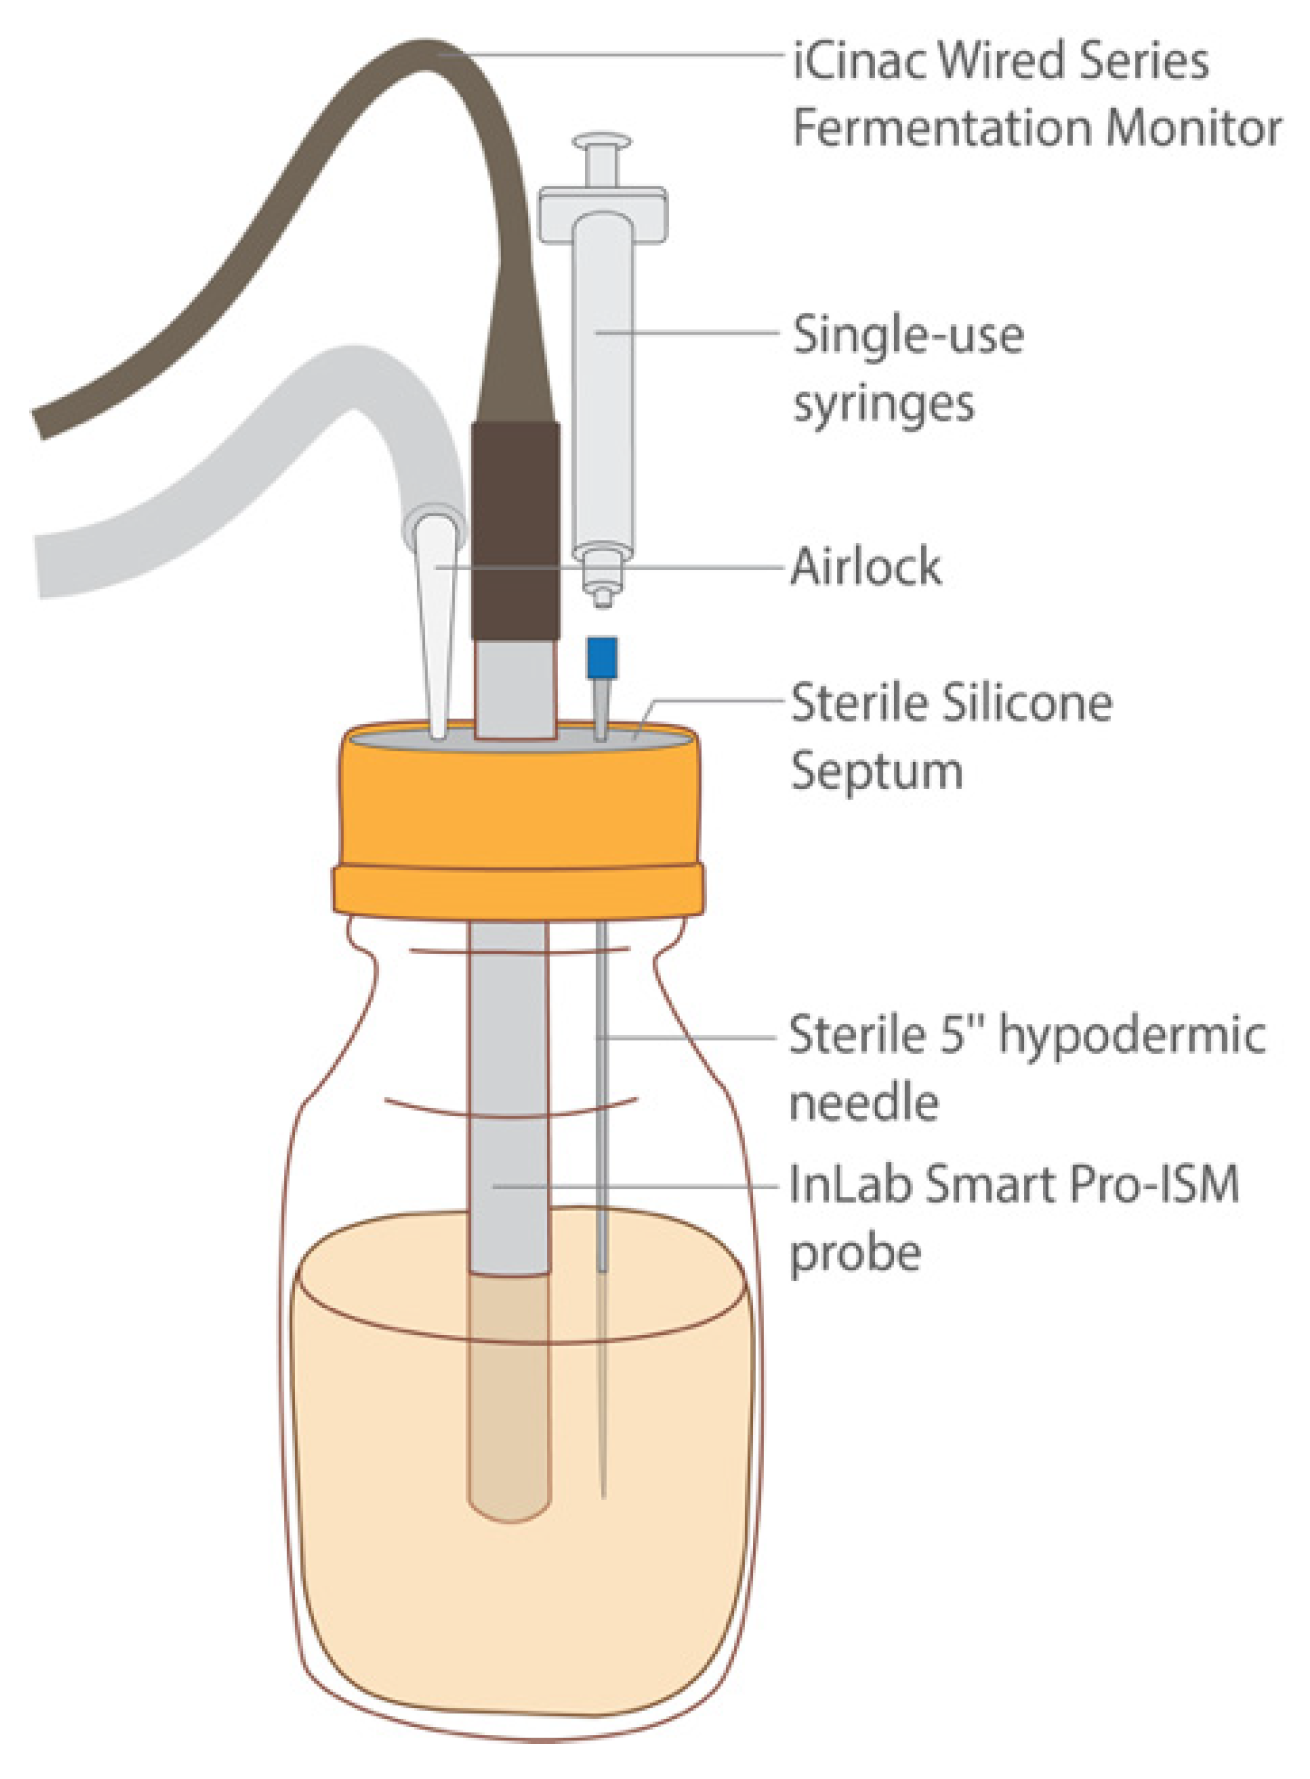
2.7.3. Release, Fermentation, and Data Collection
2.7.4. Statistical Analysis
2.8. Enumeration
3. Results
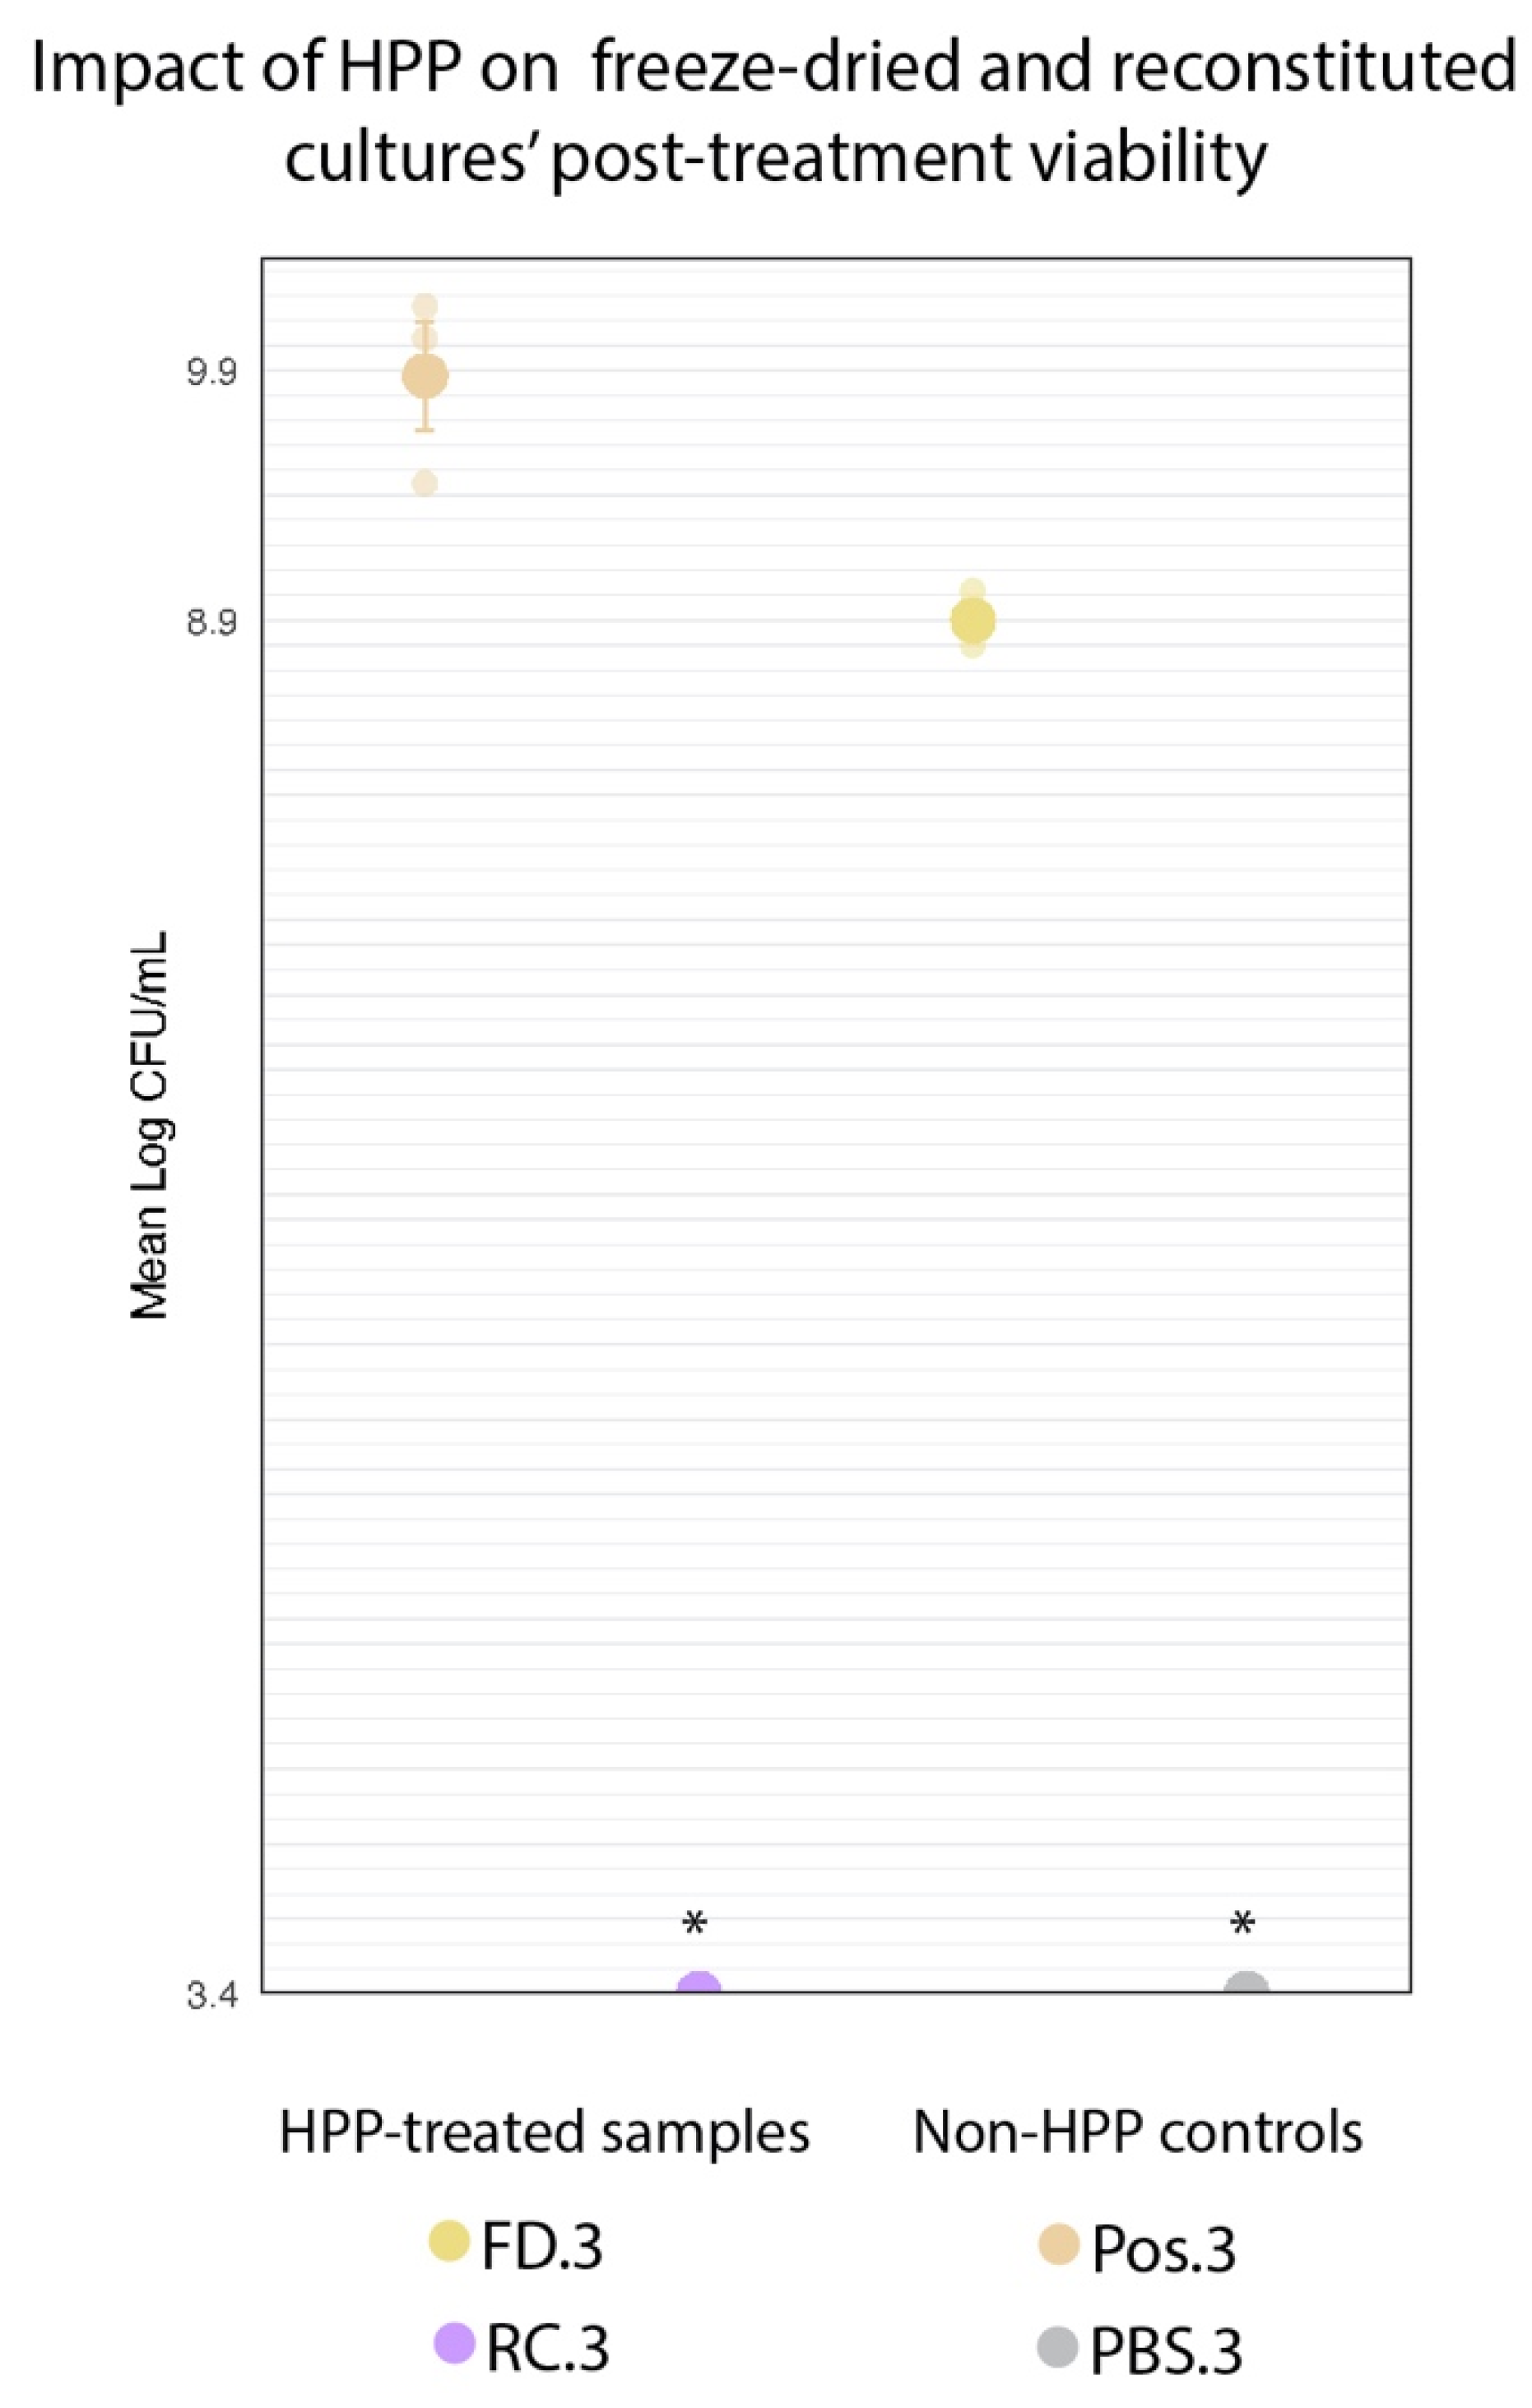
3.1. Freeze-Dried Cultures Survived HPP
3.2. Encapsulation in Molten Cocoa Butter by Homogenization Did Not Impact the Protective Culture’s Viability
3.2.1. Encapsulation Yields
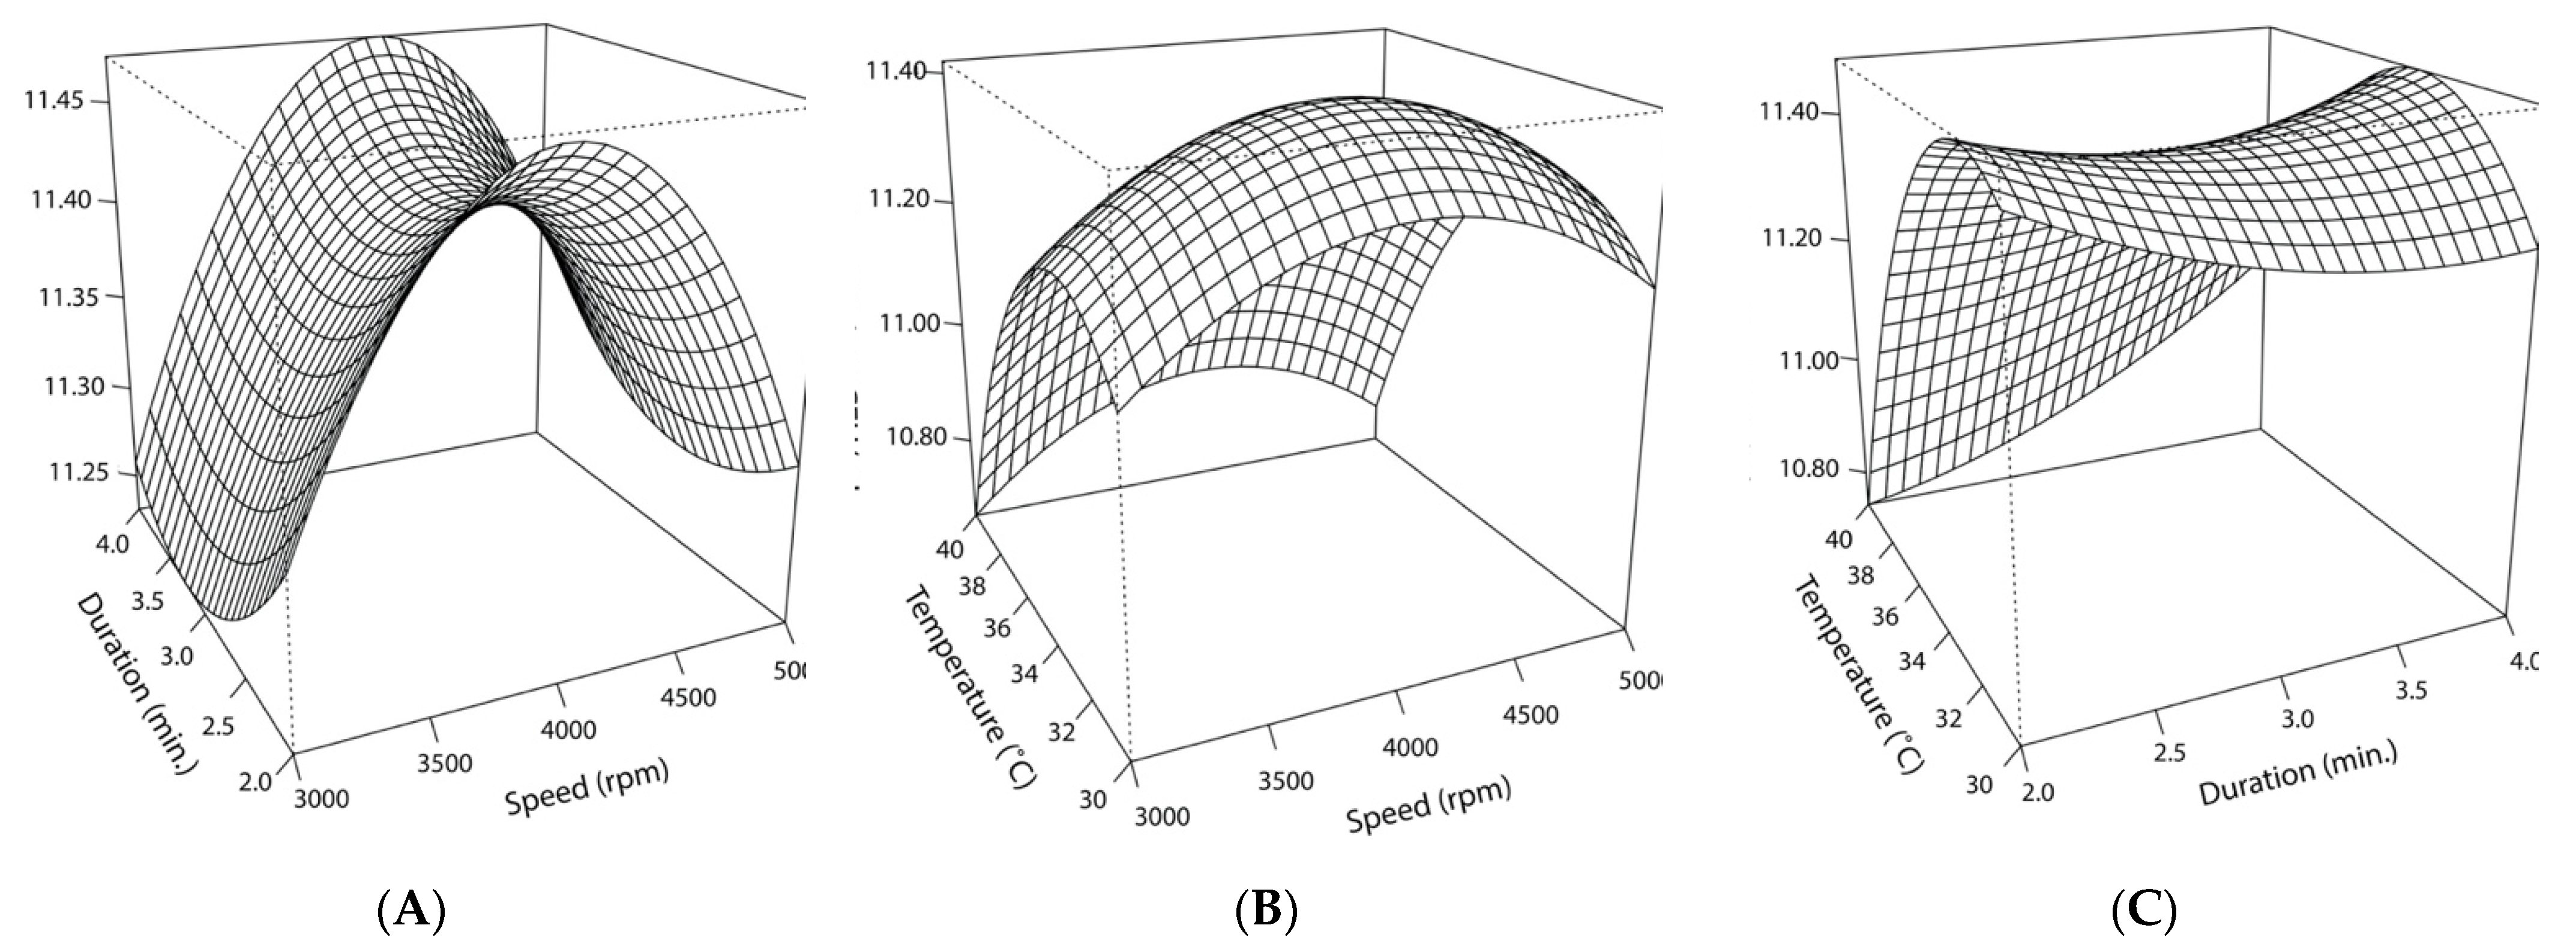
3.2.2. Response Surface Model and Statistical Significance of Temperature
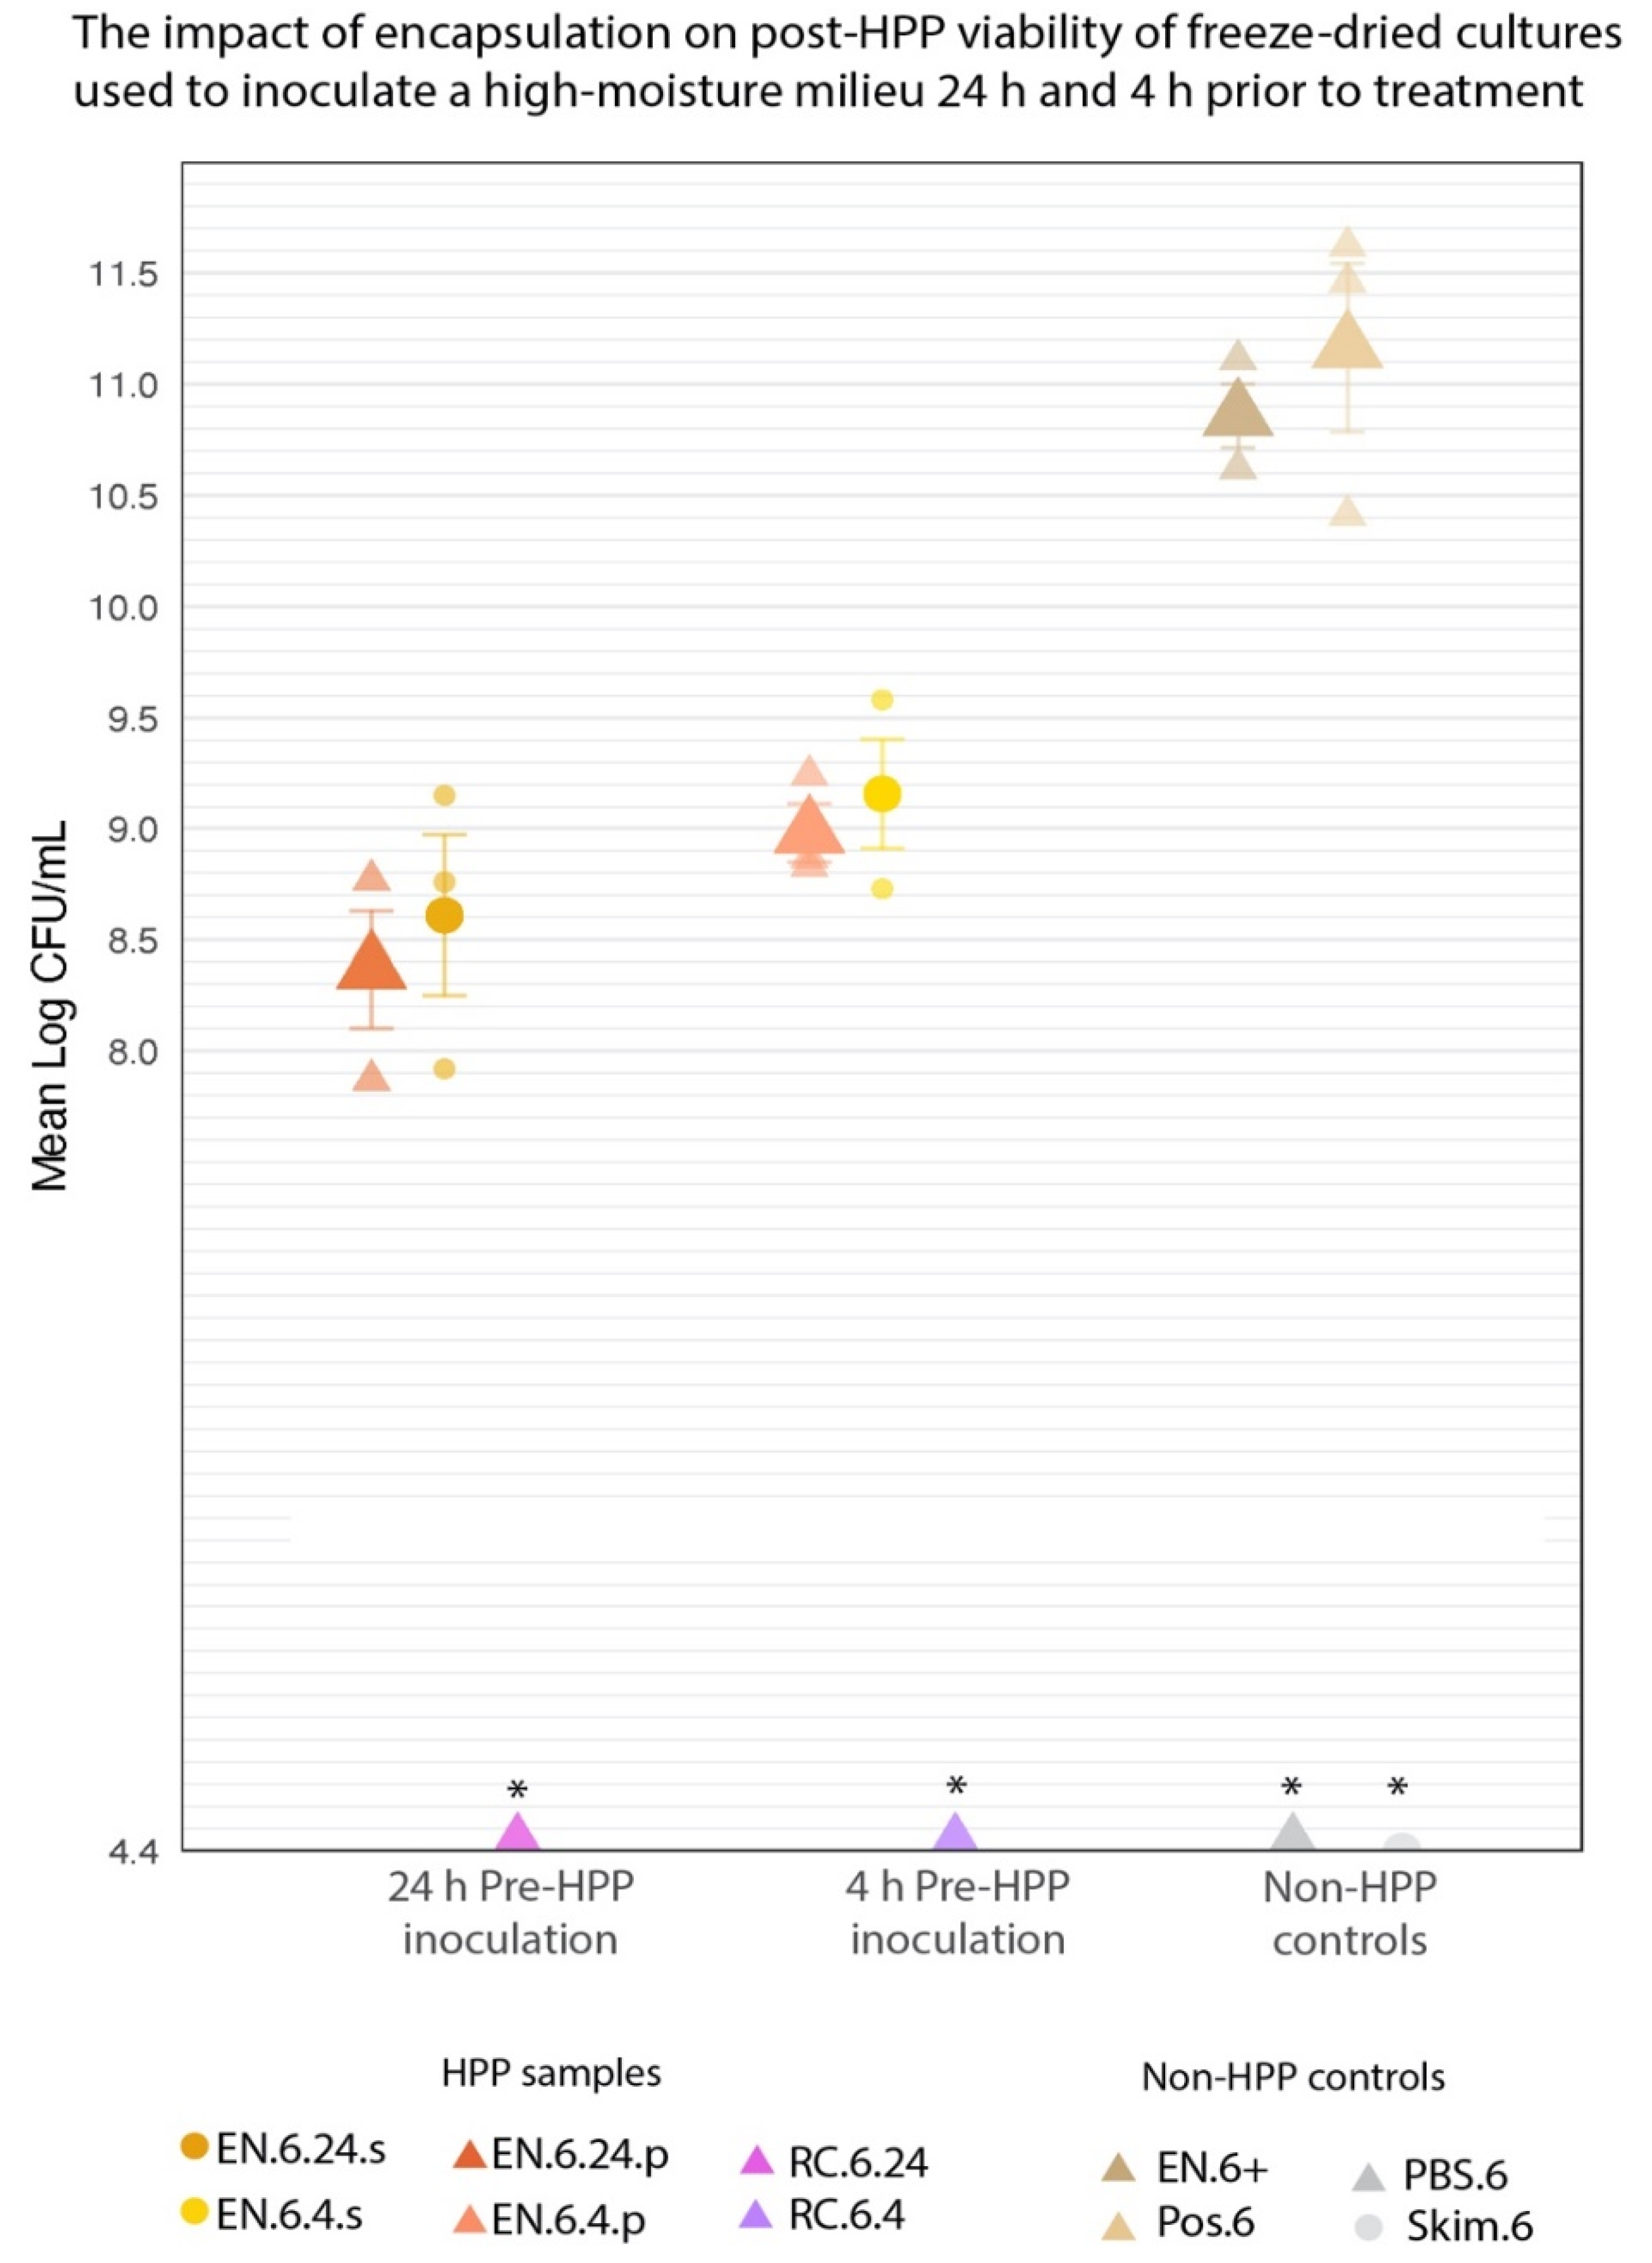
3.3. Encapsulation Prevents Unintended Rehydration of Cultures up to 24 h before HPP Treatment
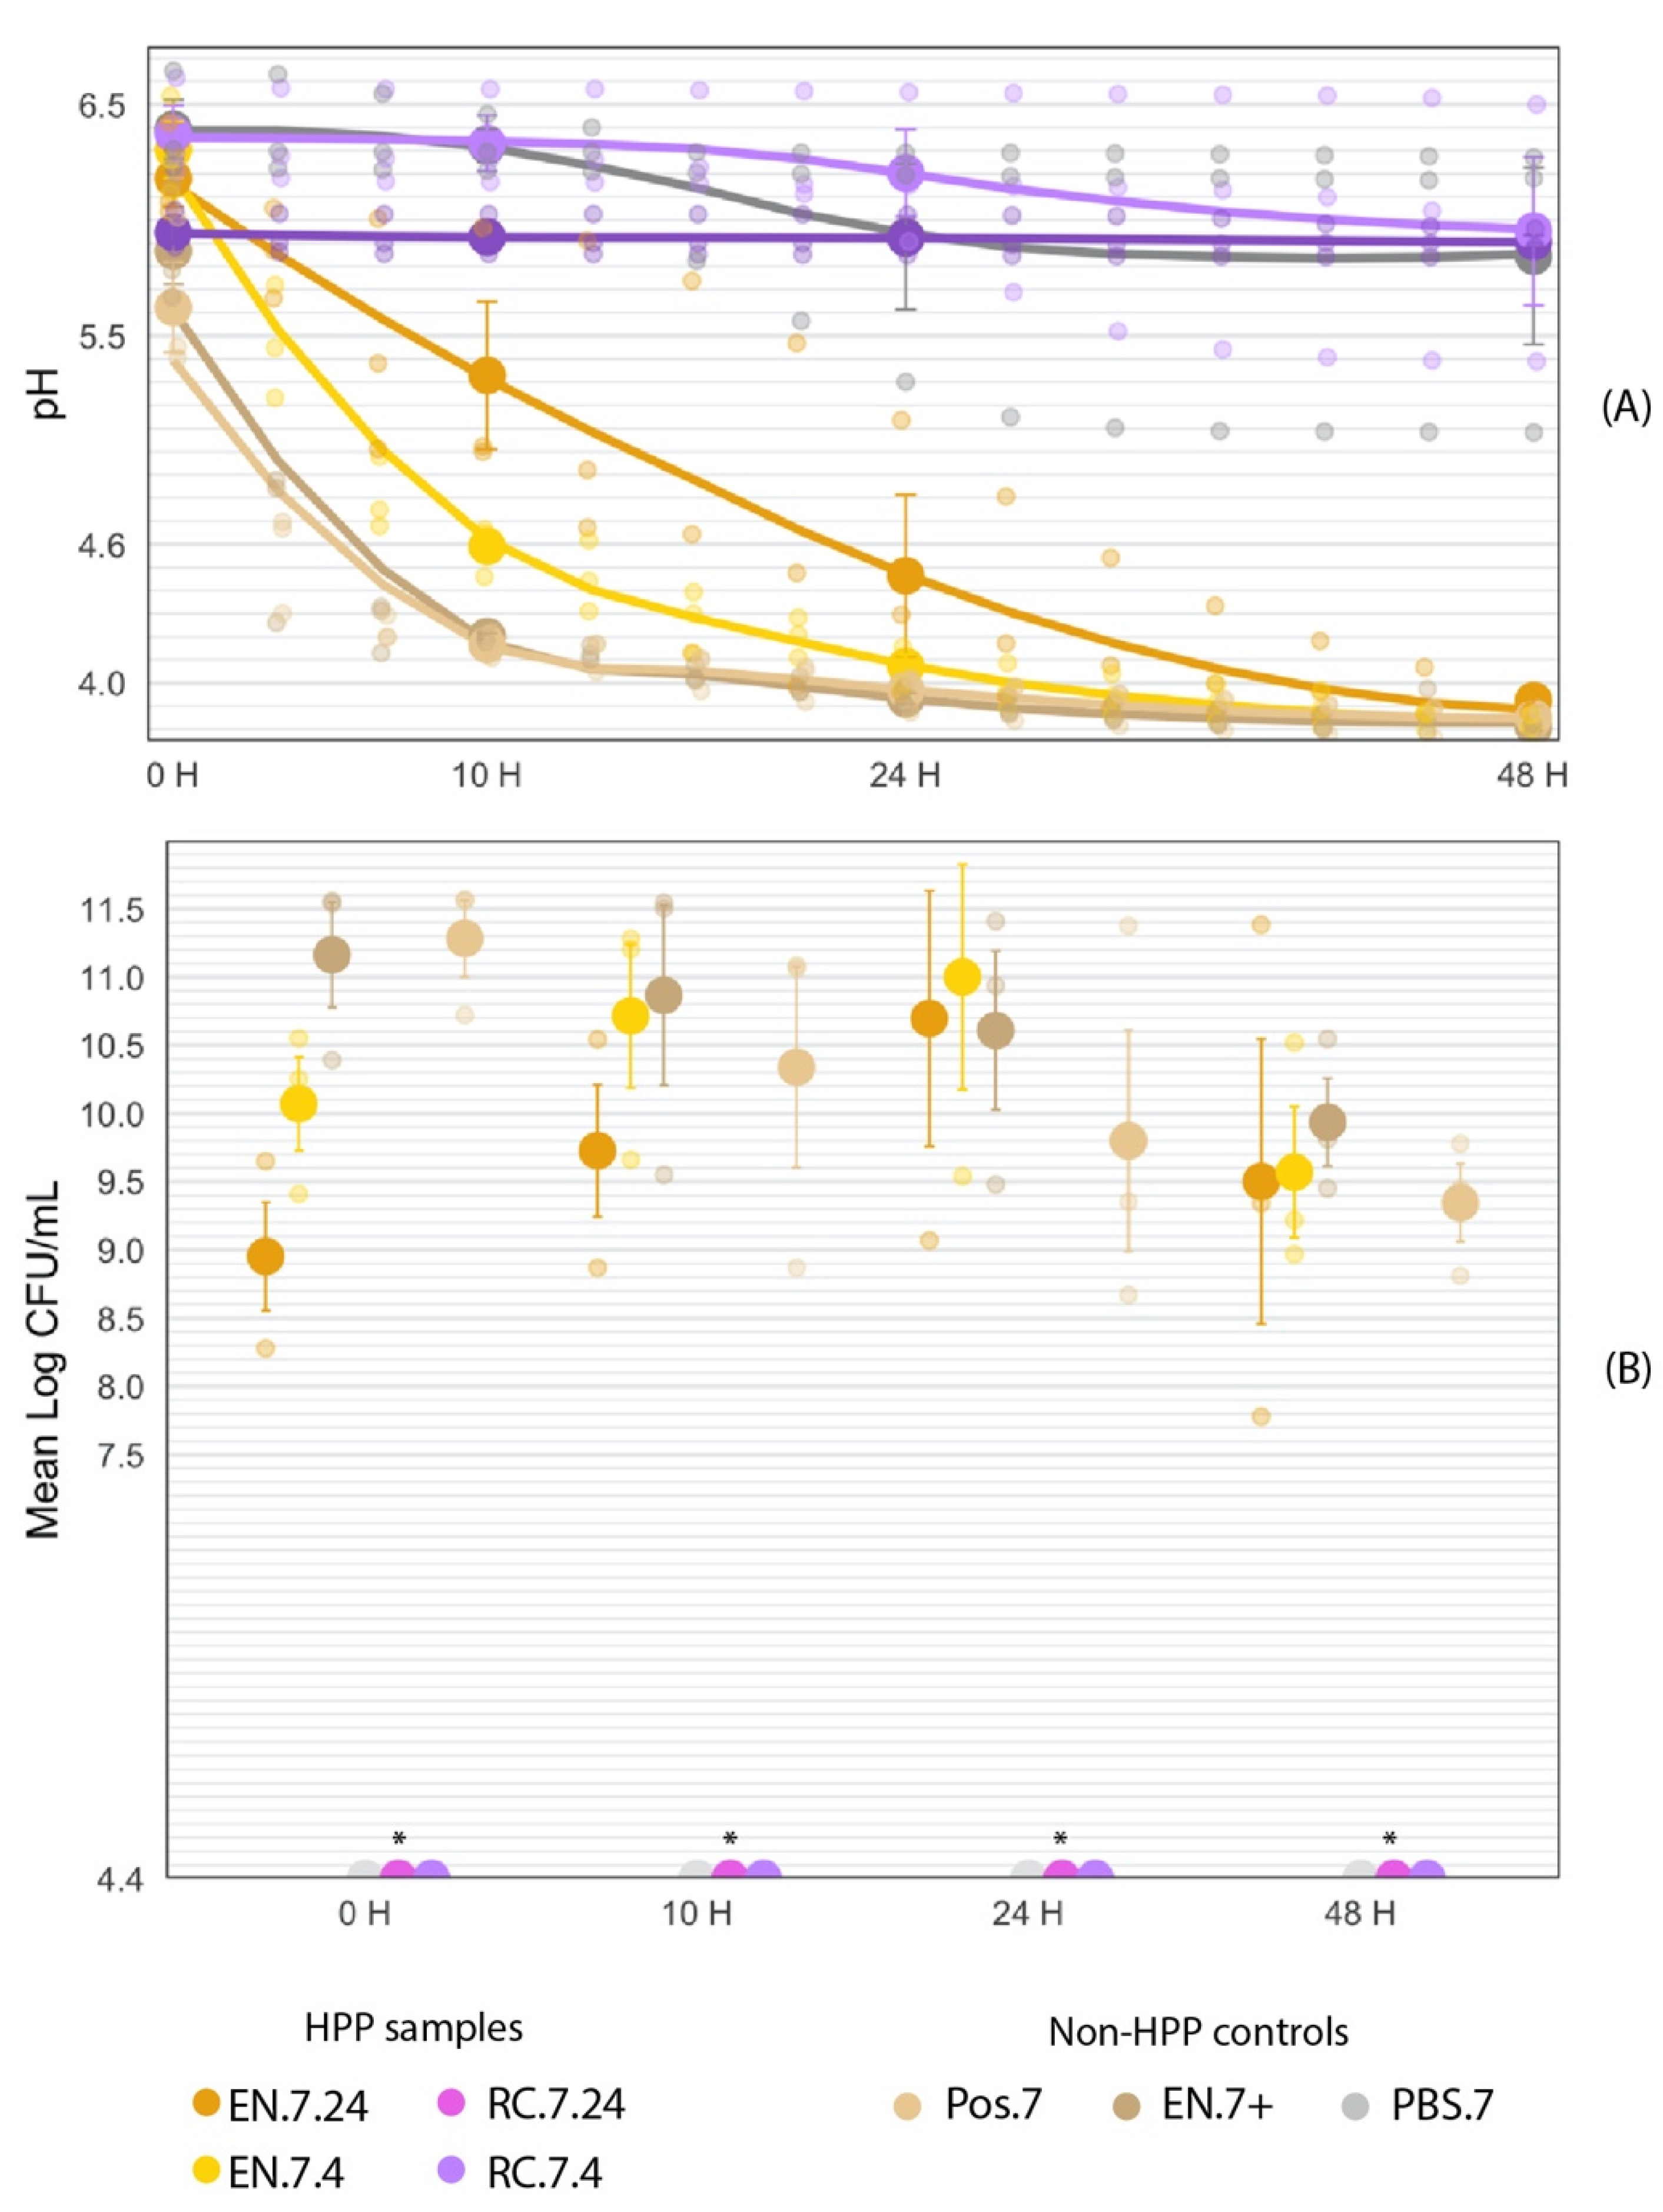
3.4. HPP-Treated Encapsulated Cultures Maintain Acidification Activity in Liquid Food Matrix throughout 48-h Fermentation
3.4.1. Fermentation at T = 0 h
3.4.2. Fermentation at T = 10 h
3.4.3. Fermentation at T = 24 h
3.4.4. Fermentation at T = 48 h
4. Discussion
5. Conclusions
Supplementary Materials
Author Contributions
Funding
Institutional Review Board Statement
Informed Consent Statement
Data Availability Statement
Conflicts of Interest
References
- Patrignani, F.; Lanciotti, R. Applications of High and Ultra High Pressure Homogenization for Food Safety. Front. Microbiol. 2016, 7, 1132. [Google Scholar] [CrossRef] [PubMed]
- Asaithambi, N.; Singh, S.K.; Singha, P. Current Status of Non-Thermal Processing of Probiotic Foods: A Review. J. Food Eng. 2021, 303, 110567. [Google Scholar] [CrossRef]
- Tsevdou, M.; Ouli-Rousi, M.; Soukoulis, C.; Taoukis, P. Impact of High-Pressure Process on Probiotics: Viability Kinetics and Evaluation of the Quality Characteristics of Probiotic Yoghurt. Foods 2020, 9, 360. [Google Scholar] [CrossRef] [PubMed]
- Serna-Jiménez, J.A.; Uribe-Bohórquez, M.A.; Rodríguez-Bernal, J.M.; Klotz-Ceberio, B.; Quintanilla-Carvajal, M.X. Control of Spoilage Fungi in Yogurt Using MicroGARD 200TM, Lyofast-FPR2TM and HOLDBAC-YMCTM as Bioprotectants. Int. J. Food Eng. 2020, 16, 20190299. [Google Scholar] [CrossRef]
- Niamah, A.K.; Al-Sahlany, S.T.G.; Ibrahim, S.A.; Verma, D.K.; Thakur, M.; Singh, S.; Patel, A.R.; Aguilar, C.N.; Utama, G.L. Electro-Hydrodynamic Processing for Encapsulation of Probiotics: A Review on Recent Trends, Technological Development, Challenges and Future Prospect. Food Biosci. 2021, 44, 101458. [Google Scholar] [CrossRef]
- Nguyen, T.H.; Kim, Y.; Kim, J.-S.; Jeong, Y.; Park, H.M.; Kim, J.W.; Kim, J.-E.; Kim, H.; Paek, N.-S.; Kang, C.-H. Evaluating the Cryoprotective Encapsulation of the Lactic Acid Bacteria in Simulated Gastrointestinal Conditions. Biotechnol. Bioprocess Eng. 2020, 25, 287–292. [Google Scholar] [CrossRef]
- Rodgers, S. Novel Applications of Live Bacteria in Food Services: Probiotics and Protective Cultures. Trends Food Sci. Tech. 2008, 19, 188–197. [Google Scholar] [CrossRef]
- Patterson, M.F.; McKay, A.M.; Connolly, M.; Linton, M. Effect of High Pressure on the Microbiological Quality of Cooked Chicken during Storage at Normal and Abuse Refrigeration Temperatures. Food Microbiol. 2010, 27, 266–273. [Google Scholar] [CrossRef] [PubMed]
- Stratakos, A.C.; Linton, M.; Tessema, G.T.; Skjerdal, T.; Patterson, M.F.; Koidis, A. Effect of High Pressure Processing in Combination with Weissella Viridescens as a Protective Culture against Listeria Monocytogenes in Ready-to-Eat Salads of Different PH. Food Control 2016, 61, 6–12. [Google Scholar] [CrossRef]
- Linton, M.; Connolly, M.; Houston, L.; Patterson, M.F. The Control of Clostridium Botulinum during Extended Storage of Pressure-Treated, Cooked Chicken. Food Control 2014, 37, 104–108. [Google Scholar] [CrossRef]
- Zhang, H.; Mittal, G.S. Effects of High-Pressure Processing (HPP) on Bacterial Spores: An Overview. Food Rev. Int. 2008, 24, 330–351. [Google Scholar] [CrossRef]
- Murray, P.R.; Rosenthal, K.S.; Pfaller, M.A. Bacterial Classification, Structure, and Replication. Med. Microbiol. 2021, 12, 114–126.e1. [Google Scholar]
- Kurtmann, L.; Skibsted, L.H.; Carlsen, C.U. Browning of Freeze-Dried Probiotic Bacteria Cultures in Relation to Loss of Viability during Storage. J. Agric. Food Chem. 2009, 57, 6736–6741. [Google Scholar] [CrossRef] [PubMed]
- Picot, A.; Lacroix, C. Encapsulation of Bifidobacteria in Whey Protein-Based Microcapsules and Survival in Simulated Gastrointestinal Conditions and in Yoghurt. Int. Dairy J. 2004, 14, 505–515. [Google Scholar] [CrossRef]
- Rosenberg, M.; Sheu, T.-Y. Microencapsulation of Volatiles by Spray-Drying in Whey Protein-Based Wall Systems. Int. Dairy J. 1996, 6, 273–284. [Google Scholar] [CrossRef]
- Lahtinen, S.J.; Ouwehand, A.C.; Salminen, S.J.; Forssell, P.; Myllärinen, P. Effect of Starch- and Lipid-based Encapsulation on the Culturability of Two Bifidobacterium Longum Strains. Lett. Appl. Microbiol. 2007, 44, 500–505. [Google Scholar] [CrossRef] [PubMed]
- Odlaug, T.E.; Pflug, I.J. Clostridium Botulinum and Acid Foods. J. Food Prot. 1978, 4, 566–573. [Google Scholar] [CrossRef] [PubMed]
- Makki, G.M.; Kozak, S.M.; Jencarelli, K.G.; Alcaine, S.D. Evaluation of the Efficacy of Commercial Protective Cultures against Mold and Yeast in Queso Fresco. J. Dairy Sci. 2020, 103, 9946–9957. [Google Scholar] [CrossRef] [PubMed]
- Fritze, D.; Claus, D. The Genera of Lactic Acid Bacteria; Springer Science & Business Media: Boston, MA, USA, 1995; pp. 368–391. [Google Scholar] [CrossRef]
- Paredes-Sabja, D.; Gonzalez, M.; Sarker, M.R.; Torres, J.A. Combined Effects of Hydrostatic Pressure, Temperature, and PH on the Inactivation of Spores of Clostridium Perfringens Type A and Clostridium Sporogenes in Buffer Solutions. J. Food Sci. 2007, 72, M202–M206. [Google Scholar] [CrossRef] [PubMed]


| Trial | Speed (rpm) X1 | Duration (min) X2 | Temperature (°C) X3 |
|---|---|---|---|
| 1 | 4000 | 2 | 40 |
| 2 | 5000 | 3 | 40 |
| 3 | 3000 | 2 | 35 |
| 4 | 5000 | 2 | 35 |
| 5 * | 4000 | 3 | 35 |
| 6 | 4000 | 2 | 30 |
| 7 | 3000 | 4 | 35 |
| 8 | 3000 | 3 | 40 |
| 9 | 4000 | 4 | 30 |
| 10 | 4000 | 4 | 40 |
| 11 | 3000 | 3 | 30 |
| 12 | 5000 | 3 | 30 |
| 13 * | 4000 | 3 | 35 |
| 14 | 5000 | 4 | 35 |
| Treatment | Log CFU/mL |
|---|---|
| EN.6.24.p | 8.37 a ± 0.26 |
| EN.6.4.p | 8.98 a ± 0.13 |
| EN.6.24.s | 8.61 a ± 0.36 |
| EN.6.4.s | 9.16 a ± 0.25 |
| RC.6.24 | nd * |
| RC.6.4 | nd * |
| EN.6+ | 10.86 b ± 0.14 |
| Pos.6 | 11.16 b ± 0.38 |
| PBS.6 | nd * |
| Skim.6 | nd * |
| Treatment | T = 0 | T = 10 | T = 24 | T = 48 | |
|---|---|---|---|---|---|
| EN.7.24 | pH | 6.18 a,b ± 0.12 | 5.33 a ± 0.32 | 4.36 a ± 0.35 | 3.92 a ± 0.03 |
| CFU/mL | 8.95 1 ± 0.40 | 9.73 ± 0.48 | 10.70 ± 0.94 | 9.50 ± 1.04 | |
| EN.7.4 | pH | 6.30 a,b ± 0.12 | 4.59 b ± 0.07 | 4.07 a ± 0.05 | 3.83 a ± 0.02 |
| CFU/mL | 10.07 1 ± 0.34 | 10.71 ± 0.53 | 11.00 ± 0.83 | 9.57 ± 0.48 | |
| RC.7.24 | pH | 5.95 a,b ± 0.048 | 5.95 a,c ± 0.051 | 5.92 b ± 0.052 | 5.91 b ± 0.028 |
| CFU/mL | nd * | nd * | nd * | nd * | |
| RC.7.4 | pH | 6.37 b ± 0.12 | 6.37 c ± 0.12 | 6.20 b ± 0.19 | 5.95 b ± 0.32 |
| CFU/mL | nd * | nd * | nd * | nd * | |
| MRS.7 | pH | 6.39 b ± 0.13 | 6.32 c ± 0.07 | 5.93 b ± 0.32 | 5.84 b ± 0.38 |
| CFU/mL | nd * | nd * | nd * | nd * | |
| Pos.7 | pH | 5.87 a,b ± 0.14 | 4.20 b ± 0.01 | 3.93 a ± 0.02 | 3.81 a ± 0.01 |
| CFU/mL | 11.28 2 ± 0.28 | 10.34 ± 0.73 | 9.80 ± 0.81 | 9.35 ± 0.28 | |
| EN.7+ | pH | 5.62 a ± 0.20 | 4.17 b ± 0.03 | 3.97 a ± 0.05 | 3.85 a ± 0.04 |
| CFU/mL | 11.16 2 ± 0.39 | 10.87 ± 0.66 | 10.61 ± 0.58 | 9.94 ± 0.32 |
Publisher’s Note: MDPI stays neutral with regard to jurisdictional claims in published maps and institutional affiliations. |
© 2022 by the authors. Licensee MDPI, Basel, Switzerland. This article is an open access article distributed under the terms and conditions of the Creative Commons Attribution (CC BY) license (https://creativecommons.org/licenses/by/4.0/).
Share and Cite
McGillin, M.R.; deRiancho, D.L.; DeMarsh, T.A.; Hsu, E.D.; Alcaine, S.D. Selective Survival of Protective Cultures during High-Pressure Processing by Leveraging Freeze-Drying and Encapsulation. Foods 2022, 11, 2465. https://doi.org/10.3390/foods11162465
McGillin MR, deRiancho DL, DeMarsh TA, Hsu ED, Alcaine SD. Selective Survival of Protective Cultures during High-Pressure Processing by Leveraging Freeze-Drying and Encapsulation. Foods. 2022; 11(16):2465. https://doi.org/10.3390/foods11162465
Chicago/Turabian StyleMcGillin, Meghan R., Dana L. deRiancho, Timothy A. DeMarsh, Ella D. Hsu, and Samuel D. Alcaine. 2022. "Selective Survival of Protective Cultures during High-Pressure Processing by Leveraging Freeze-Drying and Encapsulation" Foods 11, no. 16: 2465. https://doi.org/10.3390/foods11162465
APA StyleMcGillin, M. R., deRiancho, D. L., DeMarsh, T. A., Hsu, E. D., & Alcaine, S. D. (2022). Selective Survival of Protective Cultures during High-Pressure Processing by Leveraging Freeze-Drying and Encapsulation. Foods, 11(16), 2465. https://doi.org/10.3390/foods11162465