Article

Characteristics of Mussels-Derived Carbon Dots and Their Applications in Bio-Imaging and Detection of Riboflavin

College of Life Sciences, Yantai University, Yantai 264005, China
*
Author to whom correspondence should be addressed.
Foods 2022, 11(16), 2451; https://doi.org/10.3390/foods11162451
Submission received: 16 June 2022 / Revised: 25 July 2022 / Accepted: 9 August 2022 / Published: 14 August 2022

Abstract

:
A simple and green strategy has been demonstrated for the synthesis of carbon dots (CDs) from mussels. The chemical structure and optical properties of mussels-derived CDs prepared at different reaction temperatures (140, 160, and 180 °C) were evaluated. The average size of synthesized fluorescent CDs decreased from 2.06 to 1.30 nm as reaction temperatures increased from 140 to 180 °C. The fluorescence quantum yield of CDs could reach up to 15.20%. The surface of CDs was rich in functional groups such as -OH, -NH2, and -COOH, providing CDs with good water solubility and biocompatibility. Furthermore, the mussel-derived CDs have been successfully applied in bio-imaging for onion endothelium cells, HepG2 cells, and zebrafish. In addition, CDs could be employed as a biosensor for riboflavin detection. Therefore, mussels are a promising carbon resource for preparing N-doped CDs for bio-imaging and monitoring riboflavin.

1. Introduction

Carbon dots (CDs) are a kind of fluorescent carbon nanomaterial with a particle size of less than 10 nm [1]. They have been emerging as potential candidates for a variety of applications such as bio-imaging [2,3], sensors [4], and detection [5], owing to their superior properties, including good water solubility, excellent biocompatibility, chemical inertness, low cytotoxicity, easy functionalization, and anti-photobleaching [6]. Considering these outstanding properties and extensive applications, researchers have paid more attention to the fabrication of CDs.
In recent years, the preparation of CDs has been developed involving “top-down” and “bottom-up” methods [7], including chemical oxidation [8], microwave-assisted synthesis [9], laser irradiation [10], and so on. Due to the complicated equipment, low yield, and expensive raw materials required for preparing CDs, a green and convenient method of producing CDs is urgently needed. Among these methods, hydrothermal synthesis is an ideal approach, as it is simple, low cost, green, and produces a high fluorescence quantum yield [11,12]. Noteworthily, natural biomass is composed of biological macromolecules such as carbohydrates, proteins, and lipids, and contains elements such as nitrogen and sulfur, which could improve the fluorescence quantum yield of CDs without additional surface modifications [11,12,13]. Therefore, biomass including sweet lemon peels [13], mushrooms [14] durian shells, crab shells [15], cynostemma [16], carrots [17], etc., have been selected as precursors for preparing CDs via hydrothermal carbonization. The development of new biomass as a carbon source to produce CDs has received increasing attention [7].
Mussels are naturally inexpensive and rich in nutrients, which consist of proteins (58.7%), carbohydrates (22.5%), and lipids (7%). China has the highest production of mussels in the world, with an annual production of more than 800,000 tons [18]. Abundant components such as carbon, nitrogen, and oxygen motivate us to employ mussels as carbon sources to form cost-effective CDs with high quantum yields. Meanwhile, to the best of our knowledge, mussels have not been previously used to synthesize CDs.
In the current study, a facile, green, and low-cost method to prepare CDs derived from mussels is presented. The morphology properties, chemical composition, fluorescence properties, and stability of CDs formed at different reaction temperatures were investigated. Additionally, these fluorescent CDs were successfully applied to onion epidermal cells, HepG2 cells, and zebrafish for bio-imaging in vitro and vivo. Furthermore, mussels-derived CDs provided accurate detection of riboflavin.

2. Materials and Methods

2.1. Materials and Chemicals

Mussels were obtained from Xinshijie Supermarket (Yantai, China). HepG2 was supplied by China Center for Type Culture Collection in Wuhan, China. AB strain zebrafish (Danio rerio) were purchased from the Northern Center of the National Zebrafish Model Animals. High-glucose Dulbecco’s Modified Eagle’s Medium (DMEM) was supplied by GIBCO (Grand Island, NY, USA). All other chemicals and reagents were of analytical grade, bought from commercial companies unless otherwise stated.

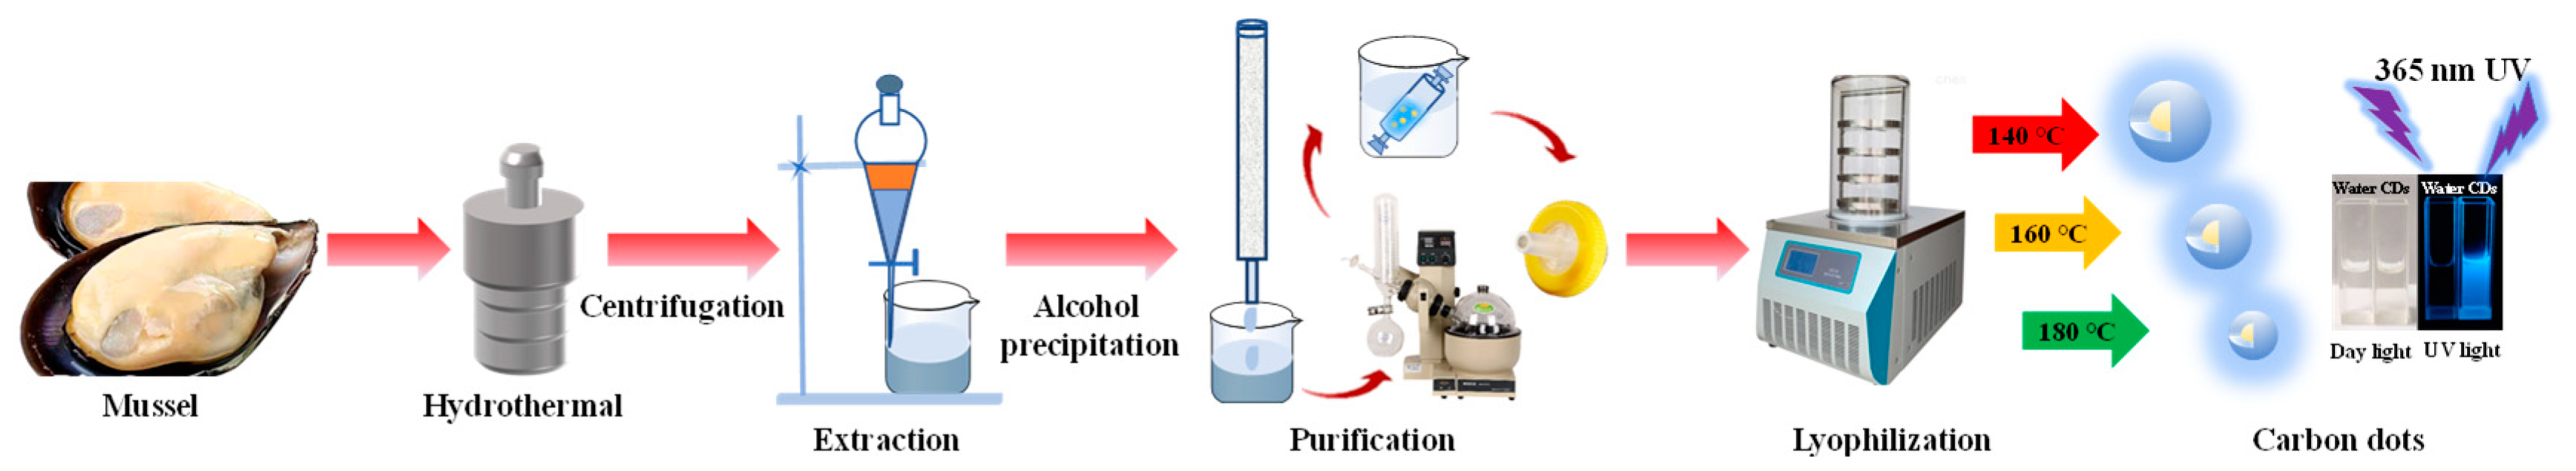
2.2. Synthesis of Mussels-Derived CDs

Fresh mussel meat was washed with deionized water, homogenized, and freeze-dried for 24 h to obtain mussel powder. Then, 3 g of processed sample were added into 15 mL of deionized water and put in a polytetrafluoroethylene-lined hydrothermal synthesis kettle heated at 140, 160, and 180 °C for 8 h, respectively. After cooling to room temperature, the mixture was centrifuged (10,000 rpm, 10 min), and the supernatant was leached using ethyl acetate to remove oil phase. Subsequently, 4-folds absolute ethanol was added to the aqueous phase and placed at 4 °C for 24 h, then they were centrifuged (6000 rpm, 10 min, 4 °C) to remove polysaccharides. The supernatant was concentrated and purified with a D101 macroporous adsorption resin column using deionized water as an eluent by collecting the fluorescence fractions. The aqueous solution was concentrated followed by being dialyzed against distilled water with a membrane of the molecular weight of cutoff 500 Da for 24 h. Finally, the solution in the dialysis bag was filtrated with a 0.22 μm filtration membrane and lyophilized to obtain CD powder for future use. For the sake of description, CDs prepared at 140, 160, and 180 °C were named as 140-CDs, 160-CDs, and 180-CDs, respectively. Based on the dry weight of mussels, the yields of 140-CDs, 160-CDs, and 180-CDs were calculated to be 0.20%, 0.25%, and 0.56%, respectively.

2.3. Structural and Optical Characterizations of CDs

A transmission electron microscope (TEM, JEM-2100, JEOL, Tokyo, Japan) with an accelerating voltage of 200 kV was used to capture TEM images. Fourier-transform infrared spectroscopy (FT-IR, Frontier, PerkinElmer, Norwalk, CT, USA) was utilized to determine surface functional groups. Aromatic π-system analysis was conducted by UV-vis absorption spectrophotometer (TU-1900, Persee, Beijing, China). CDs crystallinity was studied using X-ray diffraction (XRD-6100, Shimadzu, Kyoto, Japan). X-ray photoelectron spectrometer (XPS, ESCALAB 250, Thermo VG, Waltham, MA, USA) was used to investigate elemental analysis.
Fluorescence spectroscopy was analyzed by a fluorescence spectrophotometer (RF-6000, Shimadzu, Kyoto, Japan). The fluorescence quantum yields [19] and time-resolved fluorescence spectra of CDs were determined according to previous studies [20].

2.4. Cytotoxicity and Bio-Imaging of CDs

An MTT assay was performed to analyze the cytotoxicity of 180-CDs at different concentrations (0, 0.375, 0.75, 1.5, 3, and 6 mg/mL) against HepG2 cells for 24 h [21].
Onion epidermal cells were chosen to investigate bio-imaging of CDs in plant cells. Briefly, a piece of onion epidermal membrane was soaked in 1.5 mg/mL of 180-CDs solution for 10 min, followed by being washed three times with saline. Then, a fluorescence microscope (DMi8, Leica, Wetzlar, Germany) with a 425 nm excitation wavelength was used to capture the images.
HepG2 cells are used in cell imaging. Briefly, HepG2 cells were incubated with 180-CDs for 24 h at 37 °C in a 5% CO2 incubator. After that, the cells were washed three times with phosphate buffer solution (PBS) and stored in PBS for optical imaging. The images were captured using a fluorescence inverted microscope (DMi8, Leica, Wetzlar, Germany) with a 425 nm excitation wavelength [22].
Zebrafish is transparent and served as an ideal model to evaluate the in vivo bio-imaging of CDs. Zebrafish larvae at 4 d were incubated in 1.5 mg/mL of 180-CDs solution and E3 medium without other substances as a control group for 48 h. An inverted microscope (DMi8, Leica, Wetzlar, Germany) with an excitation wavelength of 425 nm was used to observe the image.

2.5. Fluorescence Detection of Riboflavin by CDs

Briefly, different concentrations of riboflavin were added to CDs solution (0.075 mg/mL) within a Britton–Robinson buffer solution (BR, 200 mmol/L, pH 2.0), followed by reacting at room temperature for 10 min. Subsequently, the fluorescence spectrum of the mixture was measured, and fluorescence intensities at 537 nm and 437 nm were denoted as I537 nm and I437 nm, respectively. Milk powder and riboflavin pharmaceutical tablets were chosen as the real sample. The pretreatment of actual samples was referred to in previous literature [23].

3. Results

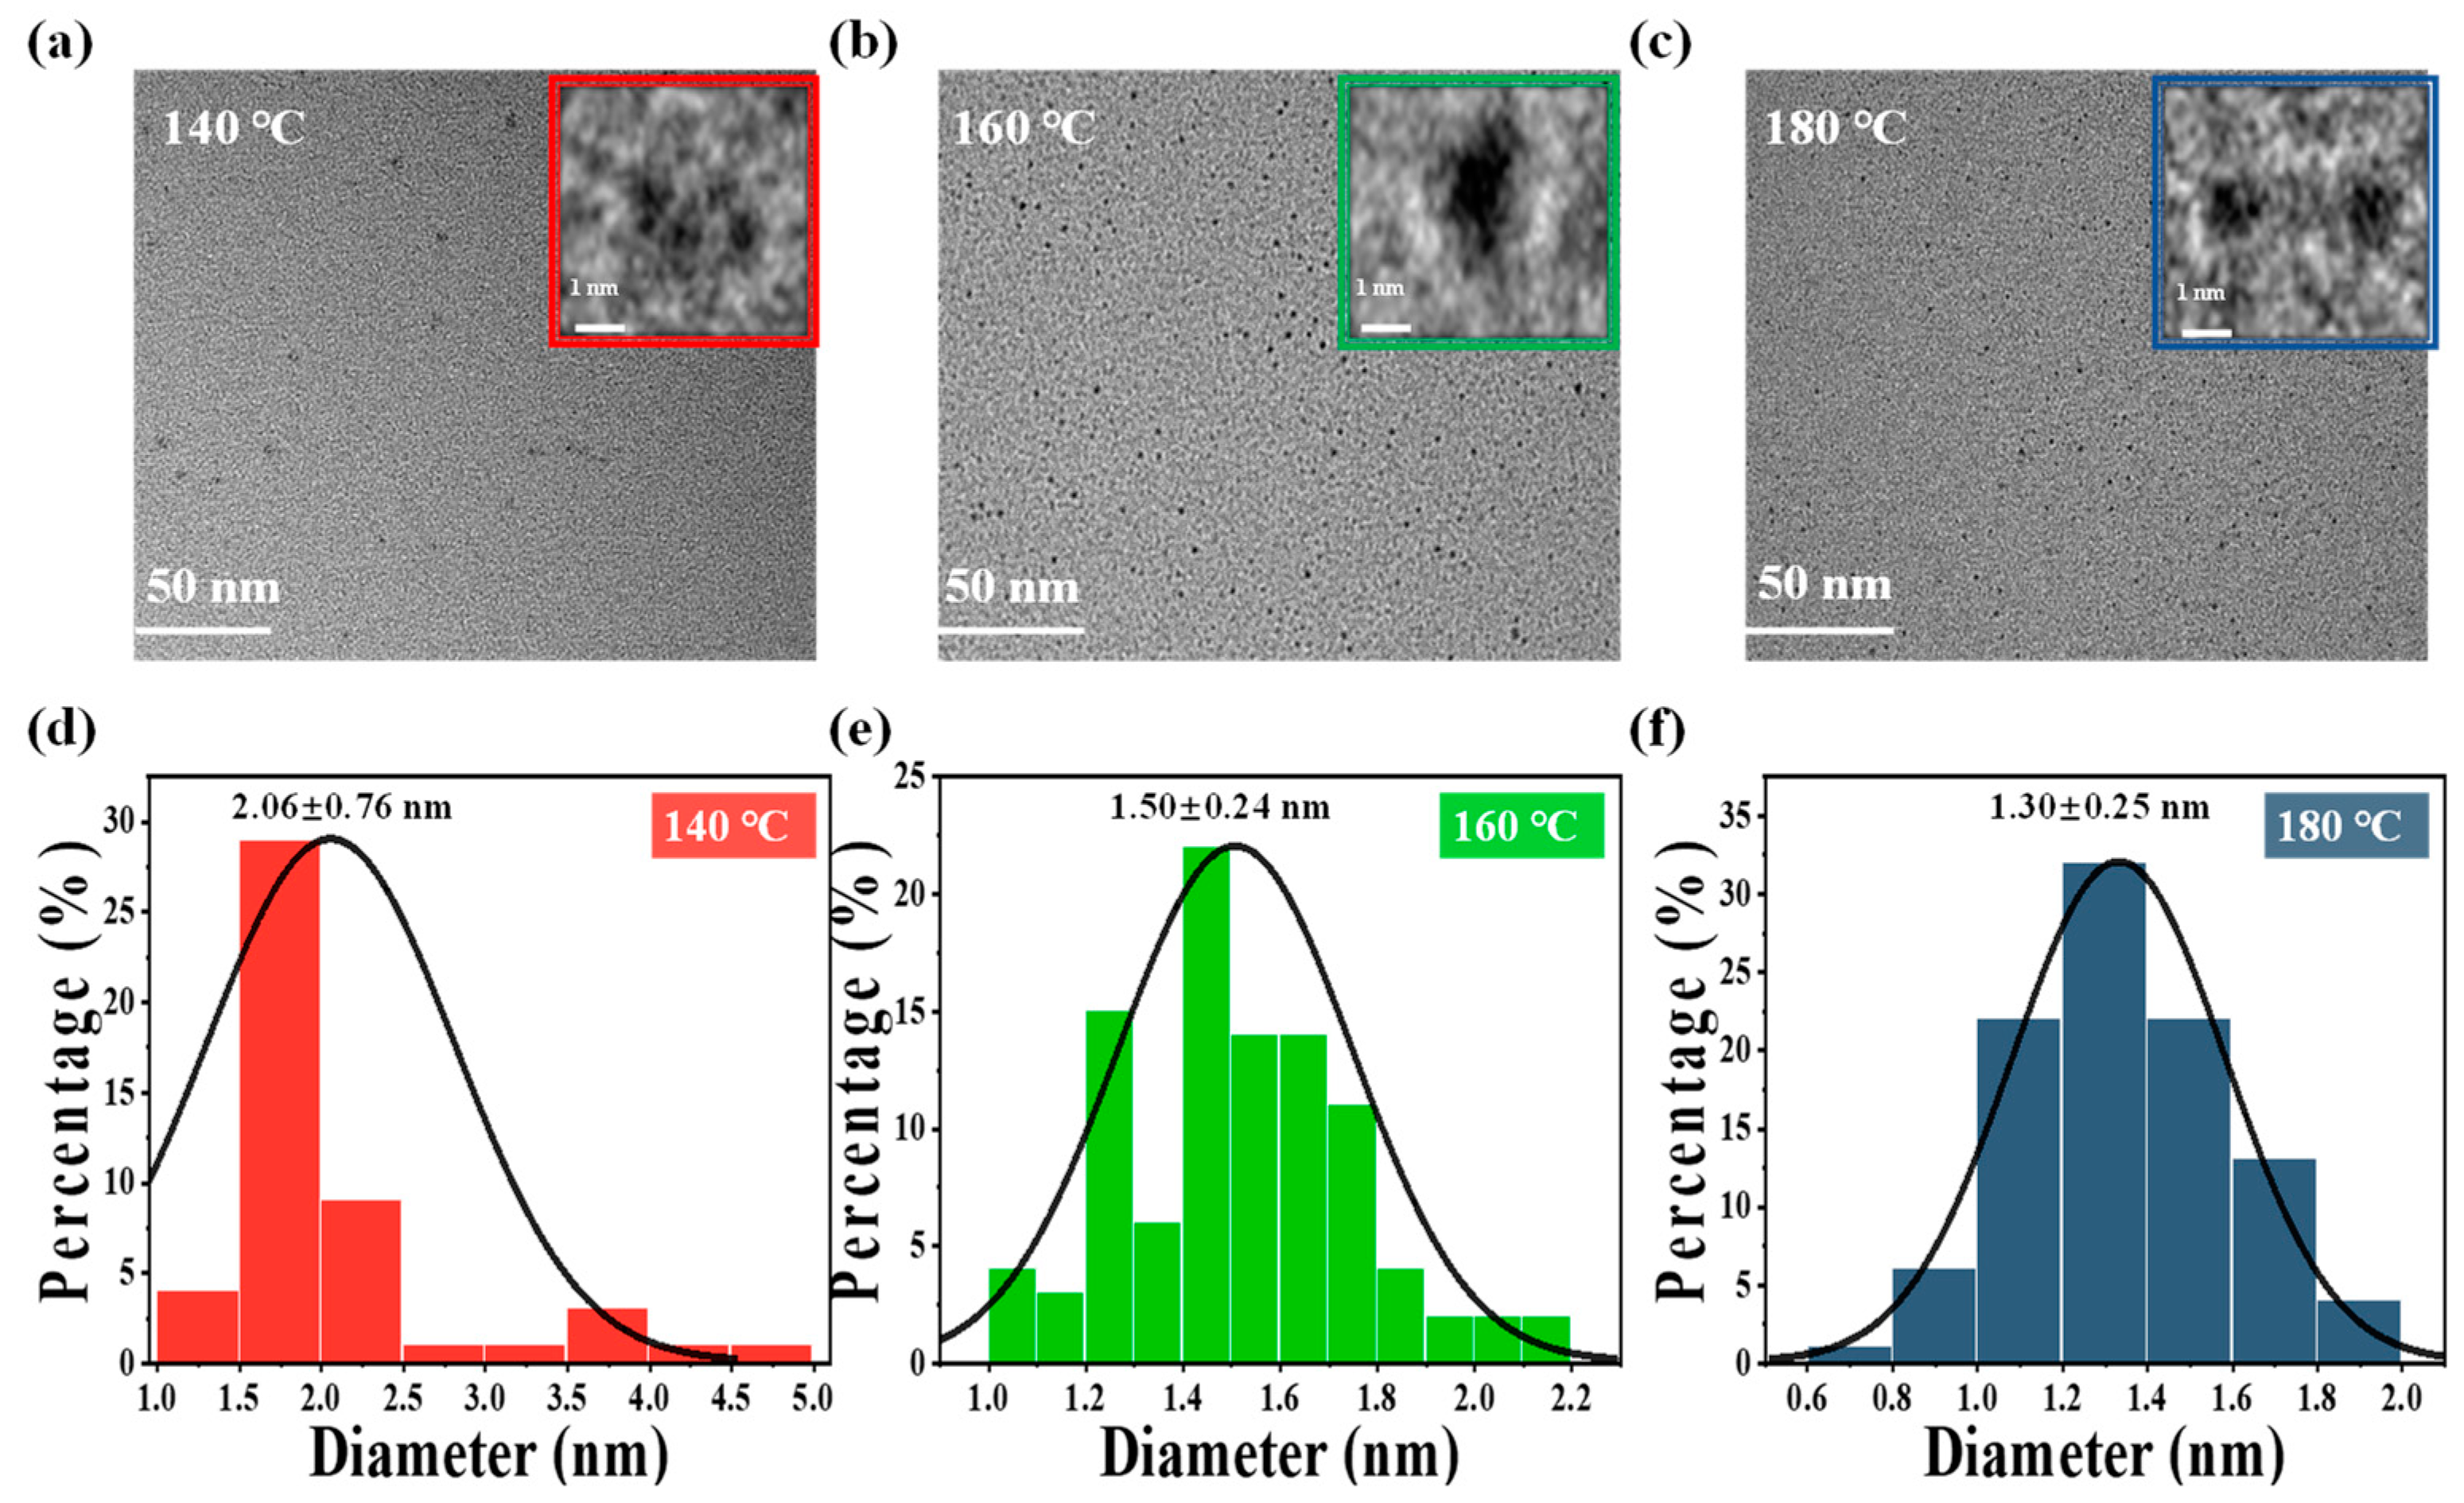
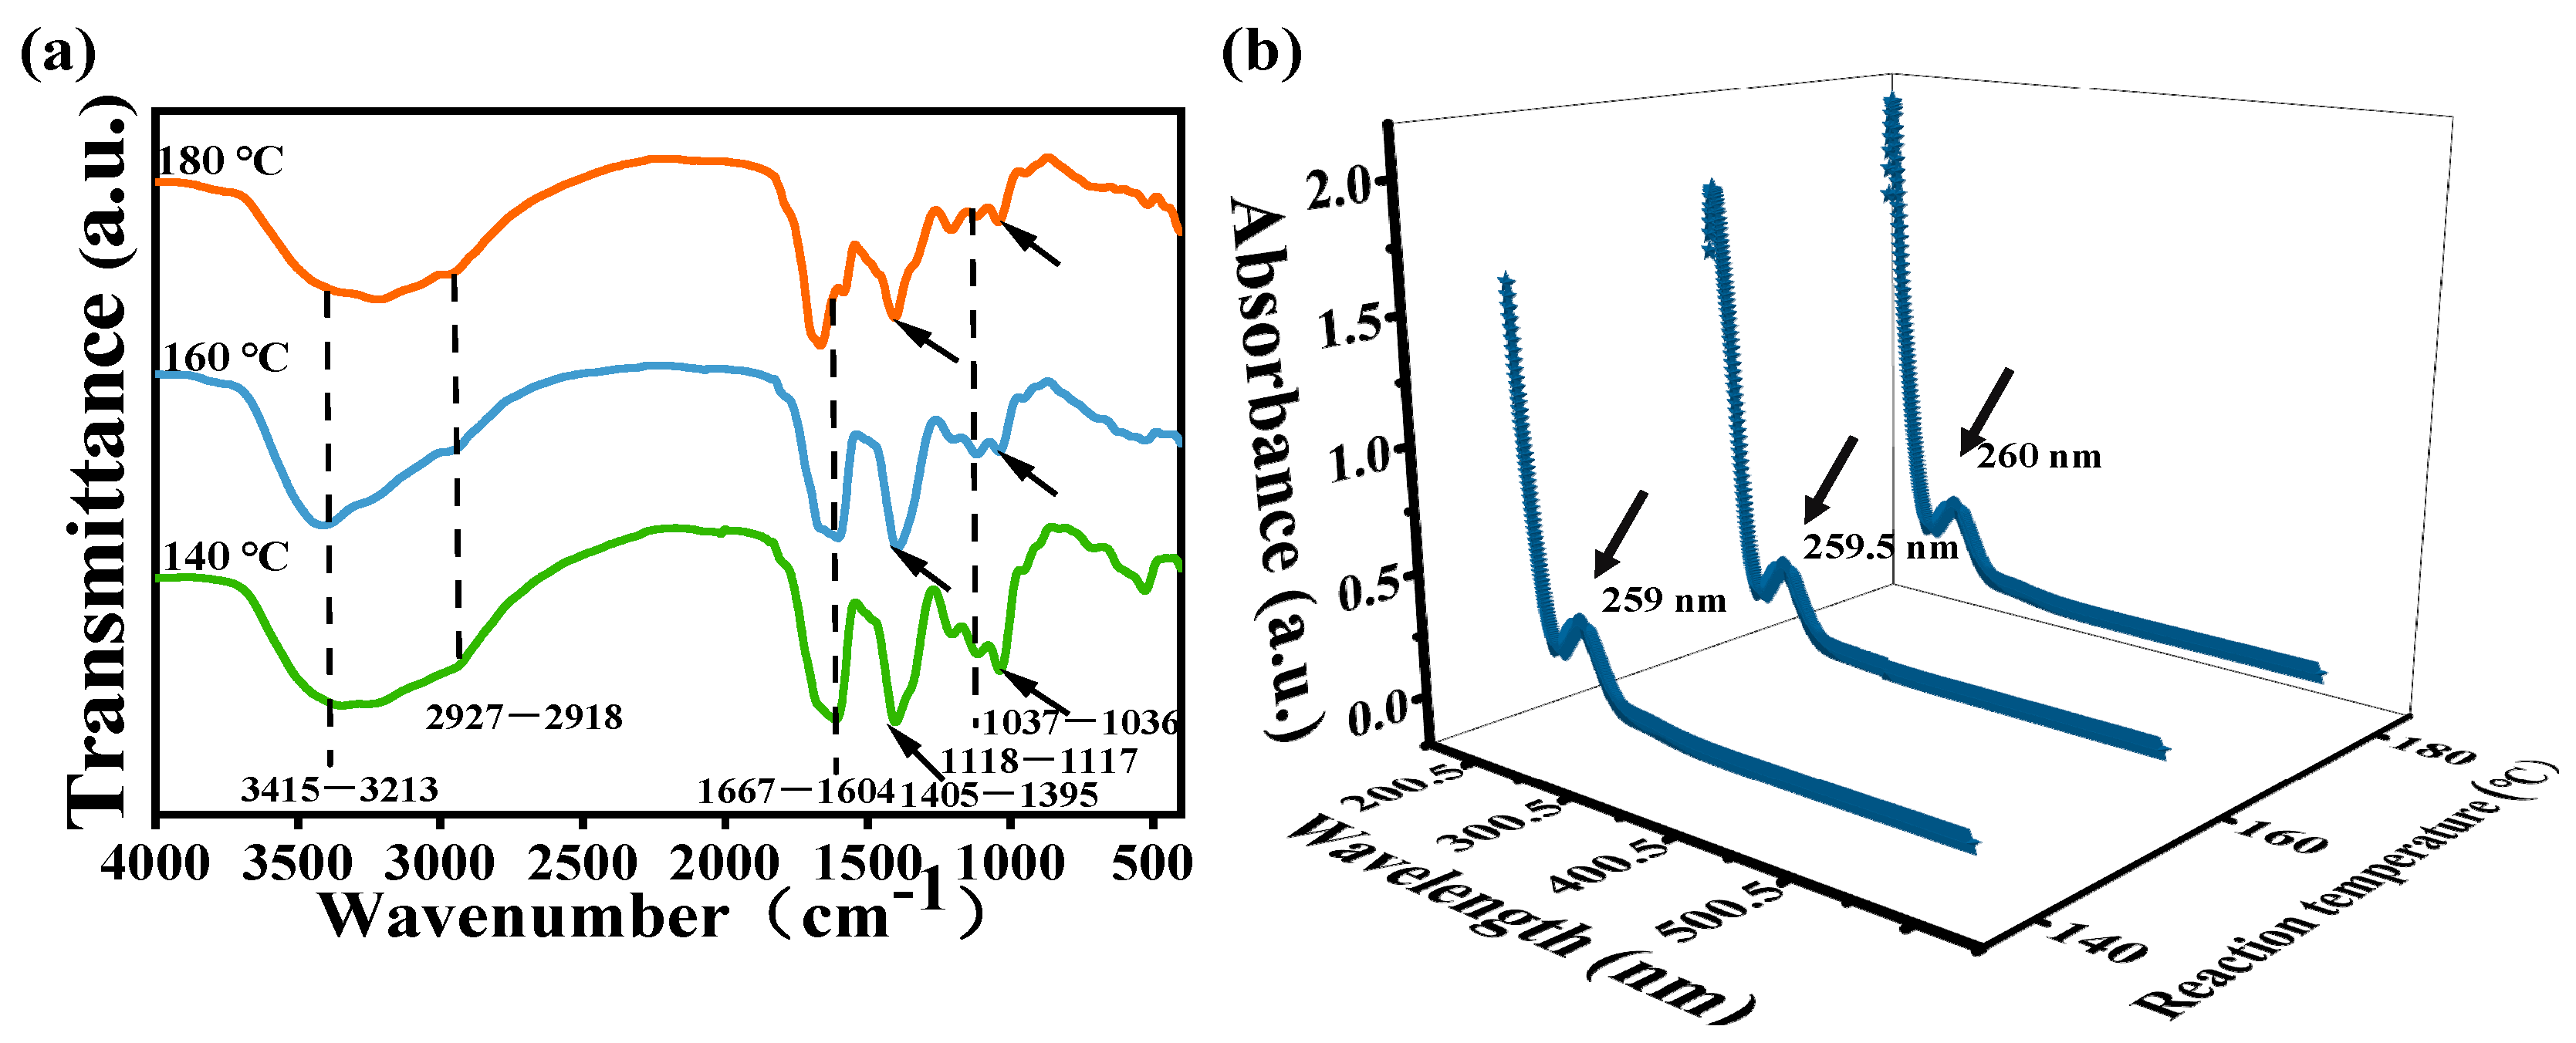
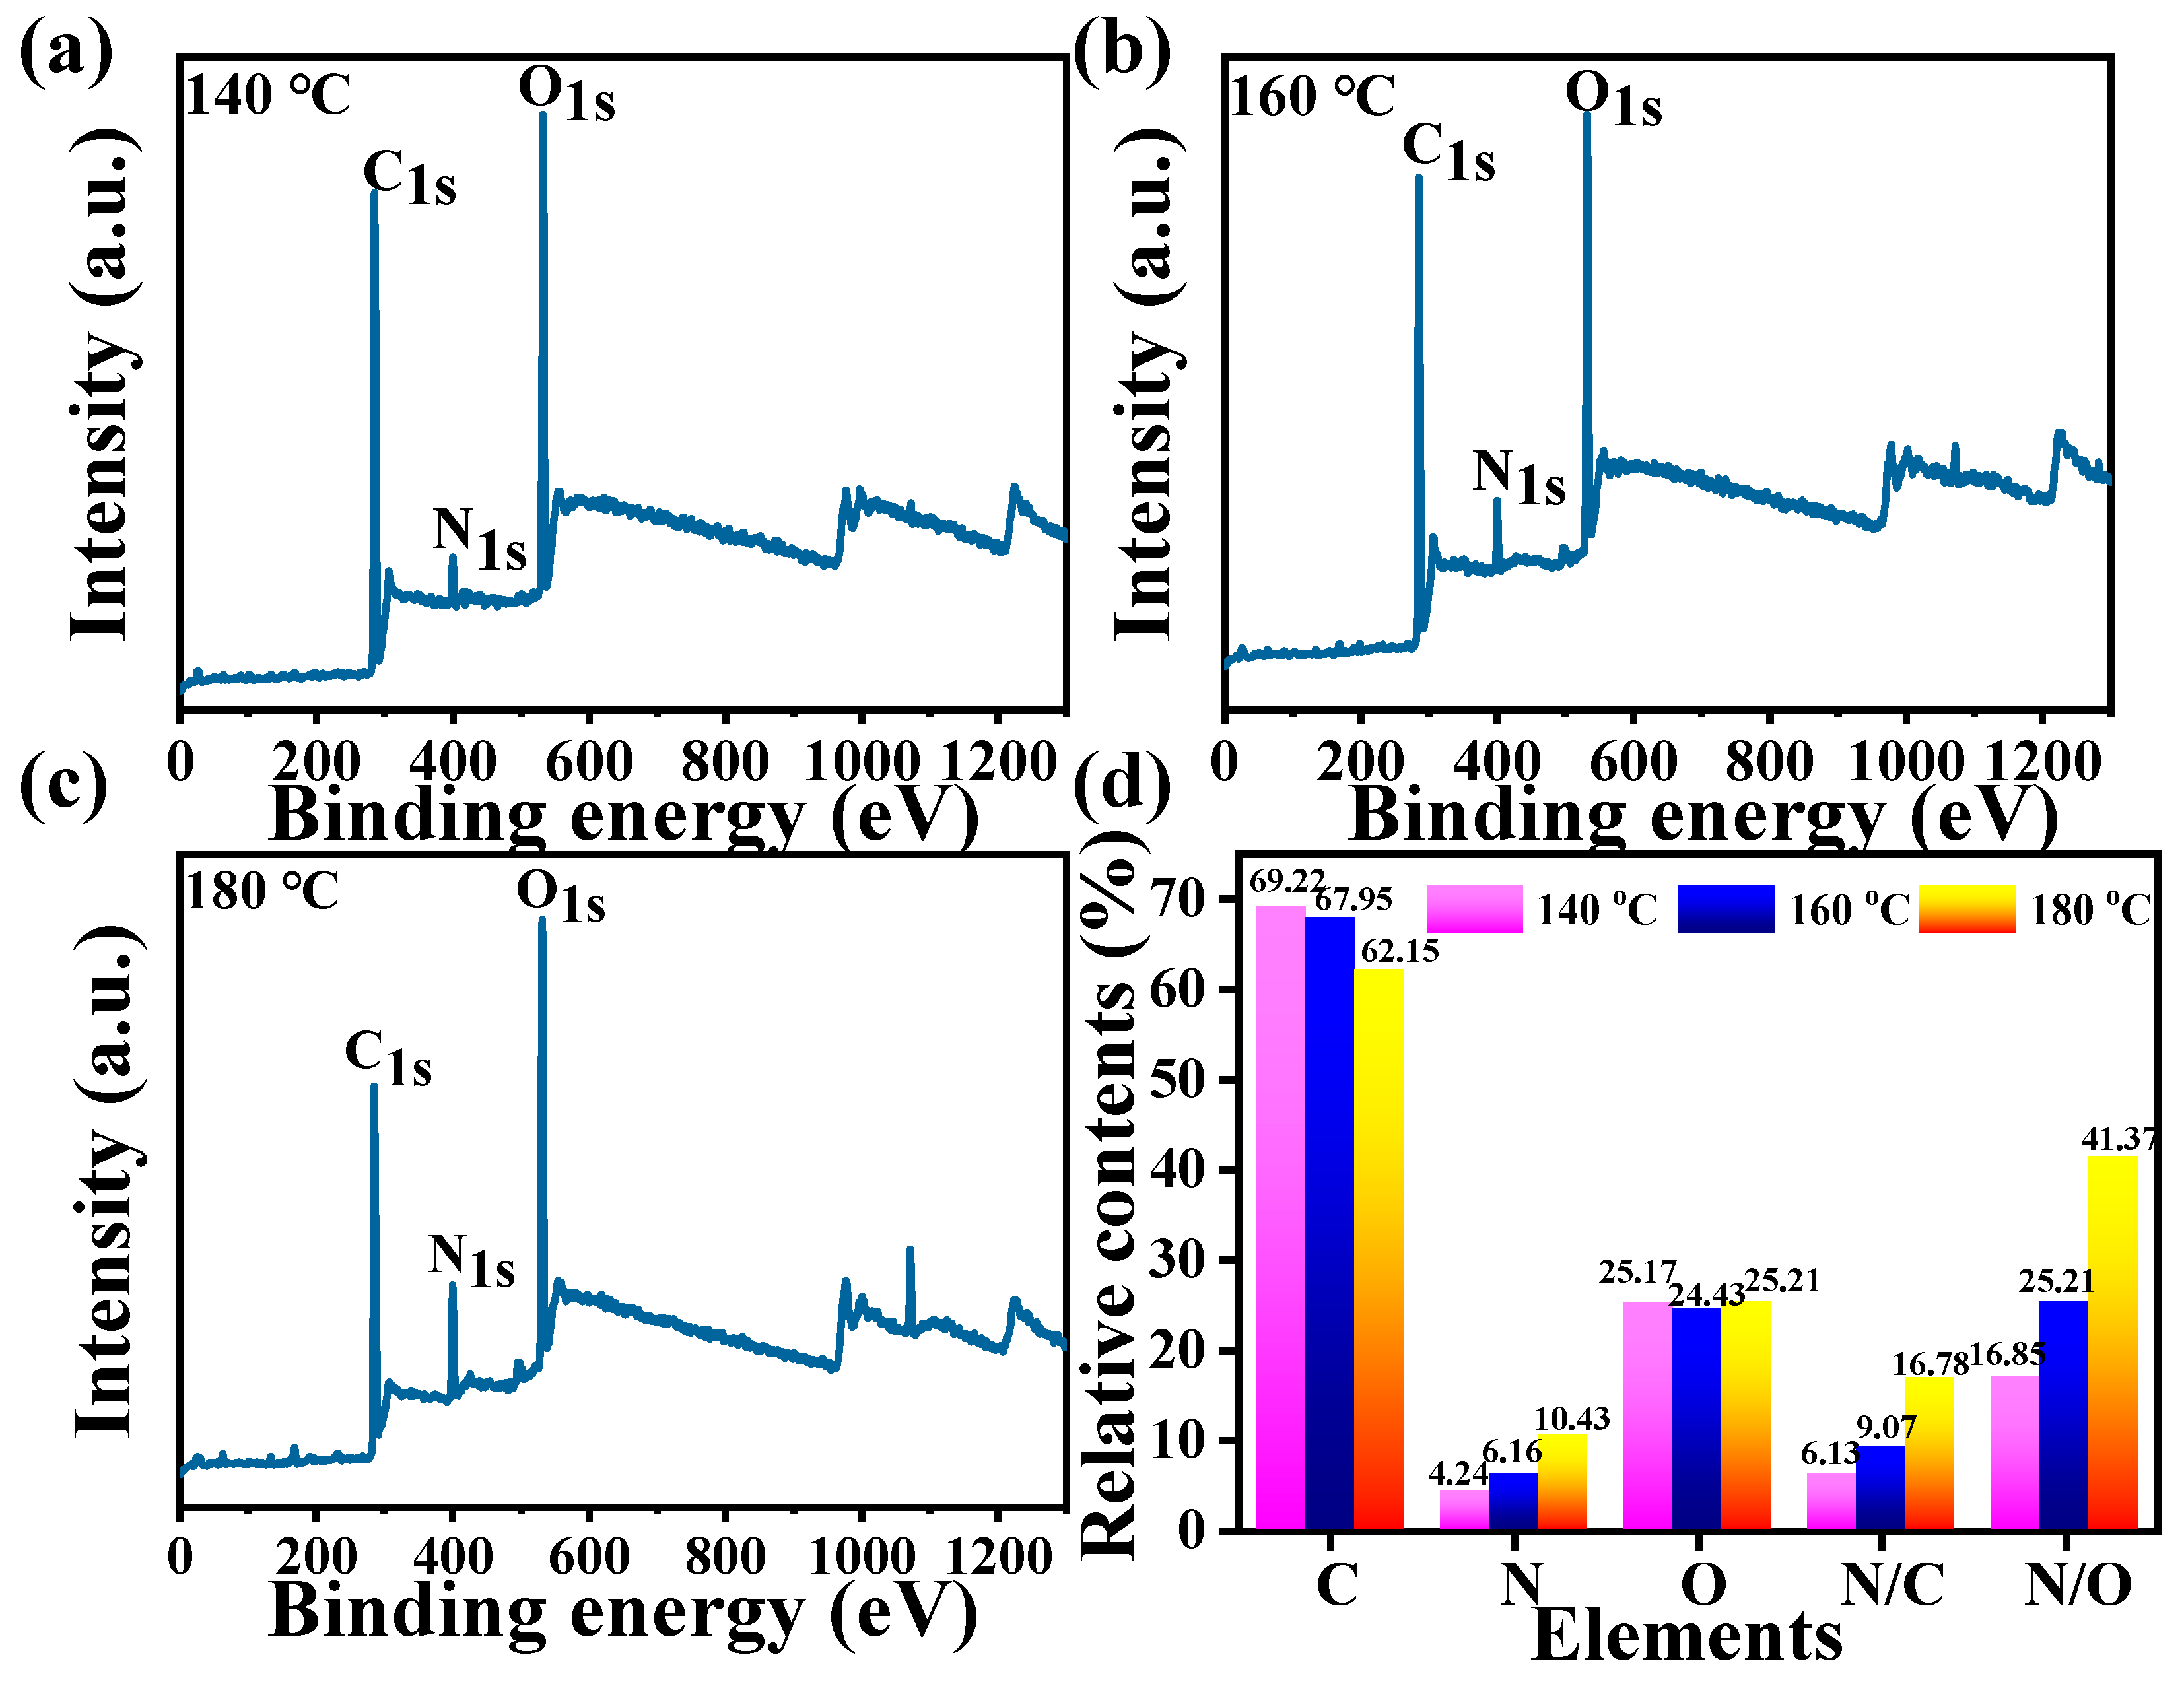
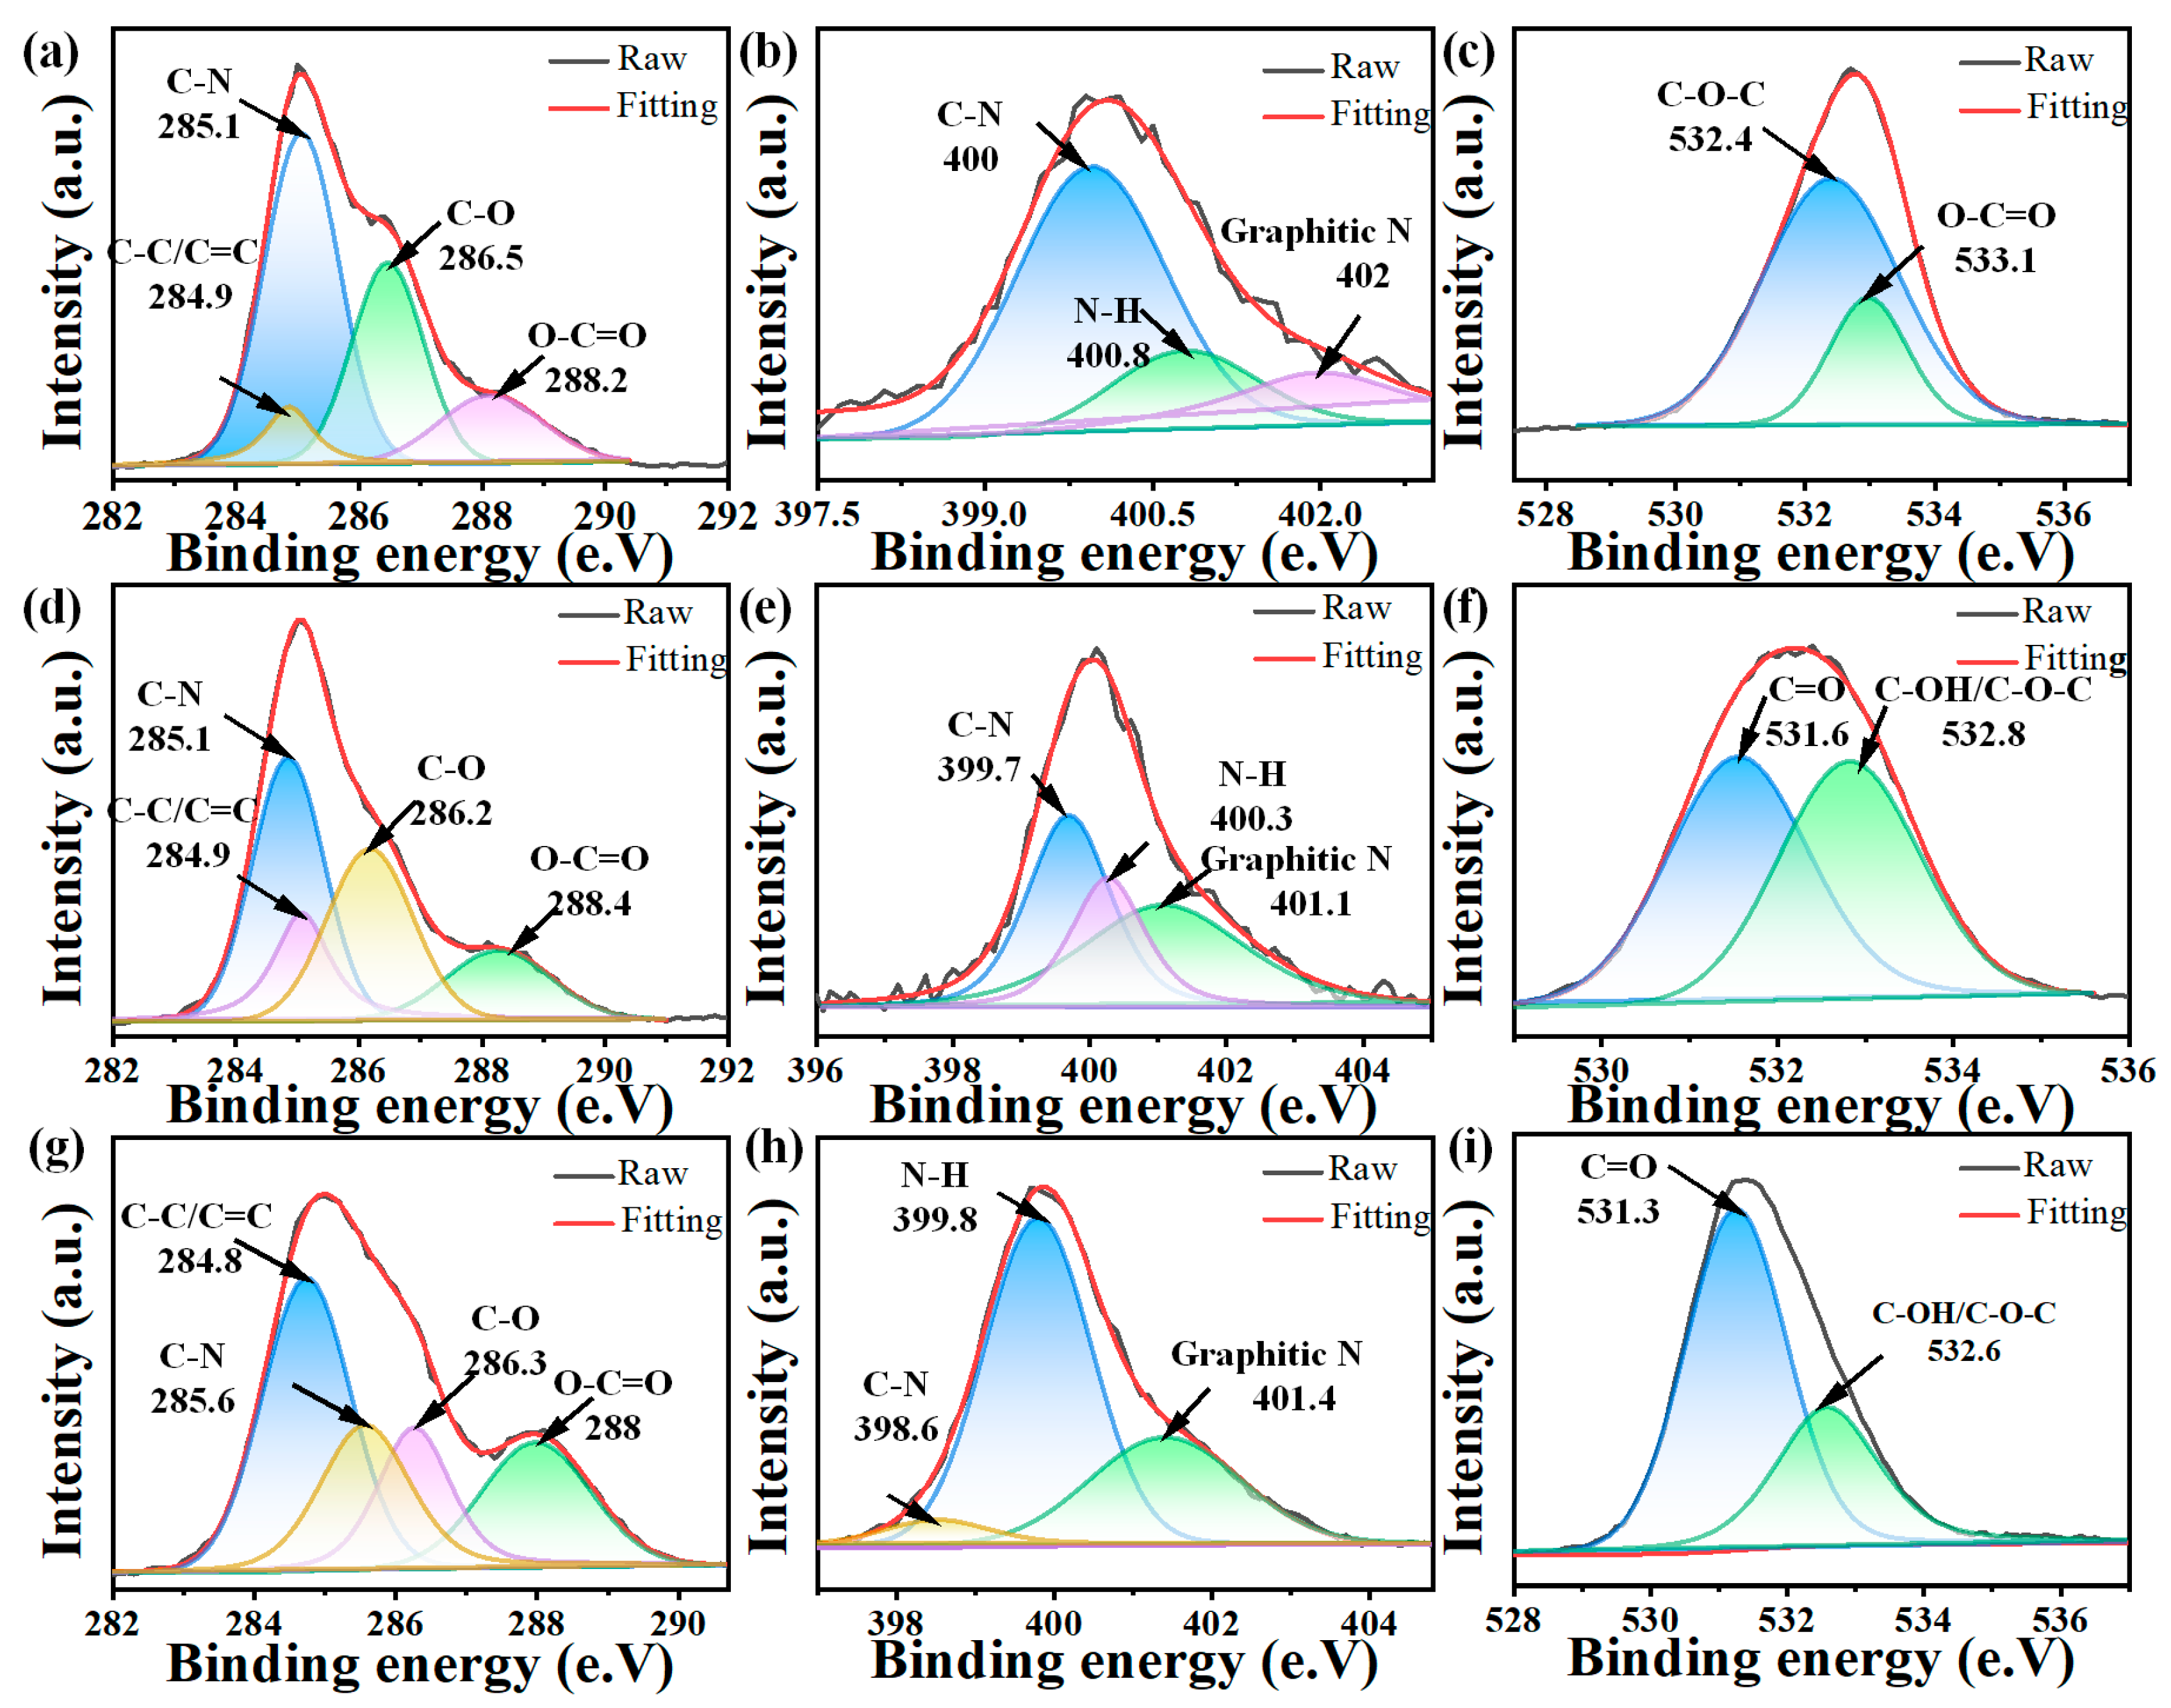
3.1. Synthesis and Structural Characterizations of CDs

The fabrication of mussels-derived CDs is illustrated in Scheme 1. CDs were obtained using mussels as the carbon source through the hydrothermal synthesis process at 140, 160, and 180 °C for 8 h, respectively. TEM was applied to characterize the morphology of CDs (Figure 1), which indicated CDs were synthesized successfully and near-uniform spherical at different reaction temperatures. In addition, CDs prepared at 140 °C were slightly adhered to each other and aggregated, while CDs formed at higher temperatures were uniformly disperse (Figure 1a–c). It was observed that there was no significant crystal lattice in the CDs, even those prepared at 180 °C (Figure 1a–c insets). XRD patterns of CDs also displayed broad diffraction peaks at 2θ = 22.75°, 26.11°, and 25.34° (Figure S1), respectively, indicating the amorphous structure of CDs [22]. Meanwhile, the histogram in Figure 1d–f shows that mean size of the particles formed at 140, 160, and 180 °C were 2.06 ± 0.76 nm, 1.50 ± 0.24 nm, and 1.30 ± 0.25 nm, respectively. The enhanced carbonization at high temperatures as well as the high-temperature breakdown of polysaccharides and proteins in the mussel could contribute to the decrease in particle size with increasing temperature.
Furthermore, the functional groups of mussels-derived CDs produced at various reaction temperatures were determined by FT-IR and XPS. As instanced in Figure 2a, the broad absorption at 3415–3213 cm−1 could be ascribed to stretching vibrations of O–H or N–H. Peaks at 2918–2927cm−1 were identified as C–H stretching vibration. The strong band at 1667–1604 cm−1 was attributed to amide bonds (O=C-NH) or C=C in CDs [24,25,26]. The absorption peaks at 1405–1395 cm−1 were probably due to the C=O group [27]. In addition, the small peak around 1118 cm−1 was caused by the vibration of C–N [26]. The C–O bond is represented by the band at 1037 cm−1, which corresponded to the fingerprint area. FITR revealed that the surface of mussels-derived CDs contained a high variety of groups including -OH, C=O, and -NH2. In addition, the UV–vis spectrum presented apparently a strong absorption peak at 259–260 nm, indicating the π–π* transition of the C=C bonds of sp2 clusters from CDs [28] (Figure 2b).
XPS was used to determine the content of elements and accurate chemical bonds of CDs. As shown by the XPS survey spectrum, three predominant peaks at 285, 400, and 532 eV are assigned to C1s, N1s, and O1s, respectively (Figure 3a–c). The relative contents of C ranged from 69.22% to 62.15%, and the N content significantly increased from 4.24% to 10.43%, whereas there was no obvious change in the oxygen content (Figure 3d). Notably, the ratio of N/C and N/O increased by more than two-fold as the reaction temperature rose from 140 to 180 °C. This might be because the high temperature led more proteins of the mussels to be denatured and participate in the fabrication of CDs, which agrees well with previous studies [21]. What is more, the high-resolution XPS spectroscopy of C1s of 140-CDs (Figure 4a) is represented by four peaks at 284.9, 285.1, 286.5, and 288.2 eV, which are linked to C=C or C–C, C=N, C=O, O=C-O, respectively [29]. The three peaks of N1s at 400, 400.8, and 402 eV were attributed to C–N, N–H, and graphitic N (Figure 4b) [30]. Similarly, the same peaks or functional groups were present in the high-resolution spectra of C1s and N1s of 160-CDs and 180-CDs (Figure 4d,e,g,h). The O1s spectrum of 140-CDs was deconvoluted into two peaks at 532.4 and 533.1 eV, which were imputed to C–O–C and C–OH or O=C-O, respectively (Figure 4c). Nevertheless, O1s in 160-CDs and 180-CDs exhibited different binding energy peaks from 140-CDs. The two peaks were determined at 531.6 and 532.8 eV in 160-CDs while the peaks were 531.3 and 532.6 eV in 180-CDs, which corresponds to C=O and C–O/C–O–C [28]. The various chemical environments of O suggested that high temperatures decomposed macromolecules and created new chemical bonds in nanoparticles.

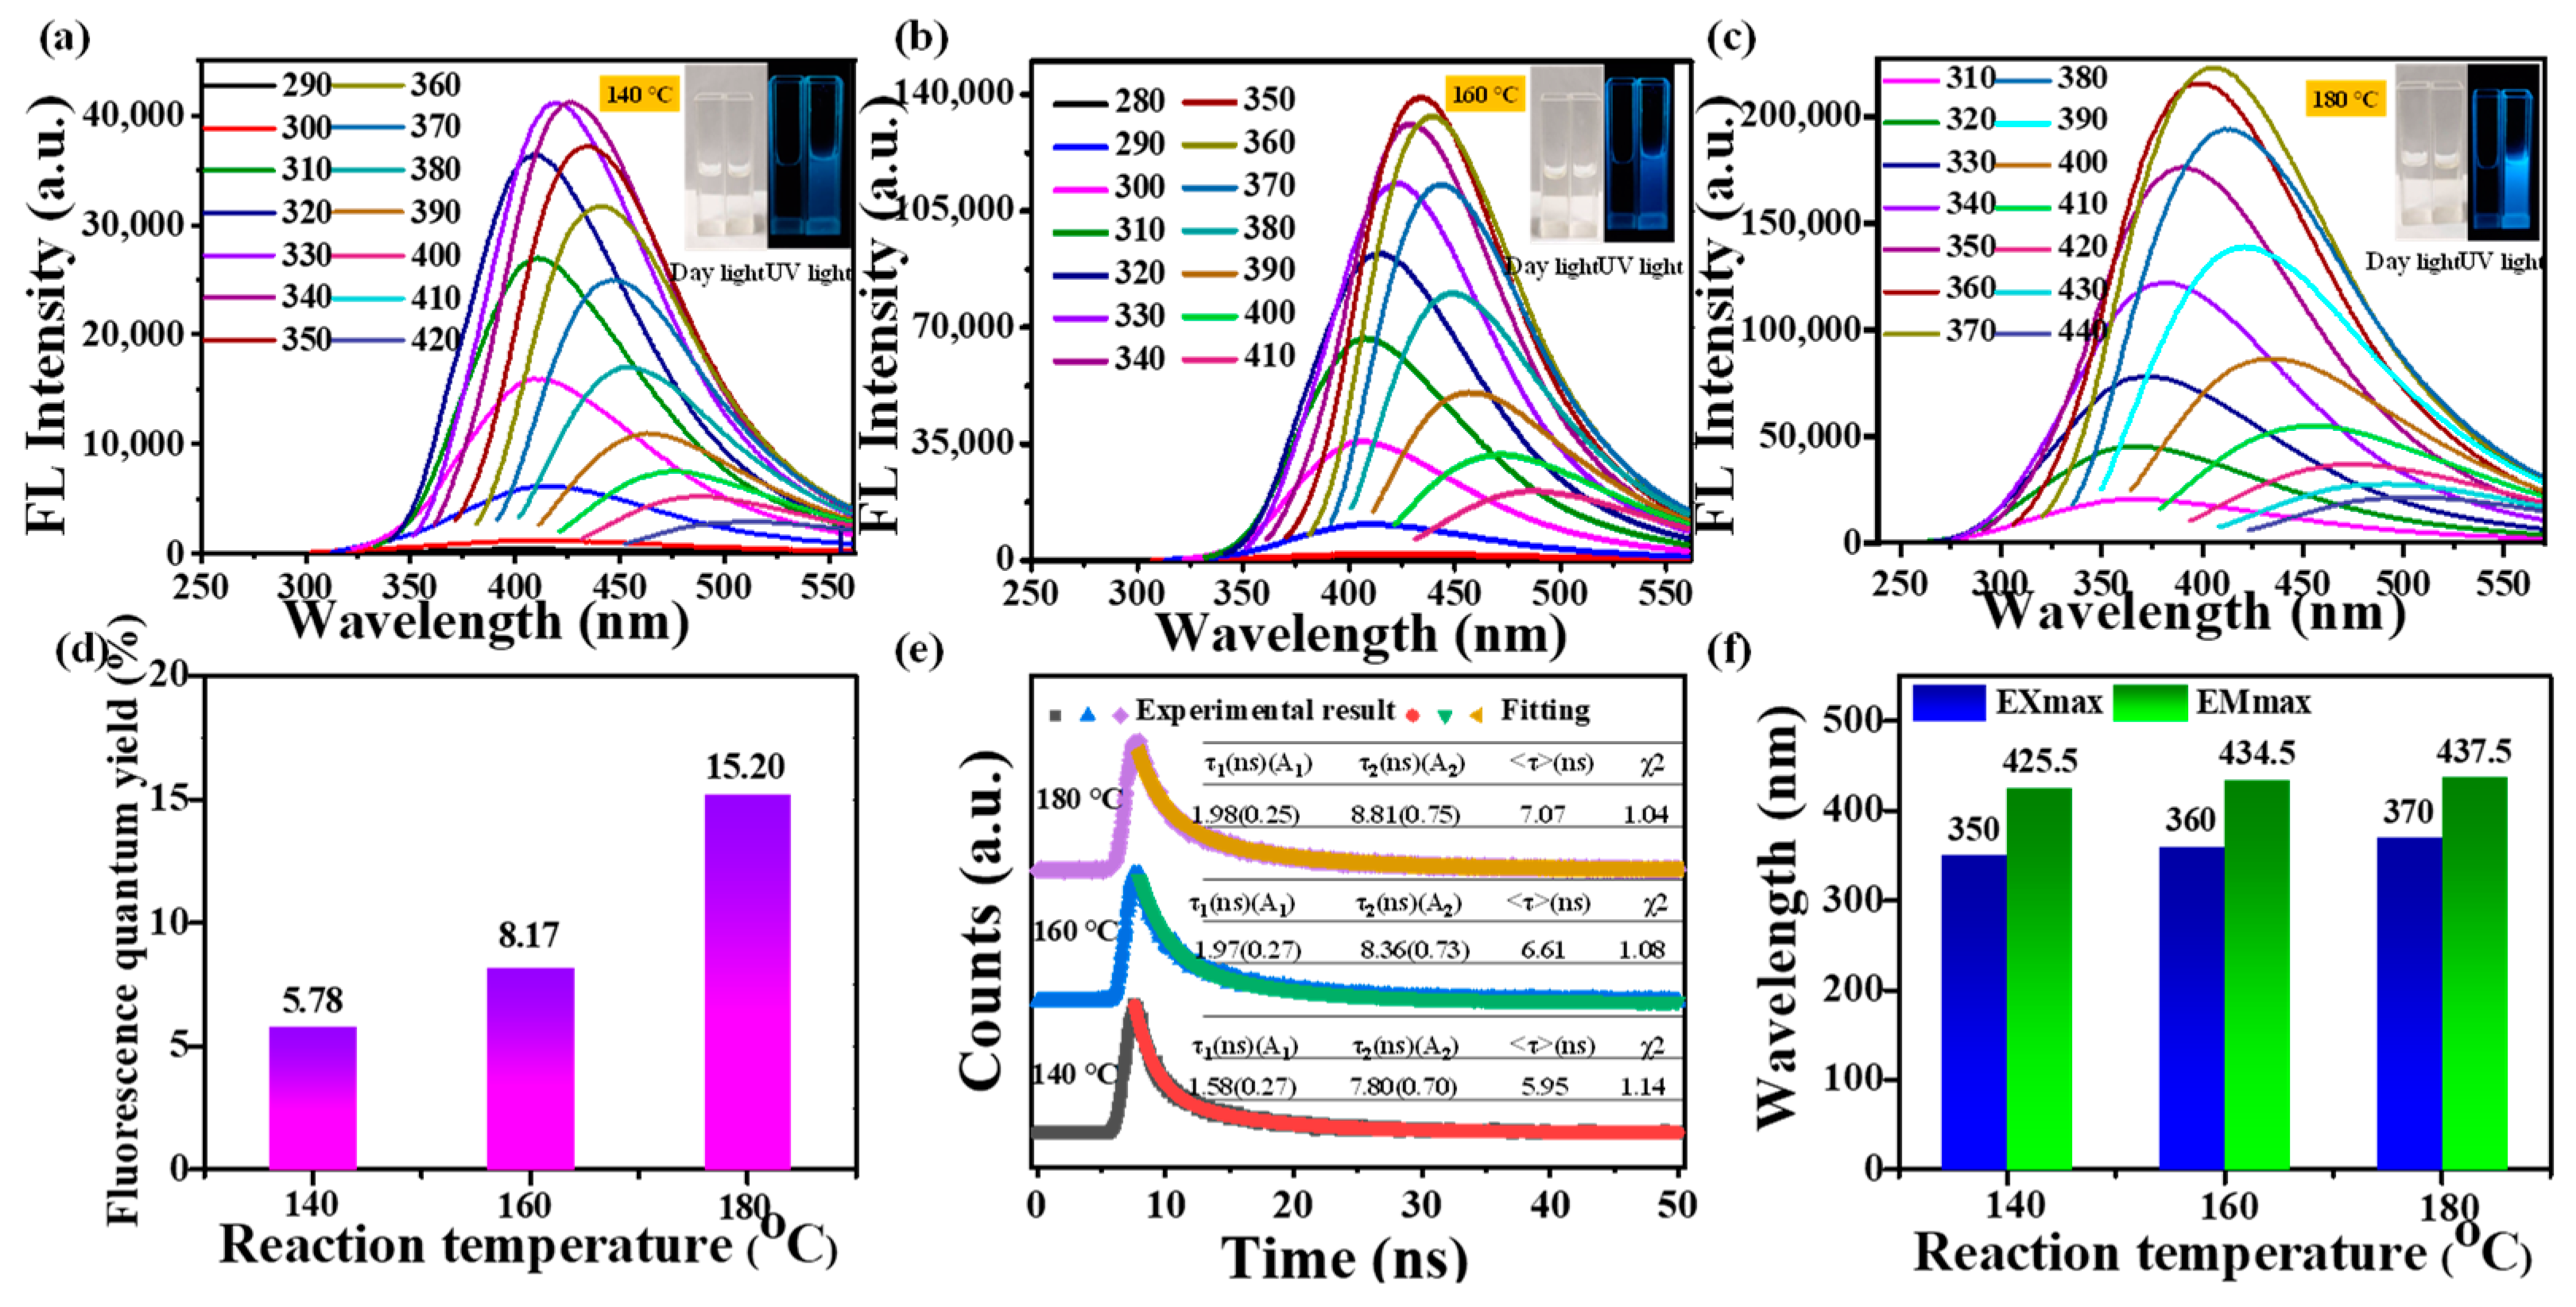
3.2. Optical Characteristics of CDs

The optical characteristics of CDs play a critical role in their bio-imaging application [30]. As seen from insets in Figure 5a, the aqueous solution of CDs (1 mg/mL) is transparent and almost colorless under daylight. The great water solubility of mussels-derived CDs is due to the presence of -OH, -C=O, and -NH2. In addition, CDs emitted blue fluorescence by a handheld laser lamp (365 nm), and CDs formed at higher reaction temperatures emitted stronger blue fluorescence at the same concentration. The fluorescence spectra of CDs presented a red shift of the emission wavelength with the increasing excitation wavelength (Figure 5a). The excitation-wavelength-dependent behavior could arise from diverse particle sizes or the existence of various emissive traps on the mussels-derived CDs’ surfaces [16]. As the reaction temperature increased, there was an obvious increase in the maximum excitation wavelength of mussels-derived CDs ranging from 350 to 370 nm, followed by maximum emission wavelengths changing from 425.5 to 437.5 nm (Figure 5b). This phenomenon is consistent with the reported results [21,31].
In addition, the average lifetime of CDs prepared at 140, 160, and 180 °C were measured to be 5.94, 6.61, and 7.07 ns, respectively, with fitted value χ2 < 1.2 (Figure 5c). The fluorescence lifetime was a reflection of the time it takes for the molecule to absorb energy and then return to the ground state [32]. The above results clearly confirm that the excited state of CDs was more stable along with the reaction temperature increasing. To confirm the differences in fluorescence intensity, the fluorescence quantum yield of mussels-derived CDs was evaluated using quinine sulfate as the standard substance (Figure S2). It was calculated that the fluorescence quantum yields of 140-CDs, 160-CDs, and 180-CDs were 5.78%, 8.17%, and 15.2%, respectively, consistent with the change in the CDs’ nitrogen content (Figure 5d). These phenomena indicated that more N in mussels was involved in the formation of CDs with the increasing reaction temperature, which was helpful to improve the fluorescence properties of CDs. This argument gains support from other natural biomass-derived CDs [33,34]. These observations further indicate reaction temperature is a key factor in the structural characteristics and optical properties of CDs formed by hydrothermal synthesis method.

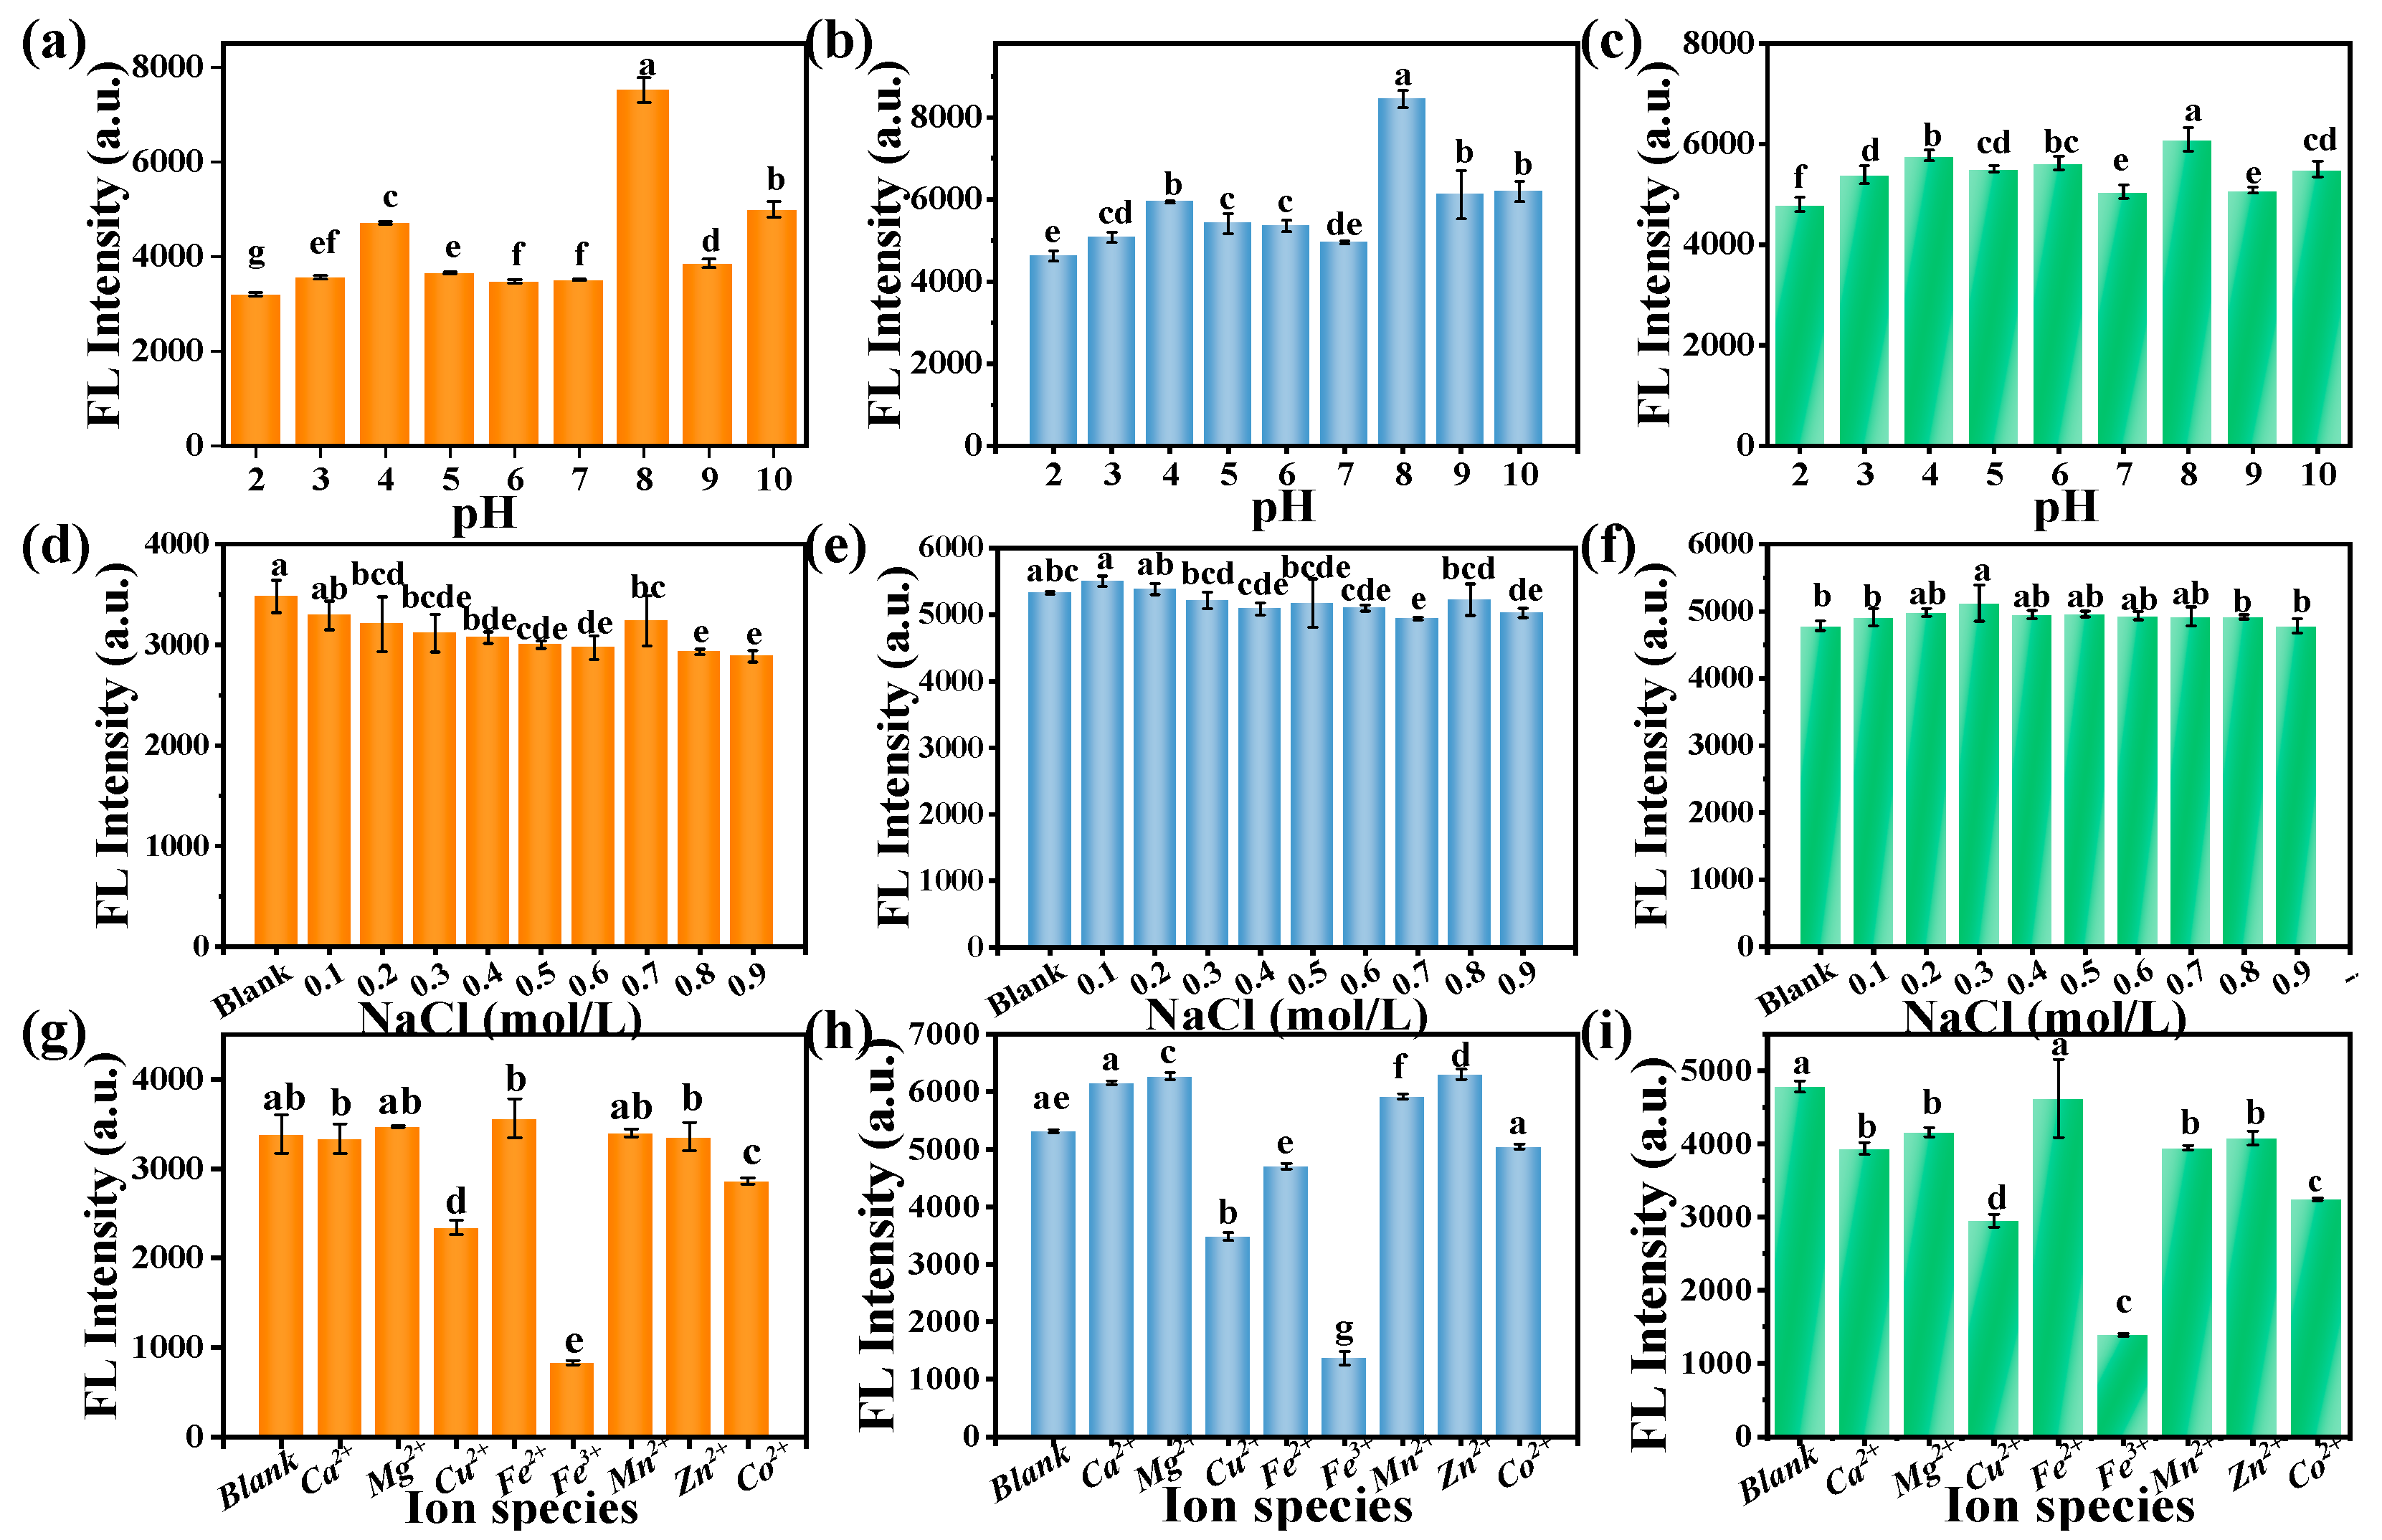
3.3. Fluorescence Stability of Mussels-Derived CDs

In order to employ CDs for fluorescent probing, the fluorescence stability of CDs is a crucial prerequisite. Therefore, the effect of pH, NaCl concentration, and various metal ions on the CD fluorescence intensity was researched to evaluate the stability of mussels-derived CDs prepared at different reaction temperature (Figure 6). As illustrated in Figure 6a–c, the fluorescence intensity of CD solutions was sensitive to pH, the highest sensitivity occurring at pH = 8. The change in fluorescence behavior of CDs could be caused by the protonation as well as the deprotonation of functional groups (-OH, -NH2, and -COOH) on the surface of CDs [35]. Moreover, fluorescence intensity of 140-CDs dropped with the increasing concentrations of NaCl (Figure 6d) while there was no significant change in fluorescence intensity for 160-CDs or 180-CDs under different NaCl concentrations (Figure 6e,f). As for the effect of metal ions, it was worth noting that Cu2+ and Fe3+ had quenched the fluorescence intensity of mussels-derived CDs significantly. This could be attributed to the interaction between -NH2/-COO- on the surface of CDs and Fe3+ leading to the intense fluorescence quenching. The effect of Cu2+ quenching might be due to non-radiative electron transfer from the excited state of the Cu2+ electric orbital at the carbon site [36]. Consequently, all mussels-derived CDs have potential application as fluorescence sensors to quantitatively detect Fe3+, Cu2+ [37], and other components which could change their fluorescence.

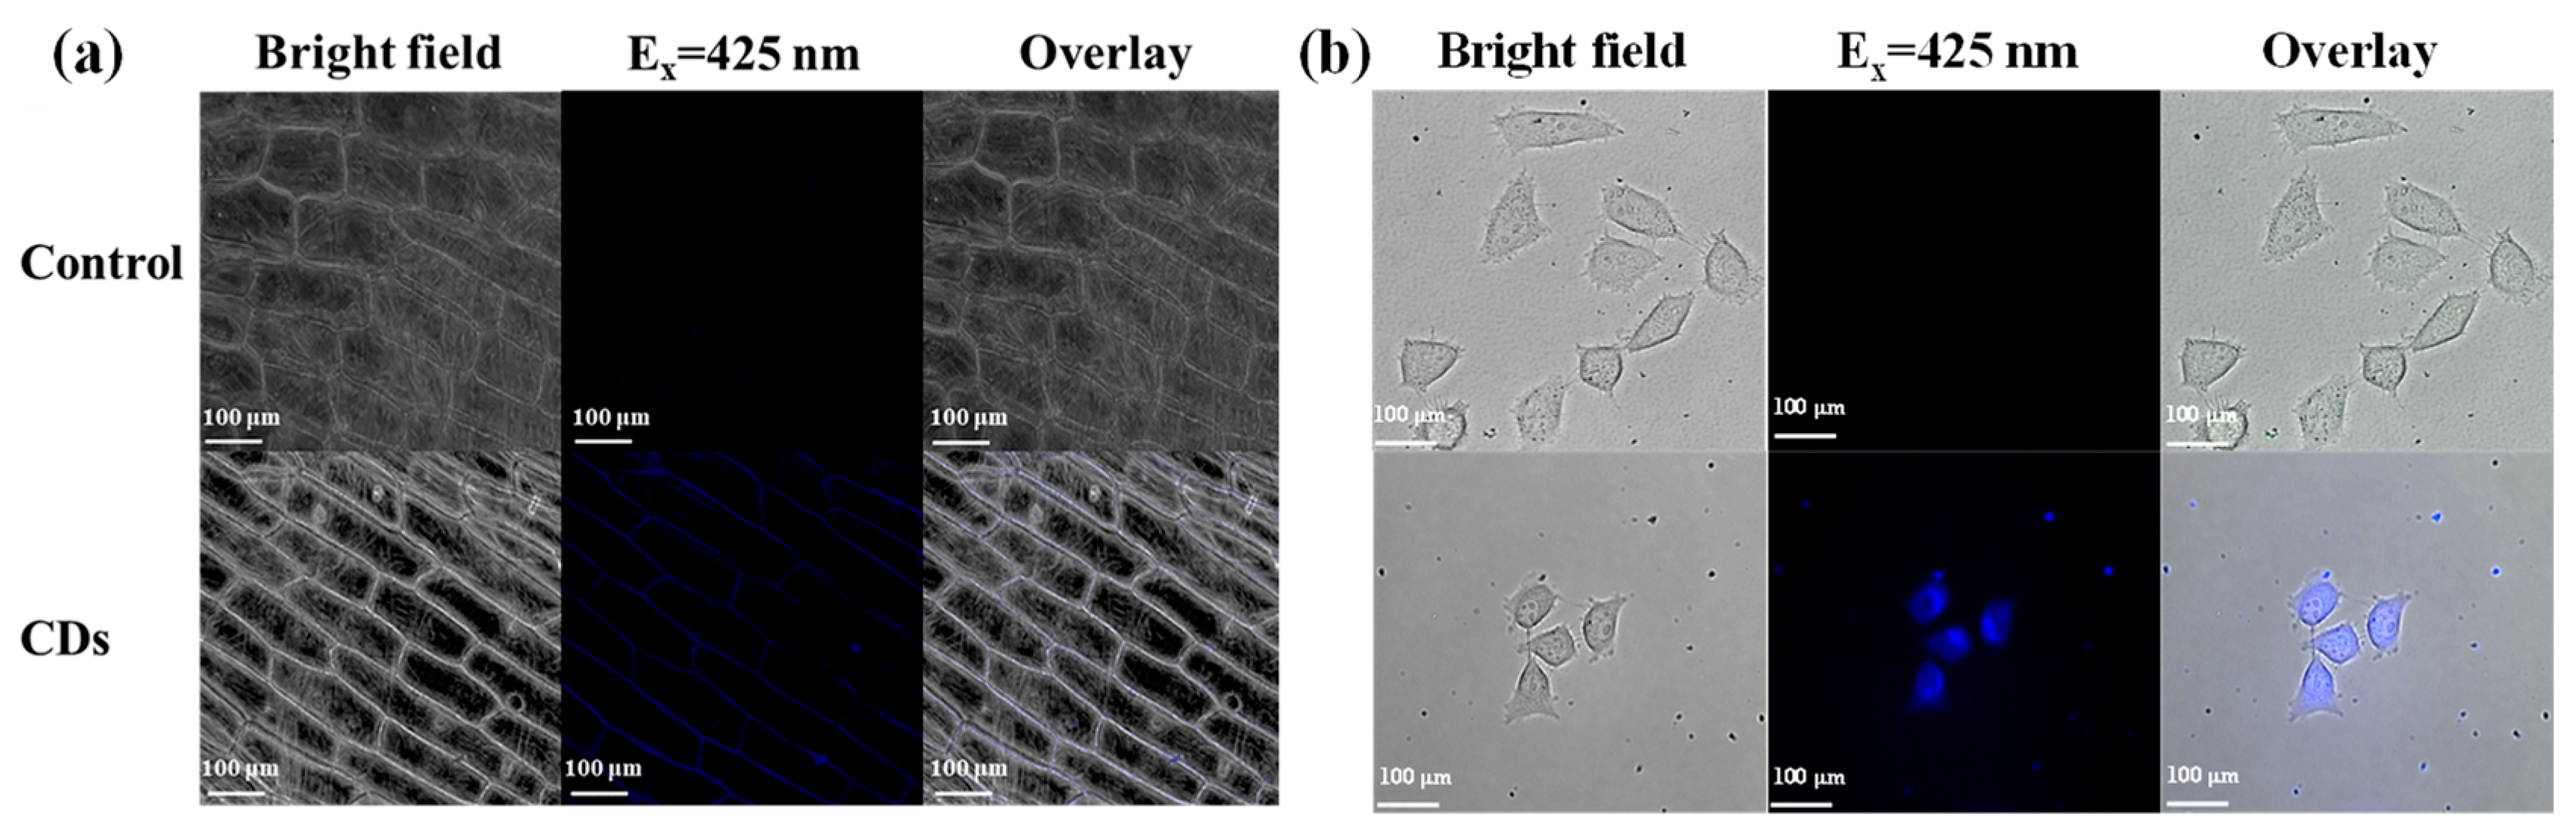
3.4. Bioimaging of CDs in Onion Epidermal Cells and HepG2 Cells

Taken together, the fluorescent CDs synthesized with mussels will be a potential fluorescent probe in the future. In this study, mussels-derived CDs prepared at 180 °C were used as bio-imaging and biosensor probes. Firstly, to estimate the biocompatibility of mussels-derived CDs, the viability of HepG2 cells treated with different concentrations of 180-CDs was evaluated. As shown in Figure S3, even though the concentration of 180-CDs increased to 6 mg/mL, the viability of HepG2 cells could still remain above 100% after incubation with CDs for 24 h. The result proved that mussels-derived CDs had excellent biocompatibility. Then, the 180-CDs were applied in onion epidermal cells and HepG2 cells for bio-imaging in vivo. Compared to the control, cell walls of the onion epidermal cells were fluorescent (Figure 7a), indicating that mussels-derived CDs could not cross the cytomembrane, which was consistent with pizza-derived CDs [38]. As seen in Figure 7b, HepG2 cells exhibited noticeable bright fluorescence after being treated with 180-CDs for 24 h, and mussels-derived CDs mainly localized in the cytoplasm of HepG2 cells. It was reported that endocytosis was the pathway for the cellular uptake of CDs [39]. Thus, mussels-derived CDs are excellent probes for cellular imaging applications.

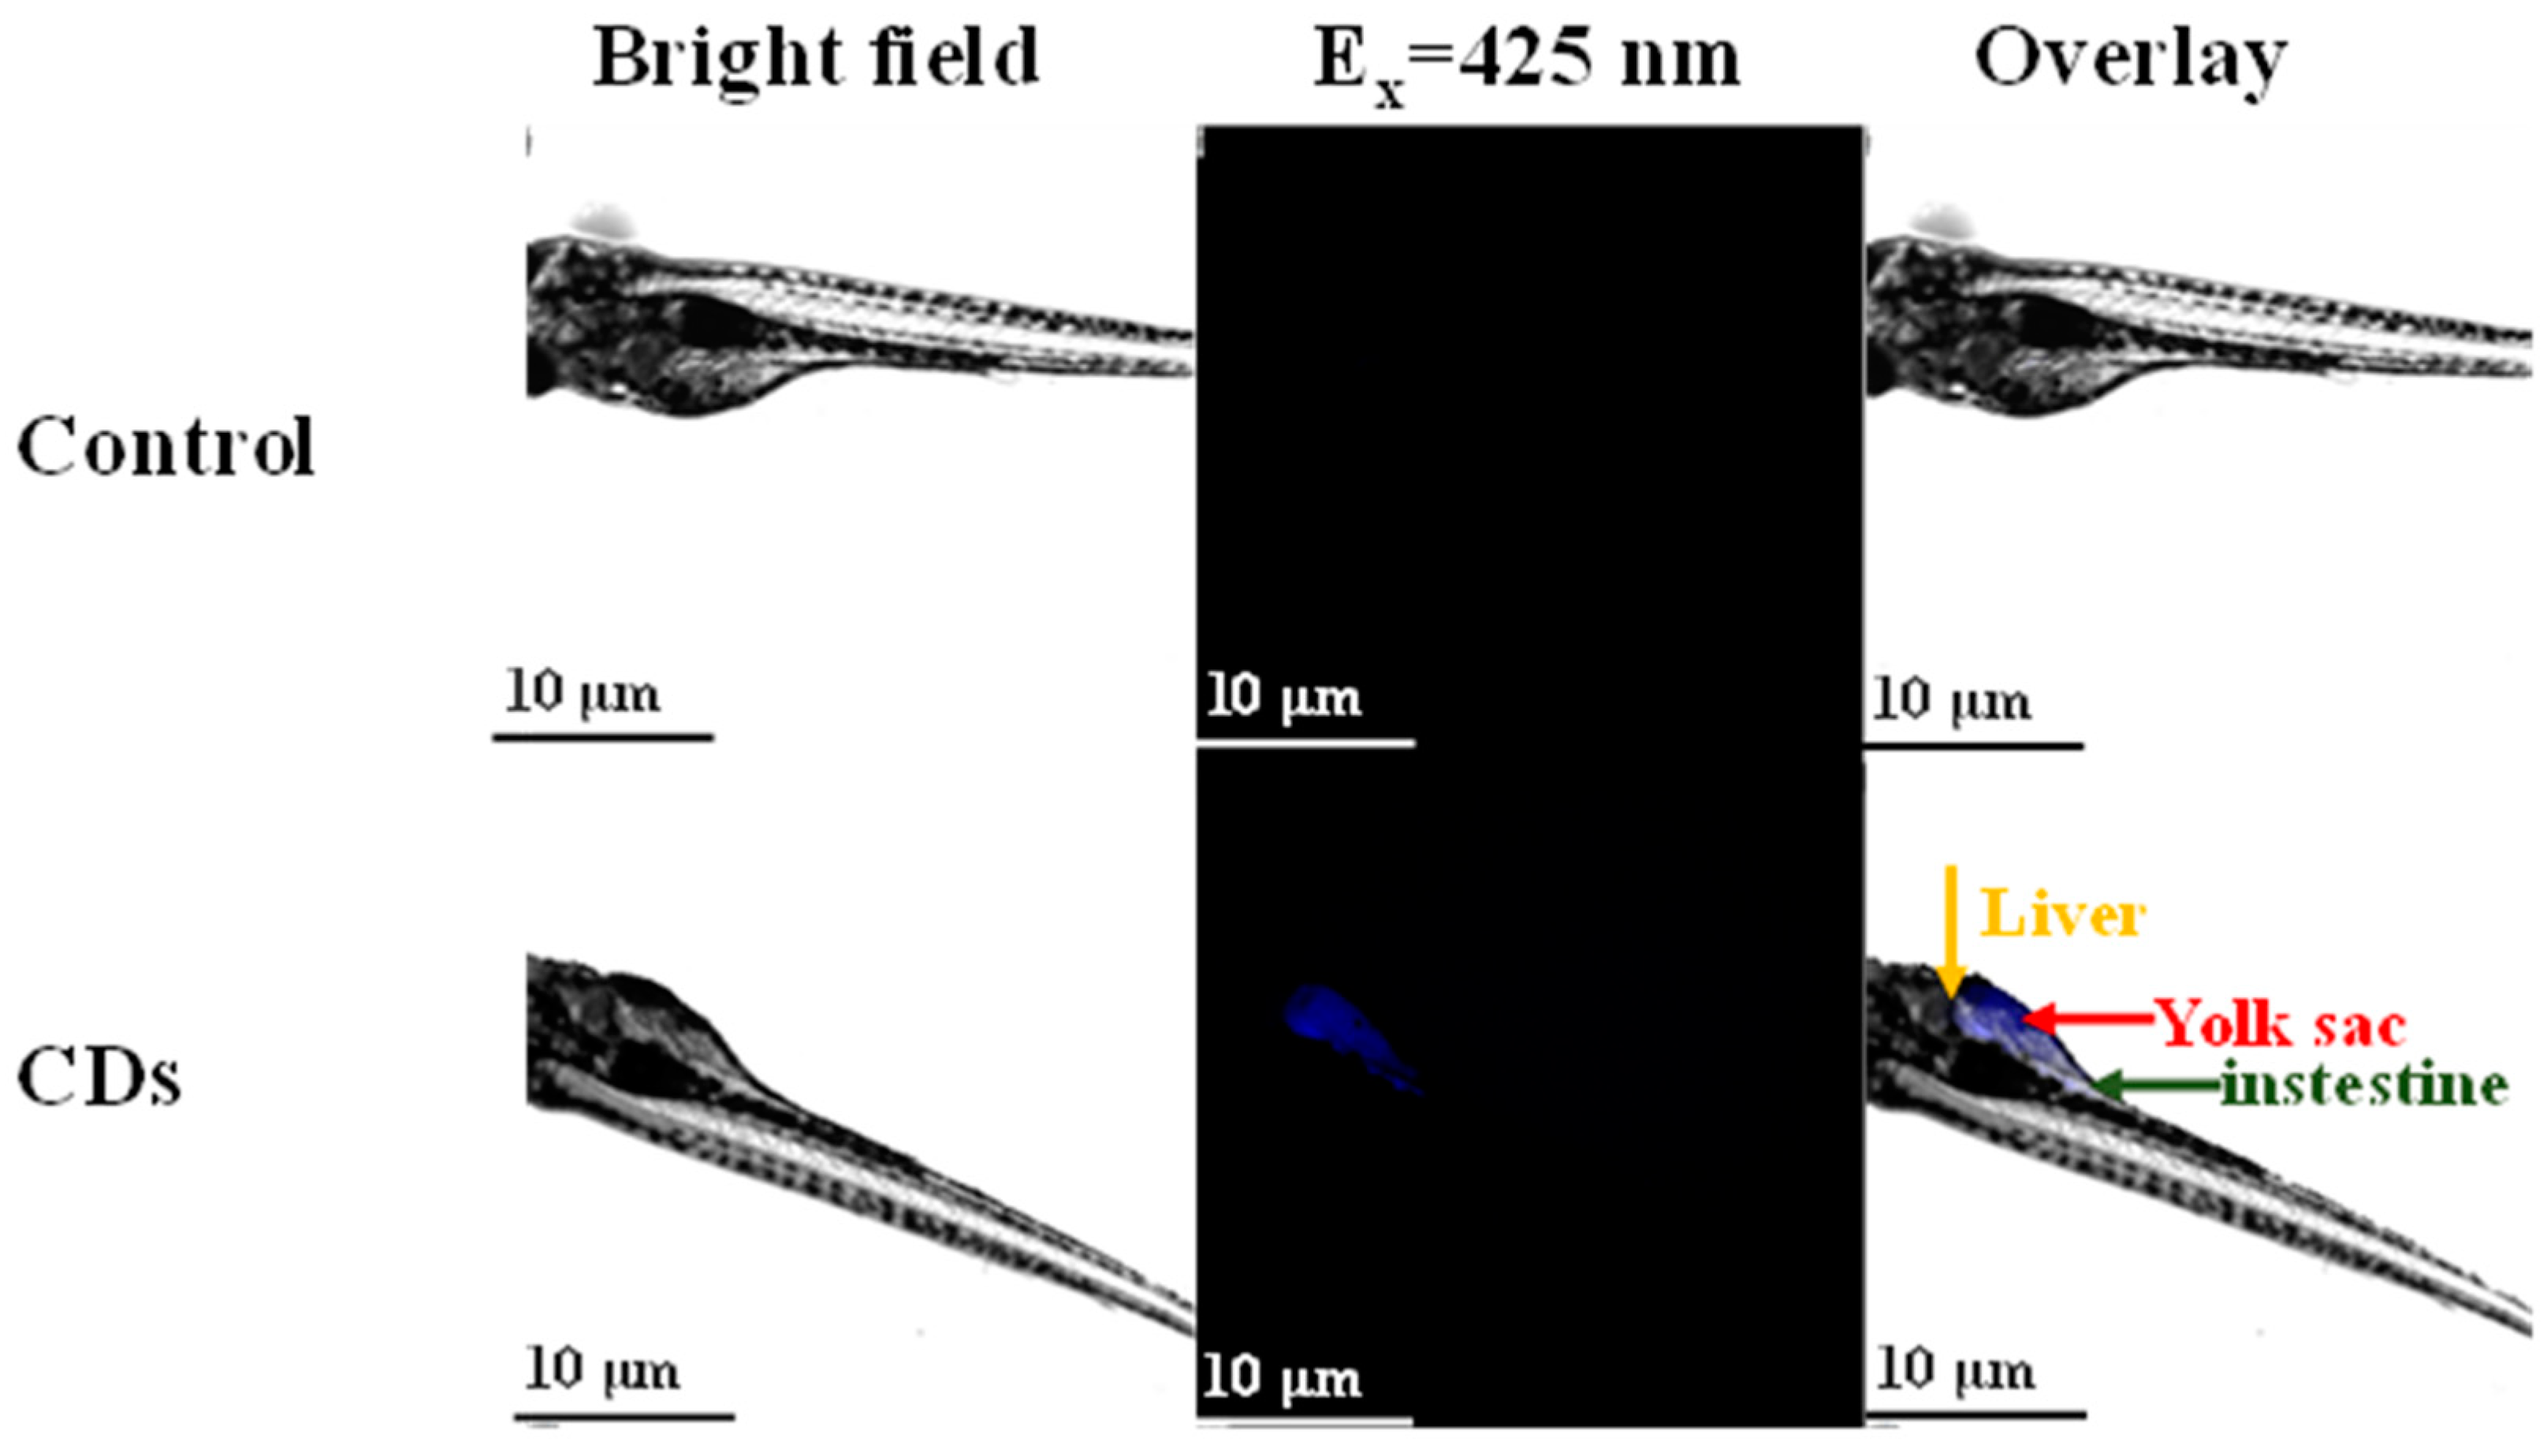
3.5. In Vivo Imaging of Zebrafish

To assess the bioimaging ability of mussels-derived CDs in vivo, zebrafish larvae were fed with 180-CDs for 48 h. It was observed clearly that blue fluorescence was concentrated in the livers, yolks, and intestines of zebrafish incubated with CDs compared to the control group (Figure 8) [17]. This implies that CDs might enter into the zebrafish by mouth. These results signify that mussels-derived CDs are biocompatible and appropriate for bio-imaging in vivo.

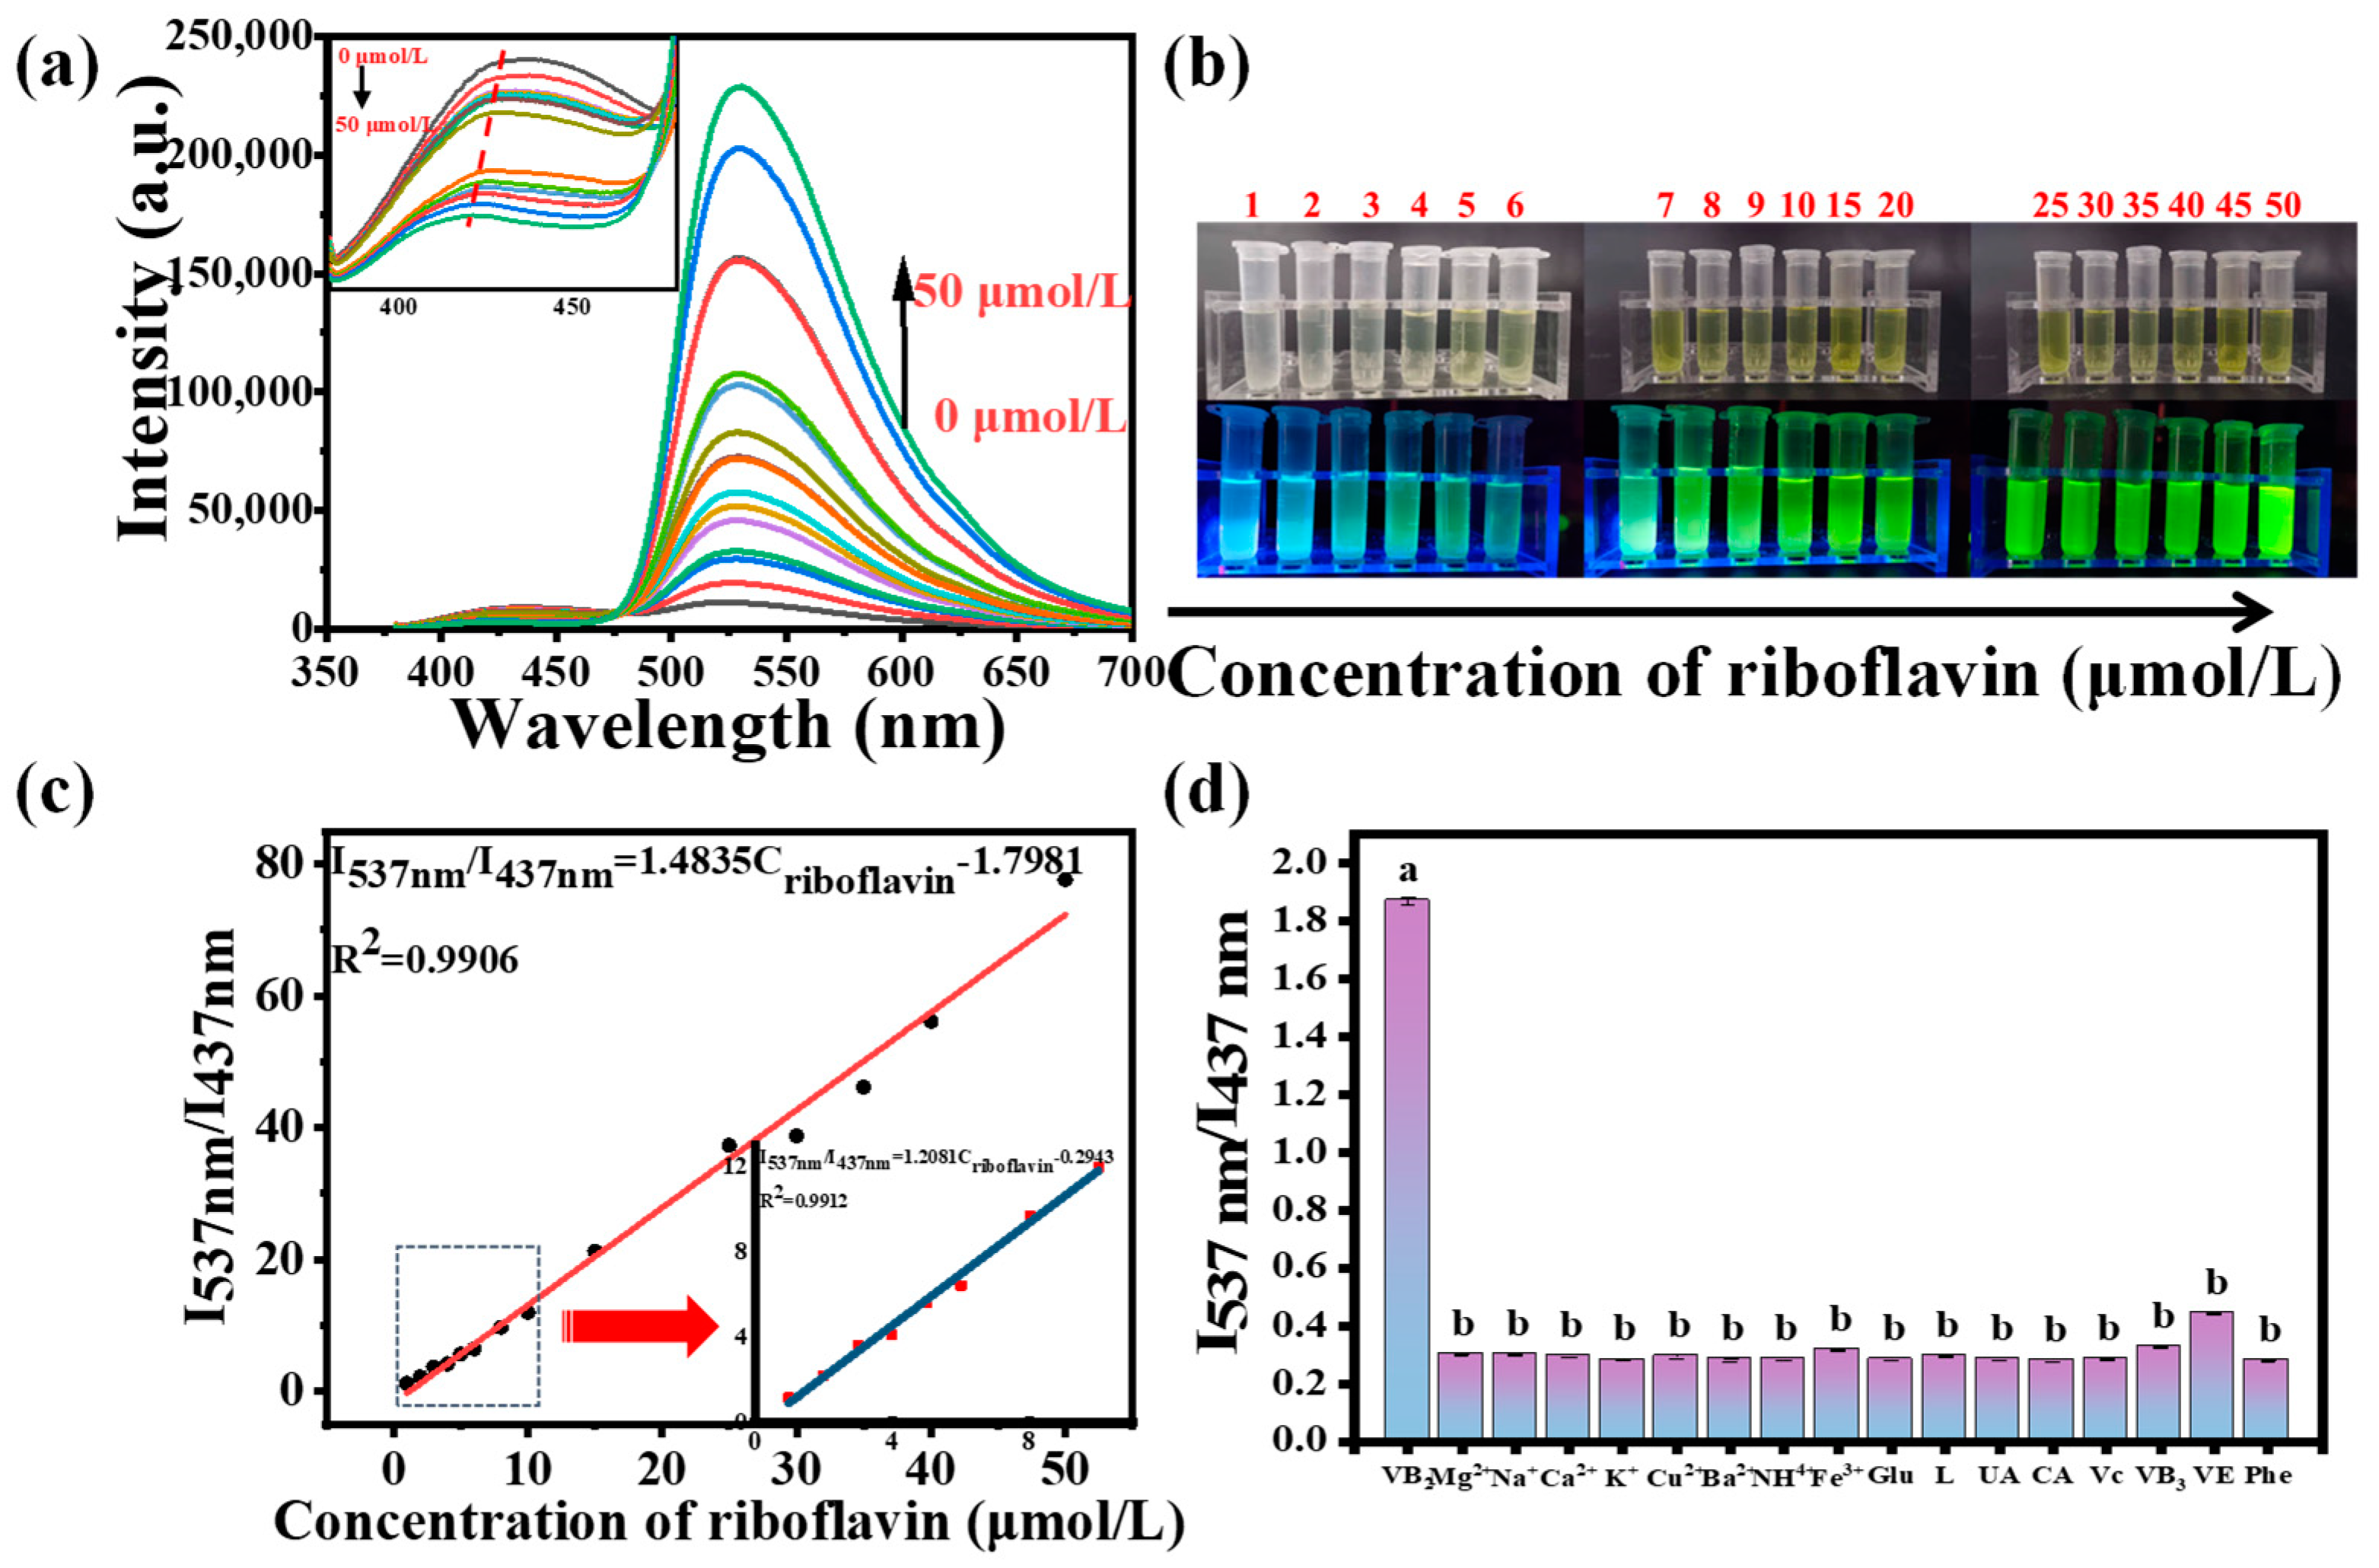
3.6. Application of CDs for Riboflavin Detection

3.6.1. Optimization of Riboflavin Detection Conditions

Riboflavin, i.e., vitamin B2, plays a crucial role in keeping organism health, and their content could also infer food quality; therefore, it is of great importance to provide accurate riboflavin analytical methods. It is worth noting that CDs could be employed as a ratio-metric sensor for riboflavin based on fluorescence resonance energy transfer (FRET) [40]. To confirm the potential for FRET between mussels-derived CDs (donor) and riboflavin (acceptor), the UV-vis absorption spectrum of riboflavin was measured. As illustrated in Figure S4, riboflavin produced four strong absorbance peaks at 200, 260, 370, and 450 nm. Meanwhile, there was an overlap region between the absorption spectrum of riboflavin and the emission spectrum of mussels-derived CDs, which indicates the potential for FRET between mussels-derived CDs and riboflavin [40]. Before investigation of CD detection performance for riboflavin, the effects of pH and reaction time on riboflavin detection were examined. As shown in Figure S5, the ratio I537 nm/I437 nm of the CDs/riboflavin system achieved its highest level after reacting for 10 min, then fell slightly, owing to riboflavin degraded to lumiflavin [40]. Moreover, the I537 nm/I437 nm ratio decreased with pH increasing because the hydroxyl and carboxyl groups on the surface of CDs were protonated while riboflavin was relatively stable at low pH [41]. Therefore, the optimum reaction time and pH for measurement were identified as 10 min and 2, respectively.

3.6.2. Analytical Performance of CDs in the Detection of Riboflavin

After optimization of riboflavin assay conditions, quantitative detection of riboflavin was evaluated under optimal experimental conditions. As seen in Figure 9a, the fluorescence spectra and fluorescence intensity of CDs at 437 nm progressively blue-shifted and reduced, respectively, while the fluorescence intensity of riboflavin at 537 nm steadily rose with the addition of riboflavin. This phenomenon was consistent with the photographs of the CDs–riboflavin system under UV light (365 nm) (Figure 9b). According to the FRET efficiency equation (η = 1 − I/I0, where I and I0 correspond to the fluorescence intensity of the CDs at 437 nm and 537 nm in the presence and absence of riboflavin), the efficiency increased from 0% to 67.2% while the concentration of riboflavin increased from 0 to 50 μmol/L. In addition, there was a good linear relationship between I537 nm/I437 nm and the concentration of riboflavin in the range of 1–50 μmol/L (Figure 9c): I537 nm/I437 nm = 1.4835 Criboflavin − 1.7981, and R2 = 0.9906. Similarly, I537 nm/I437 nm also showed a good linear relationship with the concentration of riboflavin in the range 1–10 μmol/L (Figure 9c inset). The limit of detection was calculated to be 6.06 nmol/L based on 3Sb/k. Compared with other sensors, the proposed strategy has a wide linear range and relatively low detection limit (Table 1).
Furthermore, the selectivity of the sensing system was investigated using common metal salt solutions, amino acids, and food additives at a concentration of 95 umol/L. As shown in Figure 9d, a significant change in the fluorescence intensity ratio (I537 nm/I437 nm) was only discovered in the presence of riboflavin. The reasons are as follows. Firstly, mussels-derived CDs had a good fluorescence stability against these analytes whose concentration was 95 umol/L, which caused a relatively stable fluorescence intensity at 437 nm and 537 nm. Moreover, the riboflavin has a strong fluorescence intensity at 537 nm and could quench the fluorescence of CDs for FRET. These results indicated that the developed ratiometric fluorescence biosensor can selectively detect riboflavin.

3.6.3. Analysis of Riboflavin in Real Samples

A practical application of the approach was employed to detect riboflavin in milk, milk powder, and riboflavin pharmaceutical tablets. A recovery experiment was further conducted by adding different concentrations of riboflavin into these samples. As shown in Table 2, the recoveries ranged from 93.0% to 101.0%, and a relative standard deviation was 0.4 to 1.3%, which illustrated the feasibility of the method to detect riboflavin in real samples.

4. Conclusions

In conclusion, mussels are a promising carbon resource for preparing N-doped CDs with good fluorescence quantum yield up to 15.20% via a green fabrication method. These mussels-derived CDs had a narrow size range, and the minimum average particle size was 1.30 nm. The obtained CDs contained C, N, O, and H and rich functional groups such as -OH, -NH2, and -COOH on their surface. These CDs exhibited excellent water solubility and bright blue fluorescence. Moreover, mussels-derived CDs were successfully employed as a probe for bio-imaging in vitro and in vivo for their good fluorescence stability and biocompatibility. Furthermore, CDs were applied to the quantitative detection of riboflavin. Overall, mussels-derived CDs are expected to be developed as fluorescence probes for bio-imaging and food ingredients or contaminants detection. These results provided important insights into the preparation, characteristics, and application of CDs derived from natural biomass.

Supplementary Materials

The following supporting information can be downloaded at: https://www.mdpi.com/article/10.3390/foods11162451/s1, Figure S1: XRD pattern of mussels-derived CDs. Figure S2: Fluorescence quantum yield of quinine sulfate and mussels-derived CDs prepared at (a) 140 °C; (b) 160 °C, and (c) 180 °C. Figure S3: Cell viability of HepG2 cells after incubation with different concentrations of CDs for 24 h. Figure S4: UV-vis absorption spectrum of riboflavin and fluorescence emission spectrum of 180-CDs. Figure S5: (a) Effects of the reaction time, and (b) pH on the detection of riboflavin between CDs and riboflavin.

Author Contributions

Conceptualization, S.C. and W.Z.; methodology, W.Z., Y.Z., B.C., and X.C.; software, W.Z., Y.Z., and Z.L.; formal analysis, W.Z.; data curation, W.Z. and Z.L.; writing—original draft preparation, W.Z.; writing—review and editing, W.Z., Y.Z., Z.L., C.S., X.C., and S.C.; project administration, S.C. All authors have read and agreed to the published version of the manuscript.

Funding

This work was financially supported by Young Doctoral Research Project of Yantai University (Grant No. SM20B20), Graduate Innovation Foundation of Yantai University, GIFYTU (Grant No. KGIFYTU2219) and Shandong College Student Innovation and Entrepreneurship Training Program (Grant No. S202111066039).

Institutional Review Board Statement

The study was conducted in accordance with the Declaration of Helsinki, and approved by the Ethics Committee of Yantai University (protocol No. 106/2021 and approved on 15 June 2021).

Informed Consent Statement

Not applicable.

Data Availability Statement

The datasets generated for this study are available on request to the corresponding author.

Acknowledgments

We would like to thank Zhenhua Wang for his given support in cell and zebrafish cultivation.

Conflicts of Interest

The authors declare no conflict of interest.

References

  1. Xu, Y.; Niu, X.; Zhang, H.; Xu, L.; Zhao, S.; Chen, H.; Chen, X. Switch-on fluorescence sensing of glutathione in food samples based on a graphitic carbon nitride quantum dot (g-CNQD)-Hg2+ chemosensor. J. Agric. Food. Chem. 2015, 63, 1747–1755. [Google Scholar] [CrossRef] [PubMed]
  2. Guo, Y.; Cao, F.; Li, Y. Solid phase synthesis of nitrogen and phosphor co-doped carbon quantum dots for sensing Fe3+ and the enhanced photocatalytic degradation of dyes. Sens. Actuators B Chem. 2018, 255, 1105–1111. [Google Scholar] [CrossRef]
  3. Wang, J.; Feng, Z.; Wang, Y.; Yang, Y.; Liu, X. Efficient resistance against solid-state quenching of carbon dots towards white light emitting diodes by physical embedding into silica. Carbon 2017, 126, 426–436. [Google Scholar] [CrossRef]
  4. Cayuela, A.; Soriano, M.L.; Valcárcel, M. Reusable sensor based on functionalized carbon dots for the detection of silver nanoparticles in cosmetics via inner filter effect. Anal. Chim. Acta. 2015, 872, 70–76. [Google Scholar] [CrossRef]
  5. Huang, C.-C.; Hung, Y.-S.; Weng, Y.-M.; Chen, W.; Lai, Y.-S. Sustainable development of carbon nanodots technology: Natural products as a carbon source and applications to food safety. Trends Food Sci. Technol. 2019, 86, 144–152. [Google Scholar] [CrossRef]
  6. Zhang, X.; Wang, H.; Ma, C.; Niu, N.; Chen, Z.; Liu, S.; Li, J.; Li, S. Seeking value from biomass materials: Preparation of coffee bean shell-derived fluorescent carbon dots via molecular aggregation for antioxidation and bioimaging applications. Mater. Chem. Front. 2018, 2, 1269–1275. [Google Scholar] [CrossRef]
  7. Perumal, S.; Atchudan, R.; Edison, T.N.J.I.; Lee, Y.R. Sustainable synthesis of multifunctional carbon dots using biomass and their applications: A mini-review. J. Environ. Chem. Eng. 2021, 9, 105802. [Google Scholar] [CrossRef]
  8. Zhang, Z.; Duan, Y.; Yu, Y.; Yan, Z.; Chen, J. Carbon quantum dots: Synthesis, characterization, and assessment of cytocompatibility. J. Mater. Sci. Mater. M. 2015, 26, 213. [Google Scholar] [CrossRef]
  9. Ding, C.; Deng, Z.; Chen, J.; Jin, Y. One-step microwave synthesis of N, S co-doped carbon dots from 1, 6-hexanediamine dihydrochloride for cell imaging and ion detection. Colloid. Surface. B 2020, 189, 110838. [Google Scholar] [CrossRef]
  10. Li, S.; Li, Y.; Liu, K.; Chen, M.; Peng, W.; Yang, Y.; Li, X. Laser fabricated carbon quantum dots in anti-solvent for highly efficient carbon-based perovskite solar cells. J. Colloid. Interf. Sci. 2021, 600, 691–700. [Google Scholar] [CrossRef]
  11. Jiao, X.Y.; Li, L.S.; Qin, S.; Zhang, Y.; Huang, K.; Xu, L. The synthesis of fluorescent carbon dots from mango peel and their multiple applications. Colloid. Surface. A 2019, 577, 306–314. [Google Scholar] [CrossRef]
  12. Ghosh, S.; Ghosal, K.; Mohammad, S.A.; Sarkar, K. Dendrimer functionalized carbon quantum dot for selective detection of breast cancer and gene therapy. Chem. Eng. J. 2019, 373, 468–484. [Google Scholar] [CrossRef]
  13. Zhou, J.; Zhou, H.; Tang, J.; Deng, S.; Yan, F.; Li, W.; Qu, M. Carbon dots doped with heteroatoms for fluorescent bioimaging: A review. Microchim. Acta 2017, 184, 343–368. [Google Scholar] [CrossRef]
  14. Boobalan, T.; Sethupathi, M.; Sengottuvelan, N.; Kumar, P.; Balaji, P.; Gulyás, B.; Padmanabhan, P.; Selvan, S.T.; Arun, A. Mushroom-derived carbon dots for toxic metal ion detection and as antibacterial and anticancer agents. ACS. Appl. Nano Mater. 2020, 3, 5910–5919. [Google Scholar] [CrossRef]
  15. Jayaweera, S.; Yin, K.; Ng, W.J. Nitrogen-doped durian shell derived carbon dots for inner filter effect mediated sensing of tetracycline and fluorescent ink. J. Fluoresc. 2018, 29, 221–229. [Google Scholar] [CrossRef]
  16. Wei, X.; Li, L.; Liu, J.; Yu, L.; Li, H.; Cheng, F.; Yi, X.; He, J.; Li, B. Green synthesis of fluorescent carbon dots from gynostemma for bioimaging and antioxidant in zebrafish. ACS. Appl. Mater. Inter. 2019, 11, 9832–9840. [Google Scholar] [CrossRef]
  17. Liu, Z.; Li, B.; Shi, X.; Li, L.; Feng, Y.; Jia, D.; Zhou, Y. Target-oriented synthesis of high synthetic yield carbon dots with tailored surface functional groups for bioimaging of zebrafish, flocculation of heavy metal ions and ethanol detection. Appl. Surf. Sci. 2021, 538, 148118–148128. [Google Scholar] [CrossRef]
  18. Dare, P.J.; Edwards, D.B. Seasonal changes in flesh weight and biochemical composition of mussels (Mytilus edulis L.) in the Conwy Estuary, North Wales. J. Exp. Mar. Bio. Ecol. 1975, 18, 89–97. [Google Scholar] [CrossRef]
  19. Supchocksoonthorn, P.; Hanchaina, R.; Sinoy, M.C.A.; de Luna, M.D.G.; Kangsamaksin, T.; Paoprasert, P. Novel solution- and paper-based sensors based on label-free fluorescent carbon dots for the selective detection of pyrimethanil. Appl. Surf. Sci. 2021, 564, 150372. [Google Scholar] [CrossRef]
  20. Cong, S.; Bi, J.; Song, X.; Yu, C.; Tan, M. Ultrasmall fluorescent nanoparticles derived from roast duck: Their physicochemical characteristics and interaction with human serum albumin. Food Funct. 2018, 9, 2490–2495. [Google Scholar] [CrossRef]
  21. Li, D.; Na, X.; Wang, H.; Xie, Y.; Cong, S.; Song, Y.; Zhu, B.W.; Tan, M. Fluorescent carbon dots derived from maillard reaction products: Their properties, biodistribution, cytotoxicity, and antioxidant activity. J. Agr. Food Chem. 2018, 66, 1569–1575. [Google Scholar] [CrossRef] [PubMed]
  22. Bi, J.; Li, Y.; Wang, H.; Song, Y.; Cong, S.; Yu, C.; Zhu, B.-W.; Tan, M. Presence and formation mechanism of foodborne carbonaceous nanostructures from roasted pike eel (Muraenesox cinereus). J. Agr. Food Chem. 2018, 66, 2862–2869. [Google Scholar] [CrossRef] [PubMed]
  23. Boruah, A.; Saikia, M.; Das, T.; Goswamee, R.L.; Saikia, B.K. Blue-emitting fluorescent carbon quantum dots from waste biomass sources and their application in fluoride ion detection in water. J. Photoch. Photobio. B. 2020, 209, 111940. [Google Scholar] [CrossRef] [PubMed]
  24. Yan, C.; Ren, Y.; Sun, X.; Jin, L.; Liu, X.; Chen, H.; Wang, K.; Yu, M.; Zhao, Y. Photoluminescent functionalized carbon quantum dots loaded electroactive silk fibroin/PLA nanofibrous bioactive scaffolds for cardiac tissue engineering. J. Photoch. Photobio. B. 2020, 202, 111680. [Google Scholar] [CrossRef] [PubMed]
  25. Malavika, J.P.; Shobana, C.; Ragupathi, M.; Kumar, P.; Lee, Y.S.; Govarthanan, M.; Selvan, R.K. A sustainable green synthesis of functionalized biocompatible carbon quantum dots from Aloe barbadensis miller and its multifunctional applications. Environ. Res. 2021, 200, 111414. [Google Scholar] [CrossRef] [PubMed]
  26. Tong, T.; Hu, H.; Zhou, J.; Deng, S.; Zhang, X.; Tang, W.; Fang, L.; Xiao, S.; Liang, J. Glycyrrhizic-acid-based carbon dots with high antiviral activity by multisite inhibition mechanisms. Small 2020, 16, 76–83. [Google Scholar] [CrossRef]
  27. Supchocksoonthorn, P.; Thongsai, N.; Moonmuang, H.; Kladsomboon, S.; Jaiyong, P.; Paoprasert, P. Label-free carbon dots from black sesame seeds for real-time detection of ammonia vapor via optical electronic nose and density functional theory calculation. Colloid. Surf. A. 2019, 575, 118–128. [Google Scholar] [CrossRef]
  28. Cong, S.; Liu, K.; Qiao, F.; Song, Y.; Tan, M. Biocompatible fluorescent carbon dots derived from roast duck for in vitro cellular and in vivo C. elegans bio-imaging. Methods 2019, 168, 76–83. [Google Scholar] [CrossRef] [PubMed]
  29. Gao, P.; Wang, J.; Zheng, M.; Xie, Z. Lysosome targeting carbon dots-based fluorescent probe for monitoring pH changes in vitro and in vivo. Chem. Eng. J. 2020, 381, 122665–122677. [Google Scholar] [CrossRef]
  30. Boakye-Yiadom, K.O.; Kesse, S.; Opoku-Damoah, Y.; Filli, M.S.; Aquib, M.; Joelle, M.M.B.; Farooq, M.A.; Mavlyanova, R.; Raza, F.; Bavi, R.; et al. Carbon dots: Applications in bioimaging and theranostics. Int. J. Pharmaceut. 2019, 564, 308–317. [Google Scholar] [CrossRef]
  31. Song, X.; Wang, H.; Zhang, R.; Yu, C.; Tan, M. Bio-distribution and interaction with dopamine of fluorescent nanodots from roasted chicken. Food Funct. 2018, 9, 6227–6235. [Google Scholar] [CrossRef]
  32. Tan, J.; Zhang, J.; Li, W.; Zhang, L.; Yue, D. Synthesis of amphiphilic carbon quantum dots with phosphorescence properties and their multifunctional applications. J. Mater. Chem. C. 2016, 4, 10146–10153. [Google Scholar] [CrossRef]
  33. Sk, M.P.; Jaiswal, A.; Paul, A.; Ghosh, S.S.; Chattopadhyay, A. Presence of amorphous carbon nanoparticles in food caramels. Sci. Rep. UK 2012, 2, 1–5. [Google Scholar] [CrossRef] [PubMed]
  34. Liao, H.; Jiang, C.; Liu, W.; Vera, J.M.; Seni, O.D.; Demera, K.; Yu, C.; Tan, M. Fluorescent nanoparticles from several commercial beverages: Their properties and potential application for bioimaging. J. Agr. Food Chem. 2015, 63, 8527–8533. [Google Scholar] [CrossRef] [PubMed]
  35. Kong, W.; Wu, H.; Ye, Z.; Li, R.; Xu, T.; Zhang, B. Optical properties of pH-sensitive carbon-dots with different modifications. J. Lumin. 2014, 148, 238–242. [Google Scholar] [CrossRef]
  36. Liu, R.; Liu, K.; Tan, M. Nanocorona formation between foodborne nanoparticles extracted from roast squid and human serum albumin. J. Agr. Food Chem. 2019, 67, 10470–10480. [Google Scholar] [CrossRef]
  37. Shan, F.; Fu, L.; Chen, X.; Xie, X.; Liao, C.; Zhu, Y.; Xia, H.; Zhang, J.; Yan, L.; Wang, Z.; et al. Waste-to-wealth: Functional biomass carbon dots based on bee pollen waste and application. Chinese Chem. Lett. 2022, 33, 2942–2948. [Google Scholar] [CrossRef]
  38. Cong, S.; Wang, N.; Wang, K.; Wu, Y.; Li, D.; Song, Y.; Prakash, S.; Tan, M. Fluorescent nanoparticles in the popular pizza: Properties, biodistribution and cytotoxicity. Food Funct. 2019, 10, 2408–2416. [Google Scholar] [CrossRef]
  39. Zhou, N.; Zhu, S.; Maharjan, S.; Hao, H.; Song, Y.; Zhao, X.; Jiang, Y.; Yang, B.; Lu, L. Elucidating the endocytosis, intracellular trafficking, and exocytosis of carbon dots in neural cells. RSC Adv. 2014, 107, 62086–62095. [Google Scholar] [CrossRef]
  40. Wang, J.; Su, S.; Wei, J.; Bahgi, R.; Hope-Weeks, L.; Qiu, J.; Wang, S. Ratio-metric sensor to detect riboflavin via fluorescence resonance energy transfer with ultrahigh sensitivity. Phys. E. 2015, 72, 17–24. [Google Scholar] [CrossRef]
  41. Eitenmiller, R.R.; Landen, W.O., Jr.; Ye, L. Vitamin Analysis for the Health And food Sciences; CRC Press: Boca Raton, FL, USA, 2008; p. 2041. [Google Scholar]
  42. Han, J.; Zou, H.; Gao, M.; Huang, C. A graphitic carbon nitride based fluorescence resonance energy transfer detection of riboflavin. Talanta 2016, 148, 279–284. [Google Scholar] [CrossRef] [PubMed]
  43. Ma, Q.; Song, J.; Zhang, S.; Wang, M.; Guo, Y.; Dong, C. Colorimetric detection of riboflavin by silver nanoparticles capped with β-cyclodextrin-grafted citrate. Colloid Surf. B. 2016, 148, 66–72. [Google Scholar] [CrossRef] [PubMed]
  44. Feng, S.; Pei, F.; Wu, Y.; Lv, J.; Hao, Q.; Yang, T.; Tong, Z.; Lei, W. A ratiometric fluorescent sensor based on g-CNQDs@Zn-MOF for the sensitive detection of riboflavin via FRET. Spectrochim Acta A. 2021, 246, 119004. [Google Scholar] [CrossRef] [PubMed]
Scheme 1. Synthesis of mussels-derived CDs by hydrothermal method at different reaction temperatures.
Foods 11 02451 sch001
Figure 1. TEM images of CDs fabricated at (a) 140 °C, (b) 160 °C, (c) and 180 °C; insets represent high-resolution TEM images. The corresponding particle size distribution histogram of CDs formed at (d) 140 °C; (e) 160 °C; (f) 180 °C.
Foods 11 02451 g001
Figure 2. (a) FT-IR spectra; (b) UV–vis absorption spectra of mussels-derived CDs prepared at different reaction temperatures.
Foods 11 02451 g002
Figure 3. XPS spectra of mussels-derived CDs prepared at (a) 140 °C, (b) 160 °C, and (c) 180 °C, respectively; (d) relative contents of C, N, and O in mussels-derived CDs formed at different reaction temperatures.
Foods 11 02451 g003
Figure 4. XPS high-resolution scans of the 140-CDs (a) C1s; (b) N1s, and (c) O1s. XPS high-resolution scans of the 160-CDs (d) C1s, (e) N1s, and (f) O1s. XPS high-resolution scans of the 180-CDs (g) C1s, (h) N1s, and (i) O1s.
Foods 11 02451 g004
Figure 5. (ac) Fluorescence emission spectra (the photographs of CDs water solutions under daylight and UV light were shown at the insets), (d) fluorescence quantum yield of mussels-derived CDs fabricated at 140 °C, 160 °C, and 180 °C, respectively, (e) fluorescence decay and fitting curves, (f) Exmax and Emmax of mussels-derived CDs fabricated at 140 °C, 160 °C, and 180 °C, respectively.
Foods 11 02451 g005
Figure 6. Effects of pH on the fluorescence (FL) intensity of (a) 140-CDs; (b) 160-CDs; (c) 180-CDs. Effects of the NaCl concentration on the fluorescence intensity of (d) 140-CDs; (e) 160-CDs; (f) 180-CDs. Effects of metal ions on the fluorescence intensity of (g) 140-CDs; (h) 160-CDs; (i) 180-CDs. Different lowercase letters (ag) represent significant difference (p < 0.05).
Foods 11 02451 g006
Figure 7. Image of (a) onion epidermal cells treated in 180-CDs for 10 min, (b) HepG2 cells treated with 180-CDs for 24 h. Cells without CDs treatment were used as control.
Foods 11 02451 g007
Figure 8. Bright field and fluorescence images of zebrafish larva incubated in 180-CDs for 48 h.
Foods 11 02451 g008
Figure 9. (a) Fluorescence emission spectra and (b) photographs of CDs–riboflavin system under 365 nm UV light during stepwise titration of riboflavin with 0–50 μmol/L, (c) linear relationship between I537 nm/I437 nm and the concentration of riboflavin in the range 1–50 μmol/L, (d) the selectivity of the proposed method for riboflavin under optimal experimental conditions. Different lowercase letters (a,b) represent significant difference (p < 0.05).
Foods 11 02451 g009
Table 1. Comparison of different sensors for the detection of riboflavin.
SensorsLinear Range (μmol/L)Detection Limit (nmol/L)Reference
N, S-CDs0.56–7.441.9[40]
g-C3N4 nanosheets 10.4–10170[42]
Ag nanoparticles0.17–4.673.7[43]
N, P-CDs0.5–50170[23]
g-CNQDs@Zn-MOF 20.005–1.015[44]
Mussels-derived CDs1–506.06This work
1 Graphitic carbon nitride nanosheets. 2 Graphitic carbon nitrides quantum dots-Zn-MOF composite.
Table 2. Detection of riboflavin in real samples with the proposed method.
SampleMeasured (μmol/L)Added (μmol/L)Found (μmol/L)Recovery (%)RSD (%)
Milk0.4540.0040.50100.11.3
20.0020.4199.80.7
4.004.3898.31.1
Milk powder0.9840.0038.1893.00.7
20.0019.9895.00.5
4.004.8797.31.2
Riboflavin tablet5.1240.0045.52101.00.9
20.0024.9999.40.6
4.009.0598.30.4
Publisher’s Note: MDPI stays neutral with regard to jurisdictional claims in published maps and institutional affiliations.

