
Describing the Sensory Complexity of Italian Wines: Application of the Rate-All-That-Apply (RATA) Method


Abstract
:1. Introduction
2. Materials and Methods
2.1. Participants
2.2. Samples
2.3. Vocabulary Development
2.4. Training Phase
2.5. Evaluation Phase: The Rate-All-That-Apply (RATA) Method
2.6. Data Analysis
3. Results
3.1. Panel Reliability
3.2. Wines Sensory Characterisation
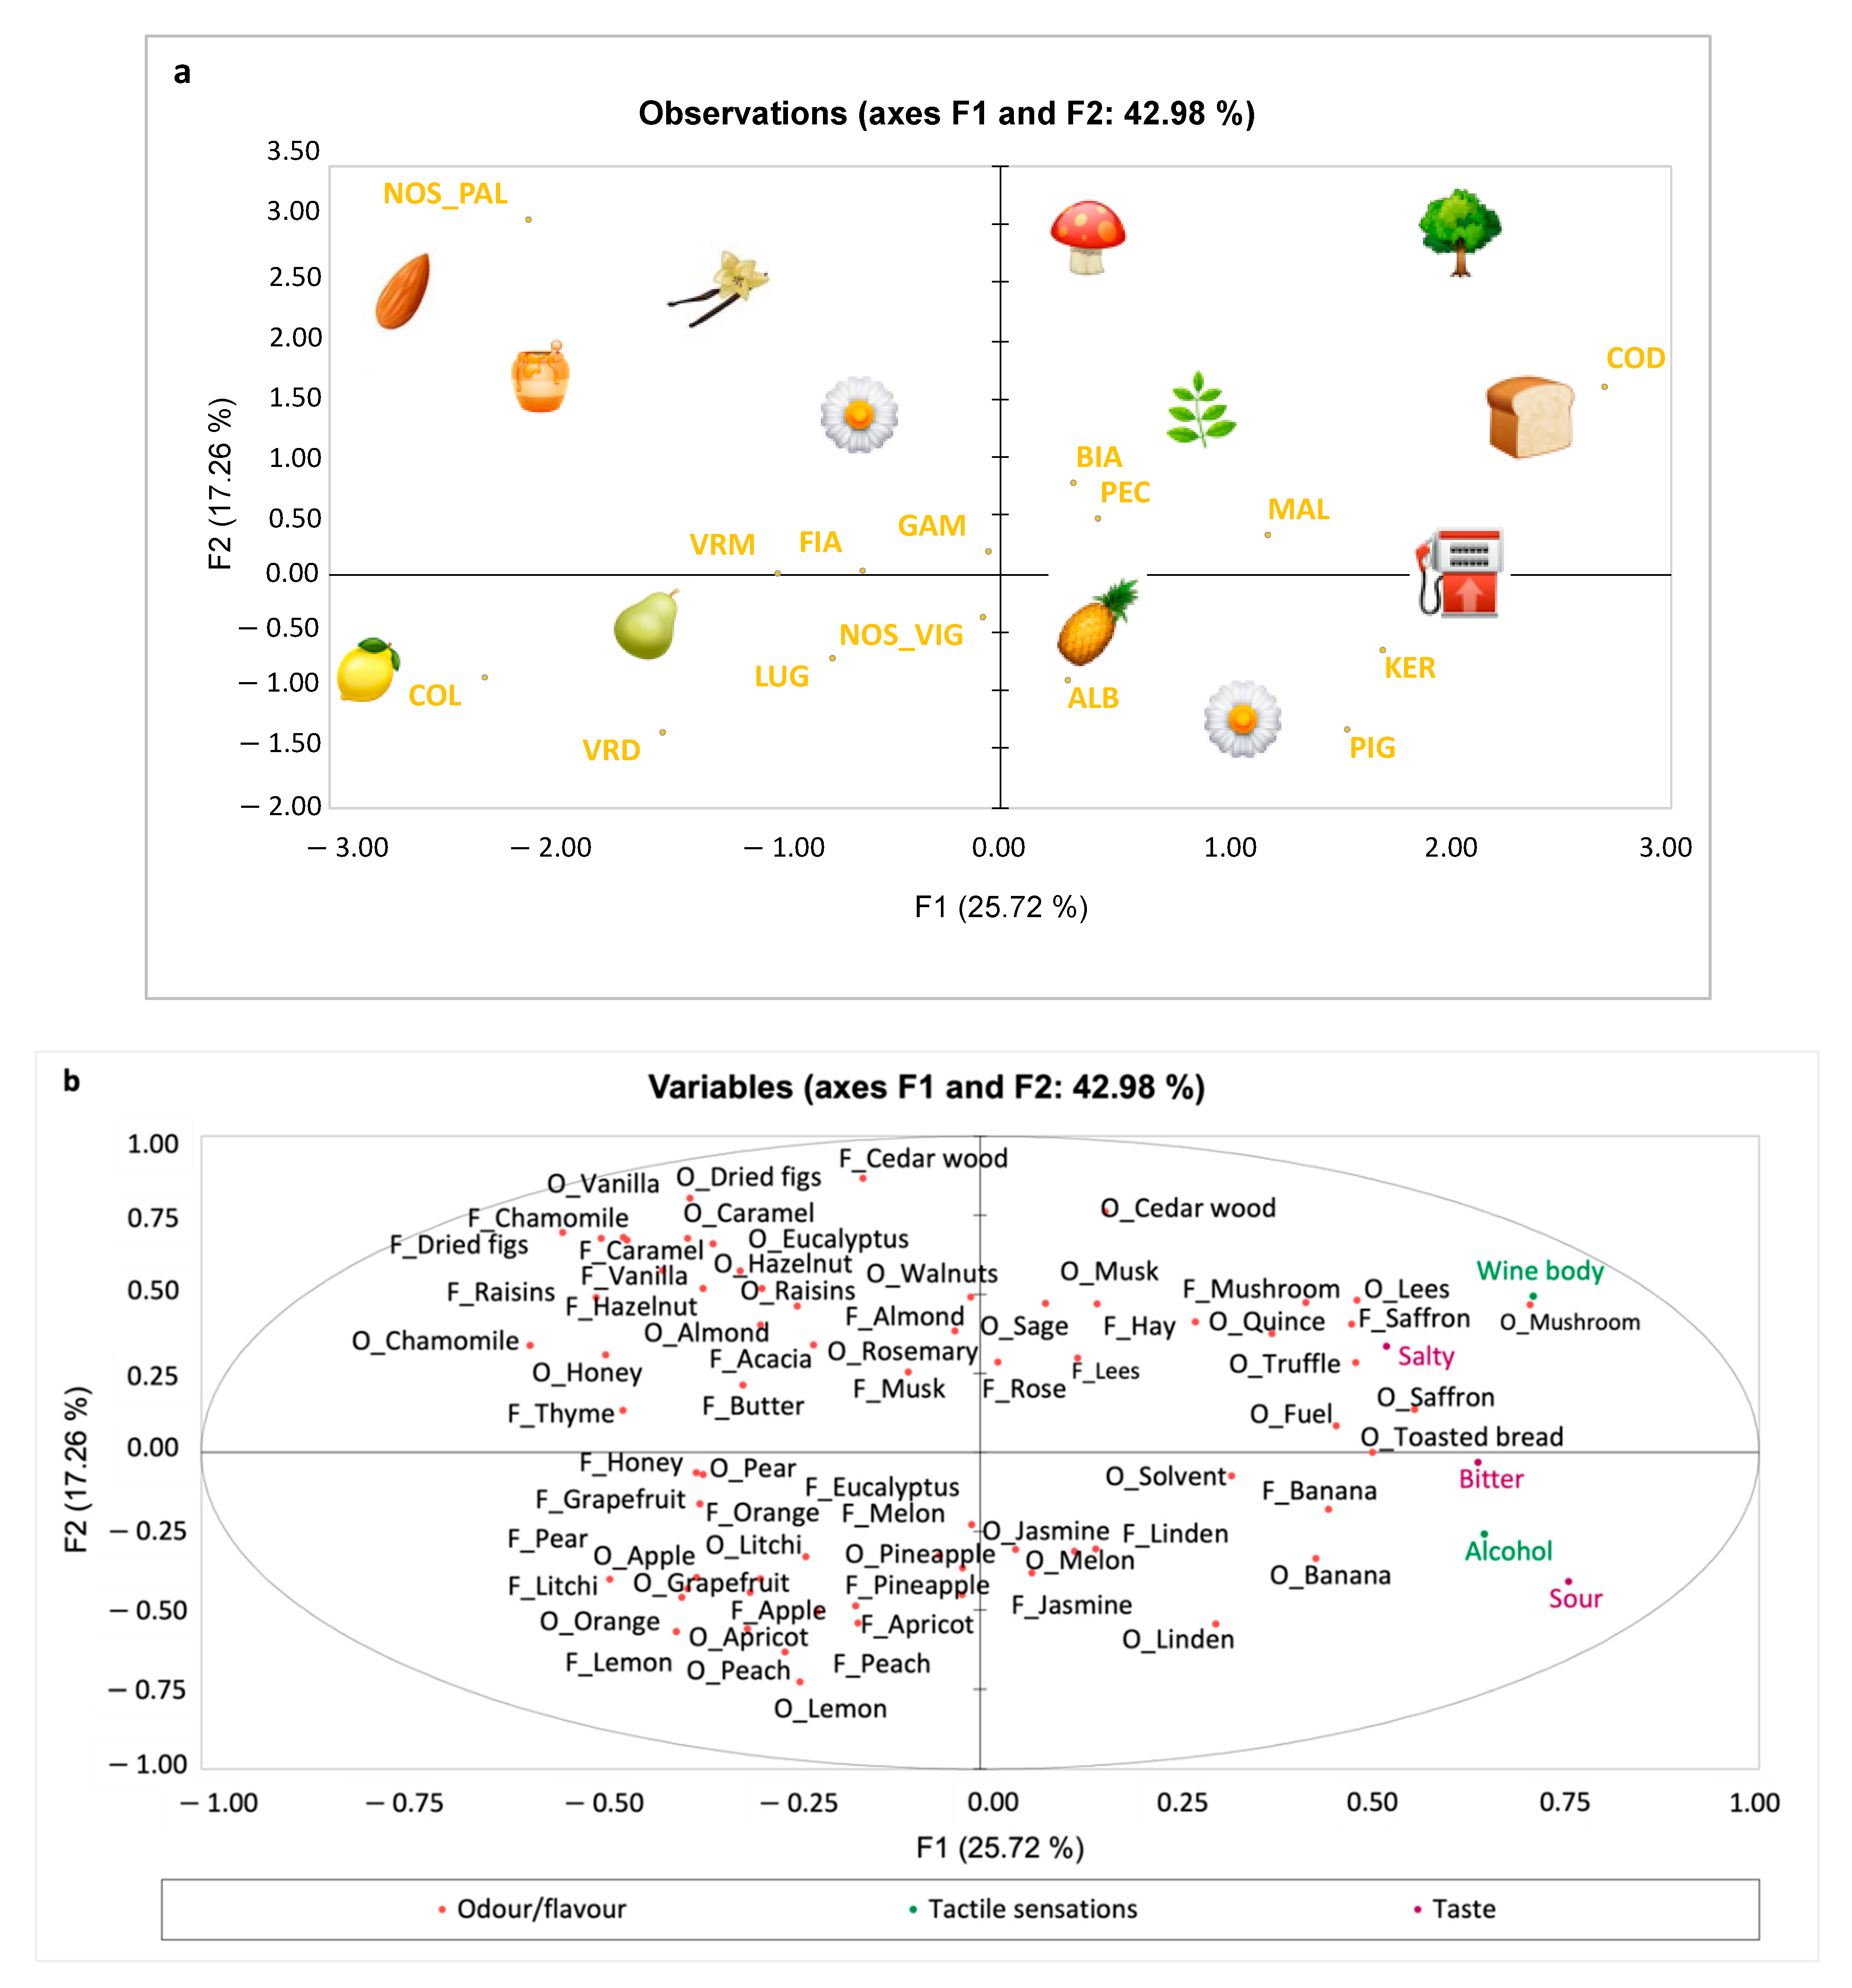
3.2.1. White Wines
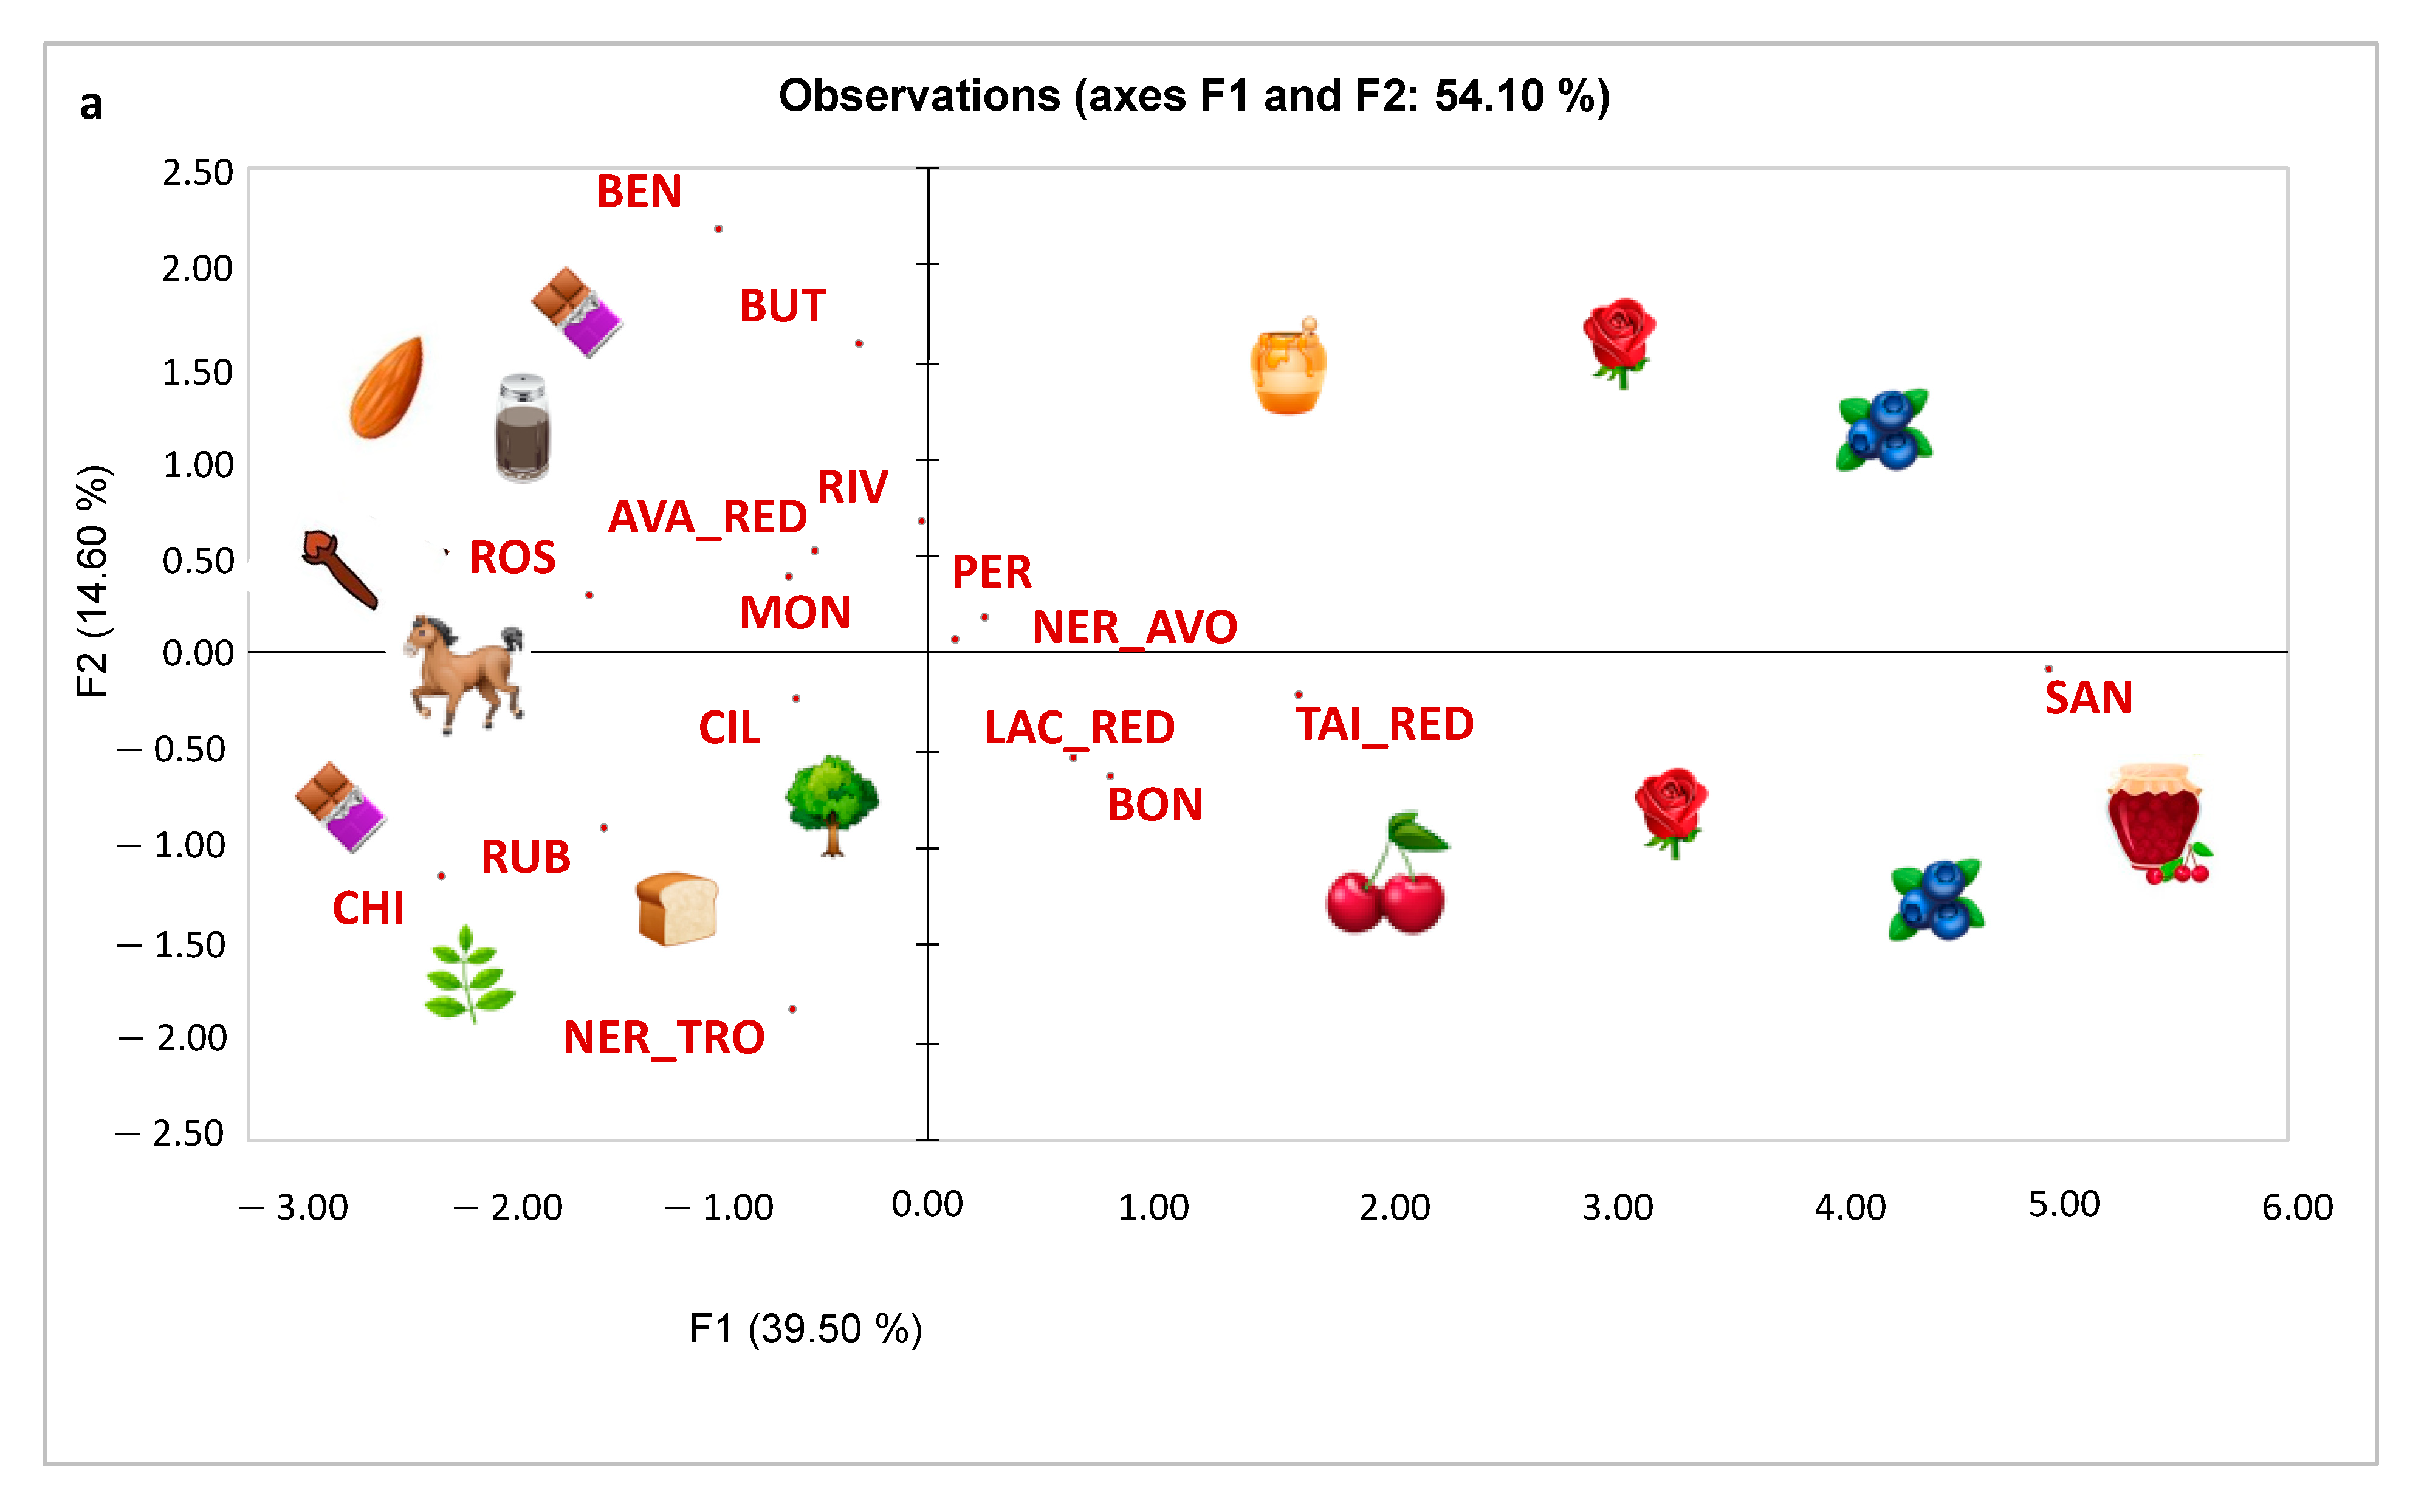
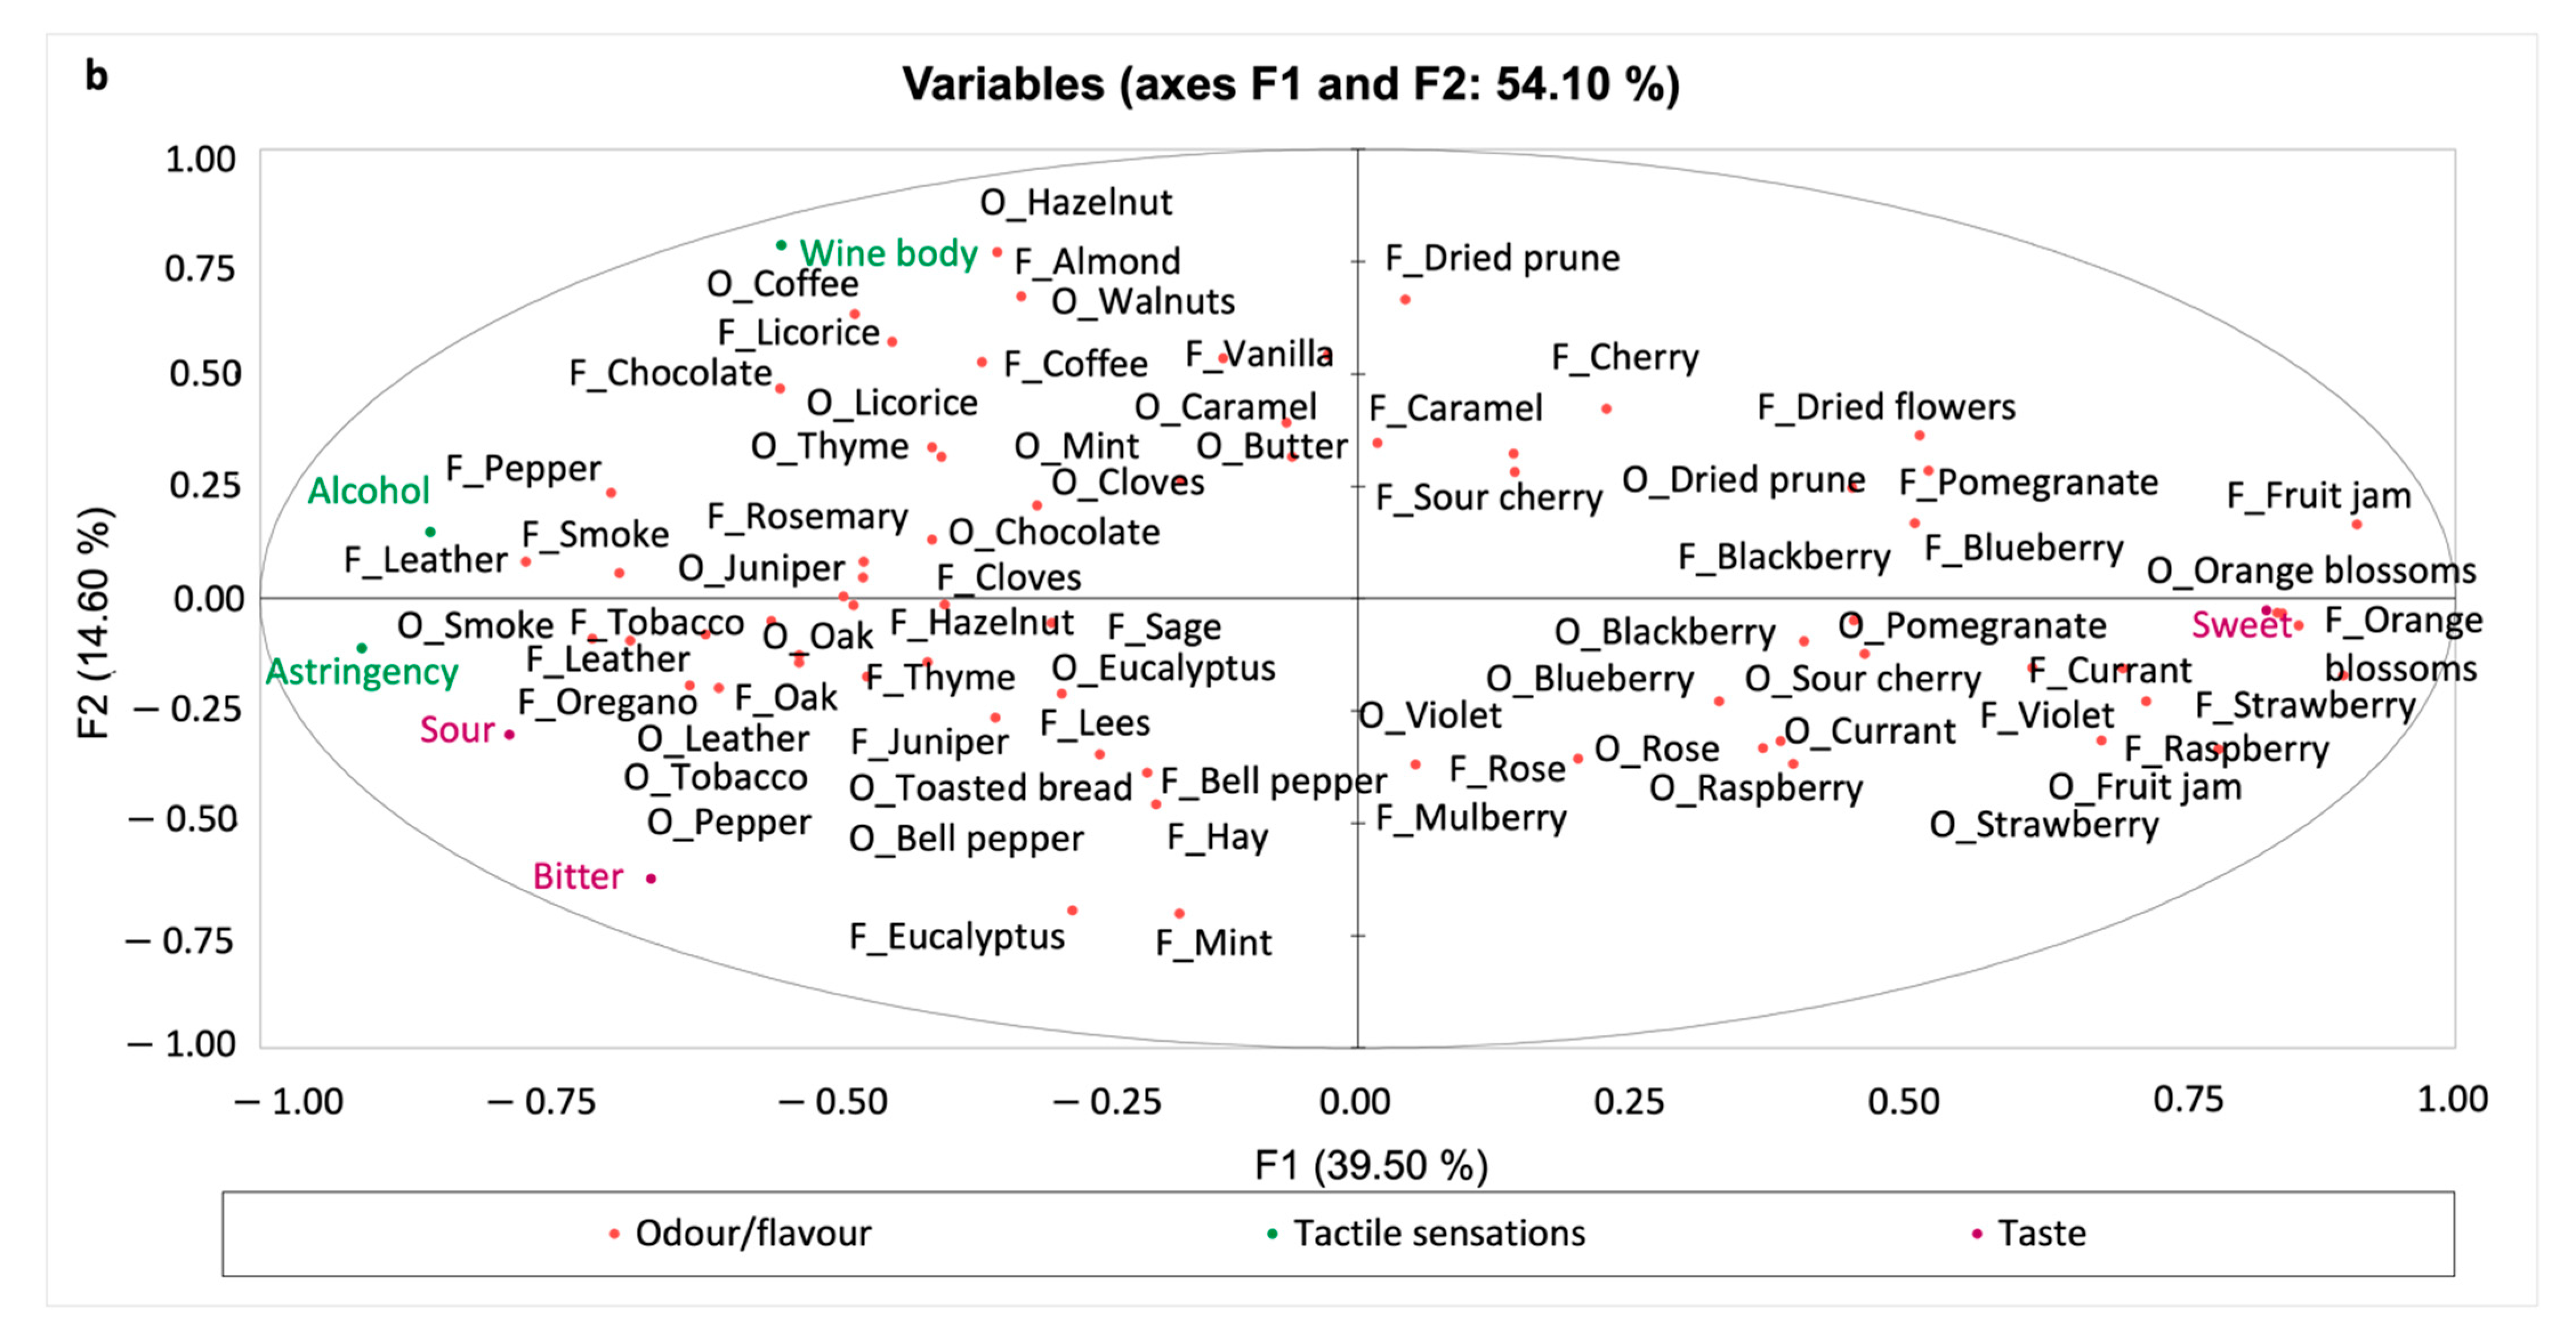
3.2.2. Red Wines
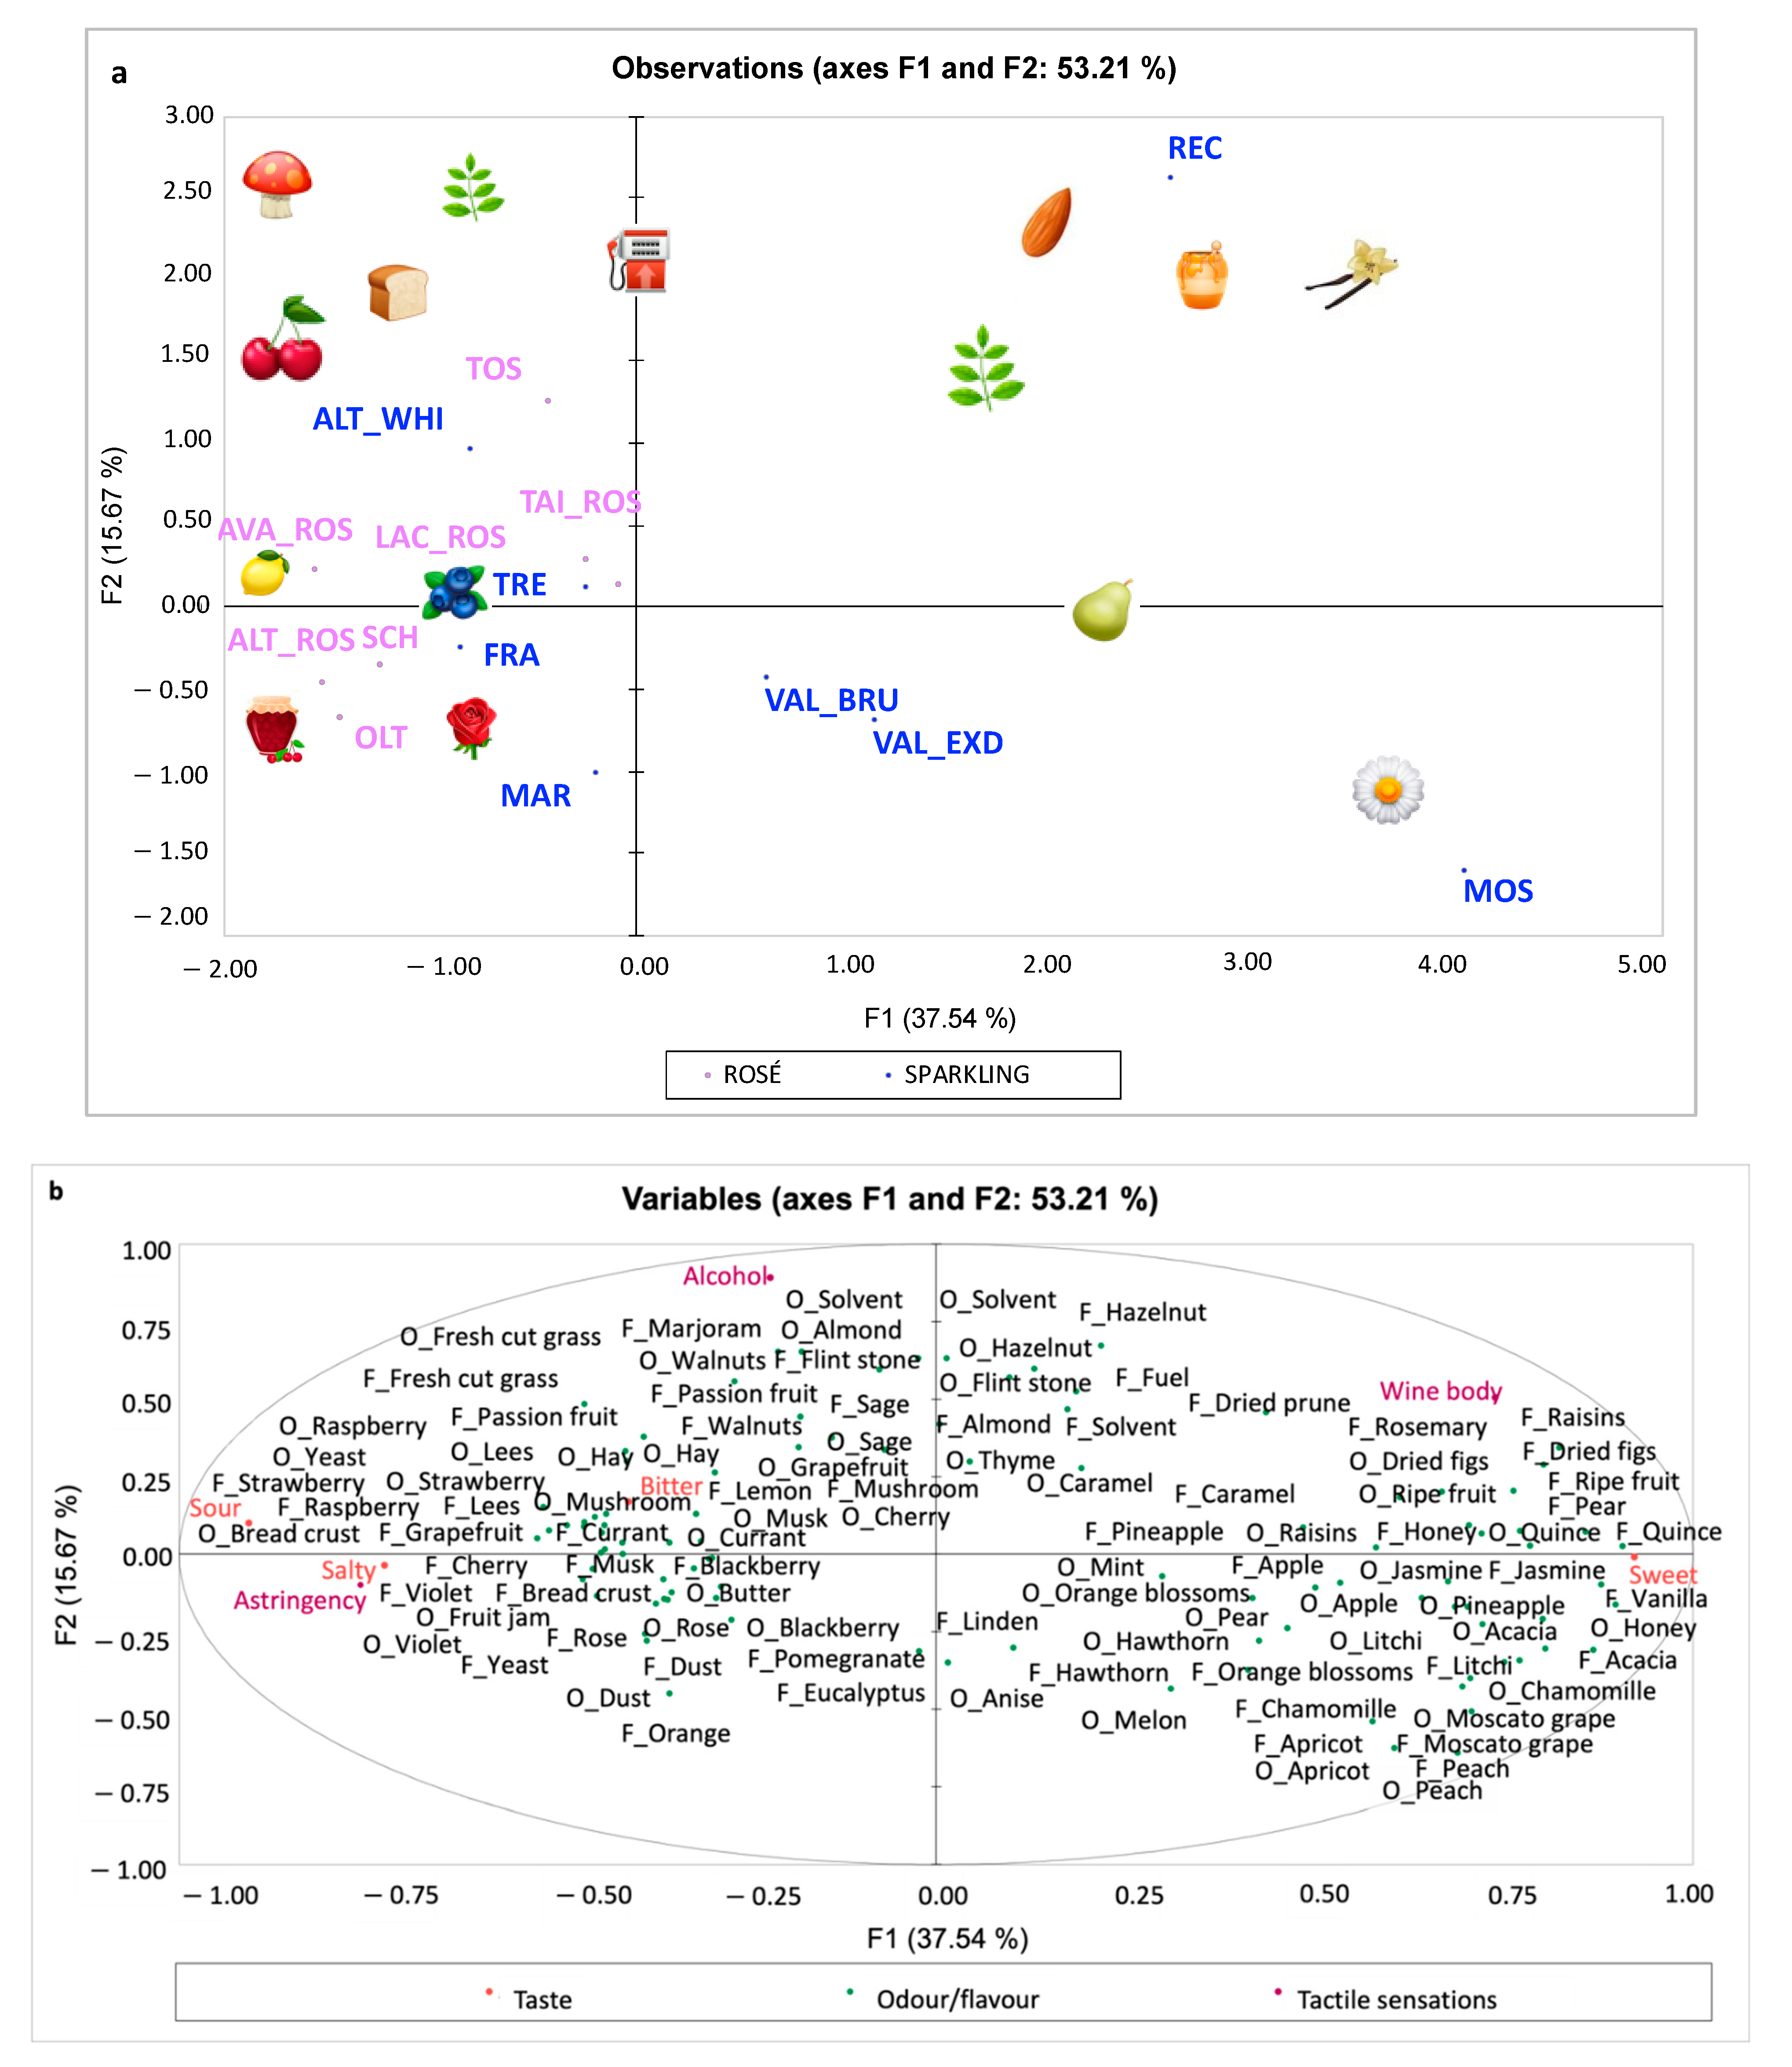
3.2.3. Rosé and White Sparkling Wines
4. Discussion
5. Conclusions
Supplementary Materials
Author Contributions
Funding
Institutional Review Board Statement
Informed Consent Statement
Data Availability Statement
Conflicts of Interest
References
- OIV (International Organisation of Vine and Wine). State of the World Vitivinicultural Sector in 2021; International Organisation of Vine and Wine: Paris, France, 2022. Available online: https://www.oiv.int/public/medias/8778/eng-state-of-the-world-vine-and-wine-sector-april-2022-v6.pdf (accessed on 25 July 2022).
- MIPAAF. Registro Nazionale delle Varietà di Vite, MIPAAF (D.M. 29 luglio 2021). Available online: http://catalogoviti.politicheagricole.it/catalogo.php (accessed on 21 February 2022).
- Pomarici, E.; Corsi, A.; Mazzarino, S.; Sardone, R. The Italian Wine Sector: Evolution, Structure, Competitiveness and Future Challenges of an Enduring Leader. Ital. Econ. J. 2021, 7, 259–295. [Google Scholar] [CrossRef]
- Asero, V.; Patti, S. From Wine Production to Wine Tourism Experience: The Case of Italy. 2009. Available online: https://www.researchgate.net/publication/46471640_From_Wine_Production_to_Wine_Tourism_Experience_The_Case_of_Italy (accessed on 21 February 2022).
- Langstaff, S.A. Sensory quality control in the wine industry. In Sensory Analysis for Food and Beverage Quality Control; Woodhead Publishing: Sawston, UK; Cambridge, UK, 2010; pp. 236–261. [Google Scholar]
- ISO 8402:1994; Quality Management and Quality Assurance—Vocabulary. International Organization for Standardization: Geneva, Switzerland, 1994.
- Lawless, H.T.; Heymann, H. Sensory Evaluation of Food: Principles and Practices, 2nd ed.; Springer Science & Business Media: Ithaca, NY, USA, 2010. [Google Scholar]
- Stone, H. Sensory evaluation by quantitative descriptive analysis. Food Technol. 1974, 28, 24. [Google Scholar] [CrossRef]
- UNI EN ISO 13299; Sensory Analysis—Methodology—General Guidance for Establishing a Sensory Profile. International Organization for Standardization: Geneva, Switzerland, 2016.
- Danner, L.; Crump, A.M.; Croker, A.; Gambetta, J.M.; Johnson, T.E.; Bastian, S.E. Comparison of Rate-All-That-Apply and Descriptive Analysis for the Sensory Profiling of Wine. Am. J. Enol. Vitic. 2018, 69, 12–21. [Google Scholar] [CrossRef]
- Varela, P.; Ares, G. Sensory profiling, the blurred line between sensory and consumer science. A review of novel methods for product characterization. Food Res. Int. 2012, 48, 893–908. [Google Scholar] [CrossRef]
- Dairou, V.; Sieffermann, J.M.A. Comparison of 14 Jams Characterized by Conventional Profile and a Quick Original Method, the Flash Profile. J. Food Sci. 2002, 67, 826–834. [Google Scholar] [CrossRef]
- Adams, J.; Williams, A.; Lancaster, B.; Foley, M. Advantages and uses of check-all-that-apply response compared to traditional scaling of attributes for salty snacks. In Proceedings of the 7th Pangborn Sensory Science Symposium, Minneapolis, MN, USA, 12–16 August 2007. [Google Scholar]
- Reinbach, H.C.; Giacalone, D.; Ribeiro, L.M.; Bredie, W.L.; Frøst, M.B. Comparison of three sensory profiling methods based on consumer perception: CATA, CATA with intensity and Napping®. Food Qual. Prefer. 2014, 32, 160–166. [Google Scholar] [CrossRef]
- Ares, G.; Bruzzone, F.; Vidal, L.; Cadena, R.S.; Giménez, A.; Pineau, B.; Hunter, D.C.; Paisley, A.G.; Jaeger, S.R. Evaluation of a rating-based variant of check-all-that-apply questions: Rate-all-that-apply (RATA). Food Qual. Prefer. 2014, 36, 87–95. [Google Scholar] [CrossRef]
- Valentin, D.; Chollet, S.; Lelièvre, M.; Abdi, H. Quick and dirty but still pretty good: A review of new descriptive methods in food science. Int. J. Food Sci. Technol. 2012, 47, 1563–1578. [Google Scholar] [CrossRef]
- Delarue, J. The use of rapid sensory methods in R&D and research: An introduction. In Rapid Sensory Profiling Techniques: Applications in New Product Development and Consumer Research; Delarue, J., Lawlor, J.B., Rogeaux, M., Eds.; Woodhead Publishing: Oxford, UK, 2015. [Google Scholar]
- Ares, G.; Barreiro, C.; Deliza, R.; Giménez, A.; Gámbaro, A. Application of a check-all-that-apply question to the development of chocolate milk desserts. J. Sens. Stud. 2010, 25, 67–86. [Google Scholar] [CrossRef]
- Meyners, M.; Jaeger, S.R.; Ares, G. On the analysis of Rate-All-That-Apply (RATA) data. Food Qual. Prefer. 2016, 49, 1–10. [Google Scholar] [CrossRef]
- Giacalone, D.; Hedelund, P.I. Rate-all-that-apply (RATA) with semi-trained assessors: An investigation of the method reproducibility at assessor-, attribute- and panel-level. Food Qual. Prefer. 2016, 51, 65–71. [Google Scholar] [CrossRef]
- Ares, G.; Tarrega, A.; Izquierdo, L.; Jaeger, S.R. Investigation of the number of consumers necessary to obtain stable sample and descriptor configurations from check-all-that-apply (CATA) questions. Food Qual. Prefer. 2014, 31, 135–141. [Google Scholar] [CrossRef]
- Franco-Luesma, E.; Sáenz-Navajas, M.P.; Valentin, D.; Ballester, J.; Rodrigues, H.; Ferreira, V. Study of the effect of H 2 S, MeSH and DMS on the sensory profile of wine model solutions by Rate-All-That-Apply (RATA). Food Res. Int. 2016, 87, 152–160. [Google Scholar] [CrossRef] [PubMed]
- Mezei, L.V.; Johnson, T.E.; Goodman, S.; Collins, C.; Bastian, S.E.P. Meeting the demands of climate change: Australian consumer acceptance and sensory profiling of red wines produced from non-traditional red grape varieties. OENO One 2020, 2, 29–46. [Google Scholar] [CrossRef]
- Nguyen, A.N.H.; Johnson, T.E.; Jeffery, D.W.; Capone, D.L.; Danner, L.; Bastian, S.E.P. Sensory and Chemical Drivers of Wine Consumers’ Preference for a New Shiraz Wine Product Containing Ganoderma lucidum Extract as a Novel Ingredient. Foods 2020, 9, 224. [Google Scholar] [CrossRef]
- Souza Gonzaga, L.; Bastian, S.E.P.; Capone, D.L.; Danner, L.; Jeffery, D.W. Consumer perspectives of wine typicity and impact of region information on the sensory perception of Cabernet Sauvignon wines. Food Res. Int. 2022, 152, 110719. [Google Scholar] [CrossRef]
- Traill, R.M.; Luckman, M.S.; Fisk, N.A.; Peng, M. Application of the Rate-All-That-Apply (RATA) method to differentiate the visual appearance of milk powders using trained sensory panels. Int. Dairy J. 2019, 97, 230–237. [Google Scholar] [CrossRef]
- Nishida, M.; Lestringant, P.; Cantu, A.; Heymann, H. Comparing classical descriptive analysis with modified descriptive analysis, modified rate-all-that-apply, and modified check-all-that-apply. J. Sens. Stud. 2021, 36, e12684. [Google Scholar] [CrossRef]
- Vinevo. Available online: www.vinevo.it (accessed on 29 March 2021).
- The masterkit–54 Aromas—Editions Jean Lenoir. Le Nez du Vin. 2022. Available online: https://www.lenez.com/it/libri-oggetto/vino/grande_cofanetto (accessed on 29 March 2021).
- Noble, A.C.; Arnold, R.A.; Buechsenstein, J.; Leach, E.J.; Schmidt, J.O.; Stern, P.M. Modification of a standardized system of wine aroma terminology. Am. J. Enol. Vitic. 1987, 38, 143–146. [Google Scholar]
- Laureati, M.; Cattaneo, C.; Tateo, F.; Bononi, M. Identification of the Volatile Compounds and Sensory Attributes of Long-Term Aging Vin Santo Wine from Malvasia di Candia Aromatic Grapes. Foods 2020, 9, 1736. [Google Scholar] [CrossRef]
- McDaniel, M.; Henderson, L.A.; Watson, B.T.; Heatherbell, D. Sensory panel training and screening for descriptive analysis of the aroma of pinot noir wine fermented by several strains of malolactic bacteria. J. Sens. Stud. 1987, 2, 149–167. [Google Scholar] [CrossRef]
- Nanou, E.; Mavridou, E.; Milienos, F.S.; Papadopoulos, G.; Tempère, S.; Kotseridis, Y. Odor Characterization of White Wines Produced from Indigenous Greek Grape Varieties Using the Frequency of Attribute Citation Method with Trained Assessors. Foods 2020, 9, 1396. [Google Scholar] [CrossRef] [PubMed]
- Pagliarini, E.; Tomaselli, N.; Brenna, O.V. Study on sensory and composition changes in italian amarone valpolicella red wine during aging. J. Sens. Stud. 2004, 19, 422–432. [Google Scholar] [CrossRef]
- Ubigli, M.; Cravero, M.C. Analisi Sensoriale e Degustazione del Vino. Descrittori e Metafore; Van Duuren Media: Culemborg, The Netherlands, 2020; pp. 51, 56, 58, 62, 64, 204. [Google Scholar]
- Ares, G.; Jaeger, S.R. Check-all-that-apply questions: Influence of attribute order on sensory product characterization. Food Qual. Prefer. 2013, 28, 141–153. [Google Scholar] [CrossRef]
- ISO 3972:2011; Sensory Analysis—Methodology—Method of Investigating Sensitivity of Taste. International Organization for Standardization: Geneva, Switzerland, 2011.
- ISO 5496:2006; Sensory Analysis—Methodology—Initiation and Training of Assessors in the Detection and Recognition of Odours. International Organization for Standardization: Geneva, Switzerland, 2006.
- OIV (International Organisation of Vine and Wine). Review on Sensory Analysis of Wine; International Organisation of Vine and Wine: Paris, France, 2015. Available online: https://www.oiv.int/public/medias/3307/review-on-sensory-analysis-of-wine.pdf (accessed on 29 March 2021).
- UNI EN ISO 8589:2014; Sensory Analysis—General Guidance for the Design of Test Rooms. International Organization for Standardization: Geneva, Switzerland, 2014.
- ISO 3591:1977; Sensory Analysis—Apparatus—Wine Tasting Glass. International Organization for Standardization: Geneva, Switzerland, 1977.
- MacFie, H.J.; Bratchell, N.; Greenhoff, K.; Vallis, L.V. Designs to balance the effect of order of presentation and first-order carry-over effects in hall tests. J. Sens. Stud. 1989, 4, 129–148. [Google Scholar] [CrossRef]
- Worch, T.; Piqueras-Fiszman, B. Contributions to assess the reproducibility and the agreement of respondents in CATA tasks. Food Qual. Prefer. 2015, 40, 137–146. [Google Scholar] [CrossRef]
- Tabachnick, B.G.; Fidell, L.S. Using Multivariate Statistics, 6th ed.; International Edition; Pearson: Boston, MA, USA, 2013.
- Emojipedia Apple Emoji List. Available online: https://emojipedia.org/apple-watch/ (accessed on 4 April 2022).
- Sinesio, F.; Moneta, E.; Di Marzo, S.; Zoboli, G.; Abbà, S. Influence of wine traits and context on liking, intention to consume, wine-evoked emotions and perceived sensory sensations. Food Qual. Prefer. 2021, 93, 104268. [Google Scholar] [CrossRef]
- Hopfer, H.; Heymann, H. Judging wine quality: Do we need experts, consumers or trained panelists? Food Qual. Prefer. 2014, 32, 221–233. [Google Scholar] [CrossRef]
- Cimini, A.; Moresi, M. Research trends in the oenological and viticulture sectors. Aust. J. Grape Wine Res. 2022, 28, 475–491. [Google Scholar] [CrossRef]
- Llobodanin, L.G.; Barroso, L.P.; Castro, I.A. Sensory Characterization of Young South American Red Wines Classified by Varietal and Origin. J. Food Sci. 2014, 79, S1595–S1603. [Google Scholar] [CrossRef]
- Kontkanen, D.; Reynolds, A.G.; Cliff, M.A.; King, M. Canadian terroir: Sensory characterization of Bordeaux-style red wine varieties in the Niagara Peninsula. Food Res. Int. 2005, 38, 417–425. [Google Scholar] [CrossRef]
- Goldner, M.C.; Zamora, M.C. Sensory characterization of vitis vinifera cv. Malbec wines from seven viticulture regions of argentina. J. Sens. Stud. 2007, 22, 520–532. [Google Scholar] [CrossRef]
- Ilkjær, T.; Lolli, P.; Ronold, A.; Udsen, O. Italiensk Vin; Politikens Forlag: Copenhagen, Denmark, 2019. [Google Scholar]
- Bene, Z. Renewed Conceptions of Traditions in Hungarian Gastronomy via Example of Orange Wines. Manag. Stud. 2018, 6, 367–374. [Google Scholar] [CrossRef]
- Asproudi, A.; Borsa, D.; Cravero, M.C.; Bonello, F. Effetti dell’iperossidazione e della ossidazione controllata sulla qualità di vini vermentino. L’Enologo 2011, 47, 77–82. [Google Scholar]
- Robinson, J.; Harding, J.; Vouillamoz, J. Wine Grapes: A Complete Guide to 1,368 Vine Varieties, Including Their Origins and Flavours; Penguin: London, UK, 2012. [Google Scholar]
- Dalla Vedova, A.; Panighel, A.; Giorgessi, F.; Flamini, R.; Calò, A. Indagine Chimico-Organolettica di Alcuni Vini di Fiano Pugliesi. 2009. Available online: https://www.aivv.it/Archivio/Atti/R026_0909_2060_DallaVedova.pdf (accessed on 4 April 2022).
- Genovese, A.; Gambuti, A.; Piombino, P.; Moio, L. Sensory properties and aroma compounds of sweet Fiano wine. Food Chem. 2007, 103, 1228–1236. [Google Scholar] [CrossRef]
- Carlucci, A.; Monteleone, E. A procedure of sensory evaluation for describing the aroma profile of single grape variety wines. J. Sens. Stud. 2008, 23, 817–834. [Google Scholar] [CrossRef]
- Mazzaglia, A.; Lanza, C.M. Physicochemical and Sensory Characterization of Malvasia Wines from Different Mediterranean Areas. J. Food Qual. 2018, 2018, 2398149. [Google Scholar] [CrossRef]
- Crespo, J.; Romero, V.; García, M.; Arroyo, T.; Cabellos, J.M. Influence of Skin-Contact Treatment on Aroma Profile of Malvasia Aromatica Wines in DO “Vinos de Madrid”. In Grapes and Wine; Morata, A., Loira, I., Gonzaleza, C., Eds.; IntechOpen: London, UK, 2021. [Google Scholar]
- Bavaresco, L.; Calza, E.; Grosu, A.; Lucini, L.; Braceschi, G.; Odello, L. Risultati preliminari sulla caratterizzazione metabolomica e sensoriale del vino di Malvasia di Candia aromatica prodotto nel Piacentino. In Proceedings of the VI Simposio Internazionale delle Malvasie nel Bacino del Mediterraneo, Accademia Italiana della Vite e del Vino, Alghero, Italia, 6–9 September 2018. [Google Scholar]
- Boscaino, F.; Cutri, G.; Volpe, M.G.; Blaiotta, G.; Sorrentino, A. Evolution of polyphenols, volatile aroma compounds and natural yeast flora of Coda di Volpe white grape. Chem. Eng. Trans. 2015, 43, 7–12. [Google Scholar] [CrossRef]
- Palliotti, A.; Gardi, T.; Berrios, J.G.; Civardi, S.; Poni, S. Early source limitation as a tool for yield control and wine quality improvement in a high-yielding red Vitis vinifera L. cultivar. Sci. Hortic. 2012, 145, 10–16. [Google Scholar] [CrossRef]
- Baiano, A.; Mentana, A.; Quinto, M.; Centonze, D.; Previtali, M.A.; Varva, G.; Del Nobile, M.A.; De Palma, L. Volatile composition and sensory profile of wines obtained from partially defoliated vines: The case of Nero di Troia wine. Eur. Food Res. Technol. 2016, 243, 247–261. [Google Scholar] [CrossRef]
- Torri, L.; Dinnella, C.; Recchia, A.; Naes, T.; Tuorila, H.; Monteleone, E. Projective Mapping for interpreting wine aroma differences as perceived by naïve and experienced assessors. Food Qual. Prefer. 2013, 29, 6–15. [Google Scholar] [CrossRef]
- Rinaldi, A.; Moine, V.; Moio, L. Astringency subqualities and sensory perception of Tuscan Sangiovese wines. OENO One 2020, 54, 75–85. [Google Scholar] [CrossRef]
- Alessandrini, M.; Gaiotti, F.; Belfiore, N.; Matarese, F.; D’Onofrio, C.; Tomasi, D. Influence of vineyard altitude on Glera grape ripening (Vitis vinifera L.): Effects on aroma evolution and wine sensory profile. J. Sci. Food Agric. 2016, 97, 2695–2705. [Google Scholar] [CrossRef] [PubMed]
- Simonato, B.; Lorenzini, M.; Cipriani, M.; Finato, F.; Zapparoli, G. Correlating Noble Rot Infection of Garganega Withered Grapes with Key Molecules and Odorants of Botrytized Passito Wine. Foods 2019, 8, 642. [Google Scholar] [CrossRef]
- D’Amato, A.; Fasoli, E.; Kravchuk, A.V.; Righetti, P.G. Mehercules, adhuc Bacchus! The Debate on Wine Proteomics Continues. J. Proteome Res. 2011, 10, 3789–3801. [Google Scholar] [CrossRef]
- Tomasi, D.; Gaiotti, F.; Jones, G.V. Microstructure of the Grape: Aromatic Precursors in Relationship to Climate, Microclimate and Growing Practices. In The Power of the Terroir: The Case Study of Prosecco Wine; Springer: New York, NY, USA, 2013; pp. 127–147. [Google Scholar]
- Peynaud, E. Le Goût du Vin (French Edition), 1st ed.; Dunod: Malakoff, France, 1980. [Google Scholar]
- Ribèreau-Gayon, P.; Glories, Y.; Maujean, A.; Dubourdieu, D. Trattato di Enologia, Microbiologia del Vino. Vinificazioni; Edagricole: Bologna, Italy, 2000. [Google Scholar]
- Jackson, R.S. Wine Tasting: A Professional Handbook (Food Science and Technology), 3rd ed.; Academic Press: Cambridge, MA, USA, 2002. [Google Scholar]
- King, E.S.; Swiegers, J.H.; Travis, B.; Francis, I.L.; Bastian, S.E.; Pretorius, I.S. Coinoculated fermentations using Saccharomyces yeasts affect the volatile composition and sensory properties of Vitis vinifera L. cv. Sauvignon blanc wines. J. Agric. Food Chem. 2008, 56, 10829–10837. [Google Scholar] [CrossRef]

| Label | Type | Wine | Grape Variety | Area of Production | Vintage | Vol.% |
|---|---|---|---|---|---|---|
| ALB | White | Romagna Albana DOCG | 100% Albana | Forlì-Cesena, Emilia-Romagna, Centre of Italy | 2018 | 14.5 vol.% |
| BIA | White | Ischia DOC Biancolella | 100% Biancolella | Ischia Island, Campania, Southern Italy | 2018 | 13 vol.% |
| COD | White | Coda di Volpe DOC | 100% Coda di Volpe | Avellino, Campania, Southern Italy | 2019 | 13 vol.% |
| FIA | White | Fiano di Avellino DOCG | 100% Fiano | Avellino, Campania, Southern Italy | 2019 | 13 vol.% |
| GAM | White | Gambellara Classico DOC | 100% Garganega | Vicenza, Veneto, Northern Italy | 2018 | 13 vol.% |
| LUG | White | Lugana Riserva DOC | 100% Turbiana | Brescia, Lombardia, Northern Italy | 2017 | 14 vol.% |
| KER | White | Vigneti delle Dolomiti IGT, Kerner | 100% Kerner | Trento, Trentino-Alto Adige, Northern Italy | 2019 | 13.5 vol.% |
| NOS_PAL | White | Nosiola Palustella Trentino DOC (Organic) | 100% Nosiola Trentina | Trento, Trentino-Alto Adige, Northern Italy | 2019 | 12.5 vol.% |
| NOS_VIG | White | Vigneti delle Dolomiti IGT, Nosiola (Organic) | 100% Nosiola | Trento, Trentino-Alto Adige, Northern Italy | 2019 | 12.5 vol.% |
| PIG | White | Colli Bolognesi Pignoletto Superiore DOCG | 100% Grechetto gentile | Bologna, Emilia-Romagna, Centre of Italy | 2019 | 13.5 vol.% |
| COL | White | Collio Ribolla Gialla DOC | 100% Ribolla Gialla | Gorizia, Friuli-Venezia Giulia, Northern Italy | 2019 | 12.5 vol.% |
| VRM | White | Vermentino DOC | 100% Vermentino | Oristano, Sardegna, Centre of Italy | 2018 | 13.5 vol.% |
| VRD | White | Verdicchio Dei Castelli Di Jesi DOC Classico Superiore (Organic) | 100% Verdicchio | Ancona, Marche, Centre of Italy | 2019 | 12.5 vol.% |
| PEC | White | Pecorino DOP (Organic) | 100% Pecorino | Teramo, Abruzzo, Centre of Italy | 2018 | 12.5 vol.% |
| MAL | White | Collio Malvasia DOC | 100% Malvasia | Gorizia, Friuli-Venezia Giulia, Northern Italy | 2019 | 13 vol.% |
| RUB | Red | Rubicone Centesimino IGT(Organic) | 100% Centesimino | Forlì-Cesena, Emilia-Romagna, Centre of Italy | 2019 | 15 vol.% |
| RIV | Red | Riviera del Garda Classico DOC | 85% Groppello, 15% Marzemino, Sangiovese and Barbera | Brescia, Lombardia, Northern Italy | 2019 | 13.5 vol.% |
| BEN | Red | Benaco Bresciano IGT | 70% Rebo, 15% Cabernet Sauvignon, 15% Marzemino appassito | Brescia, Lombardia, Northern Italy | 2017 | 14.5 vol.% |
| MON | Red | Colline Teramane Montepulciano d’Abruzzo DOCG | 100% Montepulciano d’Abruzzo | Teramo, Abruzzo, Centre of Italy | 2018 | 13.5 vol.% |
| PER | Red | Perricone Terre Siciliane IGT (Organic) | 100% Perricone | Agrigento, Sicilia, Southern Italy | 2020 | 12 vol.% |
| NER_AVO | Red | Nero d’Avola Menfi DOC (Organic) | 100% Nero d’Avola | Agrigento, Sicilia, Southern Italy | 2020 | 12.5 vol.% |
| ROS | Red | Rossese Di Dolceacqua Superiore DOC | 97% Rossese di Ventimiglia, 3% red non-aromatic grapes | Imperia, Liguria, Northern Italy | 2019 | 13.5 vol.% |
| LAC_RED | Red | Lacrima di Morro d’Alba DOC (Organic) | 100% Lacrima | Ancona, Marche, Centre of Italy | 2020 | 13 vol.% |
| BON | Red sparkling | Bonarda dell’Oltrepò Pavese DOC | 100% Croatina | Pavia, Lombardia, Northern Italy | 2020 | 13.5 vol.% |
| BUT | Red sparkling | Buttafuoco dell’Oltrepò Pavese DOC | Croatina, Barbera and Ughetta di Solinga (variable % depending on vintages) | Pavia, Lombardia, Northern Italy | 2019 | 13.5 vol.% |
| CHI | Red | Chianti Superiore DOCG | 90% Sangiovese, 10% Ciliegiolo | Pisa, Toscana, Centre of Italy | 2017 | 14 vol.% |
| AVA_RED | Red | Valsusa DOC | 100% Avanà | Torino, Piemonte, Northern Italy | 2020 | 14 vol.% |
| NER_TRO | Red | Cacc’e Mmitte Di Lucera DOC | 60% Nero di Troia, 30% Montepulciano, 10% Bombino | Foggia, Puglia, Southern Italy | 2019 | 13 vol.% |
| SAN | Red sparkling | Sangue di Giuda dell’Oltrepò Pavese DOC | 40% Croatina, 40% Barbera, 20% Uva rara | Pavia, Lombardia, Northern Italy | 2020 | 6 vol.% |
| CIL | Red | Maremma Toscana DOC | 100% Ciliegiolo | Grosseto, Toscana, Centre of Italy | 2019 | 13.5 vol.% |
| TAI_RED | Red | Colli Berici Tai Rosso DOC | 100% Tai Rosso | Vicenza, Veneto, Northern Italy | 2019 | 12 vol.% |
| TRE | White Sparkling | Trento Metodo Classico DOCG Millesimato | 100% Chardonnay | Trento, Trentino-Alto Adige, Northern Italy | 2017 | 12.5 vol.% |
| VAL_BRU | White Sparkling | Valdobbiadene DOCG Brut | 100% Glera | Treviso, Veneto, Northern Italy | 2019 | 12 vol.% |
| VAL_EXD | White Sparkling | Valdobbiadene DOCG Extra Dry | 100% Glera | Treviso, Veneto, Northern Italy | 2019 | 12 vol.% |
| FRA | White Sparkling | Franciacorta DOCG Brut | 75% Chardonnay, 20% Pinot nero5% Pinot bianco | Brescia, Lombardia, Northern Italy | 2019 | 12.5 vol.% |
| ALT_WHI | White Sparkling | Alta Langa DOCG Extra Brut | 60% Chardonnay, 40% Pinot nero | Cuneo, Piemonte, Northern Italy | 2017 | 12.5 vol.% |
| MAR | White Sparkling | Marche IGT | 80% Verdicchio, 20% Trebbiano | Ancona, Marche, Centre of Italy | 2020 | 11 vol.% |
| REC | White Sparkling | Recioto Spumante Metodo Classico DOCG | 100% Garganega | Vicenza, Veneto, Northern Italy | 2017 | 13 vol.% |
| MOS | White Sparkling | Moscato d’Asti DOCG | 100% Moscato bianco | Cuneo, Piemonte, Northern Italy | 2020 | 5.5 vol.% |
| SCH | Rosé | Vigneti delle Dolomiti IGT, Schiava | 100% Schiava | Trento, Trentino-Alto Adige, Northern Italy | 2019 | 11.5 vol.% |
| ALT_ROS | Rosé Sparkling | Alta Langa DOCG | 100% Pinot nero | Cuneo, Piemonte, Northern Italy | 2017 | 12.5 vol.% |
| LAC_ROS | Rosé Sparkling | Spumante Rosé Brut | 100% Lacrima | Ancona, Marche, Centre of Italy | 2020 | 12.5 vol.% |
| AVA_ROS | Rosé Sparkling | Sparkling Rosé wine | 100% Avanà | Torino, Piemonte, Northern Italy | 2018 | 12 vol.% |
| OLT | Rosé Sparkling | Oltrepò Pavese Metodo Classico Pinot Nero Rosé DOCG | 100% Pinot noir | Pavia, Lombardia, Northern Italy | 2018 | 12.5 vol.% |
| TAI_ROS | Rosé | Colli Berici Tai Rosato DOC | 100% Tai Rosso | Vicenza, Veneto, Northern Italy | 2020 | 12 vol.% |
| TOS | Rosé | Toscana IGT (Organic) | 100% Sangiovese | Pisa, Toscana, Centre of Italy | 2020 | 13 vol.% |
Publisher’s Note: MDPI stays neutral with regard to jurisdictional claims in published maps and institutional affiliations. |
© 2022 by the authors. Licensee MDPI, Basel, Switzerland. This article is an open access article distributed under the terms and conditions of the Creative Commons Attribution (CC BY) license (https://creativecommons.org/licenses/by/4.0/).
Share and Cite
Rabitti, N.S.; Cattaneo, C.; Appiani, M.; Proserpio, C.; Laureati, M. Describing the Sensory Complexity of Italian Wines: Application of the Rate-All-That-Apply (RATA) Method. Foods 2022, 11, 2417. https://doi.org/10.3390/foods11162417
Rabitti NS, Cattaneo C, Appiani M, Proserpio C, Laureati M. Describing the Sensory Complexity of Italian Wines: Application of the Rate-All-That-Apply (RATA) Method. Foods. 2022; 11(16):2417. https://doi.org/10.3390/foods11162417
Chicago/Turabian StyleRabitti, Noemi Sofia, Camilla Cattaneo, Marta Appiani, Cristina Proserpio, and Monica Laureati. 2022. "Describing the Sensory Complexity of Italian Wines: Application of the Rate-All-That-Apply (RATA) Method" Foods 11, no. 16: 2417. https://doi.org/10.3390/foods11162417
APA StyleRabitti, N. S., Cattaneo, C., Appiani, M., Proserpio, C., & Laureati, M. (2022). Describing the Sensory Complexity of Italian Wines: Application of the Rate-All-That-Apply (RATA) Method. Foods, 11(16), 2417. https://doi.org/10.3390/foods11162417