
Celery Root Phenols Content, Antioxidant Capacities and Their Correlations after Osmotic Dehydration in Molasses

 ,
,  ,
,  ,
,  ,
,  ,
,  , and
, and 
Abstract
:
1. Introduction
2. Materials and Methods
2.1. Material
2.2. Osmotic Dehydration
2.3. Preparation of Celery Root Extracts
2.4. Chemicals
2.5. Determination of Total Phenolic Content (TPC)
2.6. Antiradical Activity Determination by DPPH Assay
2.7. Determination of Total Reducing Power by (FRAP)
2.8. Antiradical Activity Determination by ABTS Assay
2.9. DC Polarographic Measurements of AOC
2.10. Identification and Quantification of Phenolic Compounds Using HPLC-DAD
Sample Preparation for HPLC-DAD Analysis
2.11. Statistical Analysis
3. Results and Discusion
3.1. Correlation Analysis
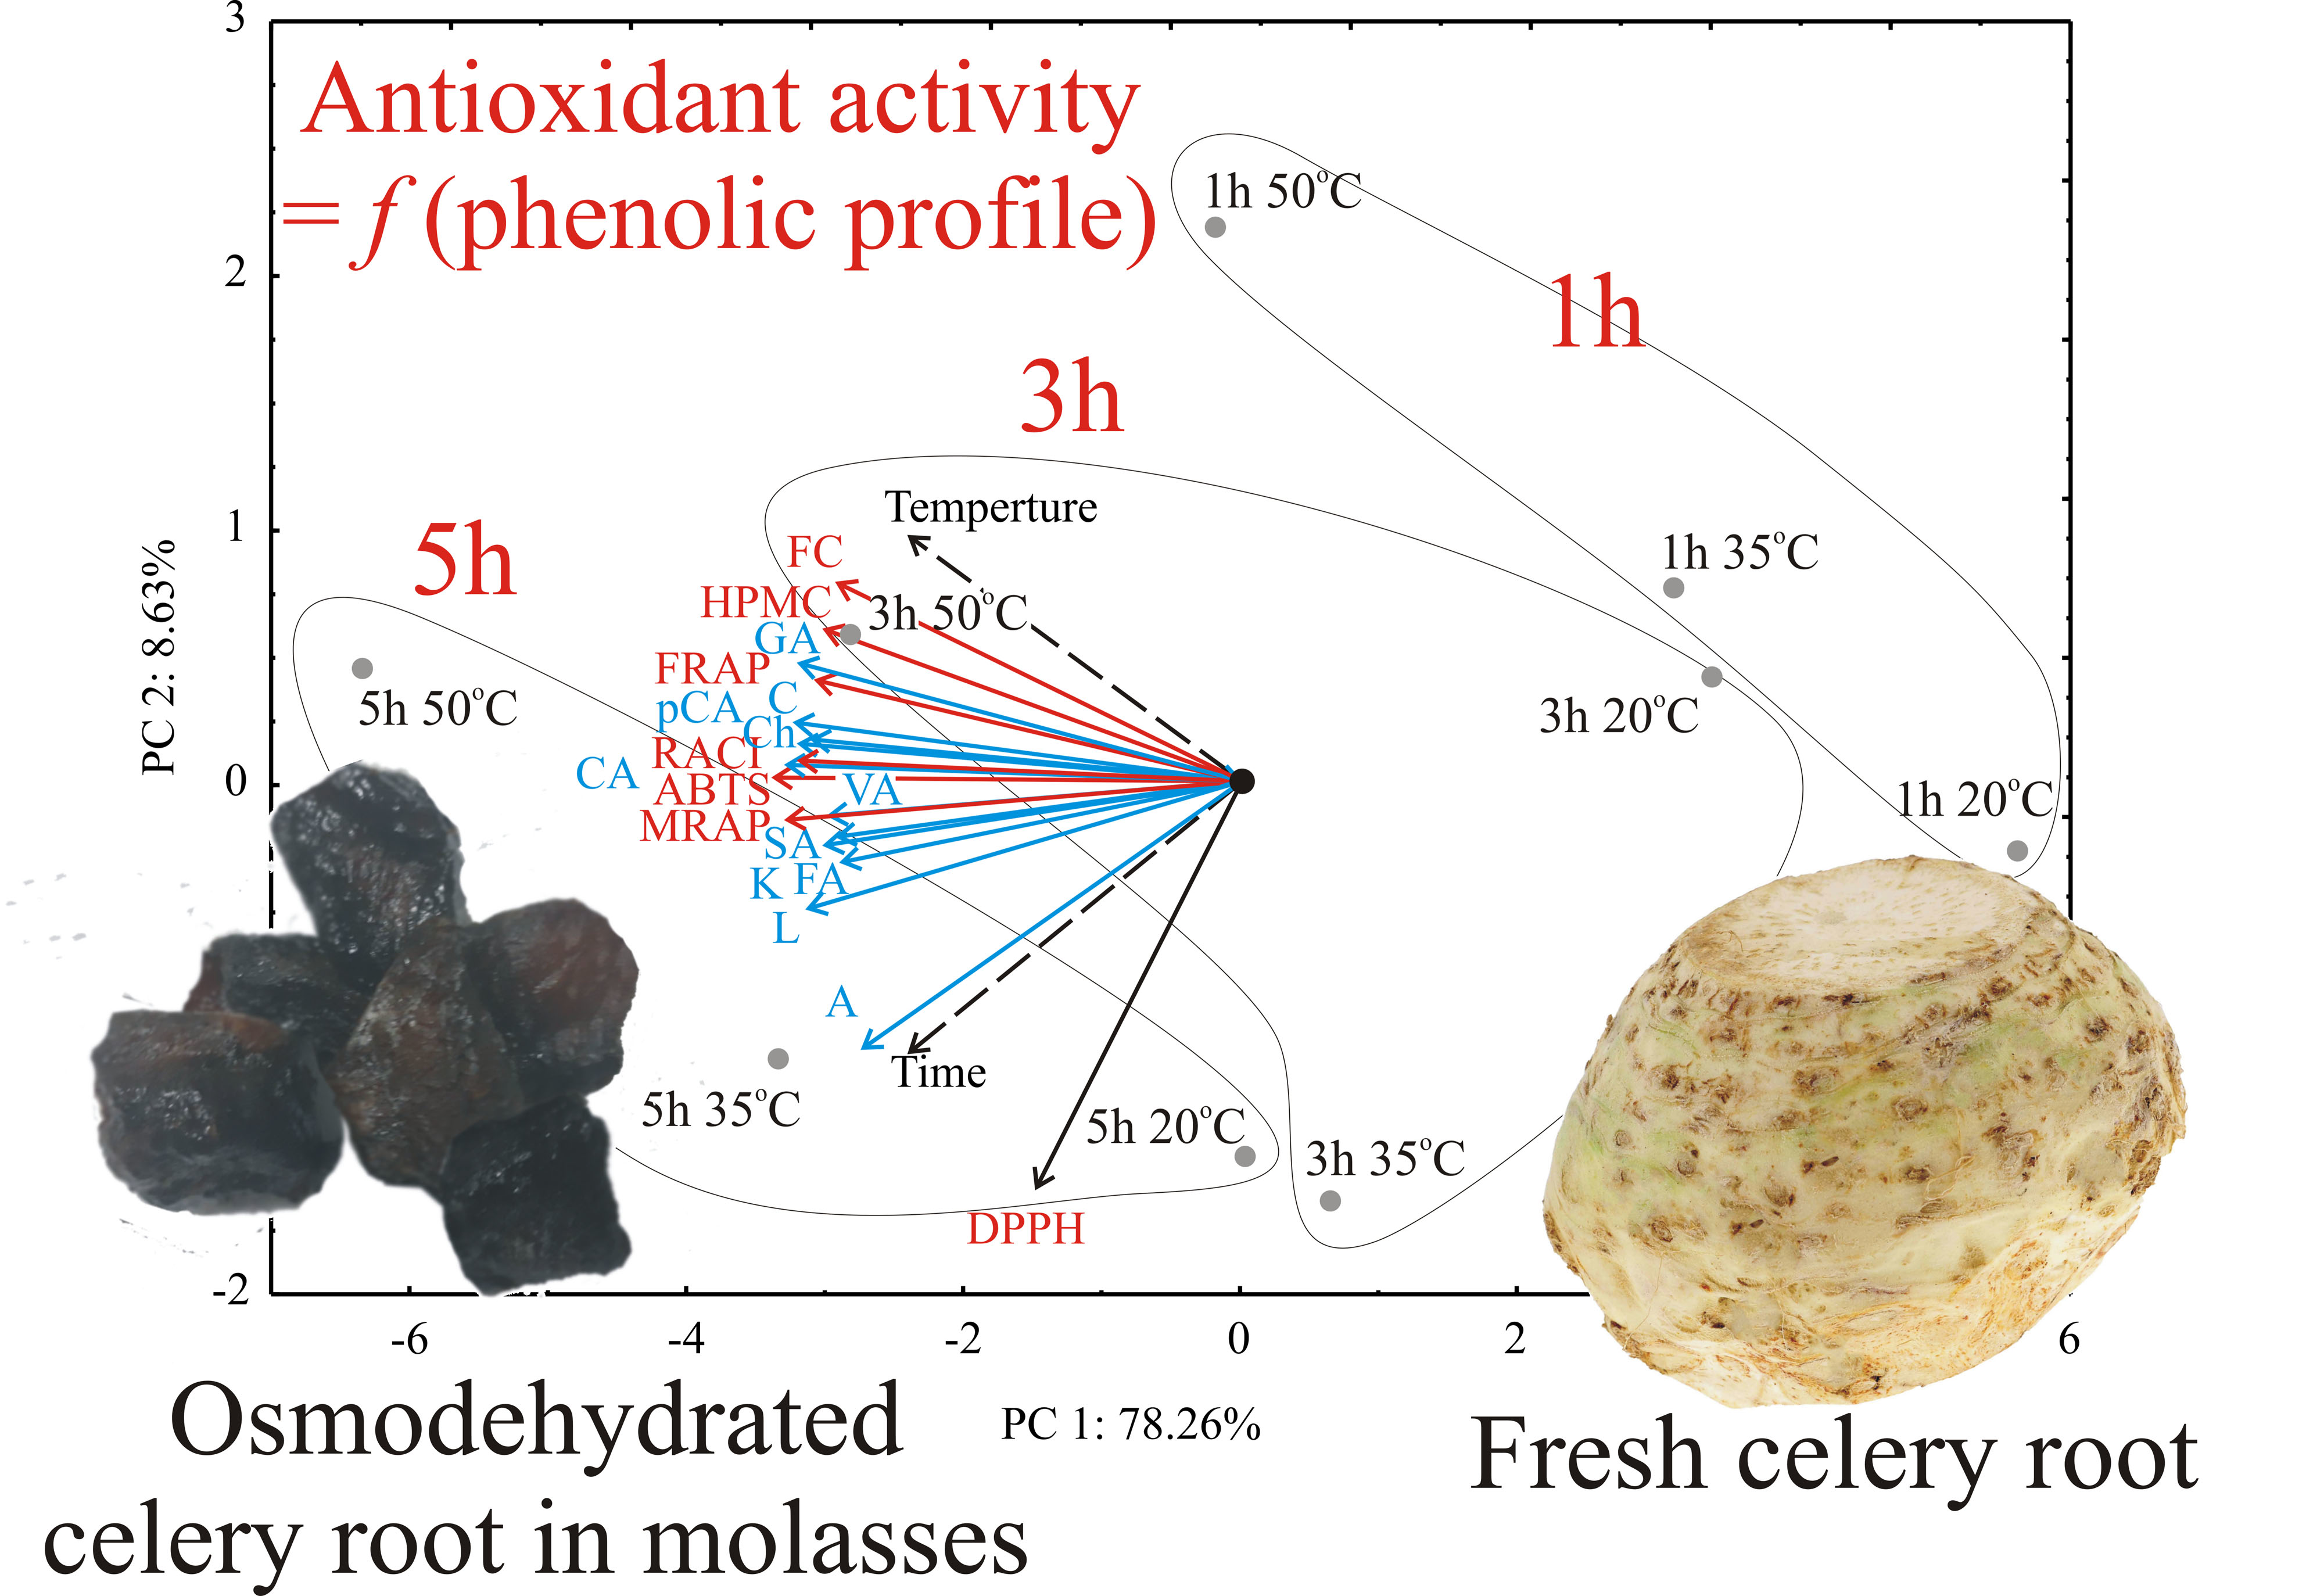
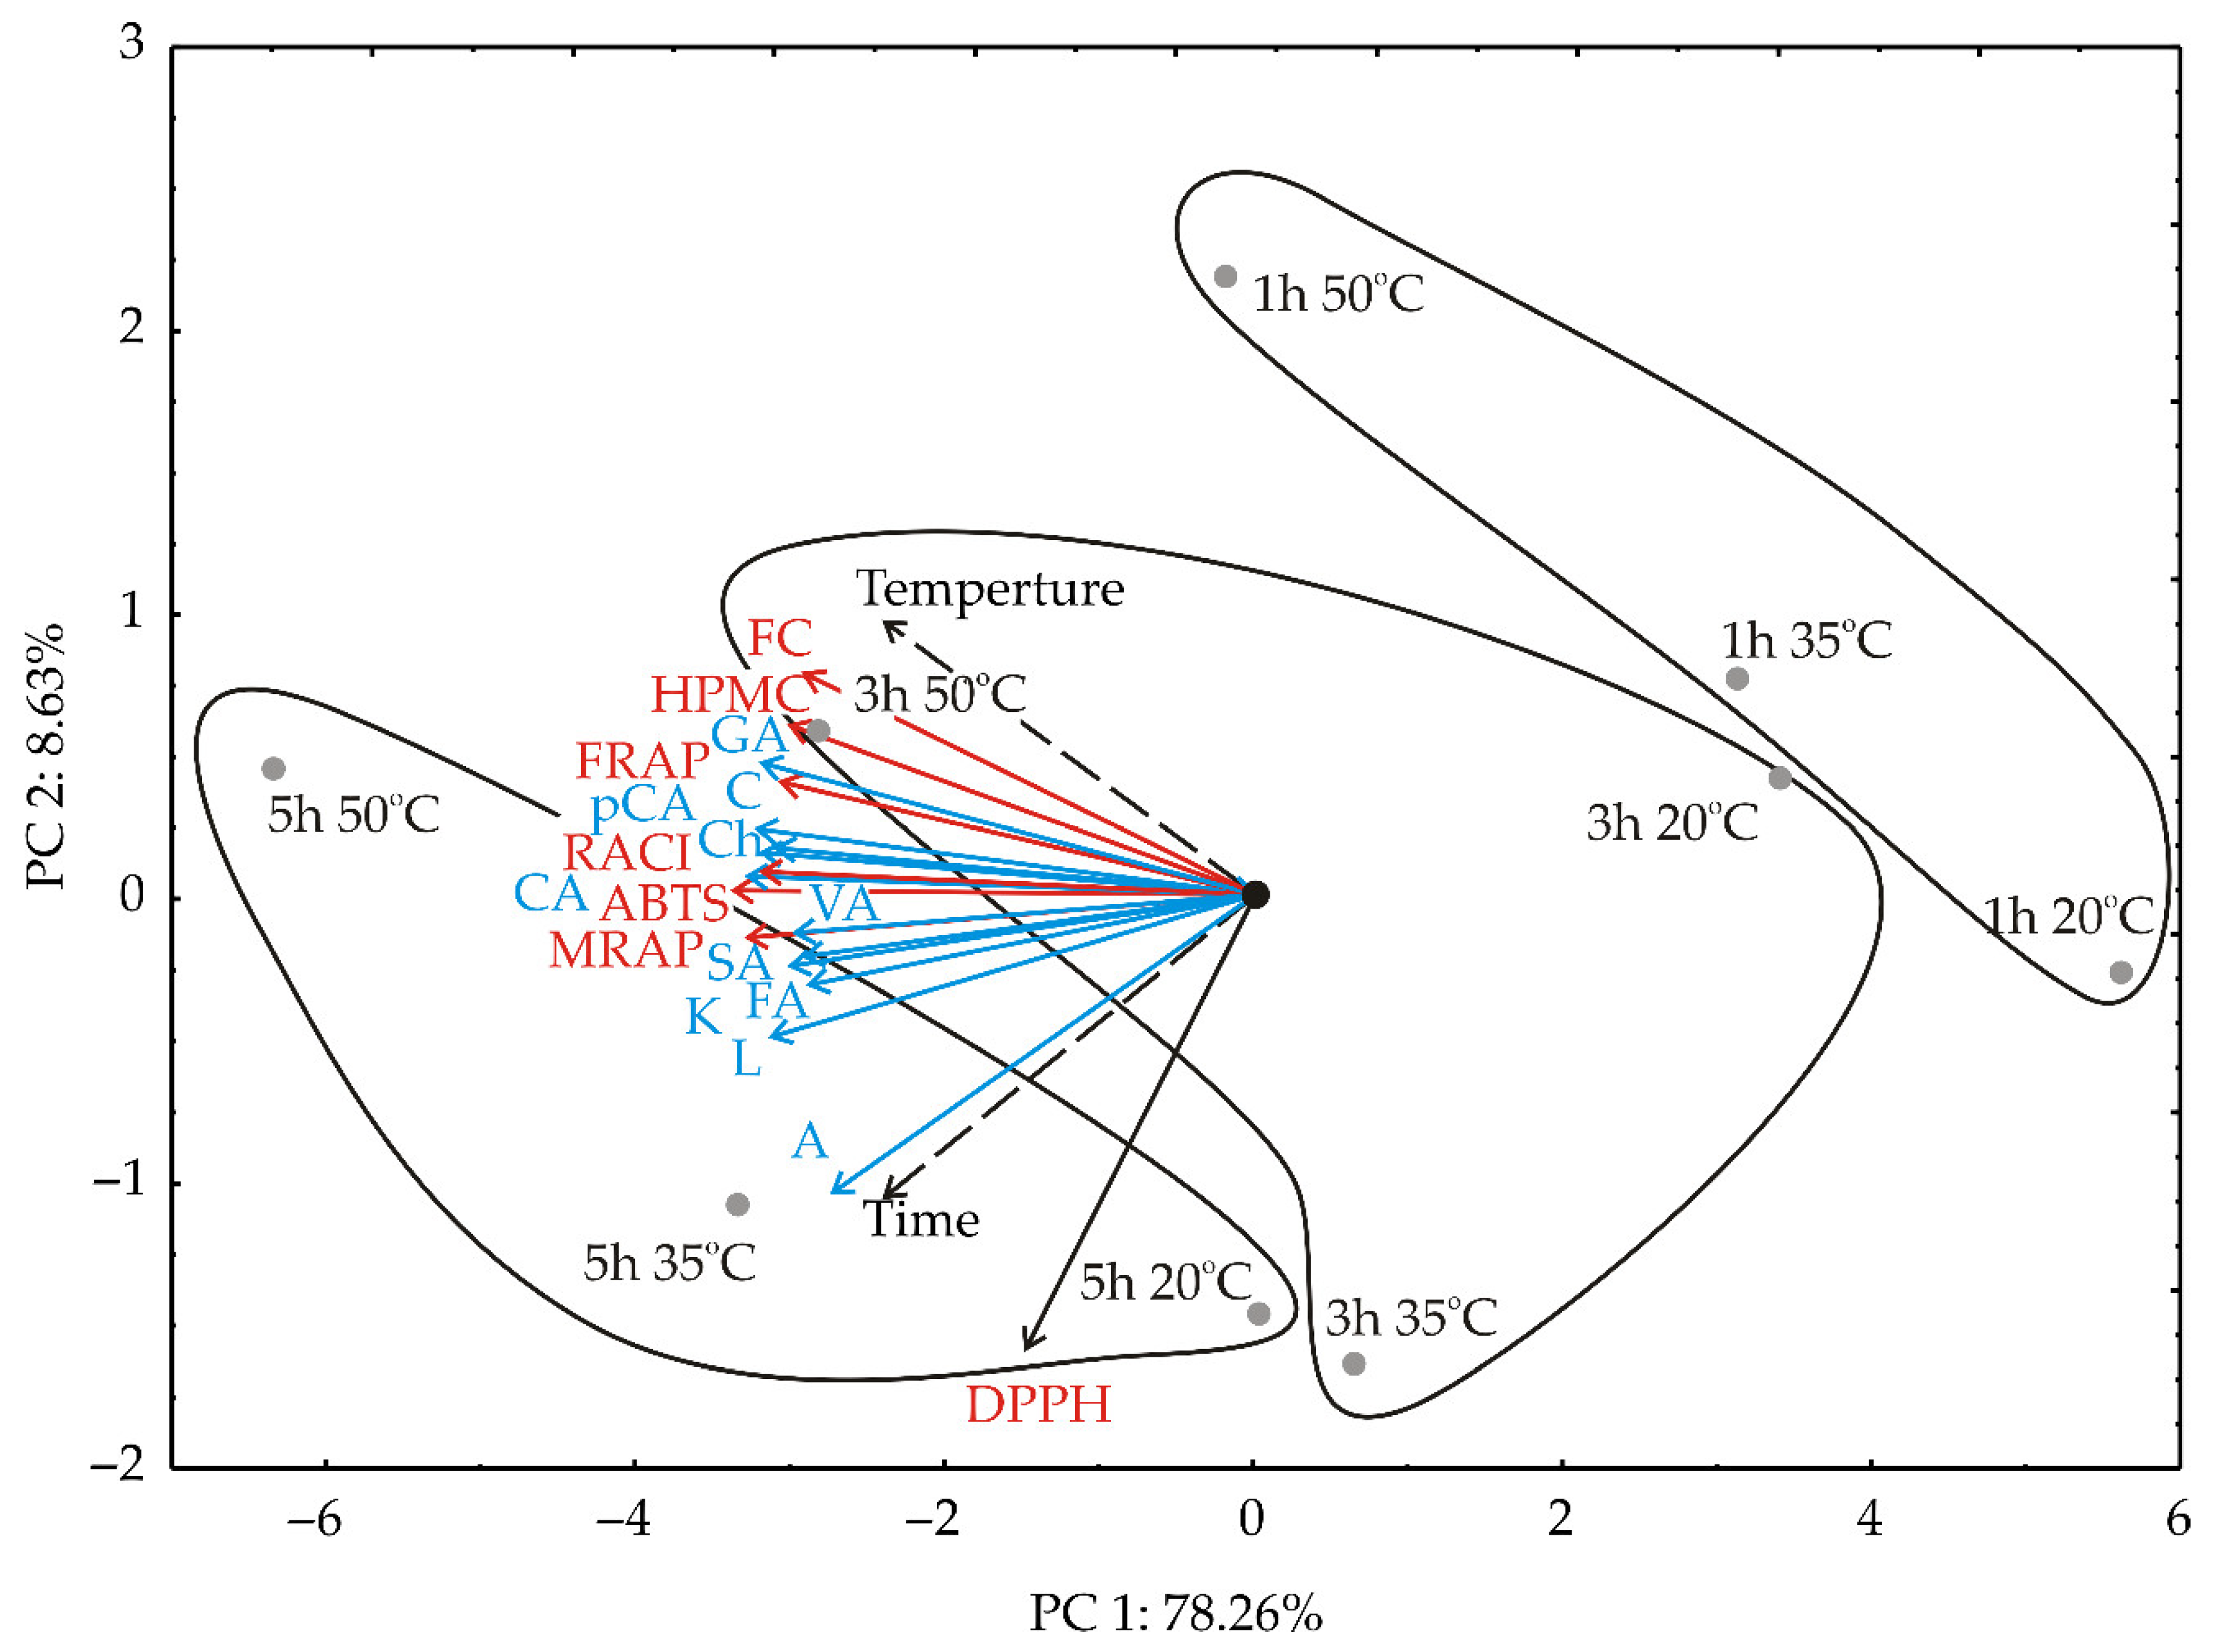
3.2. PCA Analysis
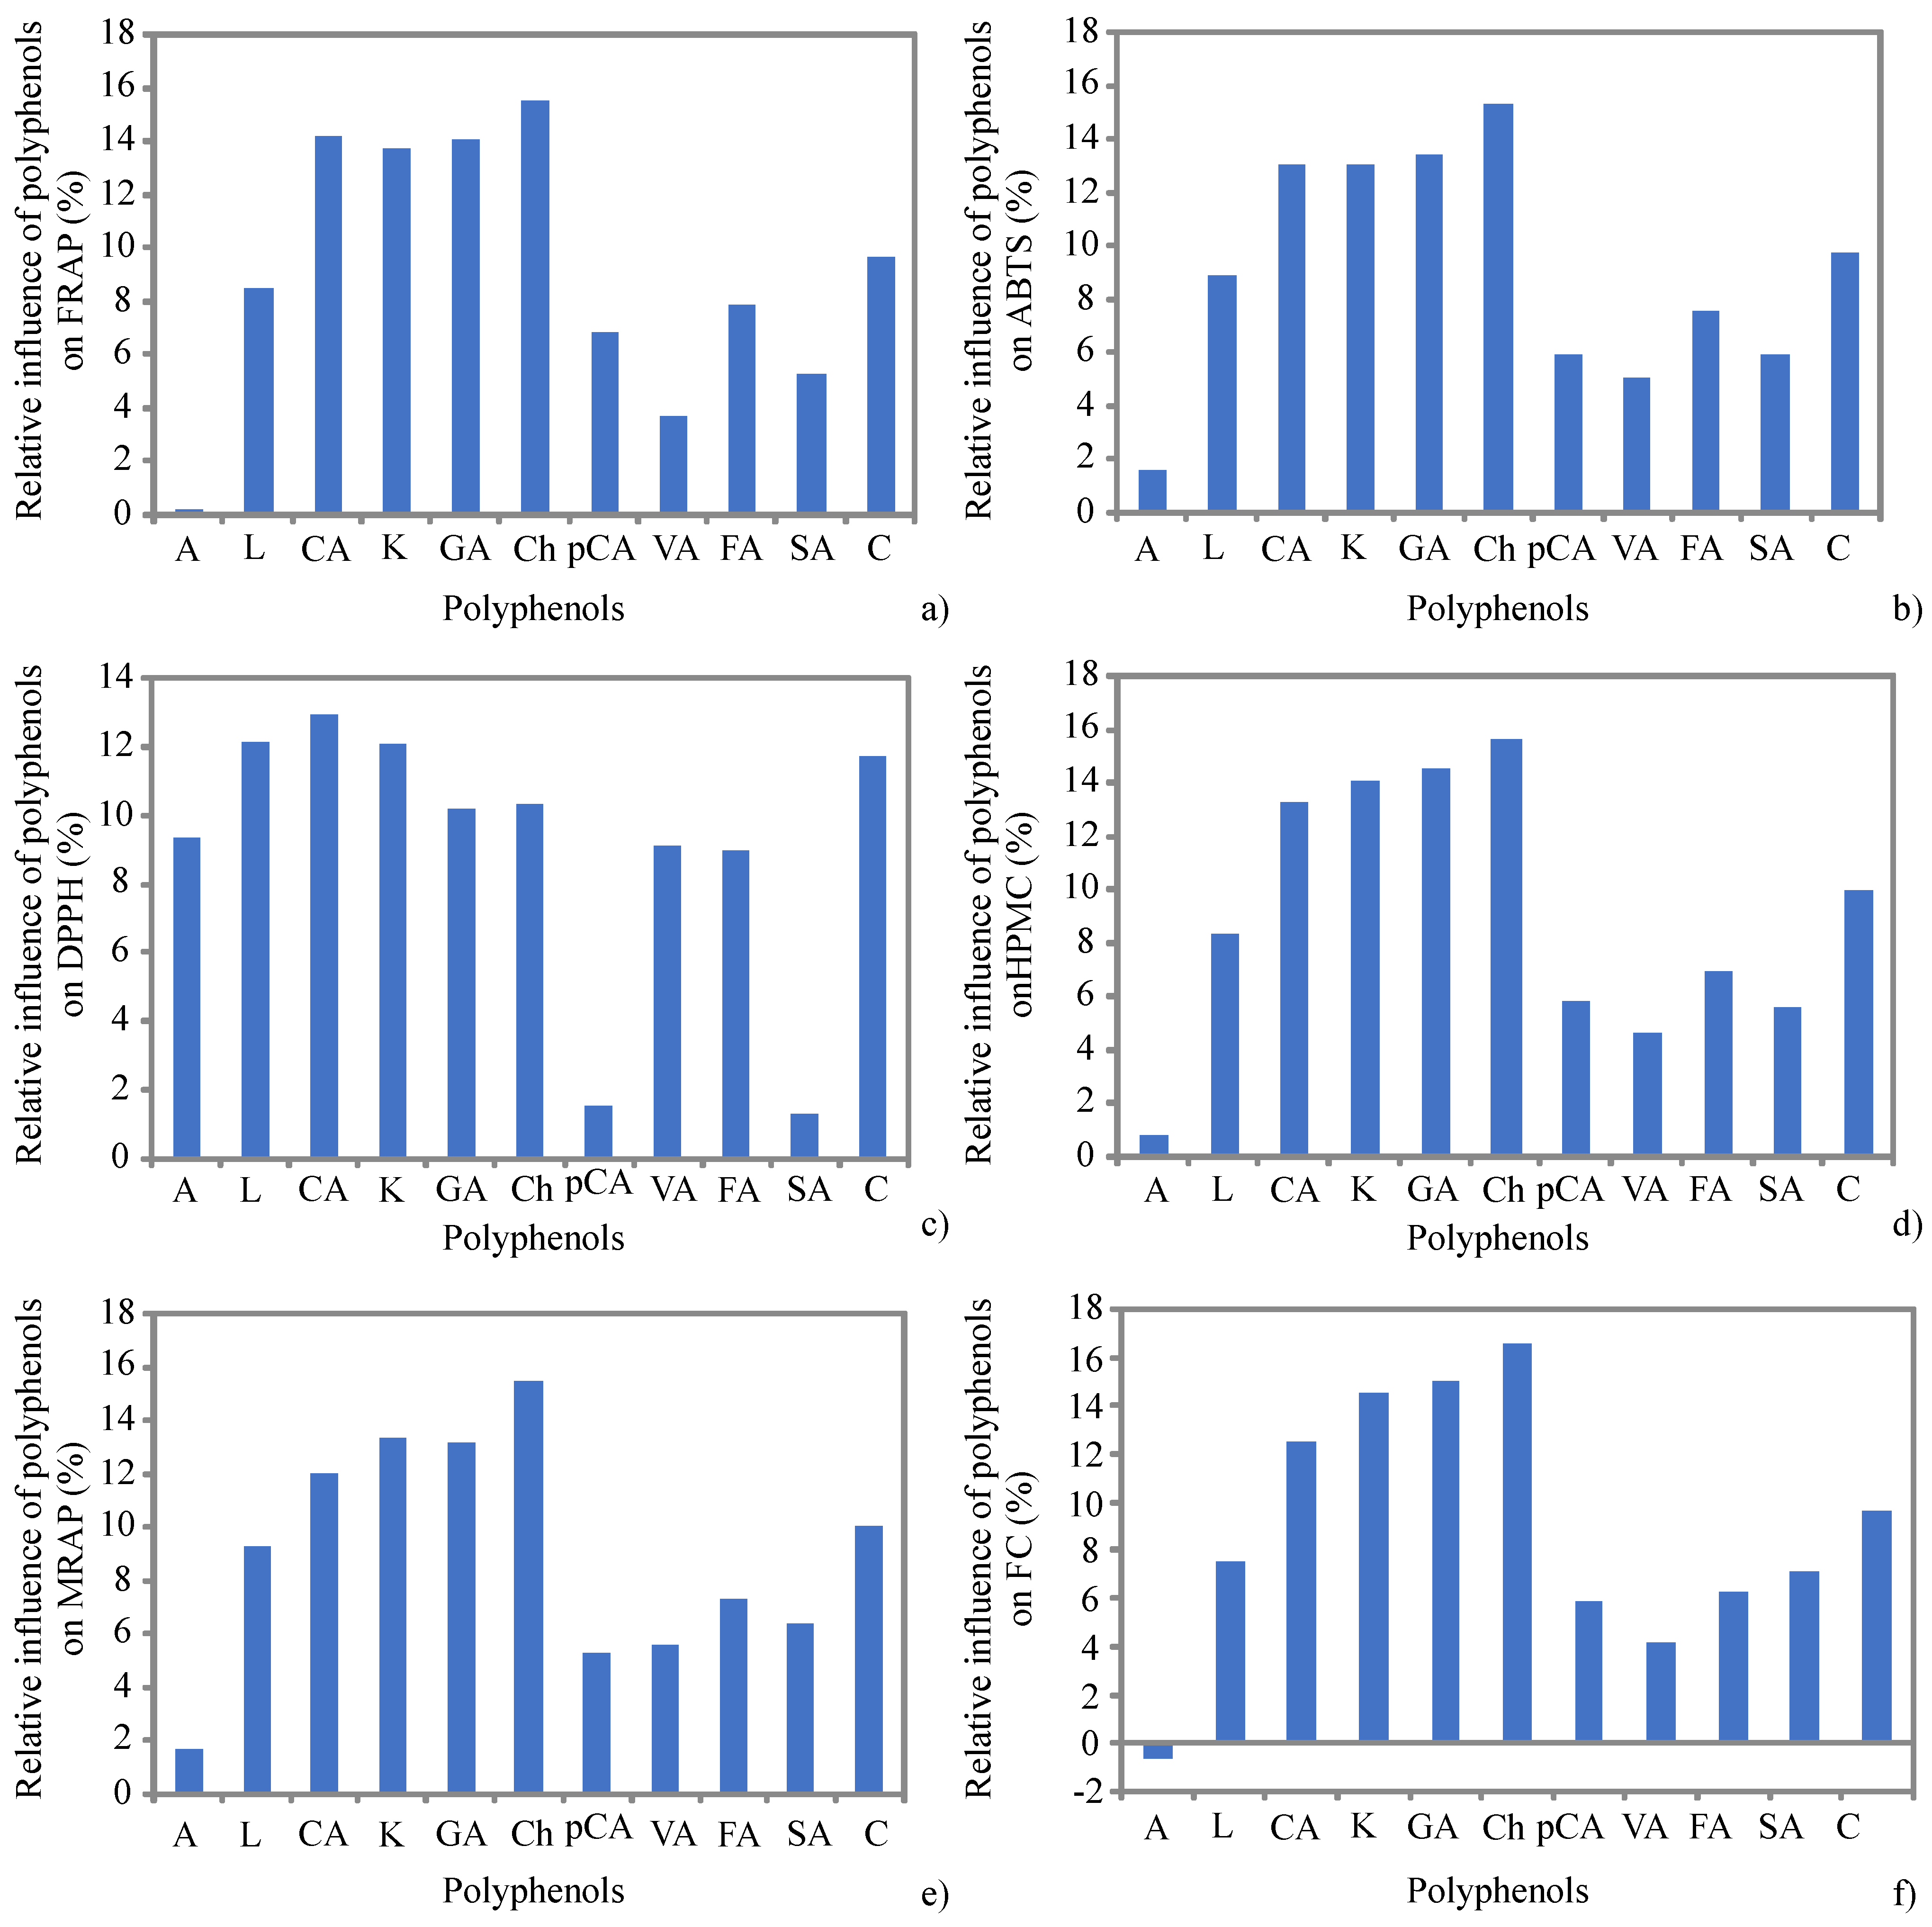
3.3. ANN Model
4. Conclusions
Author Contributions
Funding
Institutional Review Board Statement
Informed Consent Statement
Data Availability Statement
Conflicts of Interest
References
- Li, M.J.; Hou, X.L.; Wang, F.; Tan, G.F.; Xu, Z.S.; Xiong, A.S. Advances in the research of celery, an important Apiaceae vegetable crop. Crit. Rev. Biotechnol. 2018, 38, 172–183. [Google Scholar] [CrossRef] [PubMed]
- Arsenov, D.; Župunski, M.; Pajević, S.; Nemeš, I.; Simin, N.; Alnuqaydan, A.; Watson, M.; Aloliqi, A.; Mimica-Dukić, N. Roots of Apium graveolens and Petroselinum crispum—Insight into phenolic status against toxicity level of trace elements. Plants 2021, 10, 1785. [Google Scholar] [CrossRef] [PubMed]
- Golubkina, N.A.; Kharchenko, V.A.; Moldovan, A.I.; Koshevarov, A.A.; Zamana, S.; Nadezhkin, S.; Soldatenko, A.; Sekara, A.; Tallarita, A.; Caruso, G. Yield, growth, quality, biochemical characteristics and elemental composition of plant parts of celery leafy, stalk and root types grown in the northern hemisphere. Plants 2020, 9, 484. [Google Scholar] [CrossRef] [Green Version]
- Kainama, H.; Fatmawati, S.; Santoso, M.; Papilaya, P.M.; Ersam, T. The relationship of free radical scavenging and total phenolic and flavonoid contents of Garcinia lasoar PAM. Pharm. Chem. J. 2020, 53, 1151–1157. [Google Scholar] [CrossRef]
- Hazafa, A.; Rehman, K.U.; Jahan, N.; Jabeen, Z. The role of polyphenol (flavonoids) compounds in the treatment of cancer cells. Nutr. Cancer 2020, 72, 386–397. [Google Scholar] [CrossRef] [PubMed]
- Molina-Cortés, A.; Sánchez-Motta, T.; Tobar-Tosse, F.; Quimbaya, M. Spectrophotometric estimation of total phenolic content and antioxidant capacity of molasses and vinasses generated from the sugar industry. Waste Biomass Valori. 2020, 11, 3453–3463. [Google Scholar] [CrossRef] [Green Version]
- Cvetković, B.; Pezo, L.; Mišan, A.; Mastilović, J.; Kevrešan, Ž.; Ilić, N.; Filipčev, B. The effects of osmotic dehydration of white cabbage on polyphenols and mineral content. LWT- Food Sci. Technol. 2019, 110, 332–337. [Google Scholar] [CrossRef]
- Almeida, J.; Mussi, L.; Oliveira, D.; Pereira, N. Effect of temperature and sucrose concentration on the retention of polyphenol compounds and antioxidant activity of osmotically dehydrated bananas. J. Food Process. Preserv. 2015, 39, 1061–1069. [Google Scholar] [CrossRef]
- Filipović, V.; Lončar, B.; Filipović, J.; Nićetin, M.; Knežević, V.; Šeregelj, V.; Košutić, M.; Bodroža Solarov, M. Addition of Combinedly Dehydrated Peach to the Cookies—Technological Quality Testing and Optimization. Foods 2022, 11, 1258. [Google Scholar] [CrossRef]
- Filipčev, B.; Lević, L.; Bodroža-Solarov, M.; Mišljenović, N.; Koprivica, G. Quality characteristics and antioxidant properties of breads supplemented with sugar beet molasses-based ingredients. Int. J. Food Prop. 2010, 13, 1035–1053. [Google Scholar] [CrossRef] [Green Version]
- Lončar, B.; Pezo, L.; Filipović, V.; Nićetin, M.; Filipović, J.; Pezo, M.; Šuput, D.; Aćimović, M. Physico-Chemical, Textural and Sensory Evaluation of Spelt Muffins Supplemented with Apple Powder Enriched with Sugar Beet Molasses. Foods 2022, 11, 1750. [Google Scholar] [CrossRef] [PubMed]
- Valli, V.; Caravaca, A.G.; Di Nunzio, M.; Danesi, F.; Caboni, M.F.; Bordoni, A. Sugar cane and sugar beet molasses, antioxidant-rich alternatives to refined sugar. J. Agric. Food Chem. 2012, 60, 12508–12515. [Google Scholar] [CrossRef] [PubMed]
- Sužnjević, D.; Pastor, F.; Gorjanović, S. Polarographic study of hydrogen peroxide anodic current and its application to antioxidant activity determination. Talanta 2011, 85, 1398–1403. [Google Scholar] [CrossRef] [PubMed]
- Petrović, M.; Sužnjević, D.; Pastor, F.; Veljović, M.; Pezo, L.; Antić, M.; Gorjanović, S. Antioxidant capacity determination of complex samples and individual phenolics-multilateral approach. Comb. Chem. High Throughput Screen. 2016, 19, 58–65. [Google Scholar] [CrossRef]
- Nićetin, M.; Pezo, L.; Filipović, V.; Lončar, B.; Filipović, J.; Šuput, D.; Knežević, V. Effects of solution type temperature and time on antioxidant capacity of osmotically dried celery leaves. Therm. Sci. 2021, 25, 1759–1770. [Google Scholar] [CrossRef]
- Ćurčić, B.; Pezo, L.; Filipović, V.; Nićetin, M.; Knežević, V. Osmotic treatment of fish in two different solutions-artificial neural network model. J. Food Process. Preserv. 2015, 39, 671–680. [Google Scholar] [CrossRef]
- Knežević, V.; Pezo, L.; Lončar, B.; Filipović, V.; Nićetin, M.; Gorjanović, S.; Šuput, D. Antioxidant capacity of nettle leaves during osmotic treatment. Period. Polytech. Chem. Eng. 2019, 63, 491–498. [Google Scholar] [CrossRef] [Green Version]
- Gorjanović, S.; Komes, D.; Pastor, F.; Belščak-Cvitanović, A.; Pezo, L.; Hećimović, I.; Sužnjević, D. Antioxidant capacity of teas and herbal infusions: Polarographic assessment. J. Agric. Food Chem. 2012, 60, 9573–9580. [Google Scholar] [CrossRef]
- Brand-Williams, W.; Cuvelier, M.E.; Berset, C. Use of free radical method to evaluate antioxidant activity. LWT–Food Sci. Technol. 1995, 28, 25–30. [Google Scholar]
- Benzie, I.F.F.; Strain, J.J. The ferric reducing ability of plasma (FRAP) as a measure of “antioxidant power”: FRAP assay. Anal. Biochem. 1996, 239, 70–76. [Google Scholar] [CrossRef] [Green Version]
- Re, R.; Pellegrini, N.; Proteggente, A.; Pannala, A.; Yang, M.; Rice-Evans, C. Antioxidant activity applying an improved ABTS radical cation decolorization assay. Free Radic. Biol. Med. 1999, 26, 1223–1237. [Google Scholar] [CrossRef]
- Chen, M.; Zhao, Y.; Yu, S. Optimisation of ultrasonic-assisted extraction of phenolic compounds, antioxidants, and anthocyanins from sugar beet molasses. Food Chem. 2015, 172, 543–550. [Google Scholar] [CrossRef] [PubMed]
- Trelea, I.C.; Raoult-Wack, A.L.; Trystram, G. Note: Application of neural network modelling for the control of dewatering and impregnation soaking process (osmotic dehydration). Food Sci. Technol. Int. 1997, 3, 459–465. [Google Scholar] [CrossRef]
- Yoon, Y.; Swales, G.; Margavio, T.M. Comparison of Discriminant Analysis versus Artificial Neural Networks. J. Oper. Res. Soc. 2017, 44, 51–60. [Google Scholar] [CrossRef]
- StatSoft Inc. STATISTICA (Data Analysis Software System). Version 10.0. Available online: http://www.statsoft.com/(accessed on 1 June 2022).
- Yao, Y.; Sang, W.; Zhou, M.; Ren, G. Phenolic composition and antioxidant activities of 11 celery cultivars. Food Chem. 2010, 75, C9–C13. [Google Scholar] [CrossRef] [PubMed]
- Chen, M.; Zhao, Y.; Meng, H.; Proffesor, S. The antibiotic activity and mechanisms of sugar beet (Beta vulgaris) molasses polyphenols against selected food-borne pathogens. LWT-Food Sci. Technol. 2017, 82, 354–360. [Google Scholar] [CrossRef]
- Shafiqa-Atikah, M.K.; Nor-Khaizura, M.A.R.; Mahyudin, N.A.; Abas, F.; Nur-Syifa’, J.; Ummul-Izzatul, Y. Evaluation of phenolic constituent, antioxidant and antibacterial activities of sugarcane molasses towards foodborne pathogens. Food Res. 2020, 4, 40–47. [Google Scholar]
- Devic, E.; Guyot, S.; Daudin, J.D.; Bonazzi, C. Effect of temperature and cultivar on polyphenol retention and mass transfer during osmotic dehydration of apples. J. Agric. Food Chem. 2010, 58, 606–614. [Google Scholar] [CrossRef]
- Nurkhoeriyati, T.; Kulig, B.; Sturm, B.; Hensel, O. The effect of pre-drying treatment and drying conditions on quality and energy consumption of hot air-dried celeriac slices: Optimisation. Foods 2021, 10, 1758. [Google Scholar] [CrossRef]
- Priecina, L.; Karklina, D.; Kince, T. The impact of steam-blanching and dehydration on phenolic, organic acid composition, and total carotenoids in celery roots. Innov. Food Sci. Emerg. Technol. 2018, 49, 192–201. [Google Scholar] [CrossRef]
- Salamatullah, A.M.; Özcan, M.M.; Alkatham, M.S.; Uslu, N.; Hayat, K. Infuence of boiling on total phenol, antioxidant activity and phenolic compounds of celery (Apium graveolens L.) roots. J. Food Process. Preserv. 2021, 45, e15171. [Google Scholar] [CrossRef]
- Priecina, L.; Karklina, D. Natural antioxidant changes in fresh and dried spices and vegetables. Int. J. Food Eng. 2014, 8, 492–496. [Google Scholar]
- Goldewska, K.; Pacyga, P.; Michalak, I.; Biesiada, A.; Szumny, A.; Pachura, N.; Piszcz, U. Field-Scale evaluation of botanical extracts effect on the yield, chemical composition and antioxidant activity of celeriac (Apium graveolens L. Var. rapaceum). Molecules 2020, 25, 4212. [Google Scholar]
- Gorjanović, S.; Komes, D.; Laličić-Petronijević, J.; Pastor, F.; Belščak-Cvitanović, A.; Veljović, M.; Pezo, L.; Sužnjević, D. Antioxidant efficiency of polyphenols from coffee and coffee substitutes-electrochemical versus spectrophotometric approach. J. Food Sci. Technol. 2017, 54, 2324–2331. [Google Scholar] [CrossRef]
- Hossain, M.; Patras, A.; Barry-Ryan, C.; Martin-Diana, A.; Brunton, N. Application of principal component and hierarchial cluster analysis to classify different spices based on in vitro antioxidant activity and individual polyphenolic antioxidant compounds. J. Funct. Foods 2011, 3, 179–189. [Google Scholar] [CrossRef]
- Fidrianny, I.; Windyaswari, A.S.; Wirasutisna, K.R. Antioxidant capacities of various leaves extract from five colors varieties of sweet potatoes tubers using ABTS, DPPH assays and correlation with total flavonoid, phenolic, carotenoid content. Res. J. Med. Plant 2013, 7, 130–140. [Google Scholar] [CrossRef] [Green Version]
- Teixeira, T.S.; Vale, R.C.; Almeida, R.R.; Ferreira, T.P.S.; Guimarães, L.G.L. Antioxidant potential and its correlation with the contents of phenolic compounds and flavonoids of methanolic extracts from different medicinal plants. Rev. Virtual Quim. 2017, 9, 1546–1559. [Google Scholar] [CrossRef]
- Zlatanović, S. Thermal, Chemical and Functional Properties of Apple Pomace and its Potential Use in Food Industry. Ph.D. Thesis, Faculty of Agriculture, University of Belgrade, Belgrade, Serbia, 16 December 2019. [Google Scholar]
- Plaza, M.; Kariuki, J.; Turner, C. Quantification of individual phenolic compounds’ contribution to antioxidant capacity in apple: A novel analytical tool based on liquid chromatography with diode array, electrochemical, and charged aerosol detection. J. Agric. Food Chem. 2014, 62, 409–418. [Google Scholar] [CrossRef]
- Hirano, R.; Sasamoto, W.; Matsumoto, A.; Itakura, H.; Igarashi, O.; Kondo, K. Antioxidant ability of various flavonoids against DPPH radicals and LDL oxidation. J. Nutri. Sci. Vitaminol. 2001, 47, 357–362. [Google Scholar] [CrossRef] [Green Version]
- Abdi, H.; Williams, L.J. Principal component analysis. Wiley Interdiscip. Rev. Comput. Stat. 2010, 2, 433–459. [Google Scholar] [CrossRef]


| Phenols (mg/kg) | Sugar Beet Molasses | Fresh Celery Root | Osmotically Dehydrated Celery Root in Sugar Beet Molasses | ||||||||
|---|---|---|---|---|---|---|---|---|---|---|---|
| 1 h 20 °C | 1 h 35 °C | 1 h 50 °C | 3 h 20 °C | 3 h 35 °C | 3 h 50 °C | 5 h 20 °C | 5 h 35 °C | 5 h 50 °C | |||
| Apigenin | 1296.1 ± 64.85 d | 700.32 ± 35.04 a | 734.39 ± 36.49 a | 704.98 ± 34.88 a | 779.49 ± 38.59 b | 810.66 ± 40.93 b | 985.01 ± 49.78 c | 968.33 ± 49.31 c | 983.17 ± 48.51 c | 1004.28 ± 50.04 c | 1021.95 ± 50.24 c |
| Luteolin | 402.55 ± 20.05 g | 69.54 ± 3.47 a | 74.11 ± 3.67 a | 82.92 ± 4.21 b | 90.51 ± 4.61 b | 107.03 ± 5.25 c | 113.75 ± 5.78 c | 135.14 ± 6.84 d | 115.69 ± 5.85 c | 149.29 ± 7.48 e | 161.75 ± 8.04 f |
| Quercetin | ND | 12.34 ± 0.63 | ND | ND | ND | ND | ND | ND | ND | ND | ND |
| Chlorogenic acid | 368.24 ± 18.05 e | 4.50 ± 0.23 a | 5.55 ± 0.27 a | 14.76 ± 0.75 b,c | 15.64 ± 0.79 b,c | 12.86 ± 0.65 b | 17.59 ± 0.88 b,c | 19.85 ± 1.01 c | 14.61 ± 0.73 b,c | 19.13 ± 0.96 c | 27.98 ± 1.43 d |
| Rutin | ND | 23.61 ± 1.18 | ND | ND | ND | ND | ND | ND | ND | ND | ND |
| Kaempferol | 980.34 ± 48.44 e | 600.26 ± 30.59 a | 702.28 ± 34.91 b | 706.09 ± 34.80 b | 784.75 ± 39.90 c | 718.46 ± 35.89 b | 730.60 ± 37.04 b | 791.14 ± 39.94 c | 885.77 ± 44.87 d | 840.13 ± 42.44 cd | 963.39 ± 48.44 e |
| Gallic acid | 450.55 ± 22.26 b | 6.18 ± 0.31 a | 7.68 ± 0.39 a | 7.86 ± 0.39 a | 9.79 ± 0.48 a | 7.90 ± 0.39 a | 7.87 ± 0.40 a | 10.02 ± 0.50 a | 9.00 ± 0.44 a | 9.98 ± 0.49 a | 10.94 ± 0.55 a |
| Chrysin | 1907.12 ± 96.41 i | 198.81 ± 10.14 a | 221.78 ± 11.14 b | 416.73 ± 20.55 d | 591.40 ± 29.74 e | 381.24 ± 18.86 c | 421.32 ± 21.36 d | 618.32 ± 30.36 f | 626.95 ± 31.22 f | 636.19 ± 31.80 g | 745.86 ± 37.14 h |
| p-Coumaric acid | 1170.2 ± 59.26 i | 81.54 ± 4.11 a | 96.05 ± 4.76 b | 137.63 ± 7.01 d | 140.31 ± 7.00 d | 133.01 ± 6.76 d | 108.16 ± 5.38 c | 194.78 ± 9.87 g | 169.05 ± 8.51 e | 188.78 ± 9.42 f | 229.49 ± 11.45 h |
| Caffeic acid | ND | 55.46 ± 2.72 | ND | ND | ND | ND | ND | ND | ND | ND | ND |
| Vanillic acid | 1260.76 ± 64.25 f | ND | 6.78 ± 0.34 a | 9.40 ± 0.48 b | 10.32 ± 0.51 b | 7.42 ± 0.36 a | 11.72 ± 0.59 b,c | 11.93 ± 0.60 c | 7.63 ± 0.39 a | 15.25 ± 0.78 e | 14.62 ± 0.74 d |
| Ferulic acid | 1560.66 ± 77.19 i | 11.09 ± 0.55 a | 13.21 ± 0.66 b | 22.01 ± 1.12 e | 20.82 ± 1.05 d | 19.01 ± 0.96 c | 26.52 ± 1.35 f | 21.11 ± 1.04 de | 20.77 ± 1.06 d | 33.46 ± 1.69 g | 39.14 ± 1.95 h |
| Syringic acid | 472.69 ± 23.95 g | ND | 21.43 ± 1.06 b | 17.96 ± 0.90 a | 31.88 ± 1.60 d | 26.13 ± 1.30 c | 26.89 ± 1.33 c | 32.57 ± 1.63 d | 35.22 ± 1.75 e | 36.61 ± 1.84 ef | 38.78 ± 1.96 f |
| Catechin | 860.74 ± 43.14 h | ND | 16.18 ± 0.82 a | 19.54 ± 0.98 d | 22.58 ± 1.11 e | 17.69 ± 0.90 b | 22.17 ± 1.13 e | 27.74 ± 1.38 g | 18.85 ± 0.93 c | 25.65 ± 1.26 f | 28.65 ± 1.45 g |
| Sample | FRAP (mM Fe(II)/L) | ABTS (mM TE/L) | DPPH (mM TE/L) | HPMC (%/mL) | MRAP (%/mL) | TPC (g GAE/L) | RACI |
|---|---|---|---|---|---|---|---|
| 1 h 20 °C | 1.542 ± 0.009 b | 1.104 ± 0.004 a | 0.469 ± 0.001 b | 0.043 ± 0.000 b | 0.020 ± 0.000 a | 3.360 ± 0.001 b | −1.194 |
| 1 h 35 °C | 1.560 ± 0.010 c | 1.116 ± 0.014 b | 0.465 ± 0.002 b | 0.042 ± 0.000 a | 0.021 ± 0.000 b | 3.374 ± 0.001 c | −0.681 |
| 1 h 50 °C | 1.562 ± 0.010 c | 1.122 ± 0.009 b | 0.462 ± 0.004 a | 0.043 ± 0.000 b | 0.022 ± 0.000 c | 3.498 ± 0.002 h | 0.1525 |
| 3 h 20 °C | 1.550 ± 0.007 b | 1.110 ± 0.008 b | 0.461 ± 0.002 a | 0.042 ± 0.000 a | 0.021 ± 0.000 b | 3.385 ± 0.001 d | −0.980 |
| 3 h 35 °C | 1.558 ± 0.011 c | 1.120 ± 0.005 b | 0.479 ± 0.003 b,c | 0.042 ± 0.000 a | 0.022 ± 0.000 c | 3.396 ± 0.000 f | 0.0236 |
| 3 h 50 °C | 1.571 ± 0.003 d | 1.129 ± 0.010 c | 0.473 ± 0.006 b,c | 0.043 ± 0.000 b | 0.022 ± 0.000 c | 3.502 ± 0.002 j | 0.8235 |
| 5 h 20 °C | 1.560 ± 0.013 c | 1.118 ± 0.009 b | 0.476 ± 0.004 c | 0.042 ± 0.000 a | 0.021 ± 0.000 b | 3.390 ± 0.002 e | −0.104 |
| 5 h 35 °C | 1.560 ± 0.020 c | 1.130 ± 0.010 c | 0.477 ± 0.007 c | 0.043 ± 0.000 b | 0.022 ± 0.000 c | 3.468 ± 0.000 g | 0.6475 |
| 5 h 50 °C | 1.580 ± 0.011 e | 1.132 ± 0.014 c | 0.473 ± 0.002 c | 0.044 ± 0.000 c | 0.022 ± 0.000 c | 3.502 ± 0.002 i | 1.314 |
| Fresh | 1.527 ± 0.016 a | 1.098 ± 0.011 a | 0.459 ± 0.000 a | 0.042 ± 0.000 a | 0.020 ± 0.000 a | 3.009 ± 0.001 a |
| ABTS | DPPH | HPMC | MRAP | TPC | RACI | |
|---|---|---|---|---|---|---|
| FRAP | 0.898 ** | 0.256 | 0.891 ** | 0.787 * | 0.797 * | 0.913 ** |
| ABTS | 0.423 | 0.823 ** | 0.922 ** | 0.862 ** | 0.974 ** | |
| DPPH | 0.155 | 0.460 | 0.634 | 0.466 | ||
| HPMC | 0.782 * | 0.902 ** | 0.899 ** | |||
| MRAP | 0.818 ** | 0.941 ** | ||||
| TPC | 0.876 ** | |||||
| RACI |
| FRAP | ABTS | DPPH | HPMC | MRAP | TPC | RACI | |
|---|---|---|---|---|---|---|---|
| Apigenin | 0.602 | 0.737 * | 0.799 * | 0.553 | 0.792 * | 0.482 | 0.782 * |
| Luteolin | 0.738 * | 0.840 ** | 0.556 | 0.734 * | 0.866 ** | 0.656 | 0.862 ** |
| Chlorogenicacid | 0.942 ** | 0.914 ** | 0.347 | 0.871 ** | 0.838 ** | 0.745 * | 0.918 ** |
| Kaempferol | 0.737 * | 0.716 * | 0.393 | 0.673 * | 0.876 ** | 0.604 | 0.788 * |
| Gallic acid | 0.835 ** | 0.878 ** | 0.198 | 0.876 ** | 0.924 ** | 0.928 ** | 0.915 ** |
| Chrysin | 0.877 ** | 0.906 ** | 0.307 | 0.758 * | 0.927 ** | 0.807 ** | 0.905 ** |
| p-Coumaric acid | 0.856 ** | 0.840 ** | 0.283 | 0.773 * | 0.842 ** | 0.743 * | 0.855 ** |
| Vanillic acid | 0.725 * | 0.900 ** | 0.465 | 0.756 * | 0.843 ** | 0.741 * | 0.873 ** |
| Ferulic acid | 0.726 * | 0.804 ** | 0.434 | 0.694 * | 0.830 ** | 0.566 | 0.799 * |
| Syringic acid | 0.663 | 0.783 * | 0.418 | 0.687 * | 0.929 ** | 0.743 * | 0.833 ** |
| Catechin | 0.894 ** | 0.943 ** | 0.377 | 0.921 ** | 0.853 ** | 0.894 ** | 0.965 ** |
Publisher’s Note: MDPI stays neutral with regard to jurisdictional claims in published maps and institutional affiliations. |
© 2022 by the authors. Licensee MDPI, Basel, Switzerland. This article is an open access article distributed under the terms and conditions of the Creative Commons Attribution (CC BY) license (https://creativecommons.org/licenses/by/4.0/).
Share and Cite
Nićetin, M.; Pezo, L.; Pergal, M.; Lončar, B.; Filipović, V.; Knežević, V.; Demir, H.; Filipović, J.; Manojlović, D. Celery Root Phenols Content, Antioxidant Capacities and Their Correlations after Osmotic Dehydration in Molasses. Foods 2022, 11, 1945. https://doi.org/10.3390/foods11131945
Nićetin M, Pezo L, Pergal M, Lončar B, Filipović V, Knežević V, Demir H, Filipović J, Manojlović D. Celery Root Phenols Content, Antioxidant Capacities and Their Correlations after Osmotic Dehydration in Molasses. Foods. 2022; 11(13):1945. https://doi.org/10.3390/foods11131945
Chicago/Turabian StyleNićetin, Milica, Lato Pezo, Marija Pergal, Biljana Lončar, Vladimir Filipović, Violeta Knežević, Hande Demir, Jelena Filipović, and Dragan Manojlović. 2022. "Celery Root Phenols Content, Antioxidant Capacities and Their Correlations after Osmotic Dehydration in Molasses" Foods 11, no. 13: 1945. https://doi.org/10.3390/foods11131945
APA StyleNićetin, M., Pezo, L., Pergal, M., Lončar, B., Filipović, V., Knežević, V., Demir, H., Filipović, J., & Manojlović, D. (2022). Celery Root Phenols Content, Antioxidant Capacities and Their Correlations after Osmotic Dehydration in Molasses. Foods, 11(13), 1945. https://doi.org/10.3390/foods11131945