
Human Adult Microbiota in a Static Colon Model: AhR Transcriptional Activity at the Crossroads of Host–Microbe Interaction

 ,
,  , , , , and
Abstract
:
1. Introduction
2. Materials and Methods
2.1. Reagents and Biological Material
2.1.1. Human Fecal Material
2.1.2. Human Cell Lines in Culture
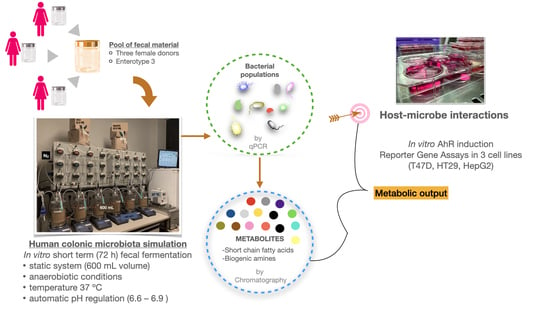
2.2. Human Colon Simulation Set-Up
2.3. Analysis of Gut Microbial Composition
2.3.1. DNA Extraction from Fermentation Samples
2.3.2. 16S Amplicon Sequencing and Microbiota Profiling
2.3.3. qPCR Analysis of Selected Targets
2.4. Chromatographic Analysis of Gut Microbiota-Derived Metabolites
2.4.1. Short-Chain Fatty Acids by SPME-GC-MS
2.4.2. Biogenic Amines by UPLC-FLD
2.5. Cell Culture Experiments
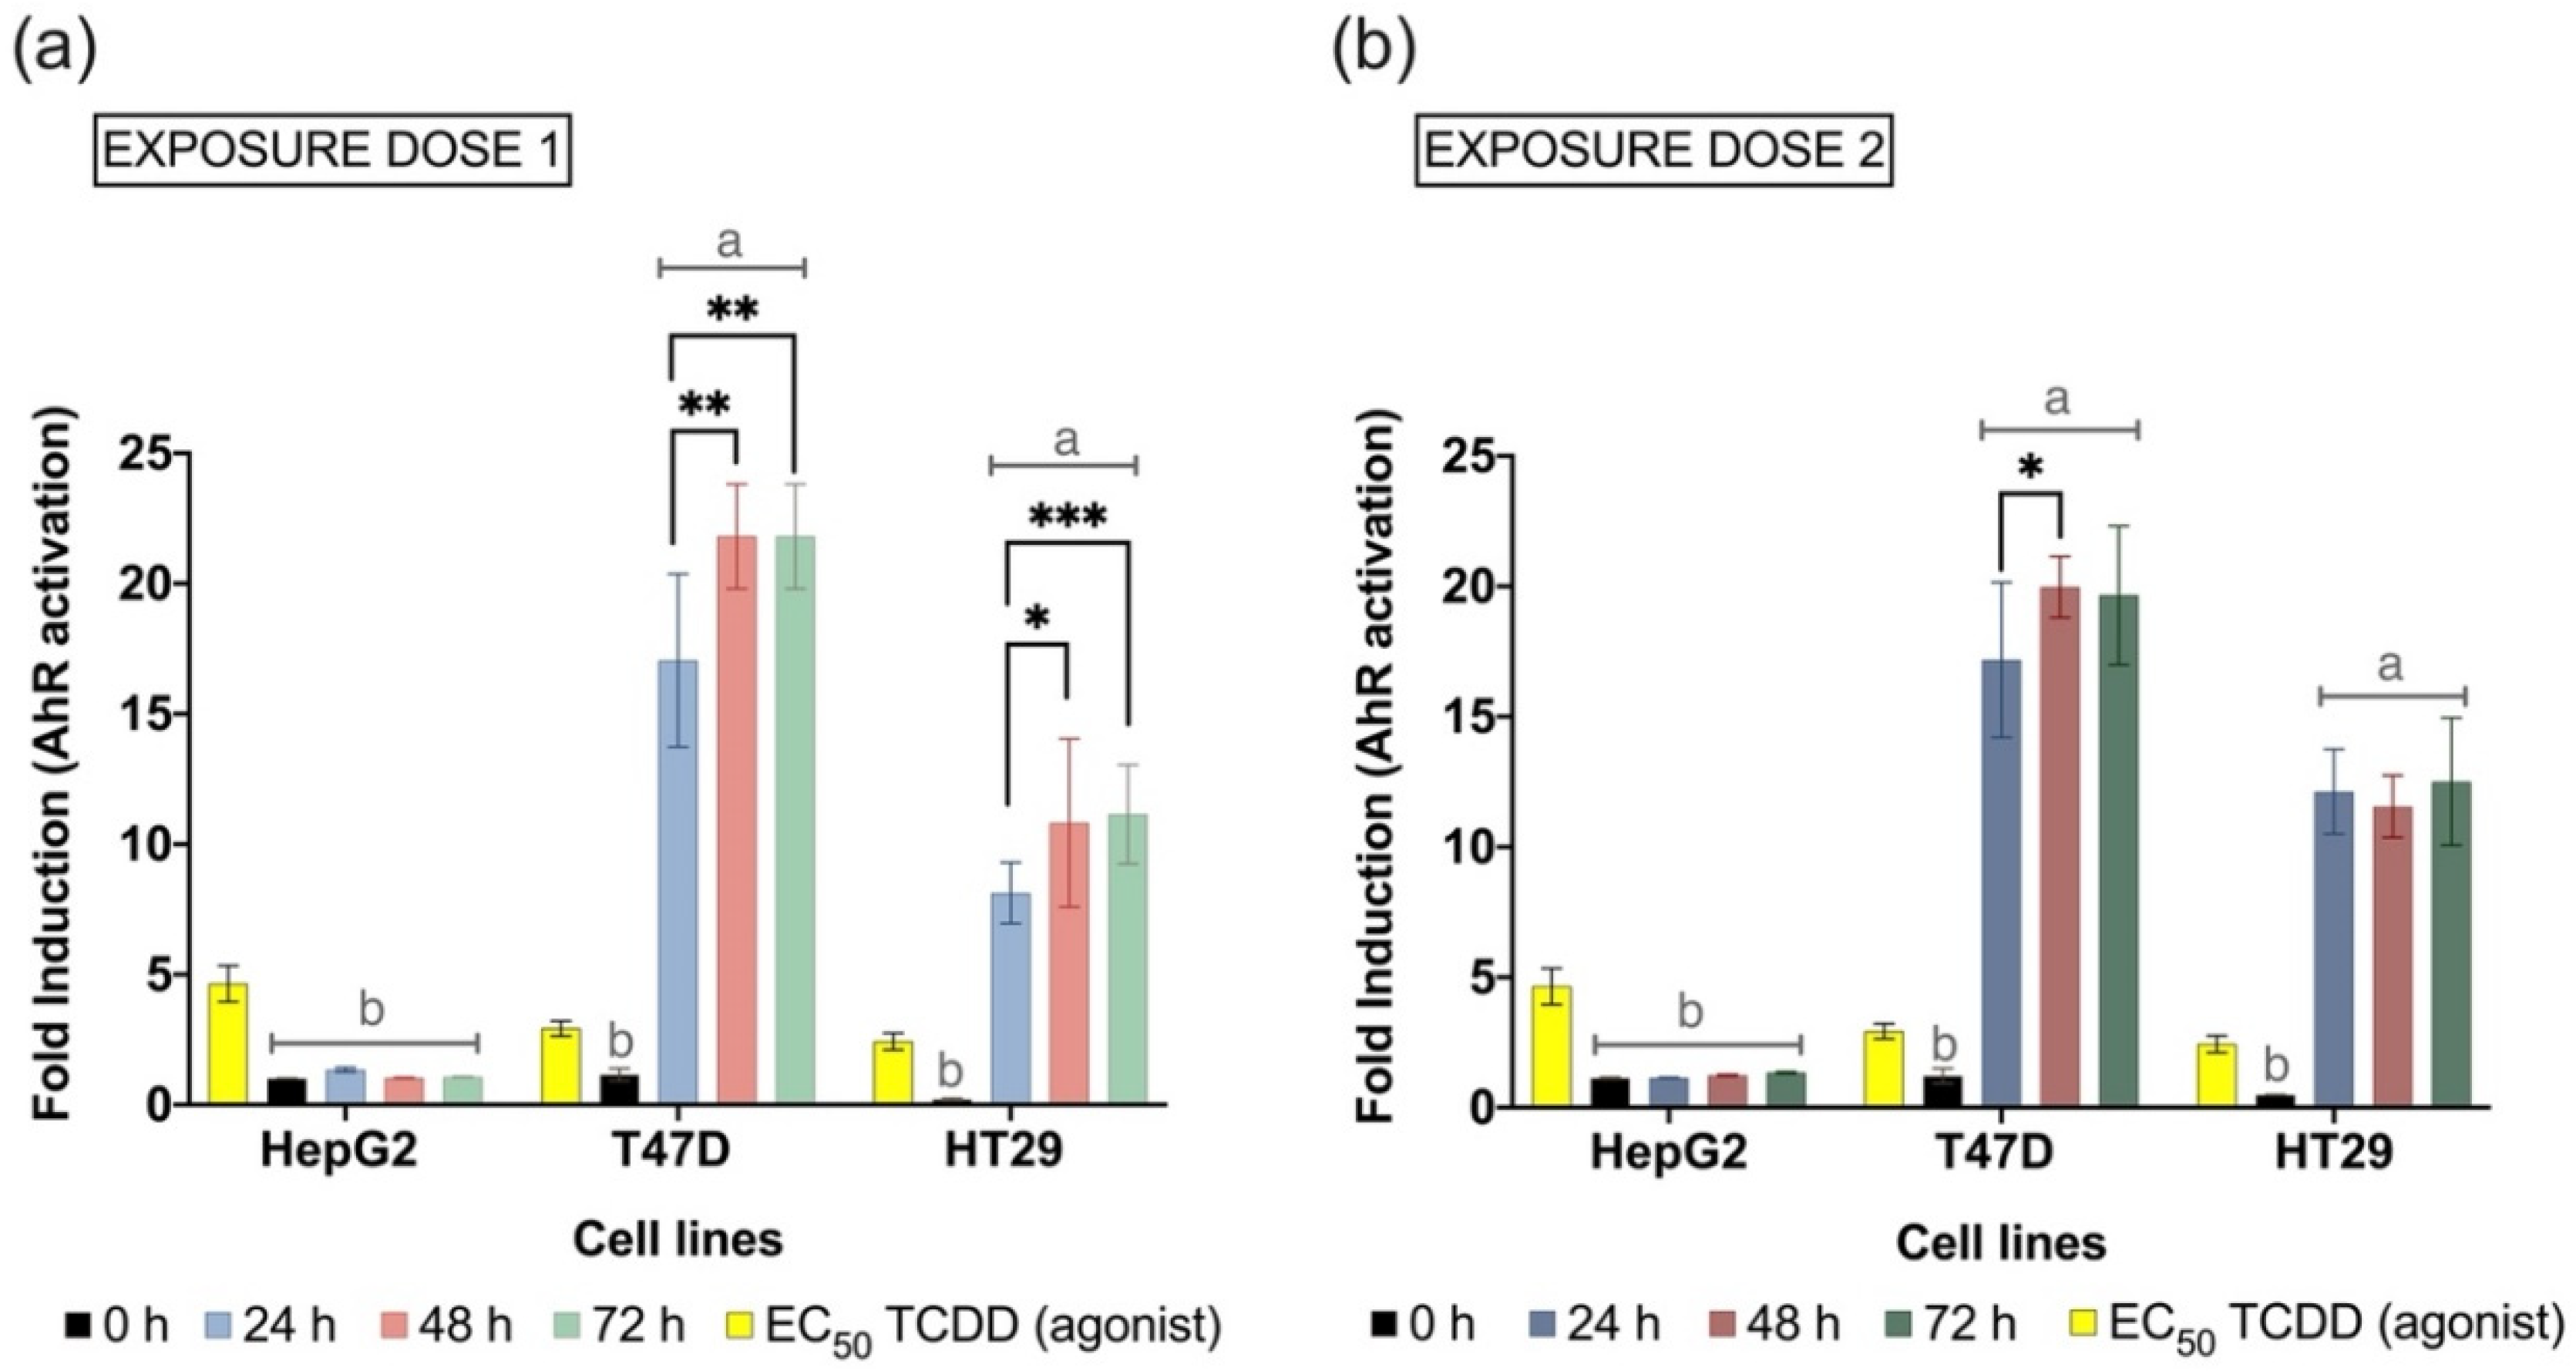
2.5.1. Treatments and Controls
- Dose 1: 20 µL of fermentation sample + 30 µL of the fermentation medium.
- Dose 2: 50 µL of fermentation sample.
2.5.2. AhR Activity Assay
- (a)
- AhR_T47D and AhR_HepG2 cells were seeded (3.0 × 10⁵ cells/mL) and incubated overnight in white clear-bottomed 96-well plates, and later exposed to the fermentation samples for 24 h. For the luminescence reading, cells were rinsed with PBS, and 50 µL/well of lysis solution containing Triton X100 were added. The plates were frozen at −20 °C for two hours to boost the lysis, and finally, 50 µL/well of glow-mix containing luciferin (Promega, Madison, WI, USA) and ATP (Roche Diagnostics, Rotkreuz, Switzerland) were added.
- (b)
- AhR_HT29 Lucia cells were seeded (3.0 × 10⁵ cells/mL) in CellStart® 96-well microplates and incubated overnight before treatment. After 24 h of exposure to the fermentation samples, 20 µL of the cell supernatant were transferred to Nunc™ white 96-well plates. Then, 50 µL/well of Quanti-Luc™ assay reagent were added.
2.5.3. Cytotoxicity Analysis
2.6. Statistical Analysis
3. Results
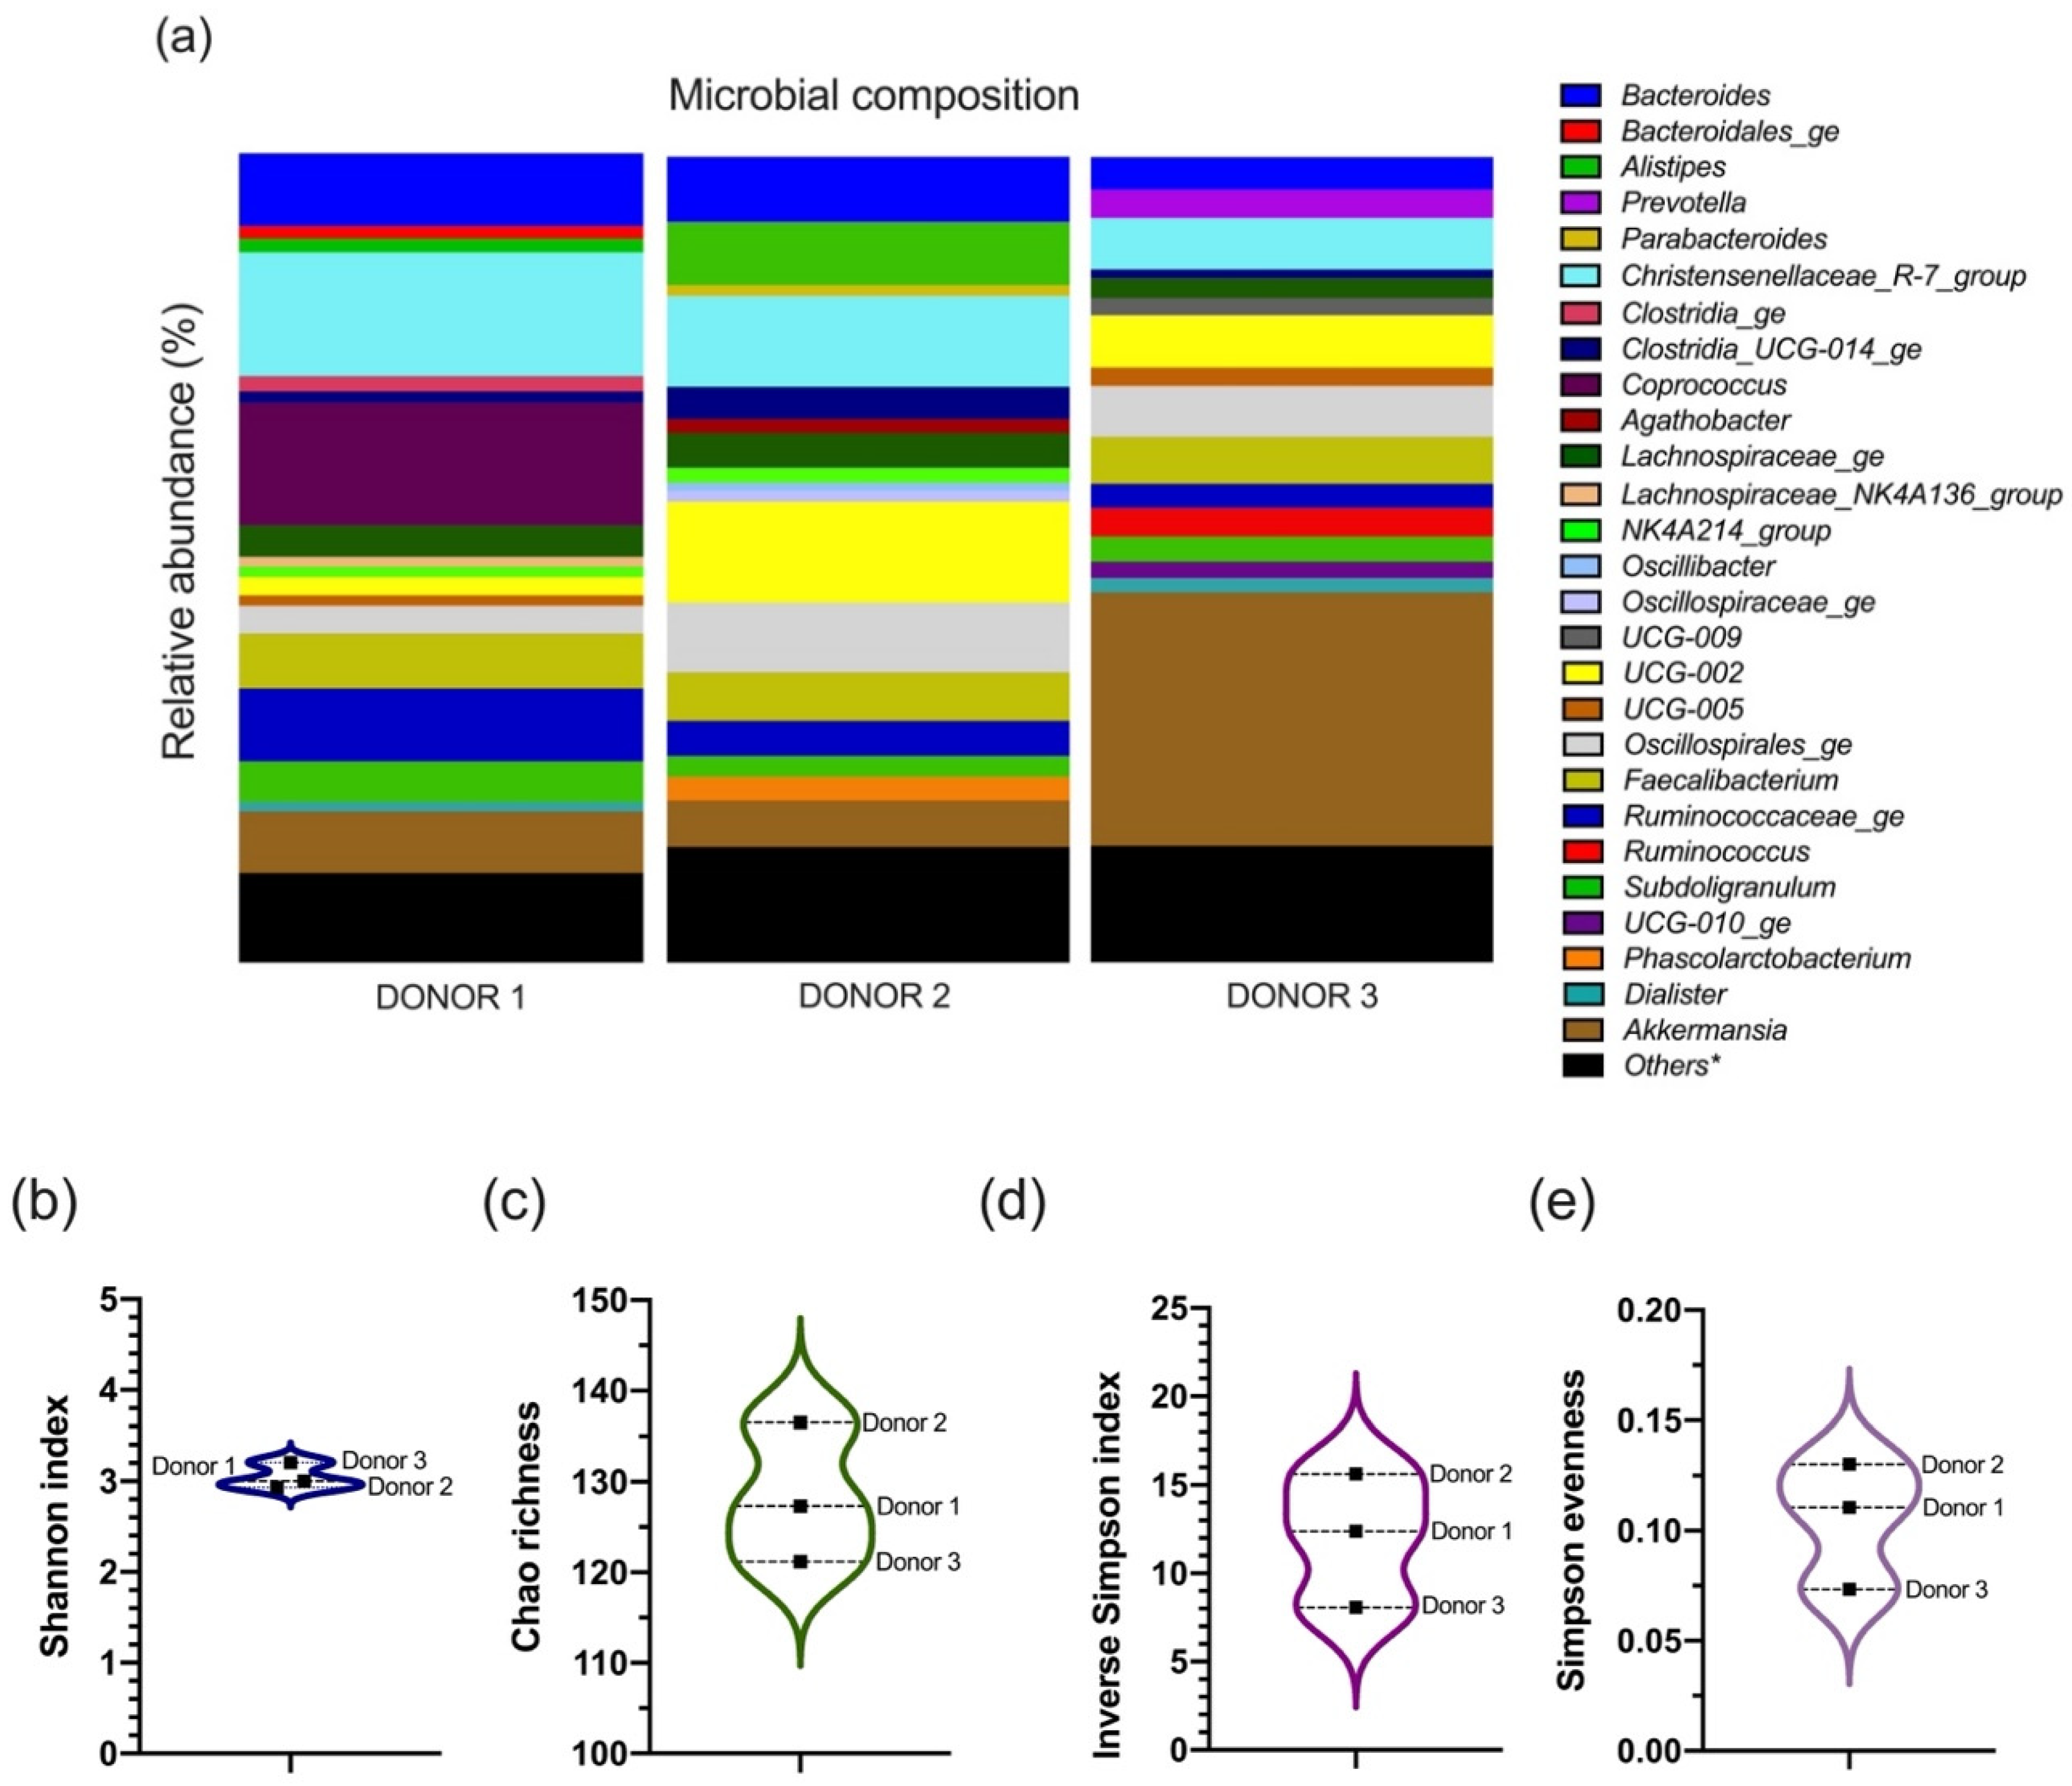
3.1. The Microbial Composition of the Inoculum from Each Donor
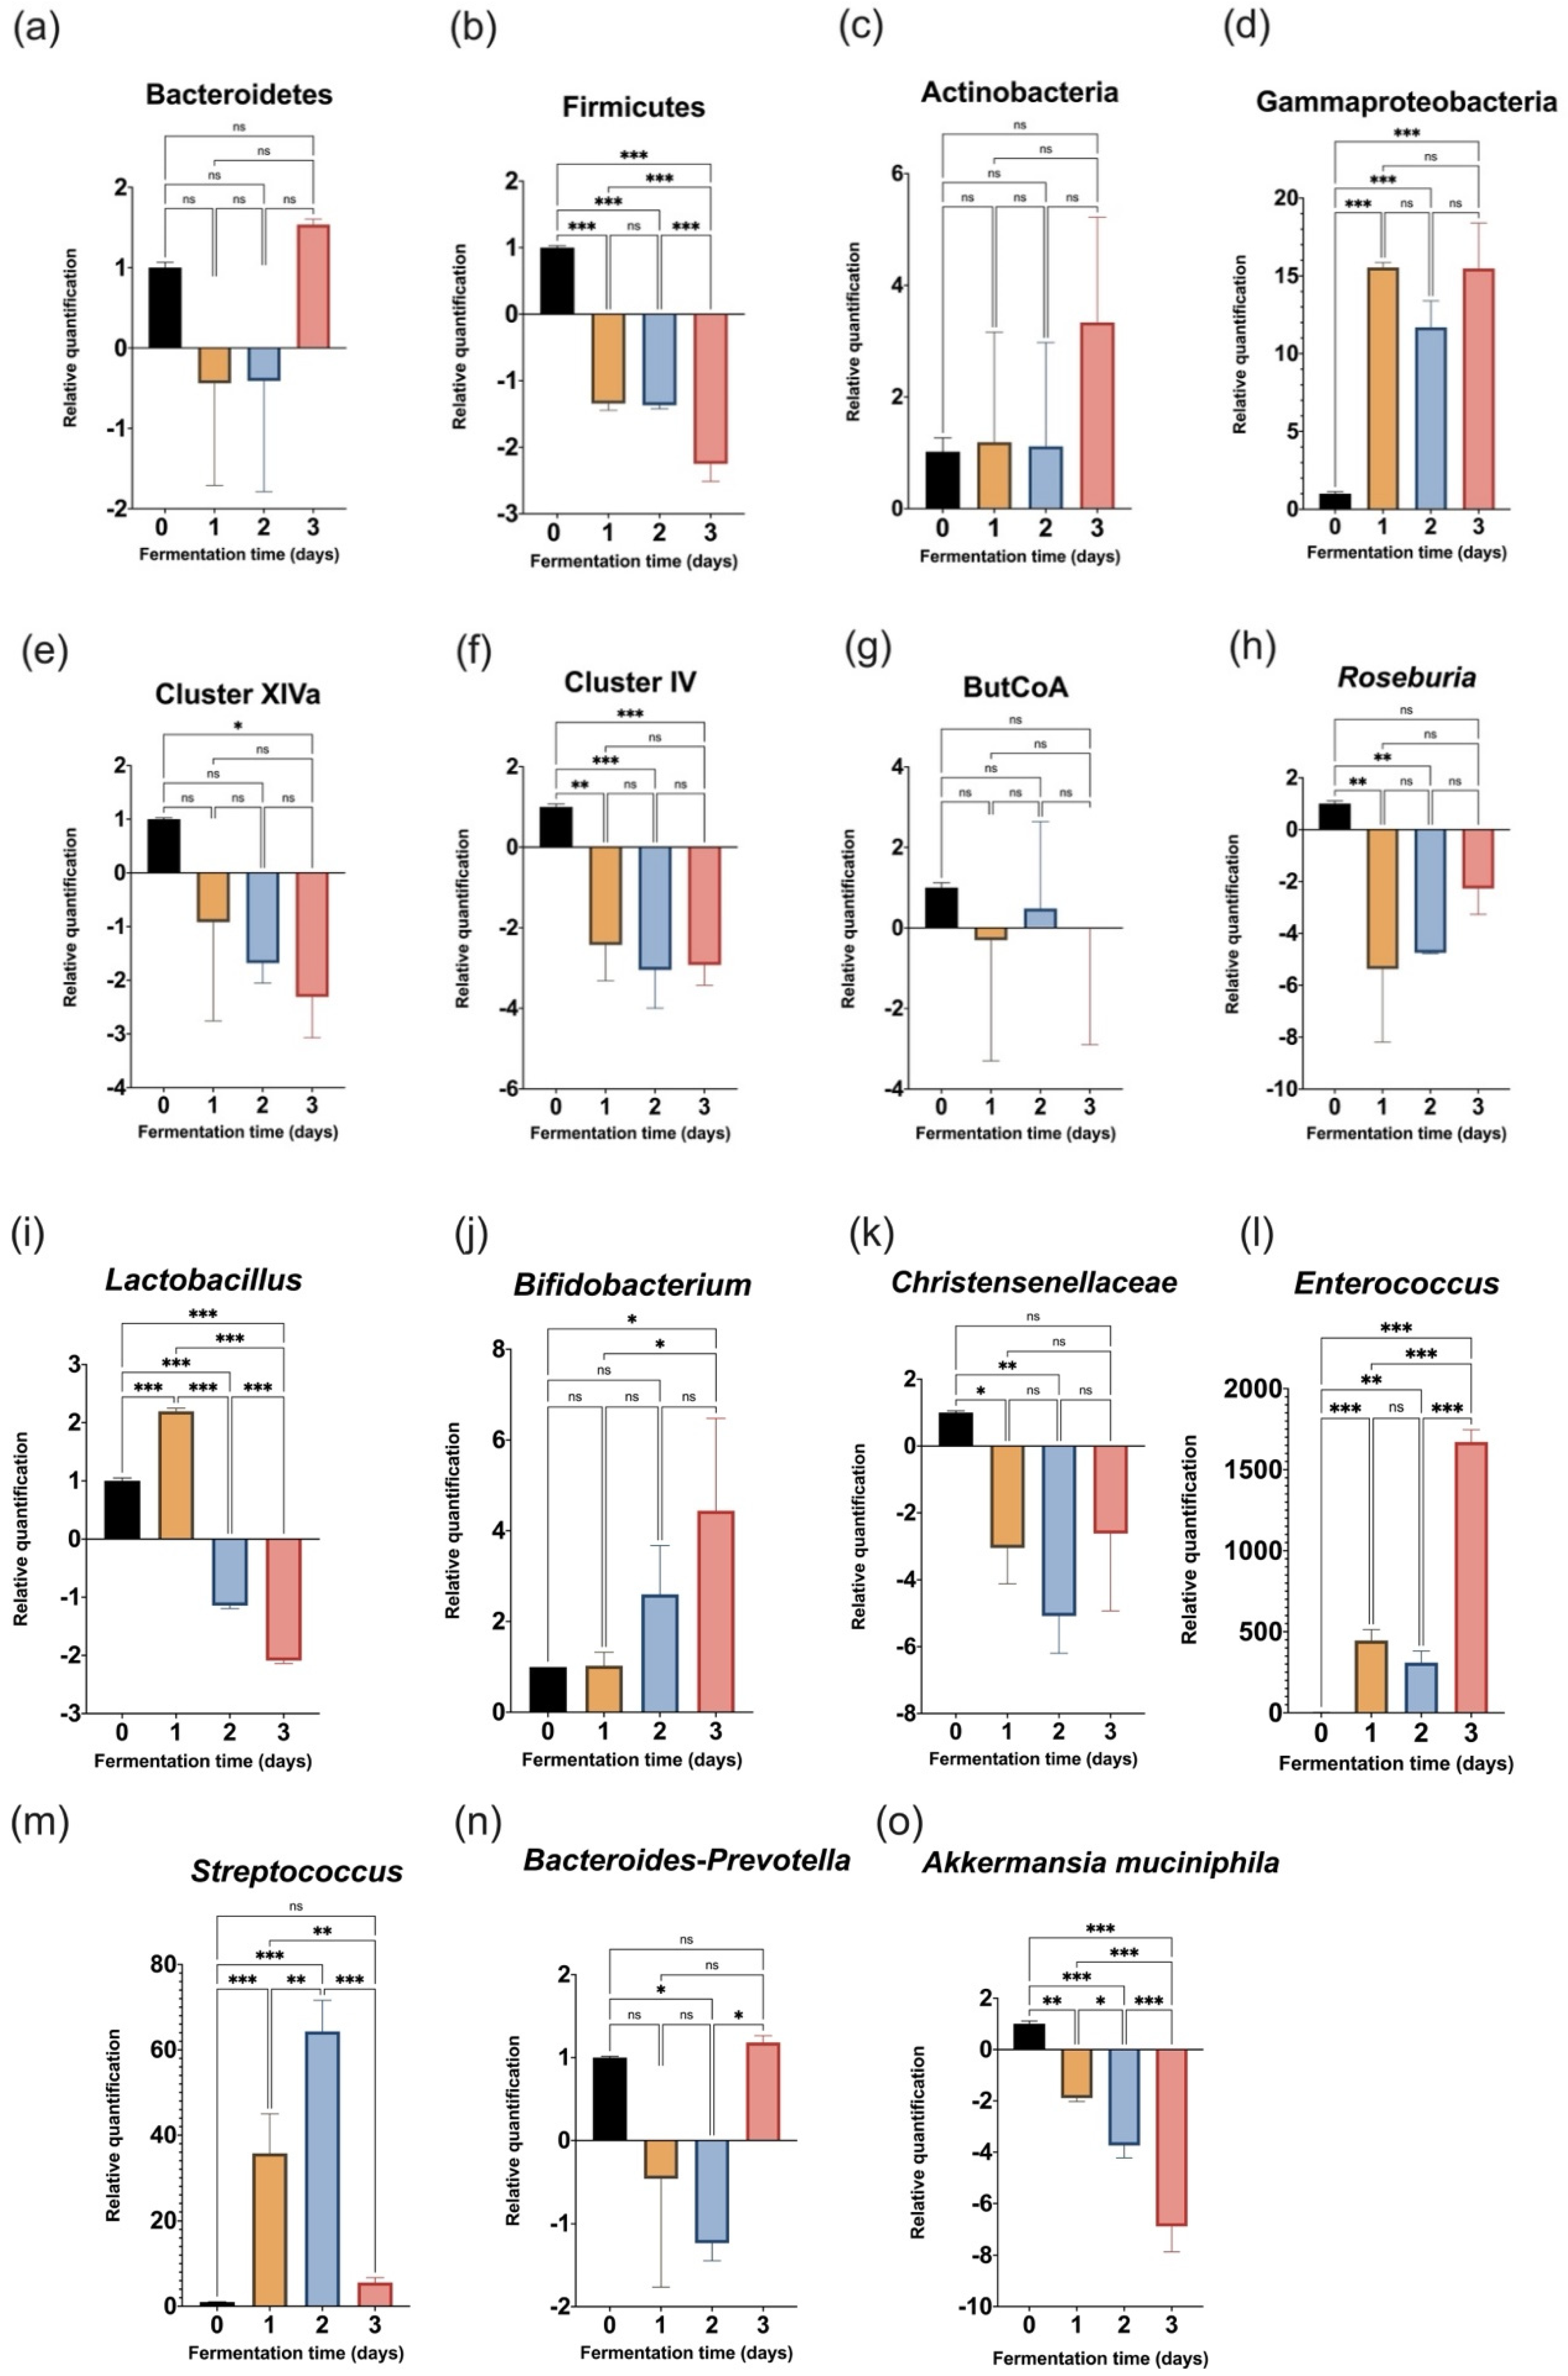
3.2. Evolution of Target Bacteria during the 72-h Fermentation
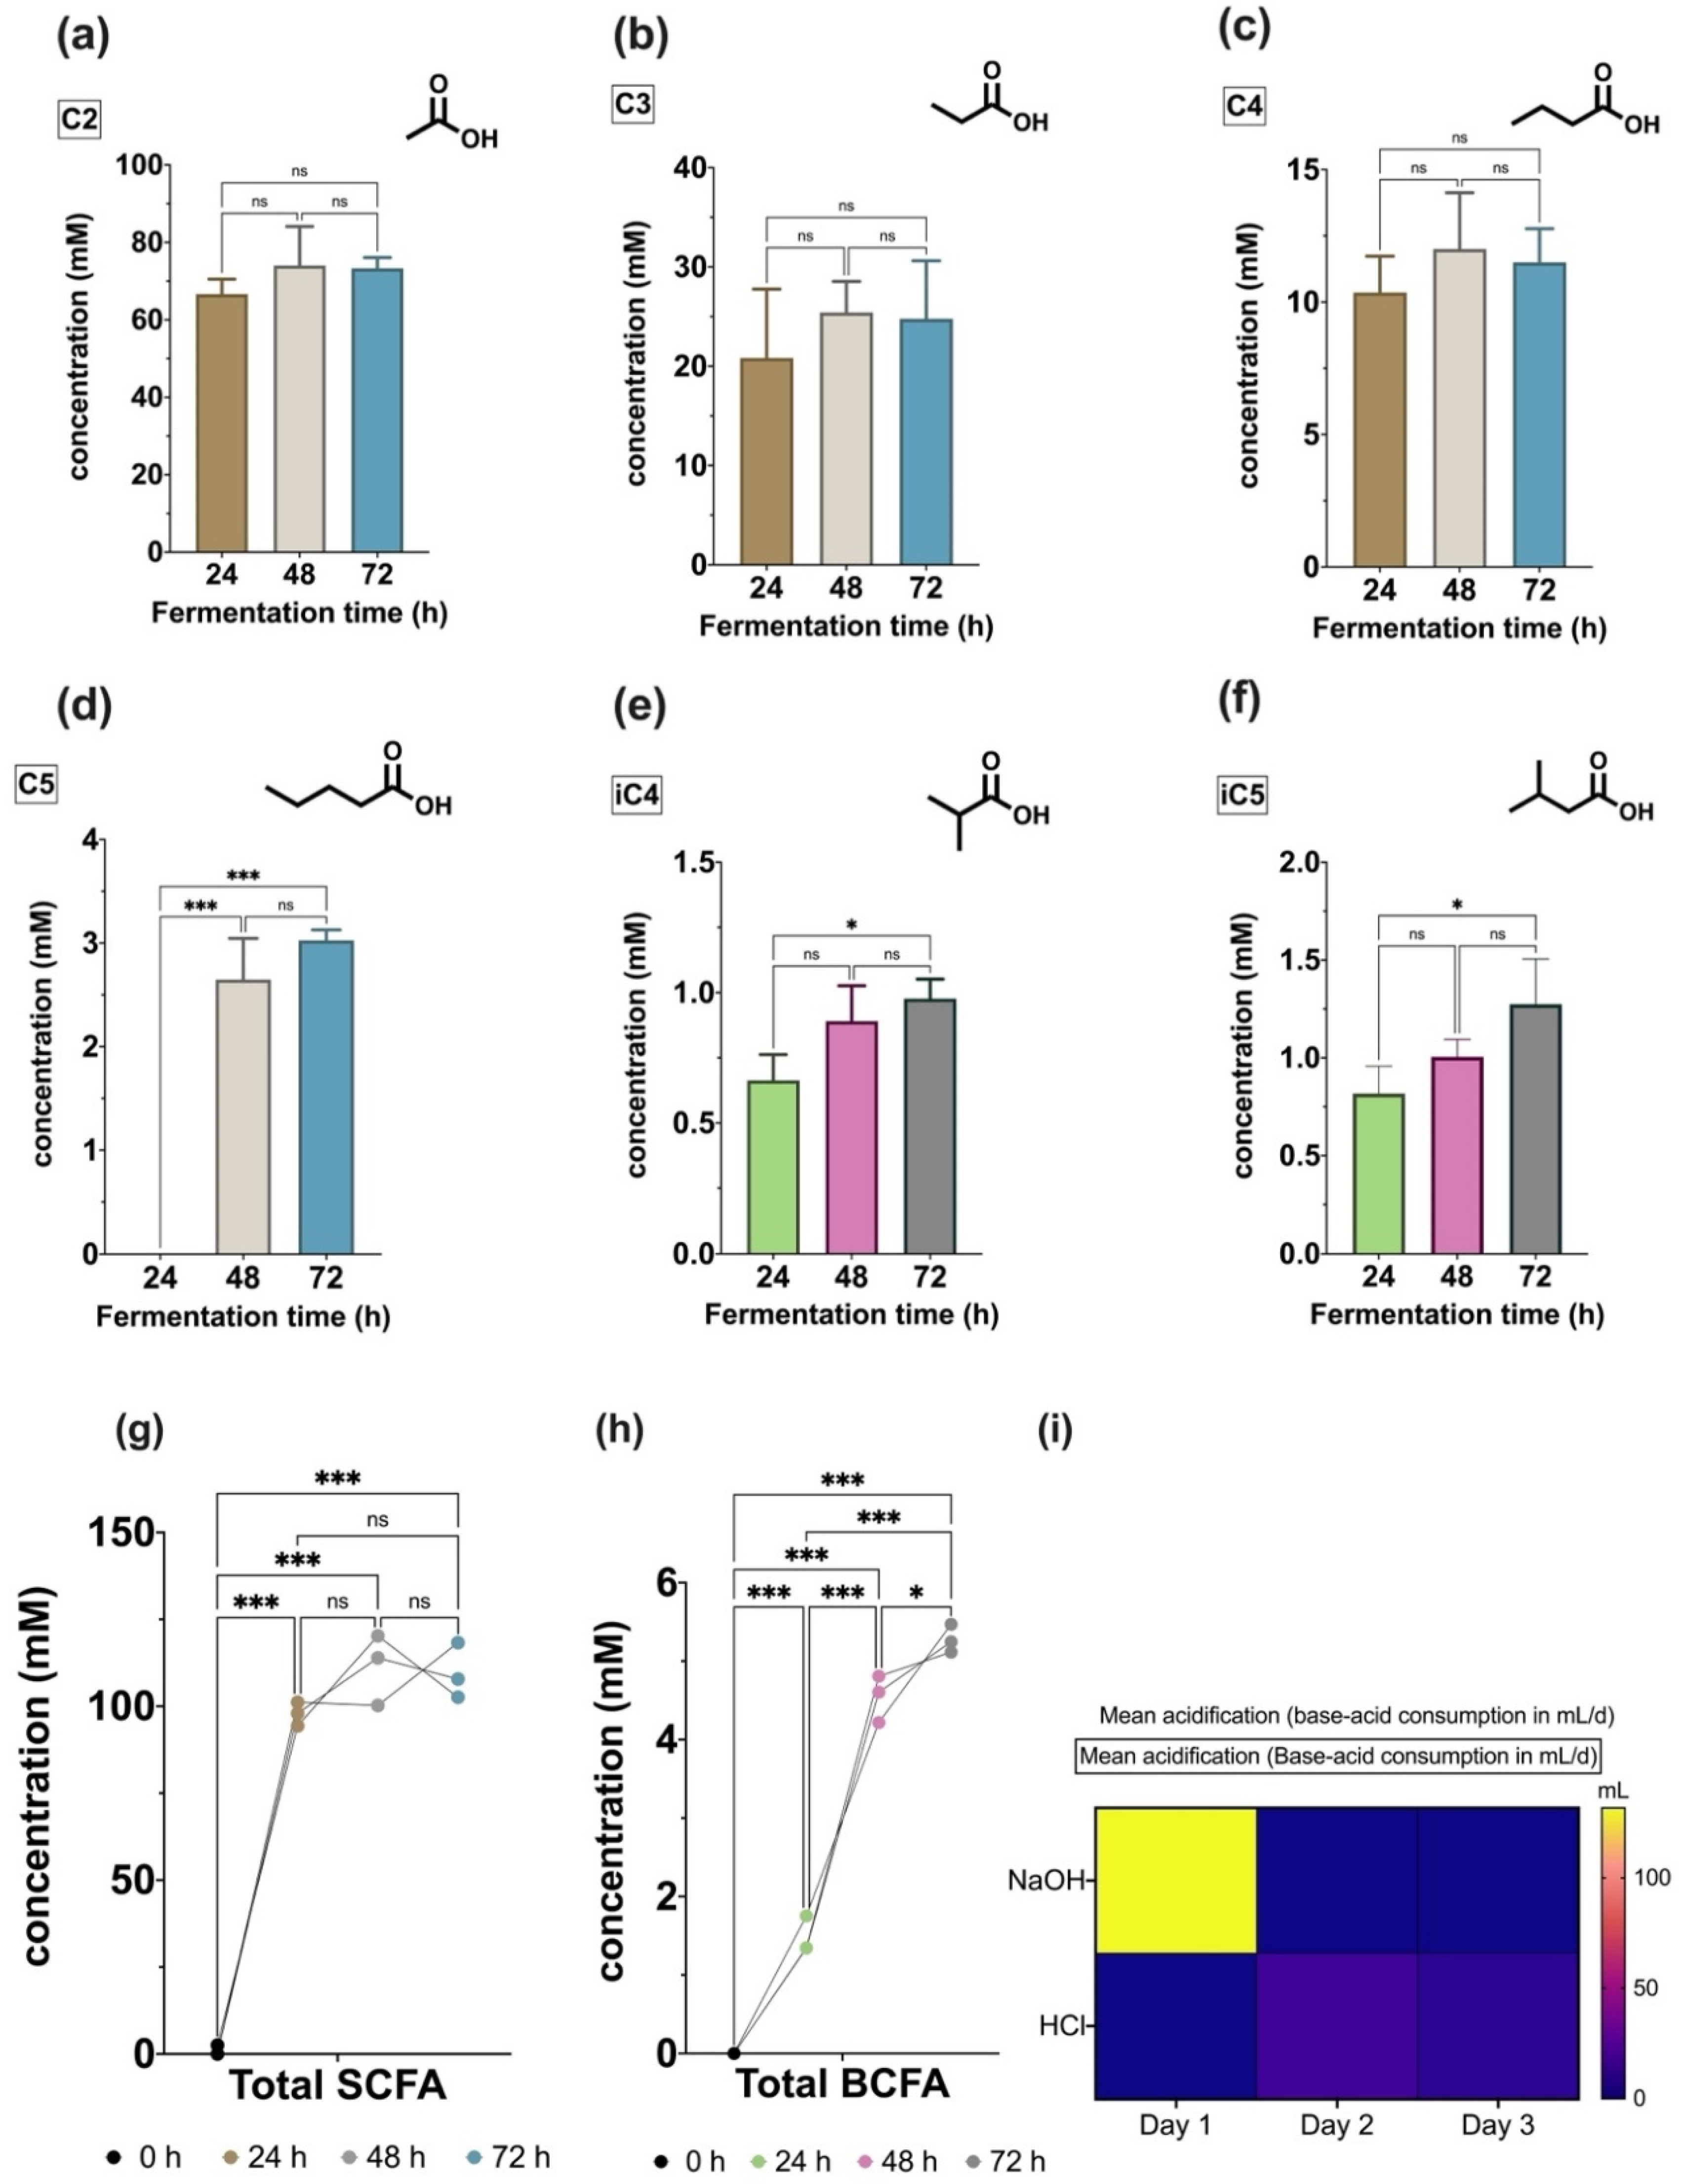
3.3. Colon Microbiota-Derived Metabolic Production
3.3.1. Volatile Fatty Acids Profile
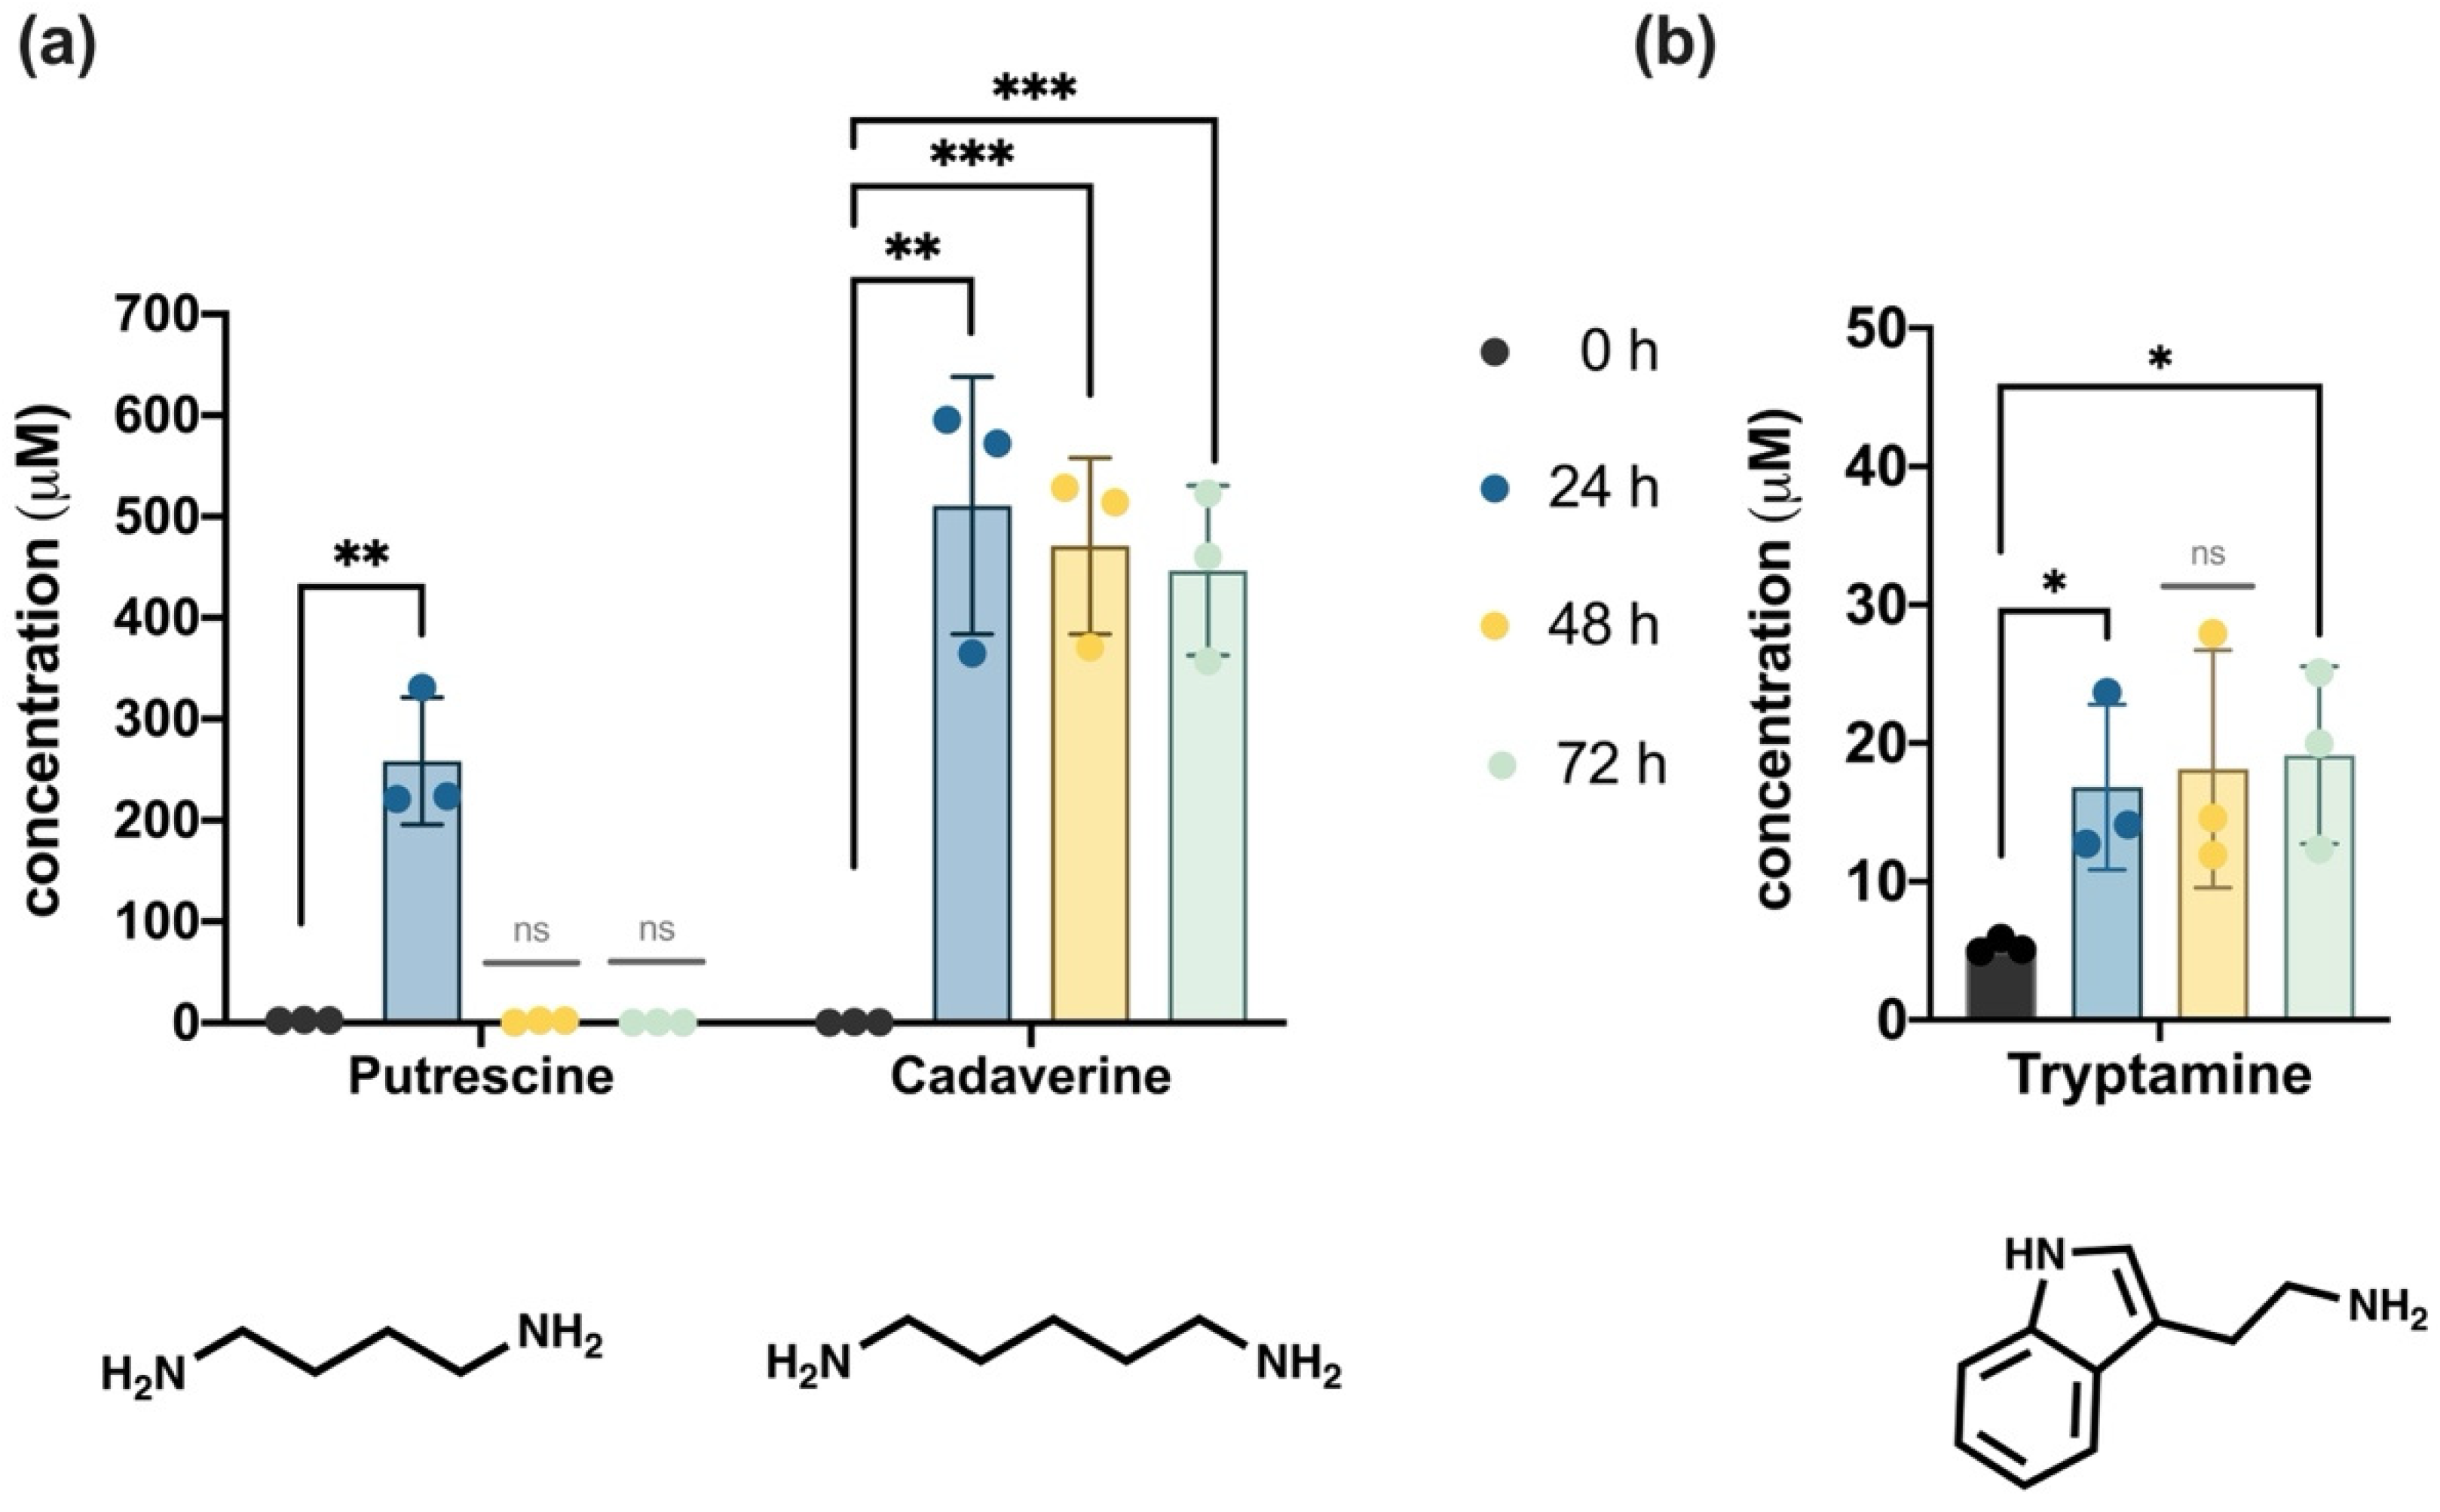
3.3.2. Biogenic Amines Profile
3.4. Microbiota-Derived Metabolites Activate the AhR Transcription
4. Discussion
4.1. Microbiota Interindividual Diversity among Donors Was Pooled in the Fecal Inoculum
4.2. Use of a Convenient and Short-Term In Vitro Simulation of the Human Colon
4.3. Shifts Observed in the Bacterial Community Composition following Inoculation
4.4. Chemical Metabolites Profiling the Microbial Fermentation
4.5. AhR Transcriptional Activation Representing Host-Microbe Interaction
5. Concluding Remarks and the Future Ahead
Supplementary Materials
Author Contributions
Funding
Institutional Review Board Statement
Informed Consent Statement
Data Availability Statement
Conflicts of Interest
References
- Sender, R.; Fuchs, S.; Milo, R. Revised Estimates for the Number of Human and Bacteria Cells in the Body. PLoS Biol. 2016, 14, e1002533. [Google Scholar] [CrossRef] [PubMed] [Green Version]
- Woese, C.R.; Kandler, O.; Wheelis, M.L. Towards a Natural System of Organisms: Proposal for the Domains Archaea, Bacteria, and Eucarya. Proc. Natl. Acad. Sci. USA 1990, 87, 4576–4579. [Google Scholar] [CrossRef] [PubMed] [Green Version]
- Methé, B.A.; Nelson, K.E.; Pop, M.; Creasy, H.H.; Giglio, M.G.; Huttenhower, C.; Gevers, D.; Petrosino, J.F.; Abubucker, S.; Badger, J.H.; et al. A Framework for Human Microbiome Research. Nature 2012, 486, 215–221. [Google Scholar] [CrossRef] [Green Version]
- Adak, A.; Khan, M.R. An Insight into Gut Microbiota and Its Functionalities. Cell. Mol. Life Sci. 2019, 76, 473–493. [Google Scholar] [CrossRef] [PubMed]
- Evans, J.M.; Morris, L.S.; Marchesi, J.R. The Gut Microbiome: The Role of a Virtual Organ in the Endocrinology of the Host. J. Endocrinol. 2013, 218, R37–R47. [Google Scholar] [CrossRef] [PubMed] [Green Version]
- Baquero, F.; Nombela, C. The Microbiome as a Human Organ. Clin. Microbiol. Infect. 2012, 18, 2–4. [Google Scholar] [CrossRef] [Green Version]
- Riccio, P.; Rossano, R. The Human Gut Microbiota Is Neither an Organ nor a Commensal. FEBS Lett. 2020, 594, 3262–3271. [Google Scholar] [CrossRef]
- Bosch, T.C.G.; McFall-Ngai, M.J. Metaorganisms as the New Frontier. Zoology 2011, 114, 185–190. [Google Scholar] [CrossRef] [Green Version]
- Mikov, M. The Metabolism of Drugs by the Gut Flora. Eur. J. Drug Metab. Pharmacokinet. 1994, 19, 201–207. [Google Scholar] [CrossRef]
- Dong, F.; Perdew, G.H. The Aryl Hydrocarbon Receptor as a Mediator of Host-Microbiota Interplay. Gut Microbes 2020, 12, 1859812. [Google Scholar] [CrossRef]
- Nieves, K.M.; Hirota, S.A.; Flannigan, K.L. Xenobiotic Receptors and the Regulation of Intestinal Homeostasis: Harnessing the Chemical Output of the Intestinal Microbiota. Am. J. Physiol.-Gastrointest. Liver Physiol. 2021, 322, G268–G281. [Google Scholar] [CrossRef] [PubMed]
- Birnbaum, L.S. Dioxin and the AH Receptor: Synergy of Discovery. Curr. Opin. Toxicol. 2017, 2, 120–123. [Google Scholar] [CrossRef] [PubMed]
- Doan, T.Q.; Berntsen, H.F.; Verhaegen, S.; Ropstad, E.; Connolly, L.; Igout, A.; Muller, M.; Scippo, M.L. A Mixture of Persistent Organic Pollutants Relevant for Human Exposure Inhibits the Transactivation Activity of the Aryl Hydrocarbon Receptor in Vitro. Environ. Pollut. 2019, 254, 113098. [Google Scholar] [CrossRef] [PubMed] [Green Version]
- Agus, A.; Planchais, J.; Sokol, H. Gut Microbiota Regulation of Tryptophan Metabolism in Health and Disease. Cell Host Microbe 2018, 23, 716–724. [Google Scholar] [CrossRef] [Green Version]
- Liu, J.-R.; Miao, H.; Deng, D.-Q.; Vaziri, N.D.; Li, P.; Zhao, Y.-Y. Gut Microbiota-Derived Tryptophan Metabolism Mediates Renal Fibrosis by Aryl Hydrocarbon Receptor Signaling Activation. Cell. Mol. Life Sci. 2021, 78, 909–922. [Google Scholar] [CrossRef]
- Jin, U.-H.; Cheng, Y.; Park, H.; Davidson, L.A.; Callaway, E.S.; Chapkin, R.S.; Jayaraman, A.; Asante, A.; Allred, C.; Weaver, E.A.; et al. Short Chain Fatty Acids Enhance Aryl Hydrocarbon (Ah) Responsiveness in Mouse Colonocytes and Caco-2 Human Colon Cancer Cells. Sci. Rep. 2017, 7, 10163. [Google Scholar] [CrossRef] [Green Version]
- Korecka, A.; Dona, A.; Lahiri, S.; Tett, A.J.; Al-Asmakh, M.; Braniste, V.; D’Arienzo, R.; Abbaspour, A.; Reichardt, N.; Fujii-Kuriyama, Y.; et al. Bidirectional Communication between the Aryl Hydrocarbon Receptor (AhR) and the Microbiome Tunes Host Metabolism. NPJ Biofilms Microbiomes 2016, 2, 16014. [Google Scholar] [CrossRef] [Green Version]
- Barroso, A.; Gualdrón-López, M.; Esper, L.; Brant, F.; Araújo, R.R.S.; Carneiro, M.B.H.; Ávila, T.V.; Souza, D.G.; Vieira, L.Q.; Rachid, M.A.; et al. The Aryl Hydrocarbon Receptor Modulates Production of Cytokines and Reactive Oxygen Species and Development of Myocarditis during Trypanosoma Cruzi Infection. Infect. Immunity 2016, 84, 3071–3082. [Google Scholar] [CrossRef] [Green Version]
- Moura-Alves, P.; Faé, K.; Houthuys, E.; Dorhoi, A.; Kreuchwig, A.; Furkert, J.; Barison, N.; Diehl, A.; Munder, A.; Constant, P.; et al. AhR Sensing of Bacterial Pigments Regulates Antibacterial Defence. Nature 2014, 512, 387–392. [Google Scholar] [CrossRef]
- Sanchez, Y.; de Dios Rosado, J.; Vega, L.; Elizondo, G.; Estrada-Muñiz, E.; Saavedra, R.; Juárez, I.; Rodríguez-Sosa, M. The Unexpected Role for the Aryl Hydrocarbon Receptor on Susceptibility to Experimental Toxoplasmosis. J. Biomed. Biotechnol. 2010, 2010, 505694. [Google Scholar] [CrossRef] [Green Version]
- Kiss, E.A.; Vonarbourg, C.; Kopfmann, S.; Hobeika, E.; Finke, D.; Esser, C.; Diefenbach, A. Natural Aryl Hydrocarbon Receptor Ligands Control Organogenesis of Intestinal Lymphoid Follicles. Science (1979) 2011, 334, 1561–1565. [Google Scholar] [CrossRef] [PubMed]
- Sipos, F.; Muzes, G. Isolated Lymphoid Follicles in Colon: Switch Points between Inflammation and Colorectal Cancer? World J. Gastroenterol. 2011, 17, 1666–1673. [Google Scholar] [CrossRef] [PubMed]
- Monteleone, I.; Rizzo, A.; Sarra, M.; Sica, G.; Sileri, P.; Biancone, L.; MacDonald, T.T.; Pallone, F.; Monteleone, G. Aryl Hydrocarbon Receptor-Induced Signals up-Regulate IL-22 Production and Inhibit Inflammation in the Gastrointestinal Tract. Gastroenterology 2011, 141, 237–248.e1. [Google Scholar] [CrossRef] [PubMed]
- Weidenbusch, M.; Rodler, S.; Song, S.; Romoli, S.; Marschner, J.A.; Kraft, F.; Holderied, A.; Kumar, S.; Mulay, S.R.; Honarpisheh, M.; et al. Gene Expression Profiling of the Notch-AhR-IL22 Axis at Homeostasis and in Response to Tissue Injury. Biosci. Rep. 2017, 37, BSR20170099. [Google Scholar] [CrossRef] [Green Version]
- Han, H.; Davidson, L.A.; Fan, Y.-Y.; Landrock, K.K.; Jayaraman, A.; Safe, S.H.; Chapkin, R.S. Loss of Aryl Hydrocarbon Receptor Suppresses the Response of Colonic Epithelial Cells to IL22 Signaling by Upregulating SOCS3. Am. J. Physiol.-Gastrointest. Liver Physiol. 2021, 322, G93–G106. [Google Scholar] [CrossRef] [PubMed]
- Li, Y.; Innocentin, S.; Withers, D.R.; Roberts, N.A.; Gallagher, A.R.; Grigorieva, E.F.; Wilhelm, C.; Veldhoen, M. Exogenous Stimuli Maintain Intraepithelial Lymphocytes via Aryl Hydrocarbon Receptor Activation. Cell 2011, 147, 629–640. [Google Scholar] [CrossRef] [Green Version]
- Megna, B.W.; Carney, P.R.; Depke, M.G.; Nukaya, M.; McNally, J.; Larsen, L.; Rosengren, R.J.; Kennedy, G.D. The Aryl Hydrocarbon Receptor as an Antitumor Target of Synthetic Curcuminoids in Colorectal Cancer. J. Surg. Res. 2017, 213, 16–24. [Google Scholar] [CrossRef] [Green Version]
- Goya-Jorge, E.; Jorge Rodríguez, M.E.; Veitía, M.S.; Giner, R.M. Plant Occurring Flavonoids as Modulators of the Aryl Hydrocarbon Receptor. Molecules 2021, 26, 2315. [Google Scholar] [CrossRef]
- Murray, I.A.; Patterson, A.D.; Perdew, G.H. Aryl Hydrocarbon Receptor Ligands in Cancer: Friend and Foe. Nat. Rev. Cancer 2014, 14, 801–814. [Google Scholar] [CrossRef]
- Gutiérrez-Vázquez, C.; Quintana, F.J. Regulation of the Immune Response by the Aryl Hydrocarbon Receptor. Immunity 2018, 48, 19–33. [Google Scholar] [CrossRef] [Green Version]
- Nguyen, N.T.; Kimura, A.; Nakahama, T.; Chinen, I.; Masuda, K.; Nohara, K.; Fujii-Kuriyama, Y.; Kishimoto, T. Aryl Hydrocarbon Receptor Negatively Regulates Dendritic Cell Immunogenicity via a Kynurenine-Dependent Mechanism. Proc. Natl. Acad. Sci. USA 2010, 107, 19961–19966. [Google Scholar] [CrossRef] [PubMed] [Green Version]
- Gagliani, N.; Vesely, M.C.A.; Iseppon, A.; Brockmann, L.; Xu, H.; Palm, N.W.; de Zoete, M.R.; Licona-Limón, P.; Paiva, R.S.; Ching, T.; et al. Th17 Cells Transdifferentiate into Regulatory T Cells during Resolution of Inflammation. Nature 2015, 523, 221–225. [Google Scholar] [CrossRef] [PubMed]
- Omenetti, S.; Pizarro, T.T. The Treg/Th17 Axis: A Dynamic Balance Regulated by the Gut Microbiome. Front. Immunol. 2015, 6, 639. [Google Scholar] [CrossRef] [PubMed] [Green Version]
- Rosser, E.C.; Piper, C.J.M.; Matei, D.E.; Blair, P.A.; Rendeiro, A.F.; Orford, M.; Alber, D.G.; Krausgruber, T.; Catalan, D.; Klein, N.; et al. Microbiota-Derived Metabolites Suppress Arthritis by Amplifying Aryl-Hydrocarbon Receptor Activation in Regulatory B Cells. Cell Metab. 2020, 31, 837–851.e10. [Google Scholar] [CrossRef] [PubMed]
- Bircher, L.; Schwab, C.; Geirnaert, A.; Lacroix, C. Cryopreservation of Artificial Gut Microbiota Produced with in Vitro Fermentation Technology. Microb. Biotechnol. 2018, 11, 163–175. [Google Scholar] [CrossRef]
- van der Heiden, E.; Bechoux, N.; Muller, M.; Sergent, T.; Schneider, Y.J.; Larondelle, Y.; Maghuin-Rogister, G.; Scippo, M.L. Food Flavonoid Aryl Hydrocarbon Receptor-Mediated Agonistic/Antagonistic/Synergic Activities in Human and Rat Reporter Gene Assays. Anal. Chim. Acta 2009, 637, 337–345. [Google Scholar] [CrossRef]
- Aguirre, M.; Ramiro-Garcia, J.; Koenen, M.E.; Venema, K. To Pool or Not to Pool? Impact of the Use of Individual and Pooled Fecal Samples for in Vitro Fermentation Studies. J. Microbiol. Methods 2014, 107, 1–7. [Google Scholar] [CrossRef]
- Rognes, T.; Flouri, T.; Nichols, B.; Quince, C.; Mahé, F. VSEARCH: A Versatile Open Source Tool for Metagenomics. PeerJ 2016, 4, e2584. [Google Scholar] [CrossRef]
- Quast, C.; Pruesse, E.; Yilmaz, P.; Gerken, J.; Schweer, T.; Yarza, P.; Peplies, J.; Glöckner, F.O. The SILVA Ribosomal RNA Gene Database Project: Improved Data Processing and Web-Based Tools. Nucleic Acids Res. 2013, 41, D590–D596. [Google Scholar] [CrossRef]
- Bacchetti De Gregoris, T.; Aldred, N.; Clare, A.S.; Burgess, J.G. Improvement of Phylum- and Class-Specific Primers for Real-Time PCR Quantification of Bacterial Taxa. J. Microbiol. Methods 2011, 86, 351–356. [Google Scholar] [CrossRef]
- Bustin, S.A.; Beaulieu, J.-F.; Huggett, J.; Jaggi, R.; Kibenge, F.S.B.; Olsvik, P.A.; Penning, L.C.; Toegel, S. MIQE Précis: Practical Implementation of Minimum Standard Guidelines for Fluorescence-Based Quantitative Real-Time PCR Experiments. BMC Mol. Biol. 2010, 11, 74. [Google Scholar] [CrossRef] [PubMed] [Green Version]
- Livak, K.J.; Schmittgen, T.D. Analysis of Relative Gene Expression Data Using Real-Time Quantitative PCR and the 2−ΔΔCT Method. Methods 2001, 25, 402–408. [Google Scholar] [CrossRef]
- Douny, C.; Dufourny, S.; Brose, F.; Verachtert, P.; Rondia, P.; Lebrun, S.; Marzorati, M.; Everaert, N.; Delcenserie, V.; Scippo, M.-L. Development of an Analytical Method to Detect Short-Chain Fatty Acids by SPME-GC-MS in Samples Coming from an in Vitro Gastrointestinal Model. J. Chromatogr. B 2019, 1124, 188–196. [Google Scholar] [CrossRef] [PubMed]
- Douny, C.; Benmedjadi, S.; Brose, F.; Afé, O.H.I.; Igout, A.; Hounhouigan, D.J.; Anihouvi, V.B.; Scippo, M.-L. Development of an Analytical Method for the Simultaneous Measurement of 10 Biogenic Amines in Meat: Application to Beninese Grilled Pork Samples. Food Anal. Methods 2019, 12, 2392–2400. [Google Scholar] [CrossRef]
- Mosmann, T. Rapid Colorimetric Assay for Cellular Growth and Survival: Application to Proliferation and Cytotoxicity Assays. J. Immunol. Methods 1983, 65, 55–63. [Google Scholar] [CrossRef]
- Goya-Jorge, E.; Rampal, C.; Loones, N.; Barigye, S.J.; Carpio, L.E.; Gozalbes, R.; Ferroud, C.; Veitía, M.S.-I.; Giner, R.M. Targeting the Aryl Hydrocarbon Receptor with a Novel Set of Triarylmethanes. Eur. J. Med. Chem. 2020, 207, 112777. [Google Scholar] [CrossRef]
- Goya-Jorge, E.; Doan, T.Q.; Scippo, M.L.; Muller, M.; Giner, R.M.; Barigye, S.J.; Gozalbes, R. Elucidating the Aryl Hydrocarbon Receptor Antagonism from a Chemical-Structural Perspective. SAR QSAR Environ. Res. 2020, 31, 209–226. [Google Scholar] [CrossRef]
- Arumugam, M.; Raes, J.; Pelletier, E.; le Paslier, D.; Yamada, T.; Mende, D.R.; Fernandes, G.R.; Tap, J.; Bruls, T.; Batto, J.-M.; et al. Enterotypes of the Human Gut Microbiome. Nature 2011, 473, 174–180. [Google Scholar] [CrossRef]
- Costea, P.I.; Hildebrand, F.; Arumugam, M.; Bäckhed, F.; Blaser, M.J.; Bushman, F.D.; de Vos, W.M.; Ehrlich, S.D.; Fraser, C.M.; Hattori, M.; et al. Enterotypes in the Landscape of Gut Microbial Community Composition. Nat. Microbiol. 2018, 3, 8–16. [Google Scholar] [CrossRef] [Green Version]
- Goodrich, J.K.; Waters, J.L.; Poole, A.C.; Sutter, J.L.; Koren, O.; Blekhman, R.; Beaumont, M.; van Treuren, W.; Knight, R.; Bell, J.T.; et al. Human Genetics Shape the Gut Microbiome. Cell 2014, 159, 789–799. [Google Scholar] [CrossRef] [Green Version]
- Maya-Lucas, O.; Murugesan, S.; Nirmalkar, K.; Alcaraz, L.D.; Hoyo-Vadillo, C.; Pizano-Zárate, M.L.; García-Mena, J. The Gut Microbiome of Mexican Children Affected by Obesity. Anaerobe 2019, 55, 11–23. [Google Scholar] [CrossRef] [PubMed]
- Hollister, E.B.; Cain, K.C.; Shulman, R.J.; Jarrett, M.E.; Burr, R.L.; Ko, C.; Zia, J.; Han, C.J.; Heitkemper, M.M. Relationships of Microbiome Markers With Extraintestinal, Psychological Distress and Gastrointestinal Symptoms, and Quality of Life in Women With Irritable Bowel Syndrome. J. Clin. Gastroenterol. 2020, 54, 175–183. [Google Scholar] [CrossRef] [PubMed]
- Chen, Y.; Zheng, H.; Zhang, G.; Chen, F.; Chen, L.; Yang, Z. High Oscillospira Abundance Indicates Constipation and Low BMI in the Guangdong Gut Microbiome Project. Sci. Rep. 2020, 10, 9364. [Google Scholar] [CrossRef]
- Parker, B.J.; Wearsch, P.A.; Veloo, A.C.M.; Rodriguez-Palacios, A. The Genus Alistipes: Gut Bacteria With Emerging Implications to Inflammation, Cancer, and Mental Health. Front. Immunol. 2020, 11, 906. [Google Scholar] [CrossRef] [PubMed]
- Wu, F.; Guo, X.; Zhang, J.; Zhang, M.; Ou, Z.; Peng, Y. Phascolarctobacterium Faecium Abundant Colonization in Human Gastrointestinal Tract. Exp. Ther. Med. 2017, 14, 3122–3126. [Google Scholar] [CrossRef] [PubMed] [Green Version]
- Li, L.; Su, Q.; Xie, B.; Duan, L.; Zhao, W.; Hu, D.; Wu, R.; Liu, H. Gut Microbes in Correlation with Mood: Case Study in a Closed Experimental Human Life Support System. Neurogastroenterol. Motil. 2016, 28, 1233–1240. [Google Scholar] [CrossRef]
- Sylvie, M.; Marion, L.; Rebeca, M.; Florian, C.; Marion, L.; Sébastien, R.; Sylvie, H.; Chantal, B.; Trent, N.; Benjamin, B.; et al. Identification of Metabolic Signatures Linked to Anti-Inflammatory Effects of Faecalibacterium Prausnitzii. mBio 2022, 6, e00300-15. [Google Scholar] [CrossRef] [Green Version]
- Carmen, C.M.; Muriel, D.; Erika, I.; de Vos, W.M.; Seppo, S. Intestinal Integrity and Akkermansia muciniphila, a Mucin-Degrading Member of the Intestinal Microbiota Present in Infants, Adults, and the Elderly. Appl. Environ. Microbiol. 2007, 73, 7767–7770. [Google Scholar] [CrossRef] [Green Version]
- Falony, G.; Joossens, M.; Vieira-Silva, S.; Wang, J.; Darzi, Y.; Faust, K.; Kurilshikov, A.; Bonder, M.J.; Valles-Colomer, M.; Vandeputte, D.; et al. Population-Level Analysis of Gut Microbiome Variation. Science (1979) 2016, 352, 560–564. [Google Scholar] [CrossRef]
- Turnbaugh, P.J.; Hamady, M.; Yatsunenko, T.; Cantarel, B.L.; Duncan, A.; Ley, R.E.; Sogin, M.L.; Jones, W.J.; Roe, B.A.; Affourtit, J.P.; et al. A Core Gut Microbiome in Obese and Lean Twins. Nature 2009, 457, 480–484. [Google Scholar] [CrossRef] [Green Version]
- Spencer, M.D.; Hamp, T.J.; Reid, R.W.; Fischer, L.M.; Zeisel, S.H.; Fodor, A.A. Association Between Composition of the Human Gastrointestinal Microbiome and Development of Fatty Liver with Choline Deficiency. Gastroenterology 2011, 140, 976–986. [Google Scholar] [CrossRef] [PubMed] [Green Version]
- Dethlefsen, L.; Eckburg, P.B.; Bik, E.M.; Relman, D.A. Assembly of the Human Intestinal Microbiota. Trends Ecol. Evol. 2006, 21, 517–523. [Google Scholar] [CrossRef] [PubMed]
- Zhu, A.; Sunagawa, S.; Mende, D.R.; Bork, P. Inter-Individual Differences in the Gene Content of Human Gut Bacterial Species. Genome Biol. 2015, 16, 82. [Google Scholar] [CrossRef] [PubMed] [Green Version]
- Rinninella, E.; Raoul, P.; Cintoni, M.; Franceschi, F.; Miggiano, G.A.D.; Gasbarrini, A.; Mele, M.C. What Is the Healthy Gut Microbiota Composition? A Changing Ecosystem across Age, Environment, Diet, and Diseases. Microorganisms 2019, 7, 14. [Google Scholar] [CrossRef] [Green Version]
- McDonald, J.A.K.; Schroeter, K.; Fuentes, S.; Heikamp-deJong, I.; Khursigara, C.M.; de Vos, W.M.; Allen-Vercoe, E. Evaluation of Microbial Community Reproducibility, Stability and Composition in a Human Distal Gut Chemostat Model. J. Microbiol. Methods 2013, 95, 167–174. [Google Scholar] [CrossRef]
- Simon, J.-C.; Marchesi, J.R.; Mougel, C.; Selosse, M.-A. Host-Microbiota Interactions: From Holobiont Theory to Analysis. Microbiome 2019, 7, 5. [Google Scholar] [CrossRef]
- van de Guchte, M.; Blottière, H.M.; Doré, J. Humans as Holobionts: Implications for Prevention and Therapy. Microbiome 2018, 6, 81. [Google Scholar] [CrossRef]
- Payne, A.N.; Zihler, A.; Chassard, C.; Lacroix, C. Advances and Perspectives in in Vitro Human Gut Fermentation Modeling. Trends Biotechnol. 2012, 30, 17–25. [Google Scholar] [CrossRef]
- Macfarlane, G.T.; Macfarlane, S. Models for Intestinal Fermentation: Association between Food Components, Delivery Systems, Bioavailability and Functional Interactions in the Gut. Curr. Opin. Biotechnol. 2007, 18, 156–162. [Google Scholar] [CrossRef]
- Nissen, L.; Casciano, F.; Gianotti, A. Intestinal Fermentation in vitro Models to Study Food-Induced Gut Microbiota Shift: An Updated Review. FEMS Microbiol. Lett. 2020, 367, fnaa097. [Google Scholar] [CrossRef]
- Day-Walsh, P.; Shehata, E.; Saha, S.; Savva, G.M.; Nemeckova, B.; Speranza, J.; Kellingray, L.; Narbad, A.; Kroon, P.A. The Use of an In-Vitro Batch Fermentation (Human Colon) Model for Investigating Mechanisms of TMA Production from Choline, l-Carnitine and Related Precursors by the Human Gut Microbiota. Eur. J. Nutr. 2021, 60, 3987–3999. [Google Scholar] [CrossRef] [PubMed]
- Liu, Y.; Gibson, G.R.; Walton, G.E. An In Vitro Approach to Study Effects of Prebiotics and Probiotics on the Faecal Microbiota and Selected Immune Parameters Relevant to the Elderly. PLoS ONE 2016, 11, e0162604. [Google Scholar] [CrossRef] [PubMed]
- Parmanand, B.A.; Kellingray, L.; le Gall, G.; Basit, A.W.; Fairweather-Tait, S.; Narbad, A. A Decrease in Iron Availability to Human Gut Microbiome Reduces the Growth of Potentially Pathogenic Gut Bacteria; an in vitro Colonic Fermentation Study. J. Nutr. Biochem. 2019, 67, 20–27. [Google Scholar] [CrossRef]
- Golińska, E.; Tomusiak, A.; Gosiewski, T.; Więcek, G.; Machul, A.; Mikołajczyk, D.; Bulanda, M.; Heczko, P.B.; Strus, M. Virulence Factors of Enterococcus Strains Isolated from Patients with Inflammatory Bowel Disease. World J. Gastroenterol. 2013, 19, 3562–3572. [Google Scholar] [CrossRef] [PubMed]
- Kitagawa, D.; Komatsu, M.; Nakamura, A.; Suzuki, S.; Oka, M.; Masuo, K.; Hamanaka, E.; Sato, M.; Maeda, K.; Nakamura, F. Nosocomial Infections Caused by Vancomycin-Resistant Enterococcus in a Japanese General Hospital and Molecular Genetic Analysis. J. Infect. Chemother. 2021, 27, 1689–1693. [Google Scholar] [CrossRef]
- Franz, C.M.A.P.; Huch, M.; Abriouel, H.; Holzapfel, W.; Gálvez, A. Enterococci as Probiotics and Their Implications in Food Safety. Int. J. Food Microbiol. 2011, 151, 125–140. [Google Scholar] [CrossRef] [Green Version]
- Hlivak, P.; Odraska, J.; Ferencik, M.; Ebringer, L.; Jahnova, E.; Mikes, Z. One-Year Application of Probiotic Strain Enterococcus faecium M-74 Decreases Serum Cholesterol Levels. Bratisl. Lekárske Listy 2005, 106, 67–72. [Google Scholar]
- D’Souza, A.L.; Rajkumar, C.; Cooke, J.; Bulpitt, C.J. Probiotics in Prevention of Antibiotic Associated Diarrhoea: Meta-Analysis. Br. Med. J. 2002, 324, 1361. [Google Scholar] [CrossRef] [Green Version]
- Enck, P.; Zimmermann, K.; Menke, G.; Müller-Lissner, S.; Martens, U.; Klosterhalfen, S. A Mixture of Escherichia coli (DSM 17252) and Enterococcus faecalis (DSM 16440) for Treatment of the Irritable Bowel Syndrome—A Randomized Controlled Trial with Primary Care Physicians. Neurogastroenterol. Motil. 2008, 20, 1103–1109. [Google Scholar] [CrossRef]
- Fu, X.; Lyu, L.; Wang, Y.; Zhang, Y.; Guo, X.; Chen, Q.; Liu, C. Safety Assessment and Probiotic Characteristics of Enterococcus lactis JDM1. Microb. Pathog. 2022, 163, 105380. [Google Scholar] [CrossRef]
- Heeney, D.D.; Gareau, M.G.; Marco, M.L. Intestinal Lactobacillus in Health and Disease, a Driver or Just along for the Ride? Curr. Opin. Biotechnol. 2018, 49, 140–147. [Google Scholar] [CrossRef] [PubMed] [Green Version]
- Zelante, T.; Iannitti, R.G.; Cunha, C.; De Luca, A.; Giovannini, G.; Pieraccini, G.; Zecchi, R.; D’Angelo, C.; Massi-Benedetti, C.; Fallarino, F.; et al. Tryptophan Catabolites from Microbiota Engage Aryl Hydrocarbon Receptor and Balance Mucosal Reactivity via Interleukin-22. Immunity 2013, 39, 372–385. [Google Scholar] [CrossRef] [PubMed] [Green Version]
- Wescombe, P.A.; Heng, N.C.K.; Burton, J.P.; Chilcott, C.N.; Tagg, J.R. Streptococcal Bacteriocins and the Case for Streptococcus Salivarius as Model Oral Probiotics. Future Microbiol. 2009, 4, 819–835. [Google Scholar] [CrossRef] [PubMed] [Green Version]
- Tarrah, A.; de Castilhos, J.; Rossi, R.C.; da Silva Duarte, V.; Ziegler, D.R.; Corich, V.; Giacomini, A. In Vitro Probiotic Potential and Anti-Cancer Activity of Newly Isolated Folate-Producing Streptococcus Thermophilus Strains. Front. Microbiol. 2018, 9, 2214. [Google Scholar] [CrossRef] [PubMed]
- van den Abbeele, P.; Sprenger, N.; Ghyselinck, J.; Marsaux, B.; Marzorati, M.; Rochat, F. A Comparison of the In Vitro Effects of 2’Fucosyllactose and Lactose on the Composition and Activity of Gut Microbiota from Infants and Toddlers. Nutrients 2021, 13, 726. [Google Scholar] [CrossRef]
- Nagpal, R.; Kurakawa, T.; Tsuji, H.; Takahashi, T.; Kawashima, K.; Nagata, S.; Nomoto, K.; Yamashiro, Y. Evolution of Gut Bifidobacterium Population in Healthy Japanese Infants over the First Three Years of Life: A Quantitative Assessment. Sci. Rep. 2017, 7, 10097. [Google Scholar] [CrossRef]
- Ventura, M.; Turroni, F.; Lugli, G.A.; van Sinderen, D. Bifidobacteria and Humans: Our Special Friends, from Ecological to Genomics Perspectives. J. Sci. Food Agric. 2014, 94, 163–168. [Google Scholar] [CrossRef]
- O’Callaghan, A.; van Sinderen, D. Bifidobacteria and Their Role as Members of the Human Gut Microbiota. Front. Microbiol. 2016, 7, 925. [Google Scholar] [CrossRef] [Green Version]
- Chen, J.; Chen, X.; Ho, C.L. Recent Development of Probiotic Bifidobacteria for Treating Human Diseases. Front. Bioeng. Biotechnol. 2021, 9, 770248. [Google Scholar] [CrossRef]
- Chen, T.; Long, W.; Zhang, C.; Liu, S.; Zhao, L.; Hamaker, B.R. Fiber-Utilizing Capacity Varies in Prevotella- versus Bacteroides-Dominated Gut Microbiota. Sci. Rep. 2017, 7, 2594. [Google Scholar] [CrossRef]
- Precup, G.; Vodnar, D.-C. Gut Prevotella as a Possible Biomarker of Diet and Its Eubiotic versus Dysbiotic Roles: A Comprehensive Literature Review. Br. J. Nutr. 2019, 122, 131–140. [Google Scholar] [CrossRef] [PubMed]
- van den Abbeele, P.; Belzer, C.; Goossens, M.; Kleerebezem, M.; de Vos, W.M.; Thas, O.; de Weirdt, R.; Kerckhof, F.-M.; van de Wiele, T. Butyrate-Producing Clostridium Cluster XIVa Species Specifically Colonize Mucins in an in Vitro Gut Model. ISME J. 2013, 7, 949–961. [Google Scholar] [CrossRef] [PubMed] [Green Version]
- Rajilić-Stojanović, M.; de Vos, W.M. The First 1000 Cultured Species of the Human Gastrointestinal Microbiota. FEMS Microbiol. Rev. 2014, 38, 996–1047. [Google Scholar] [CrossRef] [PubMed]
- Berman, J.J. Gamma Proteobacteria. In Taxonomic Guide to Infectious Diseases; Academic Press: Boston, MA, USA, 2012; pp. 37–47. ISBN 978-0-12-415895-5. [Google Scholar]
- Rizzatti, G.; Lopetuso, L.R.; Gibiino, G.; Binda, C.; Gasbarrini, A. Proteobacteria: A Common Factor in Human Diseases. BioMed Res. Int. 2017, 2017, 9351507. [Google Scholar] [CrossRef] [Green Version]
- Danneskiold-Samsøe, N.B.; Dias de Freitas Queiroz Barros, H.; Santos, R.; Bicas, J.L.; Cazarin, C.B.B.; Madsen, L.; Kristiansen, K.; Pastore, G.M.; Brix, S.; Maróstica Júnior, M.R. Interplay between Food and Gut Microbiota in Health and Disease. Food Res. Int. 2019, 115, 23–31. [Google Scholar] [CrossRef] [Green Version]
- Agus, A.; Clément, K.; Sokol, H. Gut Microbiota-Derived Metabolites as Central Regulators in Metabolic Disorders. Gut 2021, 70, 1174–1182. [Google Scholar] [CrossRef]
- Krautkramer, K.A.; Fan, J.; Bäckhed, F. Gut Microbial Metabolites as Multi-Kingdom Intermediates. Nat. Rev. Microbiol. 2021, 19, 77–94. [Google Scholar] [CrossRef]
- Alexander, C.; Swanson, K.S.; Fahey Jr, G.C.; Garleb, K.A. Perspective: Physiologic Importance of Short-Chain Fatty Acids from Nondigestible Carbohydrate Fermentation. Adv. Nutr. 2019, 10, 576–589. [Google Scholar] [CrossRef]
- Blaak, E.E.; Canfora, E.E.; Theis, S.; Frost, G.; Groen, A.K.; Mithieux, G.; Nauta, A.; Scott, K.; Stahl, B.; van Harsselaar, J.; et al. Short Chain Fatty Acids in Human Gut and Metabolic Health. Benef. Microbes 2020, 11, 411–455. [Google Scholar] [CrossRef]
- Morrison, D.J.; Preston, T. Formation of Short Chain Fatty Acids by the Gut Microbiota and Their Impact on Human Metabolism. Gut Microbes 2016, 7, 189–200. [Google Scholar] [CrossRef] [Green Version]
- de la Cuesta-Zuluaga, J.; Mueller, N.T.; Álvarez-Quintero, R.; Velásquez-Mejía, E.P.; Sierra, J.A.; Corrales-Agudelo, V.; Carmona, J.A.; Abad, J.M.; Escobar, J.S. Higher Fecal Short-Chain Fatty Acid Levels Are Associated with Gut Microbiome Dysbiosis, Obesity, Hypertension and Cardiometabolic Disease Risk Factors. Nutrients 2018, 11, 51. [Google Scholar] [CrossRef] [Green Version]
- Boets, E.; Gomand, S.V.; Deroover, L.; Preston, T.; Vermeulen, K.; de Preter, V.; Hamer, H.M.; van den Mooter, G.; de Vuyst, L.; Courtin, C.M.; et al. Systemic Availability and Metabolism of Colonic-Derived Short-Chain Fatty Acids in Healthy Subjects: A Stable Isotope Study. J. Physiol. 2017, 595, 541–555. [Google Scholar] [CrossRef] [PubMed] [Green Version]
- Rios-Covian, D.; González, S.; Nogacka, A.M.; Arboleya, S.; Salazar, N.; Gueimonde, M.; de los Reyes-Gavilán, C.G. An Overview on Fecal Branched Short-Chain Fatty Acids Along Human Life and as Related With Body Mass Index: Associated Dietary and Anthropometric Factors. Front. Microbiol. 2020, 11, 973. [Google Scholar] [CrossRef] [PubMed]
- Tuncil, Y.E.; Thakkar, R.D.; Marcia, A.D.R.; Hamaker, B.R.; Lindemann, S.R. Divergent Short-Chain Fatty Acid Production and Succession of Colonic Microbiota Arise in Fermentation of Variously-Sized Wheat Bran Fractions. Sci. Rep. 2018, 8, 16655. [Google Scholar] [CrossRef] [PubMed]
- Canani, R.B.; di Costanzo, M.; Leone, L.; Pedata, M.; Meli, R.; Calignano, A. Potential Beneficial Effects of Butyrate in Intestinal and Extraintestinal Diseases. World J. Gastroenterol. 2011, 17, 1519–1528. [Google Scholar] [CrossRef]
- Gao, G.; Zhou, J.; Wang, H.; Ding, Y.; Zhou, J.; Chong, P.H.; Zhu, L.; Ke, L.; Wang, X.; Rao, P.; et al. Effects of Valerate on Intestinal Barrier Function in Cultured Caco-2 Epithelial Cell Monolayers. Mol. Biol. Rep. 2022, 49, 1817–1825. [Google Scholar] [CrossRef]
- Hosseini, E.; Grootaert, C.; Verstraete, W.; van de Wiele, T. Propionate as a Health-Promoting Microbial Metabolite in the Human Gut. Nutr. Rev. 2011, 69, 245–258. [Google Scholar] [CrossRef]
- Wang, L.; Cen, S.; Wang, G.; Lee, Y.; Zhao, J.; Zhang, H.; Chen, W. Acetic Acid and Butyric Acid Released in Large Intestine Play Different Roles in the Alleviation of Constipation. J. Funct. Foods 2020, 69, 103953. [Google Scholar] [CrossRef]
- Nogal, A.; Valdes, A.M.; Menni, C. The Role of Short-Chain Fatty Acids in the Interplay between Gut Microbiota and Diet in Cardio-Metabolic Health. Gut Microbes 2021, 13, 1897212. [Google Scholar] [CrossRef]
- Schwiertz, A.; Taras, D.; Schäfer, K.; Beijer, S.; Bos, N.A.; Donus, C.; Hardt, P.D. Microbiota and SCFA in Lean and Overweight Healthy Subjects. Obesity 2010, 18, 190–195. [Google Scholar] [CrossRef]
- Zhao, L.; Zhang, F.; Ding, X.; Wu, G.; Lam, Y.Y.; Wang, X.; Fu, H.; Xue, X.; Lu, C.; Ma, J.; et al. Gut Bacteria Selectively Promoted by Dietary Fibers Alleviate Type 2 Diabetes. Science (1979) 2018, 359, 1151–1156. [Google Scholar] [CrossRef] [PubMed] [Green Version]
- Levy, M.; Thaiss, C.A.; Zeevi, D.; Dohnalová, L.; Zilberman-Schapira, G.; Mahdi, J.A.; David, E.; Savidor, A.; Korem, T.; Herzig, Y.; et al. Microbiota-Modulated Metabolites Shape the Intestinal Microenvironment by Regulating NLRP6 Inflammasome Signaling. Cell 2015, 163, 1428–1443. [Google Scholar] [CrossRef] [PubMed] [Green Version]
- Kibe, R.; Kurihara, S.; Sakai, Y.; Suzuki, H.; Ooga, T.; Sawaki, E.; Muramatsu, K.; Nakamura, A.; Yamashita, A.; Kitada, Y.; et al. Upregulation of Colonic Luminal Polyamines Produced by Intestinal Microbiota Delays Senescence in Mice. Sci. Rep. 2014, 4, 4548. [Google Scholar] [CrossRef] [PubMed]
- di Martino, M.L.; Campilongo, R.; Casalino, M.; Micheli, G.; Colonna, B.; Prosseda, G. Polyamines: Emerging Players in Bacteria–Host Interactions. Int. J. Med. Microbiol. 2013, 303, 484–491. [Google Scholar] [CrossRef]
- Nakamura, A.; Ooga, T.; Matsumoto, M. Intestinal Luminal Putrescine Is Produced by Collective Biosynthetic Pathways of the Commensal Microbiome. Gut Microbes 2019, 10, 159–171. [Google Scholar] [CrossRef] [Green Version]
- del Rio, B.; Redruello, B.; Linares, D.M.; Ladero, V.; Ruas-Madiedo, P.; Fernandez, M.; Martin, M.C.; Alvarez, M.A. The Biogenic Amines Putrescine and Cadaverine Show in Vitro Cytotoxicity at Concentrations That Can Be Found in Foods. Sci. Rep. 2019, 9, 120. [Google Scholar] [CrossRef] [Green Version]
- Dumas, M.; Barton, R.; Toye, A.; Cloarec, O.; Blancher, C.; Rothwell, A.; Fearnside, J.; Tatoud, R.; Blanc, V.; Lindon, J.; et al. Metabolic Profiling Reveals a Contribution of Gut Microbiota to Fatty Liver Phenotype in Insulin-Resistant Mice. Proc. Natl. Acad. Sci. USA 2006, 103, 12511–12516. [Google Scholar] [CrossRef] [Green Version]
- Marcobal, A.; de las Rivas, B.; Muñoz, R. First Genetic Characterization of a Bacterial Beta-Phenylethylamine Biosynthetic Enzyme in Enterococcus faecium RM58. FEMS Microbiol. Lett. 2006, 258, 144–149. [Google Scholar] [CrossRef] [Green Version]
- Gainetdinov, R.R.; Hoener, M.C.; Berry, M.D. Trace Amines and Their Receptors. Pharmacol. Rev. 2018, 70, 549–620. [Google Scholar] [CrossRef] [Green Version]
- Christian, S.L.; Berry, M.D. Trace Amine-Associated Receptors as Novel Therapeutic Targets for Immunomodulatory Disorders. Front. Pharmacol. 2018, 9, 680. [Google Scholar] [CrossRef] [Green Version]
- Sudo, N. Biogenic Amines: Signals Between Commensal Microbiota and Gut Physiology. Front. Endocrinol. 2019, 10, 504. [Google Scholar] [CrossRef] [Green Version]
- Heath-Pagliuso, S.; Rogers, W.J.; Tullis, K.; Seidel, S.D.; Cenijn, P.H.; Brouwer, A.; Denison, M.S. Activation of the Ah Receptor by Tryptophan and Tryptophan Metabolites. Biochemistry 1998, 37, 11508–11515. [Google Scholar] [CrossRef] [PubMed]
- Quintana, F.J.; Sherr, D.H. Aryl Hydrocarbon Receptor Control of Adaptive Immunity. Pharmacol. Rev. 2013, 65, 1148–1161. [Google Scholar] [CrossRef] [PubMed] [Green Version]
- Bock, K.W. The Human Ah Receptor: Hints from Dioxin Toxicities to Deregulated Target Genes and Physiological Functions. Biol. Chem. 2013, 394, 729–739. [Google Scholar] [CrossRef]
- de Vos, W.M.; Tilg, H.; van Hul, M.; Cani, P.D. Gut Microbiome and Health: Mechanistic Insights. Gut 2022, 71, 1020–1032. [Google Scholar] [CrossRef] [PubMed]
- Dean, J.W.; Zhou, L. Cell-Intrinsic View of the Aryl Hydrocarbon Receptor in Tumor Immunity. Trends Immunol. 2022, 43, 245–258. [Google Scholar] [CrossRef]
- Pearce, S.C.; Coia, H.G.; Karl, J.P.; Pantoja-Feliciano, I.G.; Zachos, N.C.; Racicot, K. Intestinal in Vitro and Ex Vivo Models to Study Host-Microbiome Interactions and Acute Stressors. Front. Physiol. 2018, 9, 1584. [Google Scholar] [CrossRef] [Green Version]
- Altamimi, M.; Abdelhay, O.; Rastall, R.A. Effect of Oligosaccharides on the Adhesion of Gut Bacteria to Human HT-29 Cells. Anaerobe 2016, 39, 136–142. [Google Scholar] [CrossRef]
- Maccaferri, S.; Klinder, A.; Cacciatore, S.; Chitarrari, R.; Honda, H.; Luchinat, C.; Bertini, I.; Carnevali, P.; Gibson, G.R.; Brigidi, P.; et al. In Vitro Fermentation of Potential Prebiotic Flours from Natural Sources: Impact on the Human Colonic Microbiota and Metabolome. Mol. Nutr. Food Res. 2012, 56, 1342–1352. [Google Scholar] [CrossRef]
- Resta-Lenert, S.; Barrett, K.E. Live Probiotics Protect Intestinal Epithelial Cells from the Effects of Infection with Enteroinvasive Escherichia coli (EIEC). Gut 2003, 52, 988–997. [Google Scholar] [CrossRef] [Green Version]
- Natividad, J.M.; Agus, A.; Planchais, J.; Lamas, B.; Jarry, A.C.; Martin, R.; Michel, M.-L.; Chong-Nguyen, C.; Roussel, R.; Straube, M.; et al. Impaired Aryl Hydrocarbon Receptor Ligand Production by the Gut Microbiota Is a Key Factor in Metabolic Syndrome. Cell Metab. 2018, 28, 737–749.e4. [Google Scholar] [CrossRef] [PubMed] [Green Version]
- Lamas, B.; Richard, M.L.; Leducq, V.; Pham, H.-P.; Michel, M.-L.; da Costa, G.; Bridonneau, C.; Jegou, S.; Hoffmann, T.W.; Natividad, J.M.; et al. CARD9 Impacts Colitis by Altering Gut Microbiota Metabolism of Tryptophan into Aryl Hydrocarbon Receptor Ligands. Nat. Med. 2016, 22, 598–605. [Google Scholar] [CrossRef] [PubMed]
- Koper, J.E.B.; Troise, A.D.; Loonen, L.M.P.; Vitaglione, P.; Capuano, E.; Fogliano, V.; Wells, J.M. Tryptophan Supplementation Increases the Production of Microbial-Derived AhR Agonists in an In Vitro Simulator of Intestinal Microbial Ecosystem. J. Agric. Food Chem. 2022, 70, 3958–3968. [Google Scholar] [CrossRef] [PubMed]
- Dopkins, N.; Becker, W.; Miranda, K.; Walla, M.; Nagarkatti, P.; Nagarkatti, M. Tryptamine Attenuates Experimental Multiple Sclerosis Through Activation of Aryl Hydrocarbon Receptor. Front. Pharmacol. 2020, 11, 619265. [Google Scholar] [CrossRef]
- Vikström Bergander, L.; Cai, W.; Klocke, B.; Seifert, M.; Pongratz, I. Tryptamine Serves as a Proligand of the AhR Transcriptional Pathway Whose Activation Is Dependent of Monoamine Oxidases. Mol. Endocrinol. 2012, 26, 1542–1551. [Google Scholar] [CrossRef] [Green Version]
- Schanz, O.; Chijiiwa, R.; Cengiz, S.C.; Majlesain, Y.; Weighardt, H.; Takeyama, H.; Förster, I. Dietary AhR Ligands Regulate AhRR Expression in Intestinal Immune Cells and Intestinal Microbiota Composition. Int. J. Mol. Sci. 2020, 21, 3189. [Google Scholar] [CrossRef]
- Mitchell, K.A.; Elferink, C.J. Timing Is Everything: Consequences of Transient and Sustained AhR Activity. Biochem. Pharmacol. 2009, 77, 947–956. [Google Scholar] [CrossRef] [Green Version]
- Doan, T.Q.; Connolly, L.; Igout, A.; Muller, M.; Scippo, M.L. In Vitro Differential Responses of Rat and Human Aryl Hydrocarbon Receptor to Two Distinct Ligands and to Different Polyphenols. Environ. Pollut. 2020, 265, 114966. [Google Scholar] [CrossRef]
- Grycová, A.; Joo, H.; Maier, V.; Illés, P.; Vyhlídalová, B.; Poulíková, K.; Sládeková, L.; Nádvorník, P.; Vrzal, R.; Zemánková, L.; et al. Targeting the Aryl Hydrocarbon Receptor with Microbial Metabolite Mimics Alleviates Experimental Colitis in Mice. J. Med. Chem. 2022, 65, 6859–6868. [Google Scholar] [CrossRef]
- Manor, O.; Dai, C.L.; Kornilov, S.A.; Smith, B.; Price, N.D.; Lovejoy, J.C.; Gibbons, S.M.; Magis, A.T. Health and Disease Markers Correlate with Gut Microbiome Composition across Thousands of People. Nat. Commun. 2020, 11, 5206. [Google Scholar] [CrossRef]
- van den Abbeele, P.; Roos, S.; Eeckhaut, V.; MacKenzie, D.A.; Derde, M.; Verstraete, W.; Marzorati, M.; Possemiers, S.; Vanhoecke, B.; van Immerseel, F.; et al. Incorporating a Mucosal Environment in a Dynamic Gut Model Results in a More Representative Colonization by Lactobacilli. Microb. Biotechnol. 2012, 5, 106–115. [Google Scholar] [CrossRef] [PubMed] [Green Version]
- van den Abbeele, P.; Verstrepen, L.; Ghyselinck, J.; Albers, R.; Marzorati, M.; Mercenier, A. A Novel Non-Digestible, Carrot-Derived Polysaccharide (CRG-I) Selectively Modulates the Human Gut Microbiota While Promoting Gut Barrier Integrity: An Integrated In Vitro Approach. Nutrients 2020, 12, 1917. [Google Scholar] [CrossRef] [PubMed]
- Singh, P.; Manning, S.D. Impact of Age and Sex on the Composition and Abundance of the Intestinal Microbiota in Individuals with and without Enteric Infections. Ann. Epidemiol. 2016, 26, 380–385. [Google Scholar] [CrossRef] [PubMed] [Green Version]
- Takagi, T.; Naito, Y.; Inoue, R.; Kashiwagi, S.; Uchiyama, K.; Mizushima, K.; Tsuchiya, S.; Dohi, O.; Yoshida, N.; Kamada, K.; et al. Differences in Gut Microbiota Associated with Age, Sex, and Stool Consistency in Healthy Japanese Subjects. J. Gastroenterol. 2019, 54, 53–63. [Google Scholar] [CrossRef]
- Haro, C.; Rangel-Zúñiga, O.A.; Alcalá-Díaz, J.F.; Gómez-Delgado, F.; Pérez-Martínez, P.; Delgado-Lista, J.; Quintana-Navarro, G.M.; Landa, B.B.; Navas-Cortés, J.A.; Tena-Sempere, M.; et al. Intestinal Microbiota Is Influenced by Gender and Body Mass Index. PLoS ONE 2016, 11, e0154090. [Google Scholar] [CrossRef] [Green Version]
- Kim, Y.S.; Unno, T.; Kim, B.-Y.; Park, M.-S. Sex Differences in Gut Microbiota. World J. Mens Health 2020, 38, 48–60. [Google Scholar] [CrossRef]
- Sinha, T.; Vich Vila, A.; Garmaeva, S.; Jankipersadsing, S.A.; Imhann, F.; Collij, V.; Bonder, M.J.; Jiang, X.; Gurry, T.; Alm, E.J.; et al. Analysis of 1135 Gut Metagenomes Identifies Sex-Specific Resistome Profiles. Gut Microbes 2019, 10, 358–366. [Google Scholar] [CrossRef] [Green Version]
- Borgo, F.; Garbossa, S.; Riva, A.; Severgnini, M.; Luigiano, C.; Benetti, A.; Pontiroli, A.E.; Morace, G.; Borghi, E. Body Mass Index and Sex Affect Diverse Microbial Niches within the Gut. Front. Microbiol. 2018, 9, 213. [Google Scholar] [CrossRef] [Green Version]
- Gao, X.; Zhang, M.; Xue, J.; Huang, J.; Zhuang, R.; Zhou, X.; Zhang, H.; Fu, Q.; Hao, Y. Body Mass Index Differences in the Gut Microbiota Are Gender Specific. Front. Microbiol. 2018, 9, 1250. [Google Scholar] [CrossRef]
- Matsuki, T.; Watanabe, K.; Fujimoto, J.; Takada, T.; Tanaka, R. Use of 16S RRNA Gene-Targeted Group-Specific Primers for Real-Time PCR Analysis of Predominant Bacteria in Human Feces. Appl. Environ. Microbiol. 2004, 70, 7220–7228. [Google Scholar] [CrossRef] [Green Version]
- Morel, F.B.; Oozeer, R.; Piloquet, H.; Moyon, T.; Pagniez, A.; Knol, J.; Darmaun, D.; Michel, C. Preweaning Modulation of Intestinal Microbiota by Oligosaccharides or Amoxicillin Can Contribute to Programming of Adult Microbiota in Rats. Nutrition 2015, 31, 515–522. [Google Scholar] [CrossRef] [PubMed]
- Jiang, S.; Xie, S.; Lv, D.; Zhang, Y.; Deng, J.; Zeng, L.; Chen, Y. A Reduction in the Butyrate Producing Species Roseburia Spp. and Faecalibacterium Prausnitzii Is Associated with Chronic Kidney Disease Progression. Antonie Van Leeuwenhoek 2016, 109, 1389–1396. [Google Scholar] [CrossRef] [PubMed]
- Amit-Romach, E.; Sklan, D.; Uni, Z. Microflora Ecology of the Chicken Intestine Using 16S Ribosomal DNA Primers. Poult. Sci. 2004, 83, 1093–1098. [Google Scholar] [CrossRef]
- Kurina, I.; Popenko, A.; Klimenko, N.; Koshechkin, S.; Chuprikova, L.; Filipenko, M.; Tyakht, A.; Alexeev, D. Development of QPCR Platform with Probes for Quantifying Prevalent and Biomedically Relevant Human Gut Microbial Taxa. Mol. Cell. Probes 2020, 52, 101570. [Google Scholar] [CrossRef]
- Rinttilä, T.; Kassinen, A.; Malinen, E.; Krogius, L.; Palva, A. Development of an Extensive Set of 16S RDNA-Targeted Primers for Quantification of Pathogenic and Indigenous Bacteria in Faecal Samples by Real-Time PCR. J. Appl. Microbiol. 2004, 97, 1166–1177. [Google Scholar] [CrossRef]
- Everard, A.; Belzer, C.; Geurts, L.; Ouwerkerk, J.P.; Druart, C.; Bindels, L.B.; Guiot, Y.; Derrien, M.; Muccioli, G.G.; Delzenne, N.M.; et al. Cross-Talk between Akkermansia Muciniphila and Intestinal Epithelium Controls Diet-Induced Obesity. Proc. Natl. Acad. Sci. USA 2013, 110, 9066–9071. [Google Scholar] [CrossRef] [PubMed] [Green Version]

| Class | Amines | Structure | 0 h | 24 h | 48 h | 72 h |
|---|---|---|---|---|---|---|
| Aliphatic amines | Methylamine |  | - | - | 35.75 µM † | 283.86 µM ± 128.76 |
| Spermidine | 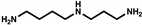 | 0.75 µM † | - | 0.12 µM † | - | |
| Spermine | 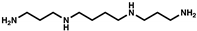 | - | - | - | - | |
| Aromatic amines | 2-phenylethylamine |  | - | 5.20 µM ± 0.96 | 3.13 µM ± 4.38 | 4.58 µM ± 1.62 |
| Tyramine |  | - | 27.42 µM ± 19.87 | 25.42 µM ± 20.79 | 28.85 µM ± 7.93 | |
| Histamine |  | 7.51 µM † | - | - | - |
Publisher’s Note: MDPI stays neutral with regard to jurisdictional claims in published maps and institutional affiliations. |
© 2022 by the authors. Licensee MDPI, Basel, Switzerland. This article is an open access article distributed under the terms and conditions of the Creative Commons Attribution (CC BY) license (https://creativecommons.org/licenses/by/4.0/).
Share and Cite
Goya-Jorge, E.; Gonza, I.; Bondue, P.; Douny, C.; Taminiau, B.; Daube, G.; Scippo, M.-L.; Delcenserie, V. Human Adult Microbiota in a Static Colon Model: AhR Transcriptional Activity at the Crossroads of Host–Microbe Interaction. Foods 2022, 11, 1946. https://doi.org/10.3390/foods11131946
Goya-Jorge E, Gonza I, Bondue P, Douny C, Taminiau B, Daube G, Scippo M-L, Delcenserie V. Human Adult Microbiota in a Static Colon Model: AhR Transcriptional Activity at the Crossroads of Host–Microbe Interaction. Foods. 2022; 11(13):1946. https://doi.org/10.3390/foods11131946
Chicago/Turabian StyleGoya-Jorge, Elizabeth, Irma Gonza, Pauline Bondue, Caroline Douny, Bernard Taminiau, Georges Daube, Marie-Louise Scippo, and Véronique Delcenserie. 2022. "Human Adult Microbiota in a Static Colon Model: AhR Transcriptional Activity at the Crossroads of Host–Microbe Interaction" Foods 11, no. 13: 1946. https://doi.org/10.3390/foods11131946
APA StyleGoya-Jorge, E., Gonza, I., Bondue, P., Douny, C., Taminiau, B., Daube, G., Scippo, M.-L., & Delcenserie, V. (2022). Human Adult Microbiota in a Static Colon Model: AhR Transcriptional Activity at the Crossroads of Host–Microbe Interaction. Foods, 11(13), 1946. https://doi.org/10.3390/foods11131946