Next Article in Journal
Maximization of Sulforaphane Content in Broccoli Sprouts by Blanching
Next Article in Special Issue
Optimization of Fermentation Conditions of Artemisia capillaris for Enhanced Acetylcholinesterase and Butyrylcholinesterase
Previous Article in Journal
Application of Protein in Extrusion-Based 3D Food Printing: Current Status and Prospectus
Previous Article in Special Issue
Effects from the Freezing of Either Whole or Crushed Grapes on the Volatile Compounds Contents in Muscat Wines
 
 
Correction published on 29 March 2024, see Foods 2024, 13(7), 1046.
Article

E. tapos Yoghurt—A View from Nutritional Composition and Toxicological Evaluation

by
Ruth Naomi
1,
Rusydatul Nabila Mahmad Rusli
1,
Santhra Segaran Balan
1,2,
Fezah Othman
3,
Azmiza Syawani Jasni
4,
Siti Hadizah Jumidil
1,
Hasnah Bahari
1,* and
Muhammad Dain Yazid
5,*
1
Department of Human Anatomy, Faculty of Medicine and Health Sciences, Universiti Putra Malaysia, Serdang 43400, Malaysia
2
Faculty of Health and Life Sciences, Management and Science University, Shah Alam 40100, Malaysia
3
Department of Biomedical Sciences, Faculty of Medicine and Health Sciences, Universiti Putra Malaysia, Serdang 43400, Malaysia
4
Department of Medical Microbiology and Parasitology, Faculty of Medicine and Health Sciences, Universiti Putra Malaysia, Serdang 43400, Malaysia
5
Centre for Tissue Engineering and Regenerative Medicine, Faculty of Medicine, Universiti Kebangsaan Malaysia, Kuala Lumpur 56000, Malaysia
*
Authors to whom correspondence should be addressed.
Foods 2022, 11(13), 1903; https://doi.org/10.3390/foods11131903
Submission received: 4 May 2022 / Revised: 14 June 2022 / Accepted: 14 June 2022 / Published: 27 June 2022 / Corrected: 29 March 2024
(This article belongs to the Special Issue Recent Research Advance of Plant-Based Fermented Food)

Abstract

:
Elateriospermum tapos (E. tapos) is a natural tropical plant that possess a wide range of health benefits. Recent discovery proves that E. tapos extract is able to reduce weight, increase cognitive performance, and ameliorate anxiety and stress hormone. However, this extraction has not been incorporated into yoghurt, and no toxicity studies have been done previously to prove its safety. Thus, this study was aimed to formulate the ethanolic extracted E. tapos into yoghurt and access the toxicological effects on rodents. Forty female Sprague Dawley (SD) rats were used in this study and force fed with either one of the following doses of 250, 500, 1000, or 2000 mg/kg, while the control group received normal saline. The nutritional analysis result showed that the newly formulated yoghurt comprised 328 kJ of energy per 100 mL of servings, 3.6 g of fats, 8.2 g of carbohydrates, 2.7 g of total protein, and 1.2 g of fibre. The peak intensity of Lactobacillus species was observed at 1.6 × 10⁵ CFU/g with a titratable acidity as lactic acid of 0.432 CFU/g, indicating the ability of the formulated yoghurt in stimulating the growth of Lactobacilli. In the experimental study, the E. tapos yoghurt in a single dose (2000 mg/kg) did not show any treatment related to toxicity in any of the rats observed in an additional 14 days. There were no changes in body weight, food and water intake, plasma biochemistry (ALT, AST, ALP, and creatinine), haematological products, and organ weights of the treated groups compared to the subacute control groups. Histological examination of all organs including liver, heart, and kidney were comparable to the control groups. In toto, oral consumptions of E. tapos yoghurt did not induce any adverse effects on rodents.

1. Introduction

Yoghurt is also known as a concentrated form of milk, made from selective bacterial fermentation [1]. Over the past years, yoghurt has gained the attention of researchers around the globe. For instance, Greek yoghurt was widely known for its thin structure before the introduction of high-protein yoghurt due to its global marketing potentials. However, formulation of thick, creamy yoghurts have suppressed the market of Greek yoghurt [2]. This is because scientists claim that thick and creamy yoghurts were said to be the primary option for consumers compared to the thin and watery type of yoghurt [3]. The consumers’ stipulations for yoghurt will tend to increase in the future due to its potent beneficial effects and due to its inclusion of fewer additives [4] and its nutritional value [1]. Regardless of age group, yoghurt possesses the ability to increase amino acids content of a protein and may enhance the synthesize of proteins in the muscles [5]. Yoghurt tends to contribute to faster satiety and is thereby advantageous for those in calorie-restricted diets [6]. The bacterial strain in yoghurt makes it an ideal source of anti-obesity agents, and studies have proven that these bacterial cultures are able to tolerate the acidity in the gut and survive in the intestinal tract [7]. Thus, lipolysis, amelioration of cognitive function, and reduction in the absorption of cholesterol are commonly documented features in those who consume yoghurts [8]. Moreover, bacterial fermentation processes during yoghurt preparation transform the lactose in milk to lactic acids, which further gives the option for lactose-intolerant subjects to consume yoghurt without any allergic reactions [9]. In these, integration of natural medicinal plants into yoghurt is a new insight in biomedical research.
Elateriospermum tapos (E. tapos) is a monotypic plant, a tropical canopy found in the deep forest of Southeast Asia, commonly in Malaysia, Thailand, Sumatera, and Java [10], and has raised our interest due to its beneficial composition. E. tapos belongs to the family Euphorbiaceae and is known as “buah perah” locally [11]. Numerous bioactive compounds have been identified from E. tapos extract, including flavonoids, tannins, alkaloids [12], linolenic acids, polyunsaturated fats [10], phenols, saponins, sterols, proteins, and iodine [13]. E. tapos extract has been proven to enhance antioxidant activity, inhibit pancreatic lipase [11], ameliorate stress hormone, and act as an anti-obesity agent [10]. Due to its potential health effects, E. tapos recently has attracted researchers’ attention to pursue further investigations in animal studies. According to the recent scientific findings, yoghurt is usually flavoured via natural plants or fruits to provide colour and bioactive compounds [1]. As such, mixture of E. tapos extraction, a local fruit, into yoghurt gives rise to a whole new formulation of yoghurt product. However, there is not any previous study that has introduced or evaluated the nutritional composition of E. tapos yoghurt or assessed its toxicity. Hence, this article discusses the novel yoghurt formulation supplemented with ethanolic extraction of E. tapos and its nutritional composition and toxicological evaluation on SD rats.

2. Results

2.1. Nutritional Composition

The formulated E. tapos yoghurt appears white, creamy, sticky, consistent, smooth, firmly textured, and with typical yoghurt-like smell. It has a pH of 5.1 (slightly acidic) at 25 °C with a titratable acidity as lactic acid 0.4%. The nutritional compositions of the E. tapos yoghurt are as tabulated in Table 1.

2.2. Acute Toxicity Study

2.2.1. Clinical Observation

The administration of E. tapos yoghurt at 2000 mg/kg did not result in mortality in any of the treated rats. No abnormalities or changes in behavioural pattern were recorded. The observation on gross pathology of acute E. tapos 2000 mg/kg (AT 2000) on liver, heart, and kidney showed no changes in colour, shape, and size compared to the acute control (AC) group. The scoring sheet documented shows 100% normal texture.

2.2.2. Body Weight Changes

The changes in body weight between AC group and AT 2000 group are shown in Table 2. There were gradual increase in body weight of both AC and AT 2000 groups. There were no significant difference (p > 0.05) of the AT 2000 group compared to the AC group from day 0, week 1, and week 2.

2.2.3. Total Food and Water Consumption

Table 3 shows the data for food consumption and water intake in acute toxicity study. There were no significant differences (p > 0.05) of the AT 2000 group compared to the AC group in total food consumption, calorie intake, food efficiency ratio (FER), and total water intake.

2.2.4. Relative Organ Weight (ROW)

The ROW for AC and AT 2000 are shown in Table 4. There were no significant difference (p > 0.05) of the AT 2000 group compared to the AC group in the organ weight (g) and standardized by body weight (%). The correct value for the relative organ weight of the spleen is 0.001, as accurately reflected in the table below. An unintended formatting discrepancy occurred during the preparation of the manuscript, where three decimal points were included, rendering the value as 0.00. To maintain consistency with other tables in the manuscript, we will correct the formatting to present the value as 0.00 in accordance with the established convention.

2.2.5. Haematological Analysis

The data for haematological analysis are presented in Table 5 below. The supplementation of E. tapos 2000 mg/kg yoghurt caused a significant decrease (p < 0.05) in mean corpuscular volume (MCV) compared to the AC group. However, no significant difference (p > 0.05) was observed in other measured parameters between the AT 2000 and AC groups.

2.2.6. Blood Biochemistry Analysis

The blood biochemistry analysis is presented in Table 6. A significant increase (p < 0.05) in albumin and albumin globulin ratio is shown in the AT 2000 group compared to the AC group. Contrarily, a significant decrease (p < 0.05) in urea, globulin, ALP, and AST concentration was shown in the AT 2000 group compared to AC group. However, in other blood biochemistry parameters measured, there were no significant difference (p > 0.05) between the AT 2000 and AC group.

2.2.7. Histopathological Analysis

The histological section for liver, kidney, and heart are illustrated in Figure 1. The histological examination shows no pathological abnormalities and the histological section of kidney, liver, and heart for AT 2000 when compared to the AC group. The kidney for control and treated groups showed normal proximal and distal tubule. The mesangial cells in the glomerulus were observed. Bowman space between the visceral and parietal layer and the cup-like sac surrounding the glomerulus were observed. The liver in the treated groups showed normal hepatic architecture; no hepatocytes ballooning or hepatocyte degeneration, inflammation, or other pathological abnormalities were observed. The transverse striation of cardiac muscle cells, a central nucleus, and epicardium with the presence of mesothelial pavement cells were observed in heart tissue.

2.3. Subacute Toxicity Study (Repeated Dose)

2.3.1. Clinical Observation

The administration of E. tapos yoghurt at various concentrations of 250, 500, and 1000 mg/kg for 28 days and satellite dose of 1000 mg/kg for 28 days followed by absence of treatment for 14 days did not exhibit any form of physical abnormalities nor mortality. There were no abnormalities concerning the hair coat, eye colour, salivation, diarrhoea, touch response, tail pinch, and grip strength. Any clinical signs of locomotor dysfunction, tremors, or convulsions were absent, and all animals survived until necropsy. Gross observations did not reveal any treatment-related changes in treated animals.

2.3.2. Body Weight Changes

The changes in body weight were recorded weekly for 28 days for repeated dose, while 42 consecutive days were recorded for the subacute satellite group as shown in Table 7. In subacute toxicity, no significant changes (p > 0.05) in weekly body weight changes were shown in subacute E. tapos 250 mg/kg of yoghurt (ST 250)-, subacute E. tapos 500 mg/kg of yoghurt (ST 500)-, and subacute E. tapos 1000 mg/kg of yoghurt (ST 1000)-treated group compared to subacute control (SC) in day 0 and week 2, 3, and 4. There were significant changes (p < 0.05) between ST 250-treated group compared to SC in week 1, while there were no significant changes (p > 0.05) recorded between ST 500 and ST 1000 compared to SC in week 1. As in the satellite group, no significant difference (p > 0.05) was shown in weekly body weight changes between the treated group of subacute satellite E. tapos 1000 mg/kg of yoghurt (SST 1000) and subacute satellite control (SSC) group.

2.3.3. Total Food and Water Consumption

Table 8 represents total food consumption, caloric intake, FER, and total water intake for subacute toxicity study of SC, ST 250, ST 500, and ST 1000 for 28 days with repeated dose and SSC and SST 1000 for 42 consecutive days. No significant difference (p > 0.05) were shown for FER, calorie intake, and total food and water consumption in ST 250-, ST 500-, and ST 1000-treated groups compared to SC. Meanwhile, in the satellite group for subacute toxicity, no significant difference (p > 0.05) were observed in FER, calorie intake, total food and water consumption in SST 1000-treated group compared to SSC group.

2.3.4. Relative Organ Weight (ROW)

Table 9 shows the data for organs weight in rats for subacute toxicity study of SC, ST 250, ST 500, and ST 1000 for 28 days with repeated dose and SSC and SST 1000 for 42 consecutive days. There were no abnormalities observed for liver, spleen, RpWAT, visceral fat, inguinal fat, and heart. In subacute toxicity, no significant difference (p > 0.05) were recorded in ROW and in a percentage per body weight of liver, spleen, kidney, RpWAT, visceral, inguinal, lung, and heart in rats supplemented with ST 250, ST 500, and ST 1000 E. tapos yoghurt compared to SC group. The satellite group for subacute toxicity shows a significant increase (p < 0.05) for kidney in ROW of SST 1000 compared to SSC. However, there were no significant difference (p > 0.05) in ROW and organ percentage per body weight in group SST 1000 compared with the SSC group for liver, spleen, RpWAT, visceral, inguinal, lung, and heart.

2.3.5. Haematological Analysis

The effects of daily administration of E. tapos yoghurt at various doses of SC, ST 250, ST 500, and ST 1000 for 28 days with repeated dose and SSC and SST 1000 for 42 consecutive days in haematological parameters are shown in Table 10. There were significant decrease (p < 0.05) in WBC of ST 500 compared to SC and significant decrease (p < 0.05) of lymphocytes of ST 500 and ST 1000 compared to SC. However, there were no significant difference (p > 0.05) on Hb (g/dL) RBC, RDW, PCV, MCV, MCH, MCHC, neutrophils, eosinophils, basophils, and platelets in ST 250, ST 500 and ST 1000 groups compared to SC group. However, in the satellite group for subacute toxicity, a significant decrease (p < 0.05) for WBC, lymphocytes, and eosinophils was observed in the SST 1000 group compared to the SSC group. However, there was not any significant difference observed in other haematological parameters in the SST 1000 group compared to SSC group.

2.3.6. Blood Biochemistry Analysis

The blood biochemistry data on the effect of E. tapos yoghurt on subacute toxicity study for SC, ST 250, ST 500, and ST 1000 for 28 days with repeated dose and SSC and SST 1000 for 42 consecutive days are presented in Table 11 below. There was significant decrease (p < 0.05) in urea and creatinine of the ST 1000 compared to the SC group. Similarly, there was significant increase (p < 0.05) in ALP of ST 500 and ST 1000 compared to the SC group. However, there were no significant changes (p > 0.05) in sodium, potassium, chloride, total protein, albumin, globulin, albumin–globulin ratio, AST, ALT, and gama-glutamyl transferase, while in the satellite group for subacute toxicity, there were significant decrease (p < 0.05) in urea in SST 1000 group compared to the SSC group. However, there was no significant difference observed in other blood biochemical parameters in SST 1000 group compared to SSC group.
Table 8. Total food consumption, caloric intake, FER, and total water consumption in the subacute toxicity study. Values are expressed as mean ± SEM.
Groups for Subacute Toxicity 1Satellite Group for Subacute Toxicity 2
SCST 250ST 500ST 1000SSCSST 1000
Total food consumption (g)456.42 ± 6.44454.84 ± 30.80455.89 ± 23.87443.78 ± 19.18825.78 ± 14.57829.33 ± 9.98
Calorie intake (KJ)5842.22 ± 82.435821.91 ± 394.245835.35 ± 305.545680.34 ± 245.5010,569.96 ± 186.5210,615.36 ± 127.68
FER (%)15.73 ± 1.5717.59 ± 0.1616.78 ± 0.0616.47 ± 3.3312.74 ± 0.7013.80 ± 1.20
Total water intake (mL)956.67 ± 0.00927.50 ± 5.83933.33 ± 70.00921.67 ± 11.671598.33 ± 58.331615.83 ± 122.50
1 Groups for subacute Toxicity. 2 Satellite groups for subacute toxicity.
Table 9. Relative organ weight of rats treated with E. tapos yoghurt in the subacute toxicity study. Values are expressed as mean ± SEM. (*) indicates a significant difference at p < 0.05.
OrgansGroups for Subacute Toxicity 1Satellite Group for Subacute Toxicity 2
SCST 250ST 500ST 1000SSCSST 1000
Relative organ weight (g)
Liver8.40 ± 0.659.33 ± 0.589.04 ± 0.438.46 ± 0.568.98 ± 0.939.79 ± 0.66
Spleen0.59 ± 0.050.51 ± 0.050.56 ± 0.070.78 ± 0.320.45 ± 0.020.54 ± 0.07
Kidney1.61 ± 0.101.78 ± 0.091.72 ± 0.092.03 ± 0.331.71 ± 0.07 *2.03 ± 0.09 *
RpWAT1.73 ± 0.281.58 ± 0.241.46 ± 0.201.43 ± 0.211.81 ± 0.231.92 ± 0.26
Visceral fat3.47 ± 0.513.12 ± 0.613.32 ± 0.712.47 ± 0.483.93 ± 0.452.94 ± 0.76
Inguinal fat1.22 ± 0.251.15 ± 0.181.44 ± 0.311.62 ± 0.381.25 ± 0.391.47 ± 0.28
Lung1.81 ± 0.072.05 ± 0.101.85 ± 0.051.84 ± 0.191.89 ± 0.112.08 ± 0.13
Heart0.93 ± 0.041.11 ± 0.160.90 ± 0.040.93 ± 0.020.92 ± 0.041.09 ± 0.08
Percentage per body weight (%)
Liver3.48 ± 0.353.64 ± 0.213.67 ± 0.213.45 ± 0.243.46 ± 0.413.58 ± 0.26
Spleen0.25 ± 0.030.20 ± 0.020.22 ± 0.030.32 ± 0.130.17 ± 0.010.20 ± 0.03
Kidney0.67 ± 0.050.70 ± 0.040.70 ± 0.040.83 ± 0.140.66 ± 0.040.74 ± 0.04
RpWAT0.70 ± 0.110.62 ± 0.090.59 ± 0.090.58 ± 0.080.70 ± 0.100.70 ± 0.09
Visceral fat1.44 ± 0.231.22 ± 0.241.34 ± 0.281.01 ± 0.201.51 ± 0.191.08 ± 0.28
Inguinal fat0.49 ± 0.090.45 ± 0.070.60 ± 0.140.66 ± 0.150.49 ± 0.160.55 ± 0.11
Lung0.74 ± 0.040.80 ± 0.040.75 ± 0.040.75 ± 0.080.72 ± 0.050.76 ± 0.05
Heart0.38 ± 0.030.43 ± 0.060.36 ± 0.020.38 ± 0.010.35 ± 0.010.40 ± 0.03
1 Groups for subacute Toxicity. 2 Satellite groups for subacute toxicity.
Table 10. The haematological effects of the different treatment dose of E. tapos yoghurt on female SD rats in the subacute toxicity study. Values are expressed as mean ± SEM. (*) indicates a significant difference at p < 0.05.
Groups for Subacute Toxicity 1Satellite Group for Subacute Toxicity 2
ParametersSCST 250ST 500ST 1000SSCSST 1000
Hb (g/dL)15.77 ± 0.4514.85 ± 0.2115.07 ± 0.2115.37 ± 0.3214.85 ± 0.3215.08 ± 0.21
RBC (×10−12/L)8.49 ± 0.268.15 ± 0.148.25 ± 0.178.39 ± 0.268.37 ± 0.228.38 ± 0.17
RDW (%)14.02 ± 0.4313.27 ± 0.2613.78 ± 0.1914.67 ± 0.6315.02 ± 0.2914.90 ± 0.52
PCV (%)47.50 ± 1.6745.00 ± 0.7345.33 ± 0.7145.00 ± 1.0345.50 ± 0.9946.17 ± 0.48
MCV (fL)56.00 ± 0.4555.33 ± 0.7654.83 ± 0.5453.83 ± 0.8354.33 ± 0.4255.00 ± 0.52
MCH (pg)18.67 ± 0.2118.33 ± 0.3318.33 ± 0.3318.50 ± 0.3418.00 ± 0.0018.17 ± 0.17
MCHC (g/dL)33.33 ± 0.3333.17 ± 0.3133.50 ± 0.4334.17 ± 0.4832.83 ± 0.1732.83 ± 0.31
WBC (×10−9/L)8.98 ± 1.31 *7.72 ± 0.695.35 ± 0.73 *5.47 ± 0.619.70 ± 0.86 *5.62 ± 1.14 *
Neutrophils (×10−9/L)2.22 ± 0.651.48 ± 0.201.15 ± 0.111.55 ± 0.381.47 ± 0.181.05 ± 0.17
Lymphocytes (×10−9/L)6.25 ± 0.77 *5.73 ± 0.493.82 ± 0.59 *3.57 ± 0.34 *7.85 ± 0.73 *4.23 ± 0.93 *
Monocytes (×10−9/L)0.20 ± 0.040.18 ± 0.050.15 ± 0.050.20 ± 0.090.10 ± 0.000.22 ± 0.16
Eosinophils (×10−9/L)0.30 ± 0.050.25 ± 0.010.23 ± 0.070.13 ± 0.010.22 ± 0.04 *0.11 ± 0.03 *
Basophils (×10−9/L)0.00 ± 0.000.02 ± 0.020.00 ± 0.000.00 ± 0.000.02 ± 0.020.00 ± 0.00
Platelet (×10−9/L)777.33 ± 162.16499.17 ± 127.46758.00 ± 204.29459.50 ± 206.471028.17 ± 84.56783.83 ± 172.72
1 Groups for subacute Toxicity. 2 Satellite groups for subacute toxicity.
Table 11. The effects of E. tapos yoghurt on biochemistry analysis in the subacute toxicity studies. Values are expressed as mean ± SEM. (*) indicates a significant difference at p < 0.05.
Groups for Subacute Toxicity 1Satellite Group for Subacute Toxicity 2
ParametersSCST 250ST 500ST 1000SSCSST 1000
Sodium (mmol/L)137.17 ± 0.40138.50 ± 0.76139.00 ± 0.52137.67 ± 0.33138.00 ± 0.52138.50 ± 0.43
Potassium (mmol/L)8.53 ± 0.167.98 ± 0.268.57 ± 0.208.50 ± 0.298.85 ± 0.248.30 ± 0.28
Chloride (mmol/L)101.83 ± 0.48101.00 ± 1.03101.50 ± 1.20102.83 ± 0.48100.00 ± 0.93102.17 ± 0.31
Urea (mmol/L)8.13 ± 0.48 *8.08 ± 0.45 *7.85 ± 0.556.23 ± 0.30 *7.65 ± 0.40 *6.38 ± 0.19 *
Creatinine (mmol/L)41.17 ± 1.83 *38.00 ± 1.0636.50 ± 2.1131.50 ± 1.23 *34.50 ± 5.0537.17 ± 1.14
Total Protein (g/L)66.83 ± 1.4966.33 ± 0.8470.00 ± 0.6366.50 ± 1.0974.17 ± 1.5870.83 ± 1.38
Albumin (g/L)38.67 ± 1.0239.67 ± 0.9241.67 ± 1.0539.67 ± 0.6142.33 ± 0.8841.17 ± 0.98
Globulin (g/L)28.17 ± 0.7926.67 ± 0.4228.33 ± 0.6726.83 ± 0.7531.83 ± 1.0129.67 ± 0.61
Albumin–Globulin ratio1.38 ± 0.041.49 ± 0.051.48 ± 0.071.48 ± 0.041.34 ± 0.041.39 ± 0.03
ALP (U/L)86.00 ± 3.57 *72.00 ± 2.96 *84.33 ± 6.72 *113.00 ± 5.59 *62.00 ± 7.1166.83 ± 4.87
AST (U/L)104.67 ± 5.6199.17 ± 9.42120.50 ± 18.71114.83 ± 10.5892.67 ± 15.5784.00 ± 7.60
ALT (U/L)33.67 ± 4.0136.83 ± 3.1641.83 ± 3.8935.50 ± 1.8847.83 ± 8.8934.50 ± 2.93
Gama-Glutamyl Transferase (U/L)10.83 ± 1.0111.67 ± 0.6111.50 ± 0.5610.83 ± 0.9113.00 ± 0.0013.00 ± 0.00
1 Groups for subacute Toxicity. 2 Satellite groups for subacute toxicity.

2.3.7. Histopathological Analysis

The histological observation on the liver, kidney, and heart section for subacute studies are shown in Figure 2 and Figure 3, respectively. The histopathological studies of the liver sections in the SC group showed a normal appearance of CV and hepatic sinusoids lined by endothelial cells (EC) with normal radiating hepatocytes. The rats supplemented with ST 250, ST 500, and ST 1000 showed a similar CV and sinusoids lined with EC with normal radiating hepatocytes as observed in the SC group. The SST 1000 showed a similar liver architecture structure as the SSC group, with no inflammation or congestion of WBC observed in group. The transverse striation of cardiac muscle cells, a central nucleus, and epicardium with the presence of mesothelial pavement cells were observed in heart tissue.

3. Discussion

This study is divided into two phases. In the first phase, also in vitro, the formulated E. tapos yoghurt was analysed for its nutritional composition. According to the cut-off point for nutritional composition indicated by European Union (EU) regulations, the formulated E. tapos yoghurt can be classified as a low-sugar and -protein yoghurt. This is due to its composition, which is <5 g sugar content per 100 g of E. tapos yoghurt and 2.6 g of protein content per 100 g of E. tapos yoghurt servings [14]. According to EU guidelines, dairy products such as yoghurt must contain at least 2.7 g/100 g servings for total protein and a maximum of 5 g/100 g of servings for sugars, while for fat should be <3 g/100 g per serving. However, for fat content, the E. tapos yoghurt shows a median threshold with 3.6 g per 100 g serving [14]. It contains an appreciable amount of total dietary fibre at 1.2%, providing 9.6 kJ, which enhances satiety effects and reduces energy intake [15]. It provides up to 33 kJ of calorie from digestible carbohydrates [16].
In the second phase, the formulated E. tapos yoghurt was tested on female SD rats for safety analysis. The toxicity study was evaluated through acute and subacute toxicity studies (repeated dose). In acute toxicity study, AT 2000, at a single dose of 2000 mg/kg per body weight did not cause any mortality, behavioural abnormalities, postural changes, or drastic body weight changes. However, slight reduction in bodyweight was seen in ST 250 in the first week. Even so, the weight gain and calorie intake were comparable between the ST 250 and the control group during the rest of the experimental period. No weight loss was documented after the first week. Other groups in the subacute and acute study did not reveal any treatment dependent body weight changes or weekly food intake.
The kidney and liver are the most vital organs to rule for toxicity in both animals and humans. The gross weight measurement of kidney could indicate some sort of serious adverse effects. For instance, as noticed in this study (SST 1000 group), the increase in kidney mass could be due to hydronephrosis or nephrotoxicity, as reviewed by previous literature [17]. However, the contraindication of liver profile test results, such as a decreased level of urea, creatinine, globulin, and ALP and AST in the acute or repeated-dose study, confirms the absence for the possibility of hydronephrosis or nephrotoxicity due to E. tapos yoghurt’s consumption.
Meanwhile, the level of urea, ALP, AST, and creatinine are some of the biomarkers for renal functionality [18]. Decreased levels of urea, globulin, and creatinine in serum correlates with severe malnutrition or liver diseases [19], while significantly low levels of serum ALP and AST observed, as in subacute phase, contraindicate the possibility of developing malnutrition or liver disease. This is because low levels of ALP and AST prove the absence of protein malnutrition, as in the case of a low-protein diet, where the levels of ALP and AST will increase according to the severity [20]. Moreover, a low-protein diet also is an indicator for decreased levels of urea in serum [21,22]. The primary reason for this is mainly because urea is the end metabolite of the protein catabolism process by the liver [23], while creatinine is the product of creatinine metabolism in the muscles [24].
In contrast, decreased levels of globulin together with increased levels of albumin are a simple indicator for the immune system maturation process. This is because maternally obtained antibodies tend to degrade within the first 6 weeks of birth, and during this period, albumin synthesize will increase [25]. This is an indicator for normal liver formation, and since the SD rats used in this study were 6-week-olds, this hypothesis is acceptable. Non-significant changes observed in all other liver and kidney profile tests in both acute and subacute study may suggest that E. tapos yoghurt does not have adverse effects on kidney and liver.
Haematological analysis in toxicity study shows the possibility of toxic effects induced by test material. From the blood biochemistry, a reduction in WBC, specifically lymphocytes, was recorded in both ST 500 and SST 1000 study, while low levels of eosinophils and MCV were documented in the SST 1000 and AT 2000 groups, respectively. Both lymphocytes and eosinophils are involved in immune defence, and usually a slight reduction in these is not something to be concerned with. However, significant reduction of lymphocytes and eosinophils in the animal model usually relates to chronic stress level, such as chronic renal failure or inflammation [26]. However, normal architecture and absence of inflammation in histopathological evaluation of liver, kidney, and heart in both acute and subacute toxicity study confirms the absence of any form of injury to liver or kidney. Low levels of MCV are a clinical sign either in anaemic condition [27] or psychological stress [28]. Yet, normal levels of HB, RBC, MCHC, and MCH rule out the possibility of anaemic condition in treated rats. Thus, the slight decrease in lymphocytes, eosinophils, and MCV most probably could be incidental instead of due to a treatment-related effect. Non-significant changes observed in all other blood biochemistry parameters in both acute and subacute study may suggest E. tapos yoghurt does not have effects on haematological products.
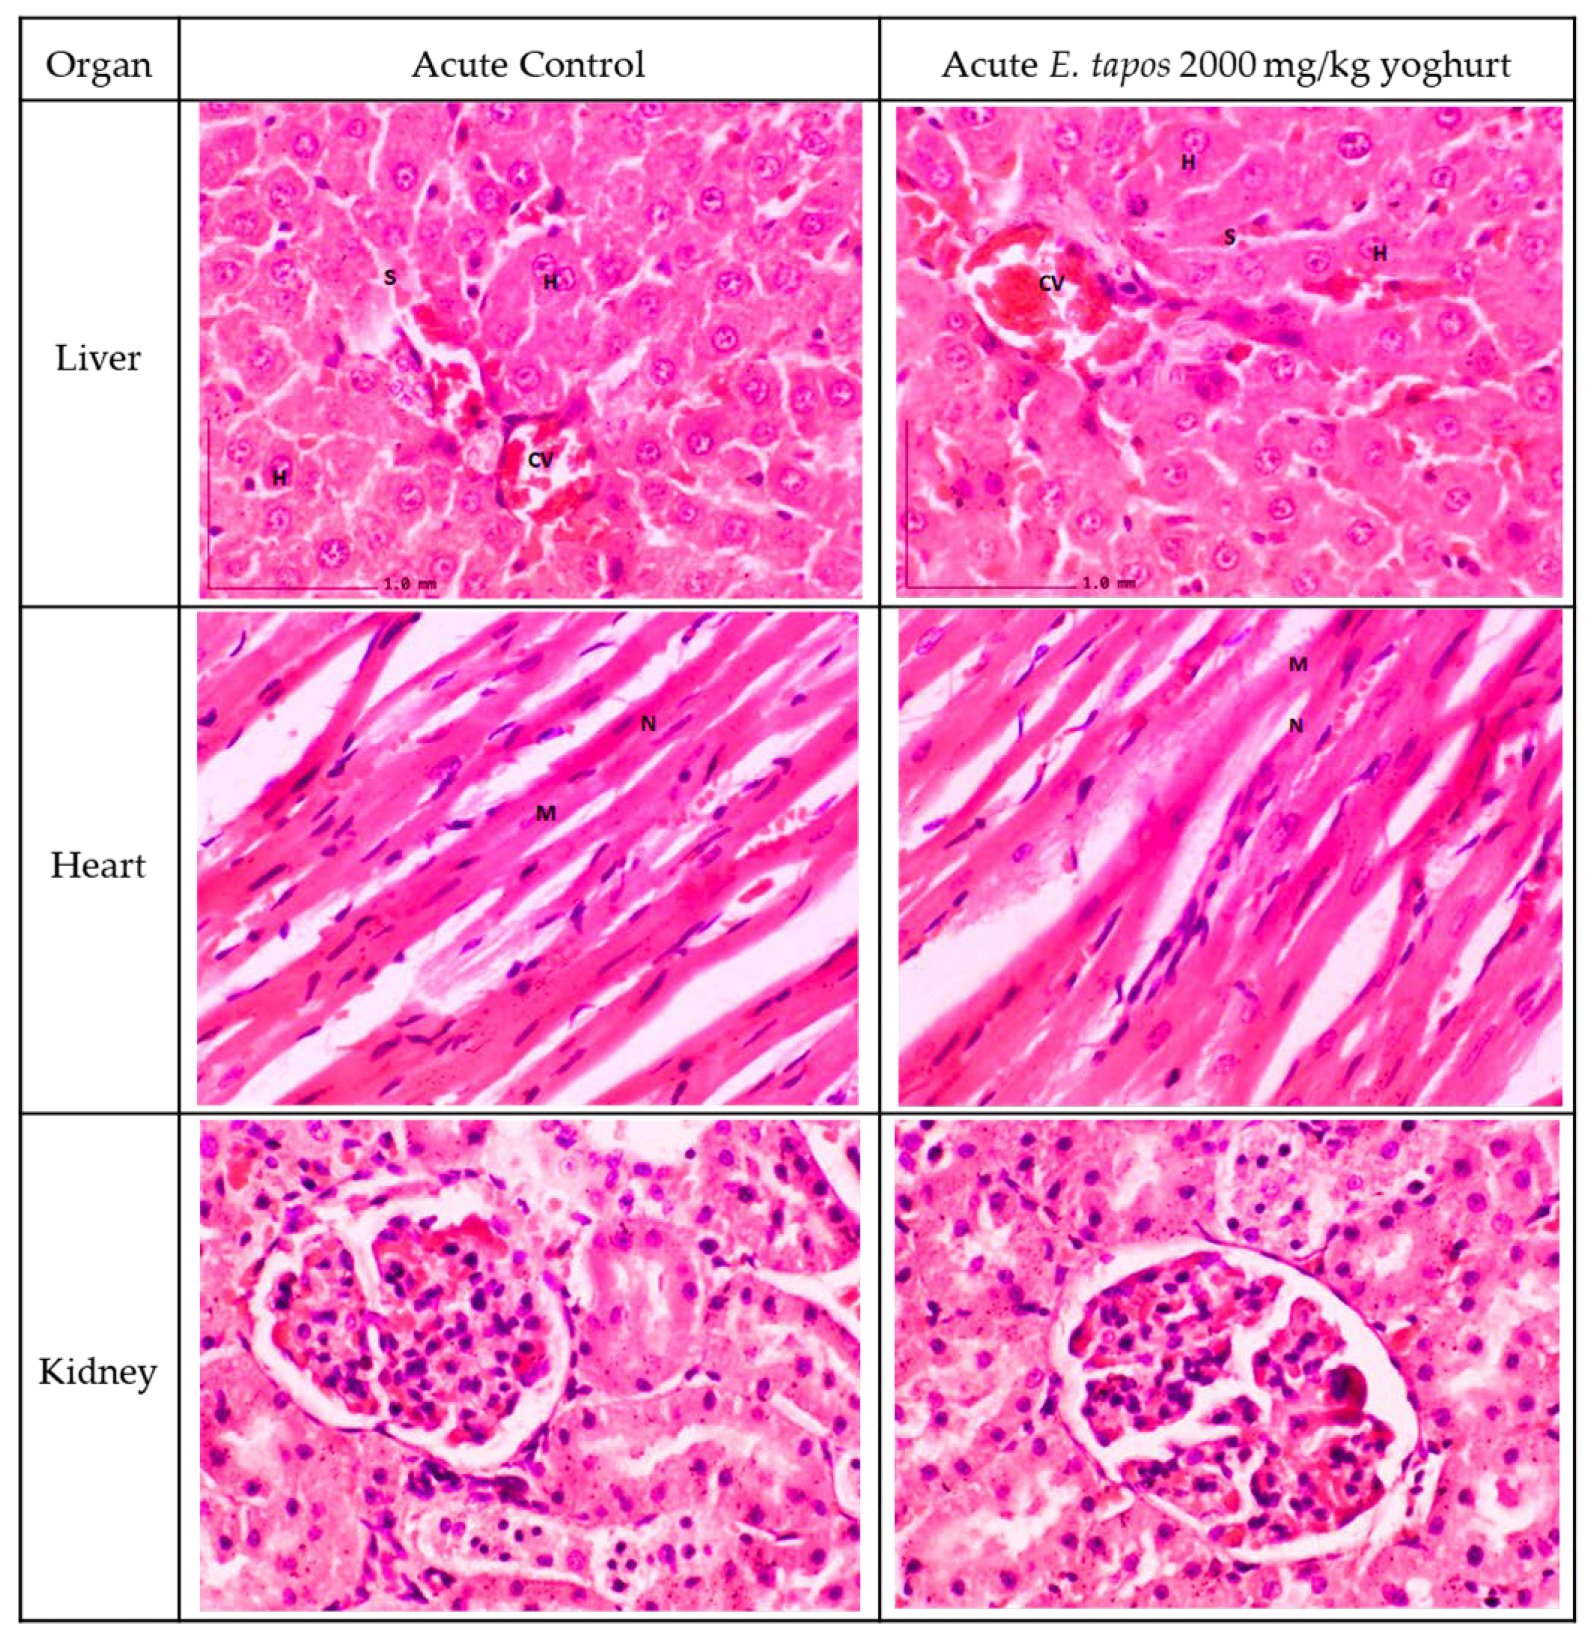
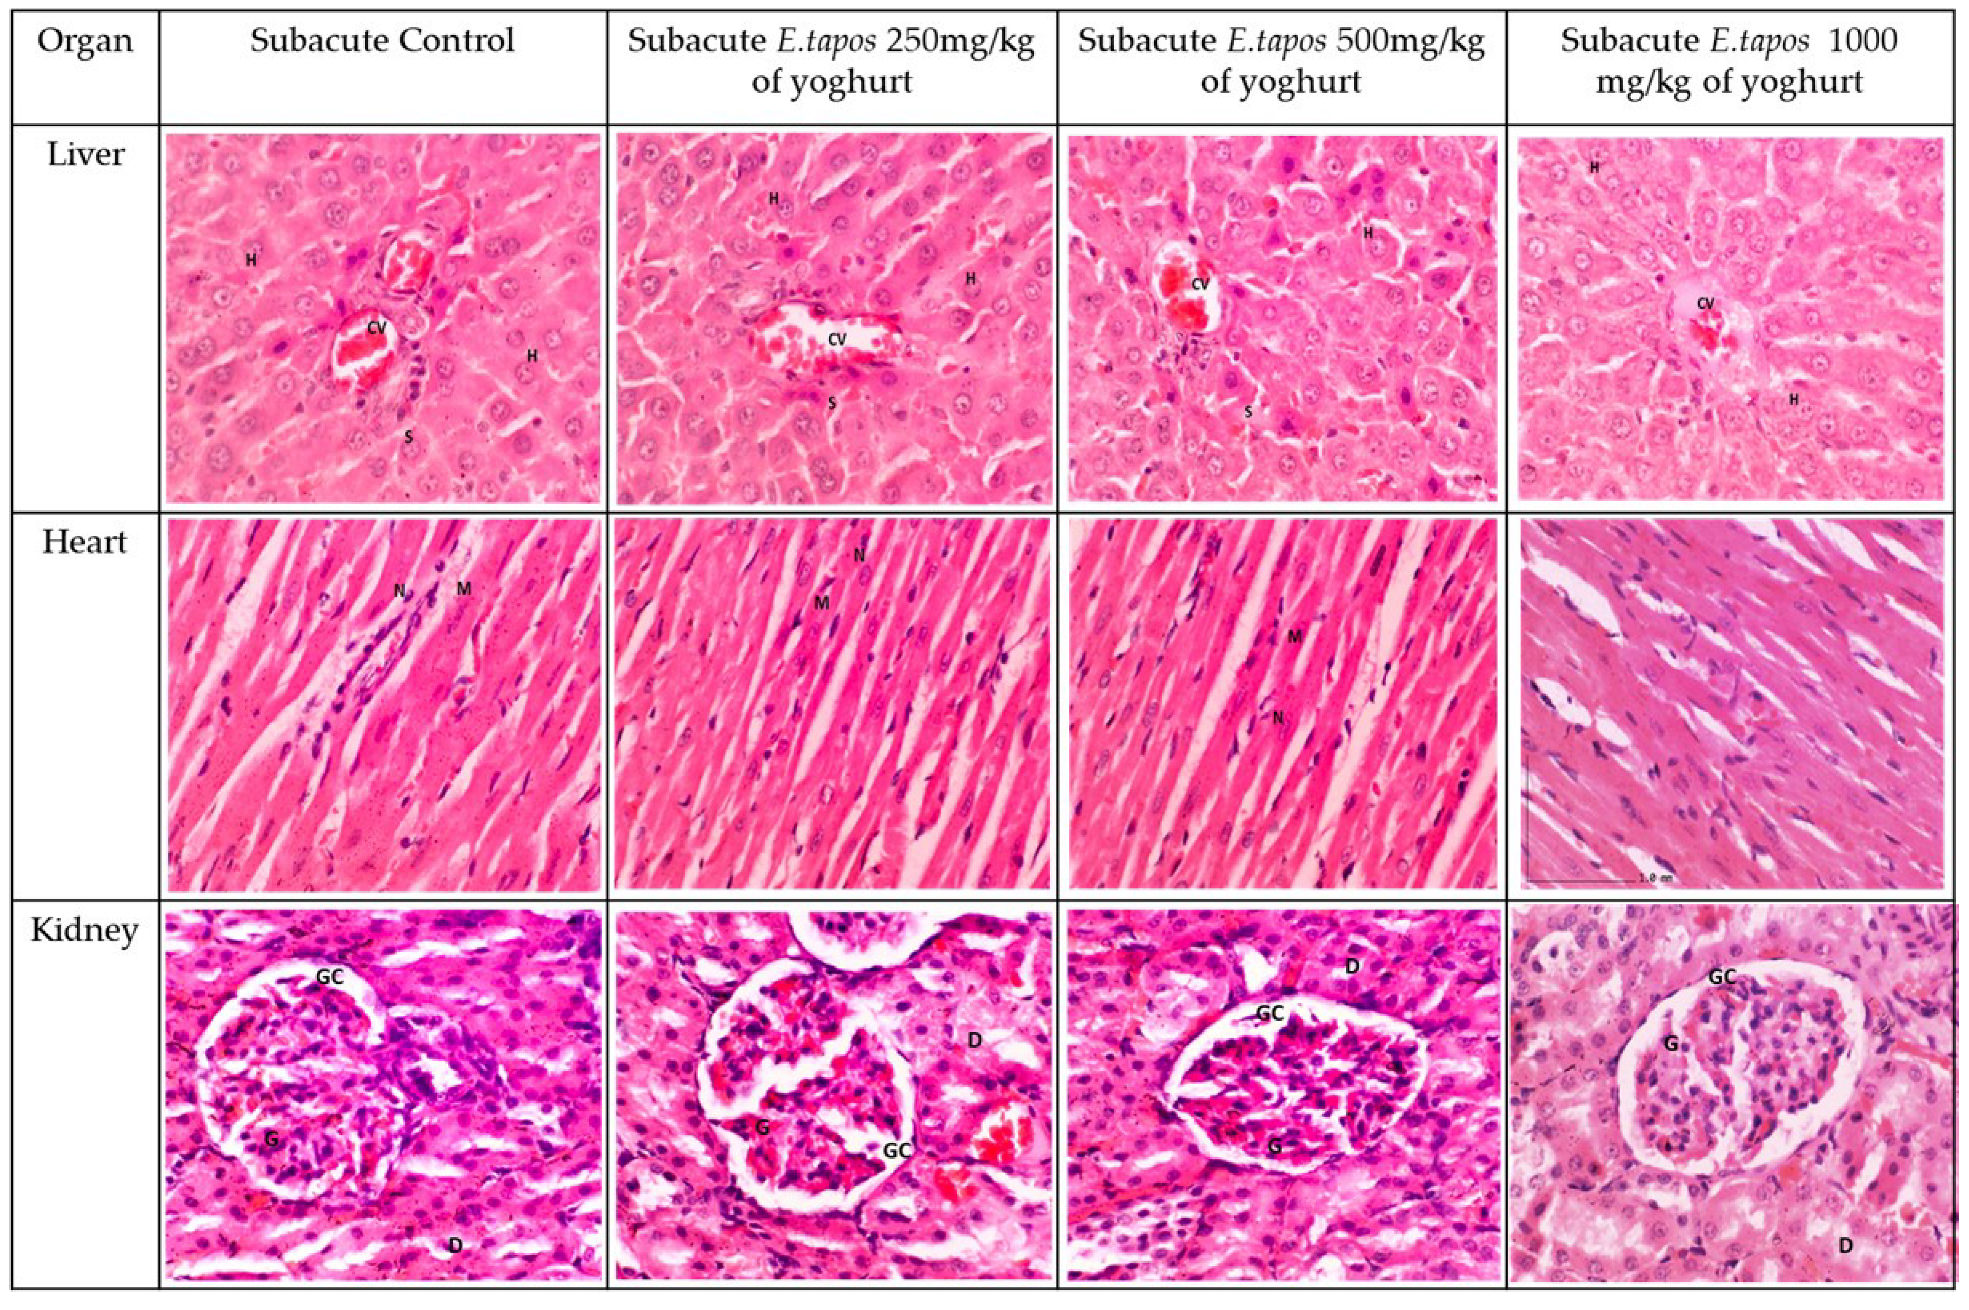
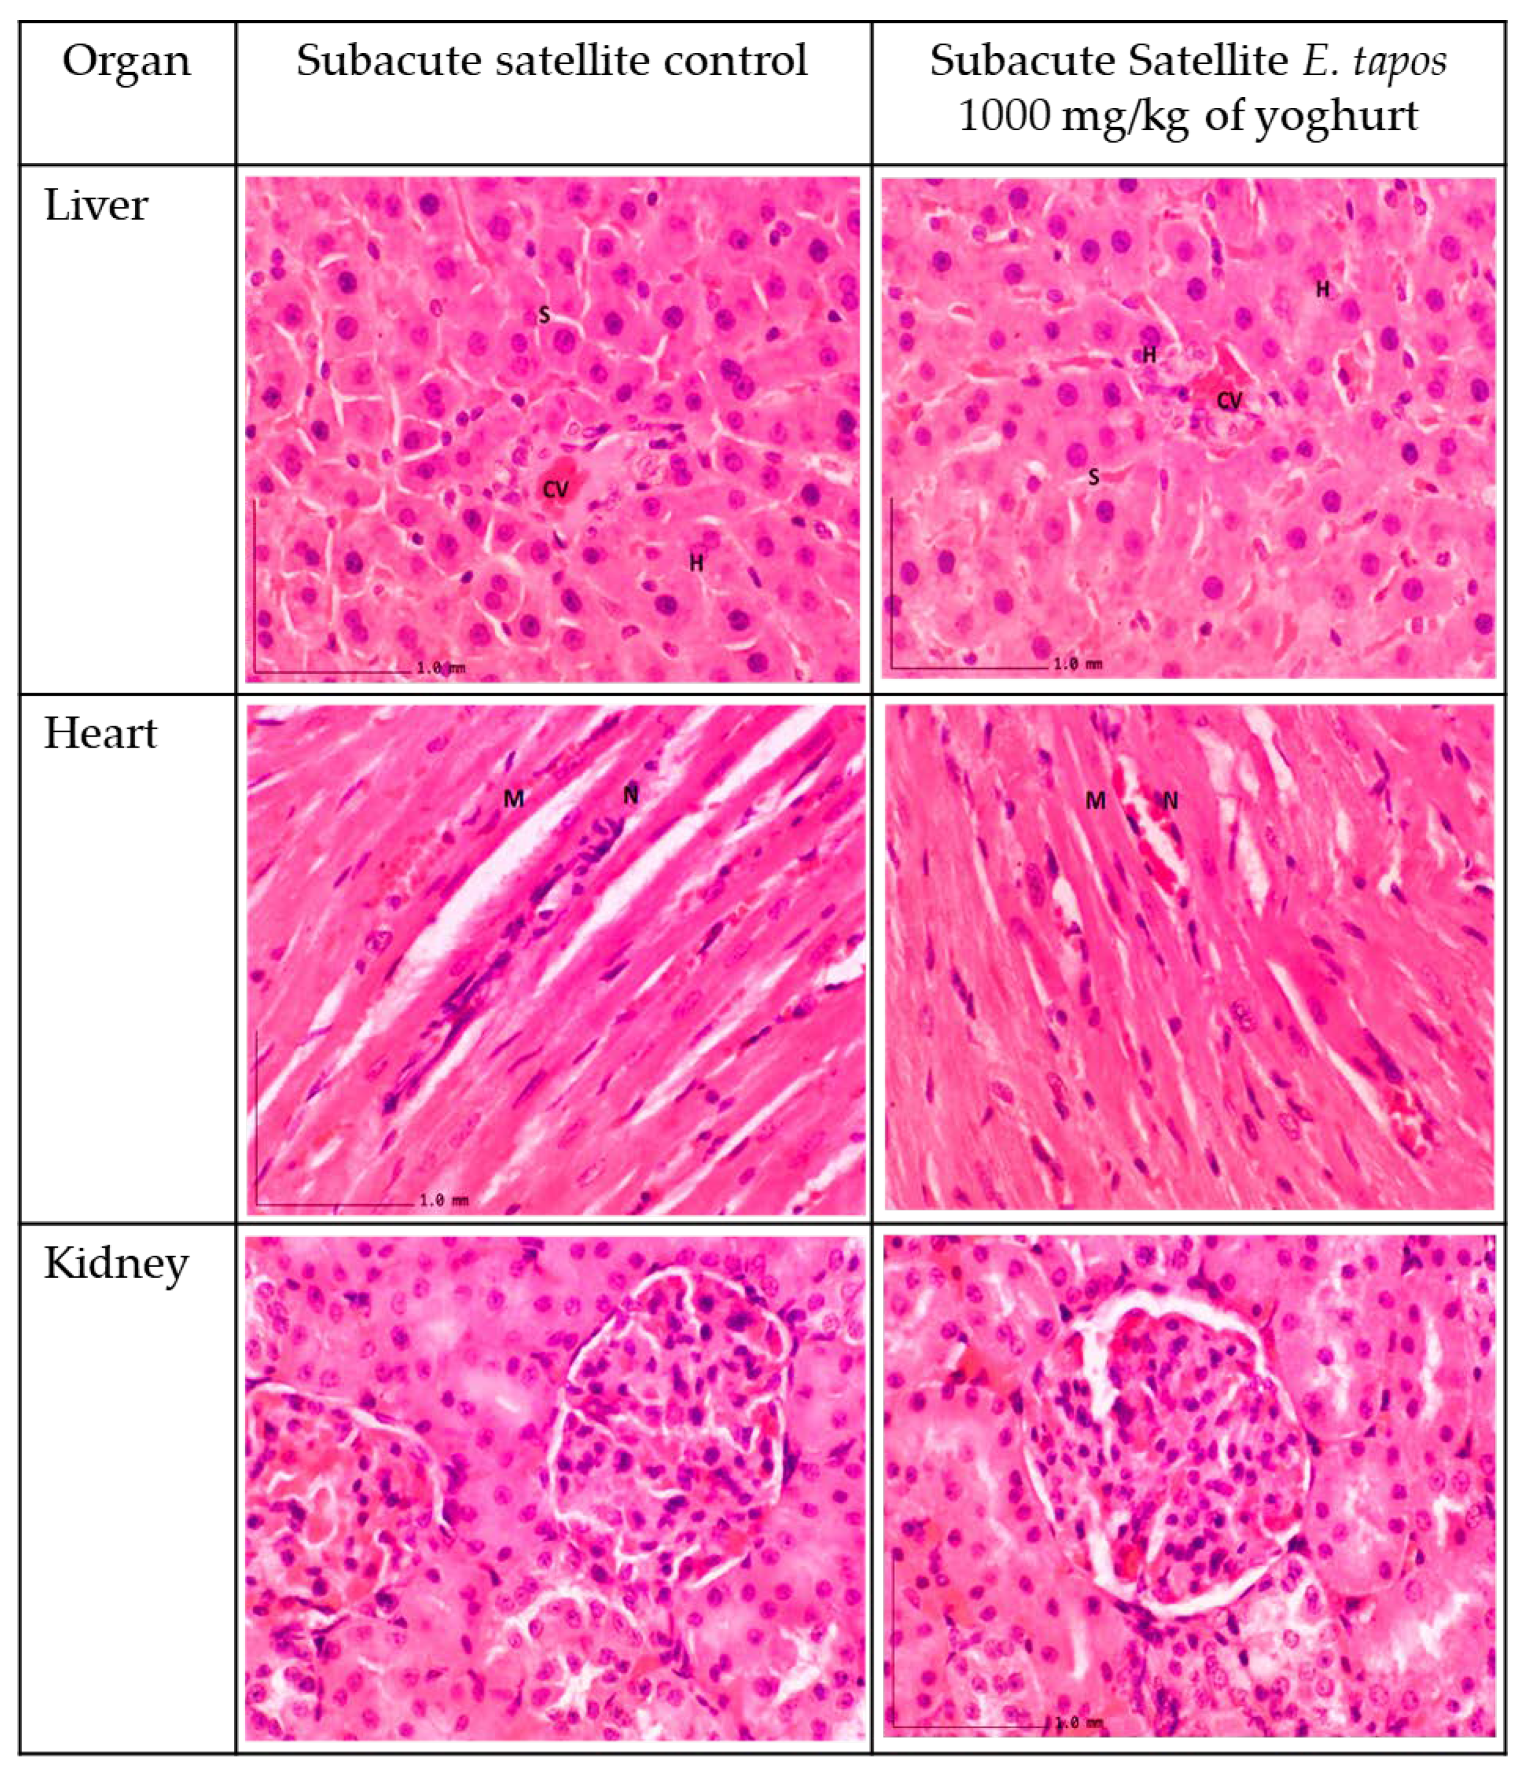
From the histopathological perspective, liver, kidney, and heart are the primary organs to be affected in case of stimulatory effect of toxins. Observation on gross morphology on kidney, liver, and heart did not show any form of abnormal texture, colour, or hypertrophy in both acute and subacute study in comparison to AC, SC, or SSC groups. Moreover, organ weight could be a marker of the pathological condition of the rats. Overall, there were no significant differences in ROW documented for liver, kidney, and heart in both acute and subacute studies in comparison with their respective control groups. Microscopic sectioning and staining of liver showed no evidence of inflammation or necrosis. Instead, a normal lobular arrangement was observed. There were neither manifestations of glomerulosclerosis nor scarring of parenchymal tissue in the renal tissue. In the heart, absence of myocardial necrosis was confirmed in both acute and repeated-dose study, further proving the safety of E. tapos yoghurt. In consideration with the data obtained from the nutritional analysis and toxicological evaluation study, it can be concluded that single-dose administration of up to 2000 mg/kg/day is a tolerable dosage.

4. Materials and Methods

4.1. Collection and Confirmation of Plant Species

The fresh E. tapos plant was obtained from Research Centre of Forest Research Institute of Malaysia (FRIM), Pahang. The plant materials were identified and deposited at the Medicinal Plant division of FRIM followed by the separation of E. tapos seed. The seed was then sent for confirmation at Herbarium Biodiversity Unit (voucher code: UPM SK 3154/17) at the Institute of Bioscience, Universiti Putra Malaysia.

4.2. Ethanol Extraction of E. tapos Seed

The E. tapos seed was washed with running tap water to remove any external material. About 500 g of seed was soaked in 2000 mL of 95% ethanol in a 2 L conical flask. The conical flask was wrapped with aluminium foil and was left at room temperature for seven days. On the 7th day, the supernatant was collected and filtered through a Whatman paper N°1 filter paper. The solid residue was then repeatedly extracted 3 times with ethanol. The filtrates from each extraction was combined, and all the solvent was evaporated under reduced pressure using a rotary evaporator to yield the crude ethanolic extract of each E. tapos seed [29]. The obtained crude extracts were then mixed with maltodextrin in the ratio of 1:1 [30]. The samples were stirred at room temperature and oven dried overnight at 45 °C. The final extracted powder was then stored at −20 °C until further usage.

4.3. Preparation of E. tapos Yoghurt

The formula for yoghurt preparation was adapted and modified from methods described elsewhere [31]. About 100 mL of full cream (Dutch Lady Purefarm UHT) milk was pasteurized at 70–75 °C for 30 min using the microwave and cooled down to 45 °C at room temperature. The probiotic starter culture (0.06% w/w) consisting of a mixture culture of lactose, milk, Streptococcus thermophilus APC151, Lactobacillus delbrueckii subsp. Bulgaricus ATCC 11842, and autolysed yeast purchased from New England cheesemaking supply company was added to the cooled milk. This was then further incubated in the yoghurt maker (Pensonic PYM-700) at 40–45 °C for 7 h until the pH dropped to 4.5–4.6. The final product of the yoghurt was then refrigerated at 4 °C overnight. The following day, a stock E. tapos yoghurt solution was prepared by dissolving 2 g of E. tapos fleshes of powder into 100 mL of yoghurt [31].

4.4. Color and Visual Appearance

A colorimeter (Chroma meter CR-400, Minolta, Osaka, Japan, equipped with illuminant/observer D65/2°) was used to study the colour changes in yoghurt during the fermentation process. The result was documented as lightness or darkness and yellowness or blueness, as described elsewhere [32].

4.5. Determination of pH at 25 C

The pH values of the formulated yogurt were measured using digital potentiometer (420 Benchtop, Orion Research Inc., Beverly, MA, USA) [1].

4.6. Titrable Acidity of Lactic Acid

The titrable acidity of lactic acid was determined according to the method described in AOAC (2000). In this, 0.1 M of NaoH was titrated into 10 mL of yoghurt [33]. The acidity was then expressed as gram of lactic acid/100 g using the formula below:
Total acidity = volume × NaOH factor (mL) × 0.009 × yoghurt volume × 100

4.7. Determination of Total Sugar

The refractometric method was used to determine the total sugar content in the yoghurt. In this, about 2 to 3 drops of yoghurt was pipetted into the main prism. The appearance of boundary lines in the refraction field was recorded, and the refractive index was identified [34].

4.8. Determination of Fat

Gerber protocol was adapted to determine the fat content. In these, 10 mL of ammonia was added to the 100 mL yoghurt and mixed well. Simultaneously, 10 mL of 1.825 g/L sulfuric acid (H2SO4) was pipetted into the butyrometer. The mixture of yoghurt was then gently pipetted into the butyrometer, allowing the formation of a thin layer on top of the H2SO4 acid. Then, 1 mL of 0.815 g/L amyl alcohol was dispensed into the butyrometer, inverted, and was centrifuged for 5 min [35]. After centrifuging, the fat content was determined using the formula below:
Fat percentage = (B − A) × 1.1
A = Reading obtained at the base of fat column;
B = Reading obtained at the crest of the fat column.

4.9. Determination of Protein Content

The Kjeldahl method was used to measure the protein content. Formulated yoghurt was placed into Kjeldahl flask and digested with H2SO4 and catalyst. This was followed by dilution with H2O and neutralization with sodium thiosulfate to obtain boric acid solution. Hydrochloric acid was then used to titrate the borate anions, which eventually forms nitrogen [36]. The crude protein was calculated by multiplying with the conversion factor of 6.38 using the formula below:
% N × 6.38 = % protein

4.10. Determination of Carbohydrate

Phenol sulfuric acid method was used to determine the carbohydrate content. First, 200 µL of 5% of phenol was added to the 200 µL of yoghurt in a test tube. This was followed by adding 1 mL of concentrated H2SO4 and vortex. The mixture in the test tube was then incubated in room temperature for 60 min and was read using a spectrophotometer at 490 nm absorbance [37].

4.11. Determination of Energy

The energy content of the formulated yoghurt was calculated based on the method JKM F 1205 based on the guidance of Nutrition Labelling and Claims by Food safety and quality Division MOH described in the Malaysian food composition database [38]. The formula used for energy (kcal) calculations are as below:
Energy, kcal/100 g = [Fat] × 9 + [Protein] × 4 + [Carbohydrate] × 4
Energy, kJ/100 g = kcal × 4.184

4.12. Determination of Total Dietary Fibre

Dietary fibre content was determined according to the procedure elsewhere [33]. In this, the formulated yoghurt was freeze dried until the powder form was obtained. The powder form of yoghurt was then placed into digestion flask, and 200 mL of 1.25% of H2SO4 was added. It was boiled for about 30 min with frequent rotation until the samples became completely wet. Thereafter, the samples were filtered with fluted funnel and washed with boiling water. The residue was again washed with 200 mL of 1.25% of H2SO4 and boiled for 30 min via reflux condenser. Thereafter, the samples were filtered with an asbestos mat, and the residue was again washed with boiling water, followed by 10 mL of alcohol, and dried at 110 °C (W1). The residue was then transferred into the muffle furnace at a controlled temperature of 525 to 550 °C, and the ash material was used to obtain the value of W2. The loss of weight represents the crude fibre [33].

4.13. Survival of Lactic Acid Bacteria

The method was adapted and modified from Vinderola et al., 2003. In this, approximately 25 mL of yoghurt was diluted with 225 mL of peptone H2O in a bag mixer 400 (Interscience, St. Nom, France). The dilution was then spread on a Petri dish containing Rogosa agar and incubated at 37 °C in anaerobic jars for 72 h. After 72 h, the colony formed was counted and expressed as colony-forming units per gram (CFU/g) [39].

4.14. Microbiological Analysis

Survival of Lactobacillus species in the yoghurt was measured on day 1 and 90 according to the method described by Tontul et al., 2018. In this method, 1 g of yoghurt was diluted with 9 mL of Ringer solution (Merck KGaA, Darmstadt, Germany) and vortexed, and further dilutions were made. The dilutions were then spread in a Petri dish containing Rogosa agar. The colony formed was counted, adjusted to pH 6.5 by adding on 0.1 M of NaOH, and incubated at 37 °C in anaerobic jars for 72 h. For Streptococcus thermphillus, the colony was counted by spreading the dilutions in a Petri dish containing M17 agar (Merck KGaA, Darmstadt, Germany), which was incubated aerobically at 37 °C for 48 h [32].

4.15. Experimental Animals

All animal-related procedures were conducted under the approval of the Animal Care and Use Committee of the Management and Science University (MSU). The animal ethics committee of MSU granted approval for this study under the animal ethics number of AE-MSU-073. Young adult female Sprague Dawley (SD) rats weighing between 150 g and 200 g (6 weeks old) were used to access acute and subacute toxic effects of E. tapos yoghurt for the in vivo study. All rats were acclimatized for 1 week in a temperature-controlled room (22 ± 3 °C) at 12/12 h light/dark cycle. The rats were fed with standard rat pellets containing 306.2 kcal/100 g with 48.8% carbohydrate, 21% protein, and 3% fat, which is equivalent to 12.8 kJ/g, with ad libitum availability. Body weight and 24-hour food intake (kJ) were measured weekly [40].

4.16. Acute Toxicity Study

The acute toxicity study was performed according to the protocol described in OECD 425 guidelines. Rats were divided into 2 groups (n = 8), where the control group received normal saline (bottle-feeding), while the treatment group received 2000 mg/kg of E. tapos yoghurt (force-feeding) for 2 weeks. All rats were observed every 4 h for the next 14 days for any abnormalities in behaviour pattern until euthanasia period. At the end of experiment, all rats were euthanized with CO2. Blood was collected in EDTA and plain tube for further biochemical and haematological analysis. Liver, kidney, and heart were excised, weighed, observed macroscopically, and preserved in 10% neutral buffered formalin at room temperature.

4.17. Subacute Toxicity Study (Repeated Dose)

Subacute toxicity test was performed according to OECD 407 guidelines on repeated dose of 28-day oral toxicity study in rodents. Rats were divided into 6 groups (n = 8), and E. tapos yoghurt was orally administered (force-feeding) once daily at a dose of 250, 500, and 1000 mg/kg, while the subacute control (SC) and satellite control (SSC) received a normal saline (bottle-feeding). All rats were observed every 4 h for any abnormalities in behaviour patterns until the euthanasia period. At the end of experiment, all rats were euthanized with CO2. Blood was collected in EDTA and plain tube for further biochemical and haematological analysis. Liver, kidney, and heart were excised, weighed, observed macroscopically, and preserved in 10% neutral buffered formalin at room temperature.

4.18. Full Blood Count and Plasma Biochemistry

Serum was used to access plasma biochemistry, such as haemoglobin (HB), red blood cell (RBC), red cell distribution width (RDW), packed cell volume (PCV), mean corpuscular volume (MCV), mean corpuscular haemoglobin (MCH), mean corpuscular haemoglobin concentration (MCHC), platelet, and white blood cell (WBC), using automated BC-2800 VET/Mindray machine. Liver profile, such as level creatinine, alkaline phosphatase (ALP), aspartate transaminase (AST), and alanine aminotransferase (ALT), sodium, potassium, chloride, urea, creatinine, and kidney profile test (total protein, albumin, globulin, albumin-globulin ratio), were measured using Alere Cholestech LDX® Analyzer (Alere, UK).

4.19. Histopathological Analysis

Tissue processing was performed on all the preserved organs (kidney, heart, and liver). Sectioning was performed to obtain a thin layer of paraffin ribbon with tissue thickness between 4 μm to 7 μm followed by ribbon fishing. Paraffin ribbon was placed in the water bath at a temperature range of 40 °C to 45 °C and was transferred onto a glass slide. All slides were stained using haematoxylin and eosin (H&E) stain. Tissues were then observed under the light microscope, and histological changes were captured [13]. The presence of lesions was scored according to the guideline provided elsewhere [13]. All the scoring was validated by two independent certified pathologists from UPM.

5. Conclusions

In the present experiment, newly formulated E. tapos yoghurt was analysed for its nutritional content and toxicity in SD female rats. The result of acute and repeated-dose study of up to 2000 mg/kg showed no adverse effects or toxicity towards blood components or serum biochemicals or to the kidney, liver, and heart. These results provide preliminary data for the E. tapos yoghurt. Thus, further assessment concerning the genotoxicity, compound toxicity, or subchronic and chronic toxicity study must be done in the future before proceeding with clinical trials, and it is mandatory to further investigate the safety efficacy of the E. tapos yoghurt consumption at various ages.

Author Contributions

Conceptualization, R.N. and R.N.M.R.; methodology, R.N.; software, S.S.B.; validation, H.B., M.D.Y. and A.S.J.; formal analysis, R.N.; investigation, R.N.; resources, S.H.J.; data curation, F.O.; writing—original draft preparation, R.N.; writing—review and editing, R.N.; visualization, S.S.B. and R.N.; supervision, H.B., M.D.Y. and A.S.J.; project administration, R.N.; funding acquisition, M.D.Y. and H.B. All authors have read and agreed to the published version of the manuscript.

Funding

This work was supported by the Ministry of Higher Education, Malaysia under Fundamental Research Grant Scheme with the code project of FRGS/1/2020/SKK0/UPM/02/4 and reference number under Universiti Putra Malaysia 04-0L-20-2274FR.

Institutional Review Board Statement

The study was conducted in accordance with the Declaration of MSU and UPM. The animal study protocol was approved by Ethics Committee of MSU (Animal Ethics No: AE-MSU-073).

Informed Consent Statement

Not applicable.

Data Availability Statement

Not applicable.

Conflicts of Interest

The authors declare no conflict of interest.

References

  1. Nguyen, L.; Hwang, E.S. Quality Characteristics and Antioxidant Activity of Yogurt Supplemented with Aronia (Aronia melanocarpa) Juice. Prev. Nutr. Food Sci. 2016, 21, 337. [Google Scholar] [CrossRef] [PubMed]
  2. Jørgensen, C.E.; Abrahamsen, R.K.; Rukke, E.O.; Hoffmann, T.K.; Johansen, A.G.; Skeie, S.B. Processing of high-protein yoghurt—A review. Int. Dairy J. 2018, 88, 42–59. [Google Scholar] [CrossRef]
  3. Greis, M.; Sainio, T.; Katina, K.; Kinchla, A.J.; Nolden, A.; Partanen, R.; Seppä, L. Dynamic texture perception in plant-based yogurt alternatives: Identifying temporal drivers of liking by TDS. Food Qual. Prefer. 2020, 86, 104019. [Google Scholar] [CrossRef]
  4. Mallentin, J. Key Trends in Food, Nutrition & Health 2017—And How They Can Work for You; NewNutrition Business: London, UK, 2017; Volume 22. [Google Scholar]
  5. Hall, W.L.; Millward, D.J.; Long, S.J.; Morgan, L.M. Casein and whey exert different effects on plasma amino acid profiles, gastrointestinal hormone secretion and appetite. Br. J. Nutr. 2003, 89, 239–248. [Google Scholar] [CrossRef] [PubMed]
  6. Gibson-Moore, H. Nutrition Bulletin; Sage Publications: London, UK, 2009; pp. 126–173. [Google Scholar]
  7. Kim, S.; Huang, E.; Park, S.; Holzapfel, W.; Lim, S.D. Physiological Characteristics and Anti-obesity Effect of Lactobacillus plantarum K10. Korean J. Food Sci. Anim. Resour. 2018, 38, 569. [Google Scholar] [CrossRef]
  8. El-Abbadi, N.H.; Dao, M.C.; Meydani, S.N. Yogurt: Role in healthy and active aging. Am. J. Clin. Nutr. 2014, 99, 1270S. [Google Scholar] [CrossRef] [PubMed]
  9. De Vrese, M.; Laue, C.; Offick, B.; Soeth, E.; Repenning, F.; Thoß, A.; Schrezenmeir, J. A combination of acid lactase from Aspergillus oryzae and yogurt bacteria improves lactose digestion in lactose maldigesters synergistically: A randomized, controlled, double-blind cross-over trial. Clin. Nutr. 2015, 34, 394–399. [Google Scholar] [CrossRef]
  10. Abidin, A.Z.; Balan, S.S.; Perumal, K.V.; Shafie, N.H.; Abdullah, M.A.; Jasni, A.S.; Kadir, K.K.A.; Bahari, H. Elateriospermum tapos Supplementation in Dams Ameliorating Obesity Development and Stress Hormone Level among Adult Male Offspring. Proceedings 2020, 61, 2. [Google Scholar] [CrossRef]
  11. Nor-Liyana, J.; Siroshini, K.T.; Nurul-Syahirah, M.B.; Chang, W.L.; Nurul-Husna, S.; Daryl, J.A.; Khairul-Kamilah, A.K.; Hasnah, B. Phytochemical analysis of Elateriospermum tapos and its inhibitory effects on alpha-amylase, alpha-glucosidase and pancreatic lipase. J. Trop. For. Sci. 2019, 31, 240–248. [Google Scholar] [CrossRef]
  12. Perumal, K.V.; Ja’afar, N.L.; Taib, C.N.M.; Shafie, N.H.; Bahari, H. Antiobesity activity of Elateriospermum tapos shell extract in obesity-induced sprague dawley rats. Molecules 2021, 26, 321. [Google Scholar] [CrossRef]
  13. Balan, S.S.; Abidin, A.Z.; Perumal, K.V.; Shafie, N.H.; Abdullah, M.A.; Jasni, A.S.; Kwaifa, I.K.; Bahari, H. Transgenerational evaluation of Elateriospermum tapos extracts on the male offspring of obesity-induced sprague dawley rats. Sains Malays. 2021, 50, 3045–3057. [Google Scholar] [CrossRef]
  14. Moore, J.B.; Horti, A.; Fielding, B.A. Evaluation of the nutrient content of yogurts: A comprehensive survey of yogurt products in the major UK supermarkets. BMJ Open 2017, 8, e021387. [Google Scholar] [CrossRef] [PubMed]
  15. Hervik, A.K.; Svihus, B. The Role of Fiber in Energy Balance. J. Nutr. Metab. 2019, 2019, 4983657. [Google Scholar] [CrossRef]
  16. Slavin, J.; Carlson, J. Carbohydrates. Adv. Nutr. 2014, 5, 761. [Google Scholar] [CrossRef] [PubMed]
  17. Craig, E.A.; Yan, Z.; Zhao, Q.J. The relationship between chemical-induced kidney weight increases and kidney histopathology in rats. J. Appl. Toxicol. 2015, 35, 729–736. [Google Scholar] [CrossRef]
  18. Tsegay, Y.G.; Bitew, M.; Workneh, T.; Atlaw, A.; Aragaw, M.; Gemechu, M.; Brhane, N. The level of liver and renal function biomarker abnormalities among hospitalized COVID-19 patients in Ethiopia. medRxiv 2022. [Google Scholar] [CrossRef]
  19. Tufan, F.; Yildiz, A.; Dogan, I.; Yildiz, D.; Sevinir, Ş. Urea to creatinine ratio: A forgotten marker of poor nutritional state in patients undergoing hemodialysis treatment. Aging Male 2014, 18, 49–53. [Google Scholar] [CrossRef]
  20. Chowdhury, M.S.I.; Rahman, A.Z.; Haque, M.; Nahar, N.; Taher, A. Serum Aspartate Aminotransferase (AST) and Alanine Aminotransferase (ALT) Levels in Different Grades of Protein Energy Malnutrition. J. Bangladesh Soc. Physiol. 2007, 2, 17–19. [Google Scholar] [CrossRef]
  21. Yeun, J.Y.; Depner, T.A.; Ananthakrishnan, S. Principles of hemodialysis. In Chronic Kidney Disease, Dialysis, and Transplantation: A Companion to Brenner and Rector’s The Kidney; Himmelfarb, J., Ikizler, T.A., Eds.; Elsevier: Nashville, TN, USA, 2019; pp. 339–360.e7. ISBN 978-0-323-52978-5. [Google Scholar]
  22. Watanabe, S. Low-protein diet for the prevention of renal failure. Proc. Jpn. Acad. Ser. B. Phys. Biol. Sci. 2017, 93, 9. [Google Scholar] [CrossRef]
  23. Stevens, A.L.; Shastri, S.; Levey, S.A. Comprehensive clinical nephrology. In Comprehensive Clinical Nephrology; Floege, J., Johnson, R.J., Feehally, J., Eds.; Elsevier: Aachen, Germany, 2009; pp. 31–38. ISBN 9780323058766. [Google Scholar]
  24. Hosten, A.O. BUN and creatinine. In Clinical Methods: The History, Physical, and Laboratory Examinations; Walker, H.K., Hall, W.D., Hurst, J.W., Eds.; Butterworths: Boston, MA, USA, 1990; ISBN 10: 0-409-90077-X. [Google Scholar]
  25. Gorman, M.E. Clinical chemistry of the puppy and kitten. In Small Animal Pediatrics; Peterson, M.E., Kutzler, M.A., Eds.; Elsevier: Corvallis, OR, USA, 2011; Volume 30, pp. 259–275. ISBN 978-1-4160-4889-3. [Google Scholar]
  26. Katz, V.L.; Lentz, G.; Lobo, R.A.; Gershenson, D.; Willard, M. Leukocyte disorders. In Small Animal Clinical Diagnosis by Laboratory Methods; Willard, M.D., Tvedten, H., Eds.; Elsevier: Uppsala, Sweden, 2012; pp. 63–91. ISBN 9781437706574. [Google Scholar]
  27. Rizzo, G.; Laganà, A.S. A review of vitamin B12. In Molecular Nutrition: Vitamins; Patel, V., Ed.; Academic Press: London, UK, 2020; pp. 105–129. ISBN 9780128119075. [Google Scholar]
  28. Wei, C.; Zhou, J.; Huang, X.; Li, M. Effects of psychological stress on serum iron and erythropoiesis. Int. J. Hematol. 2008, 88, 52–56. [Google Scholar] [CrossRef]
  29. Tisadondilok, S.; Senawong, T.; Swatsitang, P.; Rattanasing, A. Antioxidant and antiproliferative activities of ethanolic extracts of Elateriospermum tapos Blume (Euphorbiaceae). J. Med. Plants Res. 2018, 12, 474–482. [Google Scholar] [CrossRef]
  30. Siccama, J.W.; Pegiou, E.; Zhang, L.; Mumm, R.; Hall, R.D.; Boom, R.M.; Schutyser, M.A.I. Maltodextrin improves physical properties and volatile compound retention of spray-dried asparagus concentrate. LWT—Food Sci. Technol. 2021, 142, 111058. [Google Scholar] [CrossRef]
  31. Aril-Dela Cruz, J.V.; Bungihan, M.E.; Dela Cruz, T.E.E.; Sagum, R.S. Canarium ovatum engl. (Pili) exocarp crude extract as functional food colorant incorporated in yogurt developed product. Food Res. 2017, 2, 89–98. [Google Scholar] [CrossRef]
  32. Tontul, İ.; Ergin, F.; Eroğlu, E.; Küçükçetin, A.; Topuz, A. Physical and microbiological properties of yoghurt powder produced by refractance window drying. Int. Dairy J. 2018, 85, 169–176. [Google Scholar] [CrossRef]
  33. Henshall, J.D. Manual of Methods of Analysis of Foods; Food Safety and Standards Authority of India: New Delhi, India, 2012. [Google Scholar]
  34. Witschinski, F.; Demartini, D.; Kilian, J.; Dallago, R.M.; Rosa, C.D.; Cansian, R.L.; Valduga, E.; Steffens, J. Development and characterization of light yoghurt elaborated with Bifidobacterium animalis subsp. Lactis Bb-12 and fructooligosaccharides. Ciência Rural 2018, 48, e20170560. [Google Scholar] [CrossRef]
  35. Čanžek, M.A. Chair of Dairy Science Yogurt & Cheese. 2018. Available online: http://www.ag-lab.org/sites/default/files/pdf/media/2/Yougurt%20and%20cheese%20analysis%20Introduction.pdf (accessed on 4 May 2022).
  36. Chang, S.K.C. Protein Content, 4th ed.; Nielsen, S.S., Ed.; Springer: IN, USA, 2007; ISBN 9780470850947. [Google Scholar]
  37. Nielsen, S.S. (Ed.) Phenol-sulfuric acid method for total carbohydrates. In Food Analysis Laboratory Manual; Springer: Boston, MA, USA, 2009; pp. 47–53. ISBN 978-1-4419-1463-7. [Google Scholar]
  38. National Technical Committee of Malaysian Food Composition Database. Protocol for Sampling and Methods of Analysis for Malaysian Food Composition Database. 2011; pp. 72–74. Available online: http://myagric.upm.edu.my/id/eprint/20340/ (accessed on 4 May 2022).
  39. Vinderola, C.G.; Reinheimer, J.A. Lactic acid starter and probiotic bacteria: A comparative “in vitro” study of probiotic characteristics and biological barrier resistance. Food Res. Int. 2003, 36, 895–904. [Google Scholar] [CrossRef]
  40. Bahari, H.; Abidin, A.Z.; Balan, S.S.; Perumal, K.V.; Rosli, N.S.; Lotafi, A.H.A.; Danabalan, S.; Manimaran, M.; Shafie, N.H.; Abdullah, M.A.; et al. The effects of Elateriospermum tapos against obese maternal rat in mitigating obesity development among their adult female offspring. Pharmacogn. Mag. 2020, 16, 706–712. [Google Scholar] [CrossRef]
Figure 1. Histology section of acute toxicity study. The liver section shows standard strands of hepatocytes (H), sinusoids (S), and central vein (CV). It shows 0% of biopsied hepatocytes affected. The liver grading score was recorded as 0 due to absence of steatosis, lobular inflammation, and hepatocyte ballooning. The heart histological section shows normal heart architecture, and no inflammation was observed. Myocardium (M) and nucleus (N). The kidney histology showed no abnormal lesion or tubular dilation. Renal corpuscle appeared normal. No abnormalities were observed in kidney histology section.
Foods 11 01903 g001
Figure 2. The histology section for subacute studies. The liver section shows standard strands of hepatocytes (H), sinusoids (S), and central vein (CV). It shows 0% of biopsied hepatocytes affected. The liver grading scores were documented as 0 due to absence of steatosis, lobular inflammation, and hepatocyte ballooning. The heart tissue showing normal heart architecture and no inflammation was observed. Myocardium (M) and nucleus (N). Kidney histology showed no lesion or tubular dilation. Renal corpuscle appeared normal. The kidney shows normal architecture of glomerulus (G), glomerulus capsule (GC), distal convoluted tubule (D). No abnormalities observed in the liver, kidney, or heart in subacute toxicity groups.
Foods 11 01903 g002
Figure 3. The histology section of satellite groups. The liver section shows standard strands of hepatocytes (H), sinusoids (S), and central vein (CV). It showed 0% of biopsied hepatocytes affected. The liver grading scores were recorded as 0 due to absence of steatosis, lobular inflammation, and hepatocyte ballooning. The heart tissue shows normal architecture, and no inflammation was seen. Myocardium (M) and nucleus (N). Kidney histology show no lesion nor tubular dilation with a normal structure of renal corpuscle.
Foods 11 01903 g003
Table 1. Nutritional analysis of E. tapos yoghurt.
Nutrition InformationPer 100 g
Energy78 kcal (328 kJ)
Energy/calorie from fat32 kcal
Fat3.6 g
Saturated fat2.8 g
Monounsaturated fat0.6 g
Polyunsaturated fat0.1 g
Carbohydrate8.2 g
Total sugars3.7 g
Total dietary fibre1.2 g
Protein2.6 g
Lactic acid bacteria1.4 × 106 CFU/g
Lactobacillus1.4 × 105 CFU/g
Table 2. Body weight in acute toxicity study. Values expressed as mean ± SEM.
Body Weight
ACAT 2000
Day 0206.92 ± 3.62214.93 ± 3.96
Week 1272.91 ± 11.04272.23 ± 7.28
Week 2286.41 ± 2.80282.49 ± 8.56
Table 3. Food and water intake in acute toxicity study. Values expressed as mean ± SEM.
ACAT 2000
Total food consumption (g)368.90 ± 66.58374.90 ± 26.97
Calorie intake (KJ)4721.92 ± 852.164798.68 ± 345.22
FER (%)23.09 ± 4.3618.24 ± 1.90
Total water intake (mL)641.67 ± 30.87653.33 ± 23.33
Table 4. Relative organ weight of SD female rats in acute toxicity study. Values expressed as mean ± SEM.
OrgansACAT 2000
Relative organ weight (g)
Liver8.71 ± 0.698.57 ± 0.18
Spleen0.64 ± 0.050.54 ± 0.02
Kidney1.76 ± 0.081.71 ± 0.09
RpWAT1.58 ± 0.411.49 ± 0.39
Visceral fat1.27 ± 0.251.18 ± 0.08
Inguinal fat2.34 ± 1.231.90 ± 0.33
Lung2.02 ± 0.041.70 ± 0.26
Heart0.83 ± 0.371.09 ± 0.06
Percentage per body weight (%)
Liver0.03 ± 0.000.03 ± 0.00
Spleen0.00 ± 0.000.00 ± 0.00
Kidney0.54 ± 0.020.54 ± 0.03
RpWAT0.49 ± 0.130.47 ± 0.12
Visceral fat0.39 ± 0.080.37 ± 0.03
Inguinal fat0.72 ± 0.370.60 ± 0.10
Lung0.63 ± 0.020.53 ± 0.09
Heart0.25 ± 0.110.34 ± 0.02
Table 5. Effect of E. tapos yoghurt on haematology parameters in acute toxicity study. Values expressed as mean ± SEM. (*) indicates a significant difference at p < 0.05.
ParametersACAT 2000
Hb (g/dL)13.83 ± 0.7815.27 ± 0.46
RBC (×10−12/L)7.49 ± 0.338.23 ± 0.19
RDW (%)12.87 ± 0.6914.00 ± 0.10
PCV (%)42.67 ± 1.8645.67 ± 1.20
MCV (fL)57.00 ± 0.00 *55.00 ± 0.58 *
MCH (pg)18.33 ± 0.3318.67 ± 0.33
MCHC (g/dL)32.67 ± 0.6733.67 ± 0.33
WBC (×10−9/L)7.87 ± 2.274.17 ± 0.87
Neutrophils (×10−9/L)1.50 ± 0.460.90 ± 0.15
Lymphocytes (×10−9/L)5.77 ± 1.782.90 ± 0.51
Monocytes (×10−9/L)0.40 ± 0.260.23 ± 0.23
Eosinophils (×10−9/L)0.17 ± 0.020.12 ± 0.02
Basophils (×10−9/L)0.00 ± 0.000.00 ± 0.00
Platelet (×10−9/L)1007.00 ± 90.581121.00 ± 245.73
Table 6. Effect of E. tapos 2000 mg/kg yoghurt on blood biochemistry parameters in acute toxicity study. Values expressed as mean ± SEM. (*) indicates a significant difference at p < 0.05.
ParametersACAT 2000
Sodium (mmol/L)139.33 ± 0.33139.67 ± 0.33
Potassium (mmol/L)6.63 ± 0.296.93 ± 0.09
Chloride (mmol/L)107.33 ± 0.33109.33 ± 1.33
Urea (mmol/L)11.03 ± 0.19 *6.60 ± 0.25 *
Creatinine (mmol/L)29.33 ± 2.3332.00 ± 3.06
Total Protein (g/L)65.67 ± 0.6766.67 ± 0.33
Albumin (g/L)37.00 ± 1.00 *41.00 ± 0.58 *
Globulin (g/L)28.67 ± 0.33 *25.67 ± 0.33 *
Albumin–Globulin ratio1.29 ± 0.05 *1.60 ± 0.04 *
ALP (U/L)124.00 ± 5.03 *86.00 ± 1.00 *
AST (U/L)144.33 ± 12.60 *73.00 ± 4.51 *
ALT (U/L)45.33 ± 10.8423.33 ± 2.85
Gama-Glutamyl Transferase (U/L)13.00 ± 0.0013.00 ± 0.00
Table 7. Weekly body weight changes for subacute toxicity study. Values are expressed as mean ± SEM. 1 The group administered with E. tapos yoghurt at various dose daily for 28 days in subacute toxicity study. 2 Satellite group for subacute toxicity study, which was given water vehicle or E. tapos yoghurt at 1000 mg/kg daily for 28 days followed by no treatment for 14 days. (*) indicates a significant difference at p < 0.05.
Groups for Subacute Toxicity 1Satellite Group for Subacute Toxicity 2
Body Weight (g)SCST 250ST 500ST 1000SSCSST 1000
Day 0171.24 ± 4.86171.78 ± 4.44171.93 ± 5.43168.59 ± 6.34155.69 ± 10.08160.40 ± 10.32
Week 1172.40 ± 6.83 *199.70 ± 7.43 *194.93 ± 6.73187.76 ± 4.37155.96 ± 10.91191.55 ± 3.81
Week 2203.43 ± 6.52218.51 ± 9.40214.76 ± 6.49209.53 ± 4.18199.34 ± 8.21214.63 ± 3.22
Week 3218.64 ± 7.70231.42 ± 10.01235.07 ± 6.43227.32 ± 4.87215.32 ± 8.81230.84 ± 5.19
Week 4242.93 ± 3.39251.75 ± 11.01248.42 ± 6.43242.31 ± 6.94237.62 ± 6.02249.60 ± 5.20
Week 5----247.51 ± 5.49260.06 ± 6.47
Week 6----260.99 ± 5.45274.95 ± 7.39
Publisher’s Note: MDPI stays neutral with regard to jurisdictional claims in published maps and institutional affiliations.

