
Imaging Spectroscopy and Machine Learning for Intelligent Determination of Potato and Sweet Potato Quality


Abstract
1. Introduction
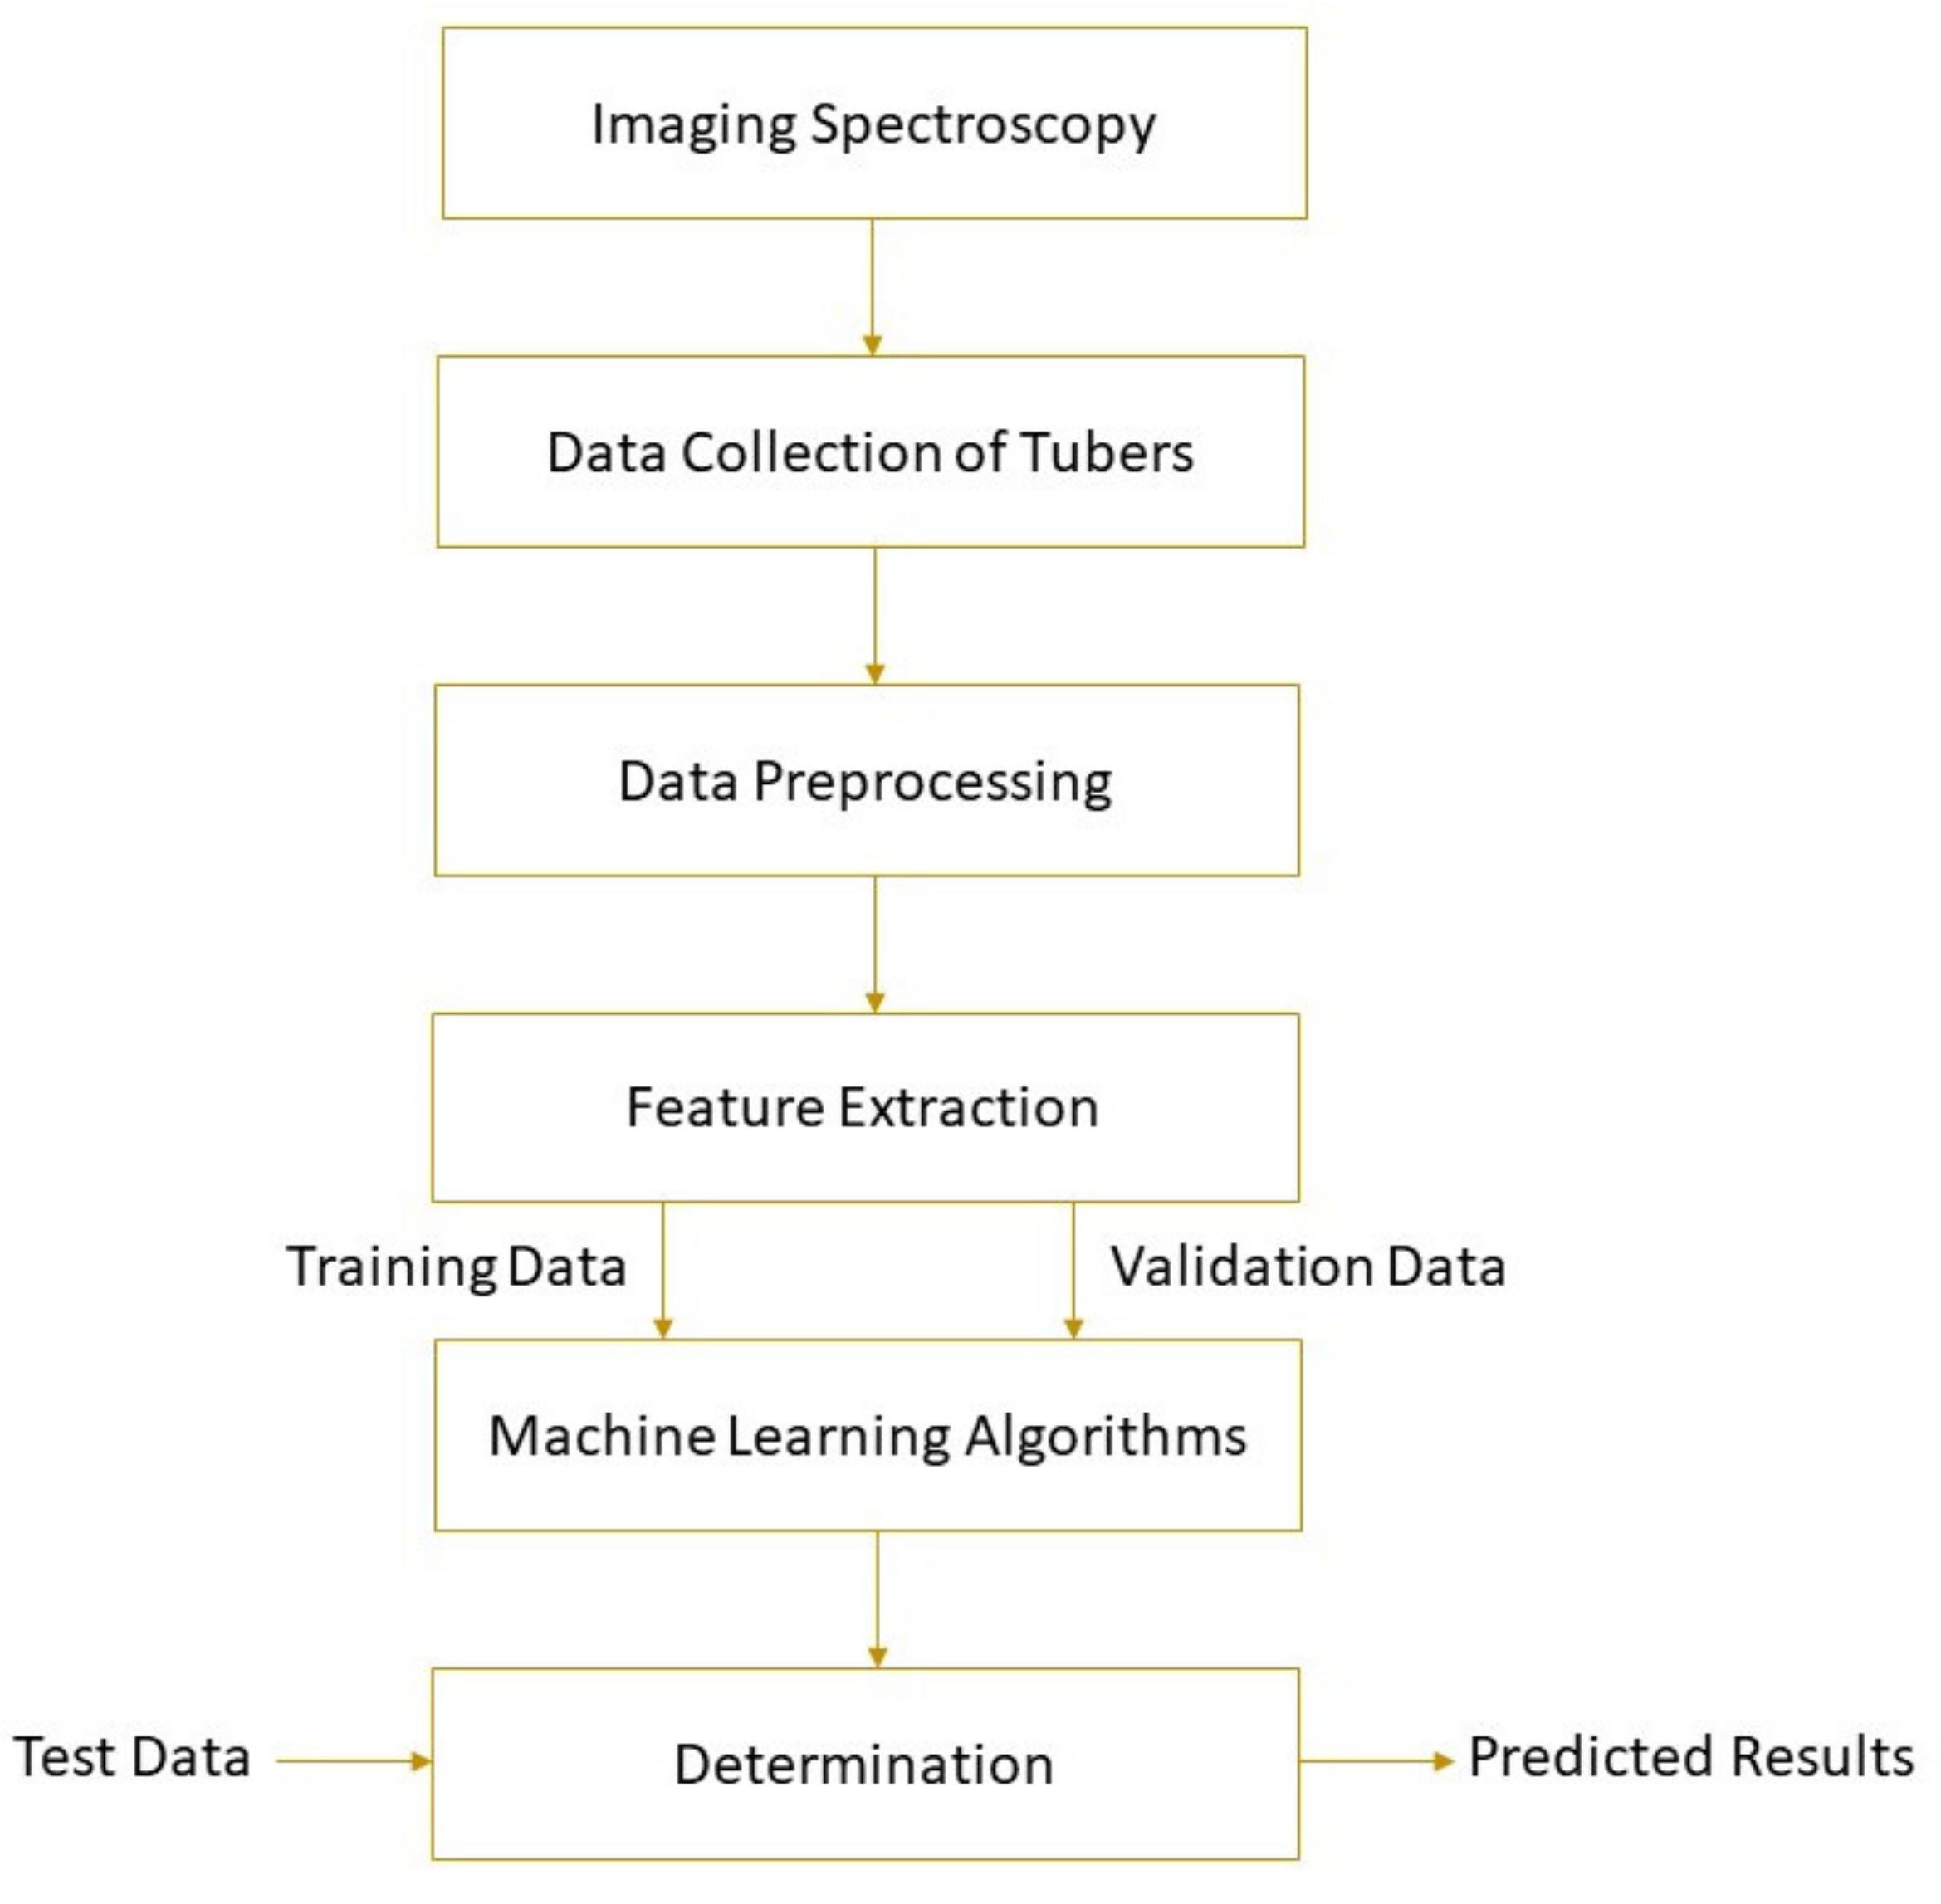
2. Imaging Spectroscopy and Machine Learning
3. Applications for Tuber Quality Assessment
3.1. Physical Properties
3.2. Chemical Components
3.3. Varietal Authentication
3.4. Defect Aspects
4. Challenges and Future Prospects
- (a)
- the robustness of the models against group variability. This can be done by leaving an entire batch or cultivar out and testing if the models still provide good predictions. Other influencing factors with different variabilities, including samples from various batches, harvesting seasons, origins, and milling processes, should be considered;
- (b)
- the robustness of the selected set of wavebands. This can be done by performing the selection for different calibration and validation splits and evaluating if the same combination is always chosen. Additionally, different sources of samples can be used to validate the selected feature variables;
- (c)
- carefully benchmarking the new methods against state-of-the-art ones and evaluating whether the differences in prediction performance are significant.
5. Conclusions
Author Contributions
Funding
Conflicts of Interest
References
- Scott, G.J.; Rosegrant, M.W.; Ringler, C. Roots and Tubers for the 21st Century: Trends, Projections, and Policy Options; International Food Policy Research Institute: Washington, DC, USA, 2000; Volume 31. [Google Scholar]
- Sharma, H.K.; Njintang, N.Y.; Singhal, R.S.; Kaushal, P. Tropical Roots and Tubers: Production, Processing and Technology; John Wiley & Sons: Hoboken, NJ, USA, 2016. [Google Scholar]
- Xue, H.; Li, C.; Wang, L.; Su, W.-H. Spatial price transmission and price dynamics of global butter export market under economic shocks. Sustainability 2021, 13, 9297. [Google Scholar] [CrossRef]
- Sheng, J.; Huang, Q.-Y.; Su, W.-H. Development of a seed treatment technique for automatic identification of soybean plants. Am. Soc. Agric. Biol. Eng. 2021, 1. [Google Scholar] [CrossRef]
- Zhang, J.-J.; Liu, G.-S.; Su, W.-H.; Ren, Y.-C.; Kang, N.-B.; Ma, C. Rapid detection of freshness in tan-lamb mutton based on hyperspectral imaging technology. Spectrosc. Spectr. Anal. 2019, 39, 1909. [Google Scholar]
- Beninca, C.; Colman, T.A.D.; Lacerda, L.G.; da Silva Carvalho Filho, M.A.; Demiate, I.M.; Bannach, G.; Schnitzler, E. Thermal, rheological, and structural behaviors of natural and modified cassava starch granules, with sodium hypochlorite solutions. J. Therm. Anal. Calorim. 2013, 111, 2217–2222. [Google Scholar] [CrossRef]
- Ugwu, F. The potentials of roots and tubers as weaning foods. Pak. J. Nutr. 2009, 8, 1701–1705. [Google Scholar] [CrossRef][Green Version]
- Flores, H.E.; Walker, T.S.; Guimarães, R.L.; Bais, H.P.; Vivanco, J.M. Andean root and tuber crops: Underground rainbows. HortScience 2003, 38, 161–167. [Google Scholar] [CrossRef]
- Bovell-Benjamin, A.C. Sweet potato: A review of its past, present, and future role in human nutrition. Adv. Food Nutr. Res. 2007, 52, 1–59. [Google Scholar]
- Oerke, E.-C. Crop losses to pests. J. Agric. Sci. 2006, 144, 31–43. [Google Scholar] [CrossRef]
- Weurding, R.E.; Veldman, A.; Veen, W.A.; van der Aar, P.J.; Verstegen, M.W. Starch digestion rate in the small intestine of broiler chickens differs among feedstuffs. J. Nutr. 2001, 131, 2329–2335. [Google Scholar] [CrossRef]
- Su, W.-H.; Sun, D.-W. Advanced analysis of roots and tubers by hyperspectral techniques. Adv. Food Nutr. Res. 2019, 87, 255–303. [Google Scholar]
- Soler, C.; Pico, Y. Recent trends in liquid chromatography-tandem mass spectrometry to determine pesticides and their metabolites in food. TrAC Trends Anal. Chem. 2007, 26, 103–115. [Google Scholar] [CrossRef]
- Roessner, U.; Wagner, C.; Kopka, J.; Trethewey, R.N.; Willmitzer, L. Simultaneous analysis of metabolites in potato tuber by gas chromatography–mass spectrometry. Plant J. 2000, 23, 131–142. [Google Scholar] [CrossRef] [PubMed]
- Su, W.-H.; Sun, D.-W.; He, J.-G.; Zhang, L.-B. Variation analysis in spectral indices of volatile chlorpyrifos and non-volatile imidacloprid in jujube (Ziziphus jujuba Mill.) using near-infrared hyperspectral imaging (NIR-HSI) and gas chromatograph-mass spectrometry (GC–MS). Comput. Electron. Agric. 2017, 139, 41–55. [Google Scholar] [CrossRef]
- Asensio, L.; González, I.; García, T.; Martín, R. Determination of food authenticity by enzyme-linked immunosorbent assay (ELISA). Food Control 2008, 19, 1–8. [Google Scholar]
- Petruccioli, E.; Vanini, V.; Chiacchio, T.; Cirillo, D.M.; Palmieri, F.; Ippolito, G.; Goletti, D. Modulation of interferon-gamma response to QuantiFERON-TB-plus detected by enzyme-linked immunosorbent assay in patients with active and latent tuberculosis infection. Int. J. Mycobacteriol. 2016, 5, S143–S144. [Google Scholar] [CrossRef]
- Hansen, C.L.; Thybo, A.K.; Bertram, H.C.; Viereck, N.; van den Berg, F.; Engelsen, S.B. Determination of dry matter content in potato tubers by low-field nuclear magnetic resonance (LF-NMR). J. Agric. Food Chem. 2010, 58, 10300–10304. [Google Scholar] [CrossRef] [PubMed]
- Arkhypova, V.; Dzyadevych, S.; Jaffrezic-Renault, N.; Martelet, C.; Soldatkin, A. Biosensors for assay of glycoalkaloids in potato tubers. Appl. Biochem. Microbiol. 2008, 44, 314–318. [Google Scholar] [CrossRef]
- Pedreschi, F.; Mery, D.; Bunger, A.; Yanez, V. Computer vision classification of potato chips by color. J. Food Process. Eng. 2011, 34, 1714–1728. [Google Scholar]
- Ding, X.; Ni, Y.; Kokot, S. NIR spectroscopy and chemometrics for the discrimination of pure, powdered, purple sweet potatoes and their samples adulterated with the white sweet potato flour. Chemom. Intell. Lab. Syst. 2015, 144, 17–23. [Google Scholar] [CrossRef]
- Biondi, E.; Blasioli, S.; Galeone, A.; Spinelli, F.; Cellini, A.; Lucchese, C.; Braschi, I. Detection of potato brown rot and ring rot by electronic nose: From laboratory to real scale. Talanta 2014, 129, 422–430. [Google Scholar] [CrossRef]
- Su, W.-H.; Sun, D.-W. Potential of hyperspectral imaging for visual authentication of sliced organic potatoes from potato and sweet potato tubers and rapid grading of the tubers according to moisture proportion. Comput. Electron. Agric. 2016, 125, 113–124. [Google Scholar] [CrossRef]
- Sun, D.-W. Computer Vision Technology for Food Quality Evaluation; Academic Press: Cambridge, MA, USA, 2016. [Google Scholar]
- Blanco, C.A.; De la Fuente, R.; Caballero, I.; Rodríguez-Méndez, M.L. Beer discrimination using a portable electronic tongue based on screen-printed electrodes. J. Food Eng. 2015, 157, 57–62. [Google Scholar] [CrossRef]
- Veloso, A.C.; Dias, L.G.; Rodrigues, N.; Pereira, J.A.; Peres, A.M. Sensory intensity assessment of olive oils using an electronic tongue. Talanta 2016, 146, 585–593. [Google Scholar] [CrossRef]
- Zhang, Q.; Saleh, A.S.; Shen, Q. Discrimination of edible vegetable oil adulteration with used frying oil by low field nuclear magnetic resonance. Food Bioprocess Technol. 2013, 6, 2562–2570. [Google Scholar] [CrossRef]
- Su, W.-H. Crop plant signaling for real-time plant identification in smart farm: A systematic review and new concept in artificial intelligence for automated weed control. Artif. Intell. Agric. 2020, 4, 262–271. [Google Scholar]
- Su, W.-H.; Fennimore, S.A.; Slaughter, D.C. Fluorescence imaging for rapid monitoring of translocation behaviour of systemic markers in snap beans for automated crop/weed discrimination. Biosyst. Eng. 2019, 186, 156–167. [Google Scholar] [CrossRef]
- Wu, D.; Sun, D.W. The use of hyperspectral techniques in evaluating quality and safety of meat and meat products. Emerg. Technol. Meat Process Prod. Process. Technol. 2016, 19, 345–374. [Google Scholar]
- Zhu, F.; Zhang, H.; Shao, Y.; He, Y.; Ngadi, M. Mapping of fat and moisture distribution in Atlantic salmon using near-infrared hyperspectral imaging. Food Bioprocess Technol. 2014, 7, 1208–1214. [Google Scholar] [CrossRef]
- Su, W.-H.; Yang, C.; Dong, Y.; Johnson, R.; Page, R.; Szinyei, T.; Hirsch, C.D.; Steffenson, B.J. Hyperspectral imaging and improved feature variable selection for automated determination of deoxynivalenol in various genetic lines of barley kernels for resistance screening. Food Chem. 2021, 343, 128507. [Google Scholar] [CrossRef]
- Su, W.-H. Rapid Assessment of Deoxynivalenol Content in Barley Using Hyperspectral imaging. In 2021 ASABE Annual International Virtual Meeting; American Society of Agricultural and Biological Engineers: St. Joseph, MI, USA, 2021; p. 1. [Google Scholar]
- Su, W.-H. Rapid Softness Prediction and Microbial Spoilage Visualization of Whole Tomatoes by Using Hyper/Multispectral Imaging. Challenges 2021, 12, 21. [Google Scholar] [CrossRef]
- Singh, C.B.; Jayas, D.S.; Paliwal, J.; White, N.D. Identification of insect-damaged wheat kernels using short-wave near-infrared hyperspectral and digital colour imaging. Comput. Electron. Agric. 2010, 73, 118–125. [Google Scholar] [CrossRef]
- Naganathan, G.K.; Grimes, L.M.; Subbiah, J.; Calkins, C.R.; Samal, A.; Meyer, G.E. Visible/near-infrared hyperspectral imaging for beef tenderness prediction. Comput. Electron. Agric. 2008, 64, 225–233. [Google Scholar] [CrossRef]
- Lorente, D.; Aleixos, N.; Gómez-Sanchis, J.; Cubero, S.; García-Navarrete, O.L.; Blasco, J. Recent advances and applications of hyperspectral imaging for fruit and vegetable quality assessment. Food Bioprocess Technol. 2012, 5, 1121–1142. [Google Scholar] [CrossRef]
- Liu, G.; He, J.; Wang, S.; Luo, Y.; Wang, W.; Wu, L.; Si, Z.; He, X. Application of near-infrared hyperspectral imaging for detection of external insect infestations on jujube fruit. Int. J. Food Prop. 2016, 19, 41–52. [Google Scholar] [CrossRef]
- Gómez-Sanchis, J.; Lorente, D.; Soria-Olivas, E.; Aleixos, N.; Cubero, S.; Blasco, J. Development of a hyperspectral computer vision system based on two liquid crystal tuneable filters for fruit inspection. Application to detect citrus fruits decay. Food Bioprocess Technol. 2014, 7, 1047–1056. [Google Scholar] [CrossRef]
- Ravikanth, L.; Jayas, D.S.; White, N.D.; Fields, P.G.; Sun, D.-W. Extraction of spectral information from hyperspectral data and application of hyperspectral imaging for food and agricultural products. Food Bioprocess Technol. 2017, 10, 1–33. [Google Scholar] [CrossRef]
- Su, W.H.; Sun, D.W. Fourier Transform Infrared and Raman and Hyperspectral Imaging Techniques for Quality Determinations of Powdery Foods: A Review. Compr. Rev. Food Sci. Food Saf. 2018, 17, 104–122. [Google Scholar] [CrossRef]
- Su, W.-H.; Sun, D.-W. Facilitated wavelength selection and model development for rapid determination of the purity of organic spelt (Triticum spelta L.) flour using spectral imaging. Talanta 2016, 155, 347–357. [Google Scholar] [CrossRef]
- Cen, H.; Lu, R.; Ariana, D.P.; Mendoza, F. Hyperspectral imaging-based classification and wavebands selection for internal defect detection of pickling cucumbers. Food Bioprocess Technol. 2014, 7, 1689–1700. [Google Scholar] [CrossRef]
- Cheng, J.-H.; Sun, D.-W. Rapid quantification analysis and visualization of Escherichia coli loads in grass carp fish flesh by hyperspectral imaging method. Food Bioprocess Technol. 2015, 8, 951–959. [Google Scholar] [CrossRef]
- Cheng, J.-H.; Sun, D.-W.; Pu, H.; Zeng, X.-A. Comparison of visible and long-wave near-infrared hyperspectral imaging for colour measurement of grass carp (Ctenopharyngodon idella). Food Bioprocess Technol. 2014, 7, 3109–3120. [Google Scholar] [CrossRef]
- Yang, C.; Lee, W.S.; Gader, P. Hyperspectral band selection for detecting different blueberry fruit maturity stages. Comput. Electron. Agric. 2014, 109, 23–31. [Google Scholar] [CrossRef]
- Tao, F.; Peng, Y. A nondestructive method for prediction of total viable count in pork meat by hyperspectral scattering imaging. Food Bioprocess Technol. 2015, 8, 17–30. [Google Scholar] [CrossRef]
- ElMasry, G.M.; Nakauchi, S. Image analysis operations applied to hyperspectral images for non-invasive sensing of food quality—A comprehensive review. Biosyst. Eng. 2016, 142, 53–82. [Google Scholar] [CrossRef]
- Su, W.H.; Sun, D.W. Multispectral imaging for plant food quality analysis and visualization. Compr. Rev. Food Sci. Food Saf. 2018, 17, 220–239. [Google Scholar] [CrossRef] [PubMed]
- Lu, R. Multispectral imaging for predicting firmness and soluble solids content of apple fruit. Postharvest Biol. Technol. 2004, 31, 147–157. [Google Scholar] [CrossRef]
- Su, W.-H.; Bakalis, S.; Sun, D.-W. NIR/MIR Spectroscopy in Tandem with Chemometrics for Rapid Identification and Evaluation of Potato Variety and Doneness Degree. In 2019 ASABE Annual International Meeting; American Society of Agricultural and Biological Engineers: St. Joseph, MI, USA, 2019; p. 1. [Google Scholar]
- Xue, H.; Su, W.-H. Non-Invasive Determination of Potato Breaking Strength by Mid-Infrared Microspectroscopy. Mod. Concepts Dev. Agron. 2019, 5, 525–528. [Google Scholar]
- Su, W.-H.; Arvanitoyannis, I.S.; Sun, D.-W. Trends in food authentication. In Modern Techniques for Food Authentication; Elsevier: Amsterdam, The Netherlands, 2018; pp. 731–758. [Google Scholar]
- Su, W.-H.; Bakalis, S.; Sun, D.-W. Chemometrics in tandem with near infrared (NIR) hyperspectral imaging and Fourier transform mid infrared (FT-MIR) microspectroscopy for variety identification and cooking loss determination of sweet potato. Biosyst. Eng. 2019, 180, 70–86. [Google Scholar] [CrossRef]
- Su, W.-H.; Bakalis, S.; Sun, D.-W. Fourier transform mid-infrared-attenuated total reflectance (FTMIR-ATR) microspectroscopy for determining textural property of microwave baked tuber. J. Food Eng. 2018, 218, 1–13. [Google Scholar] [CrossRef]
- Su, W.-H.; Bakalis, S.; Sun, D.-W. Fingerprinting study of tuber ultimate compressive strength at different microwave drying times using mid-infrared imaging spectroscopy. Dry. Technol. 2019, 37, 1113–1130. [Google Scholar] [CrossRef]
- Su, W.-H. Advanced Machine Learning in Point Spectroscopy, RGB-and hyperspectral-imaging for automatic discriminations of crops and weeds: A review. Smart Cities 2020, 3, 767–792. [Google Scholar] [CrossRef]
- Shahin, M.A.; Symons, S.J. Detection of Fusarium damaged kernels in Canada Western Red Spring wheat using visible/near-infrared hyperspectral imaging and principal component analysis. Comput. Electron. Agric. 2011, 75, 107–112. [Google Scholar] [CrossRef]
- Lorente, D.; Aleixos, N.; Gómez-Sanchis, J.; Cubero, S.; Blasco, J. Selection of optimal wavelength features for decay detection in citrus fruit using the ROC curve and neural networks. Food Bioprocess Technol. 2013, 6, 530–541. [Google Scholar] [CrossRef]
- Pu, H.; Sun, D.-W.; Ma, J.; Liu, D.; Cheng, J.-h. Using wavelet textural features of visible and near infrared hyperspectral image to differentiate between fresh and frozen–thawed pork. Food Bioprocess Technol. 2014, 7, 3088–3099. [Google Scholar] [CrossRef]
- Nashat, S.; Abdullah, A.; Aramvith, S.; Abdullah, M. Support vector machine approach to real-time inspection of biscuits on moving conveyor belt. Comput. Electron. Agric. 2011, 75, 147–158. [Google Scholar] [CrossRef]
- Su, W.-H.; Bakalis, S.; Sun, D.-W. Potato hierarchical clustering and doneness degree determination by near-infrared (NIR) and attenuated total reflectance mid-infrared (ATR-MIR) spectroscopy. J. Food Meas. Charact. 2019, 13, 1218–1231. [Google Scholar] [CrossRef]
- Jarvis, R.M.; Goodacre, R. Genetic algorithm optimization for pre-processing and variable selection of spectroscopic data. Bioinformatics 2004, 21, 860–868. [Google Scholar] [CrossRef]
- Li, H.; Liang, Y.; Xu, Q.; Cao, D. Key wavelengths screening using competitive adaptive reweighted sampling method for multivariate calibration. Anal. Chim. Acta 2009, 648, 77–84. [Google Scholar] [CrossRef]
- He, H.-J.; Wu, D.; Sun, D.-W. Potential of hyperspectral imaging combined with chemometric analysis for assessing and visualising tenderness distribution in raw farmed salmon fillets. J. Food Eng. 2014, 126, 156–164. [Google Scholar] [CrossRef]
- Su, W.-H.; Sun, D.-W. Evaluation of spectral imaging for inspection of adulterants in terms of common wheat flour, cassava flour and corn flour in organic Avatar wheat (Triticum spp.) flour. J. Food Eng. 2017, 200, 59–69. [Google Scholar] [CrossRef]
- Araújo, M.C.U.; Saldanha, T.C.B.; Galvao, R.K.H.; Yoneyama, T.; Chame, H.C.; Visani, V. The successive projections algorithm for variable selection in spectroscopic multicomponent analysis. Chemom. Intell. Lab. Syst. 2001, 57, 65–73. [Google Scholar] [CrossRef]
- Pu, H.; Kamruzzaman, M.; Sun, D.-W. Selection of feature wavelengths for developing multispectral imaging systems for quality, safety and authenticity of muscle foods-a review. Trends Food Sci. Technol. 2015, 45, 86–104. [Google Scholar] [CrossRef]
- Kasampalis, D.S.; Tsouvaltzis, P.; Ntouros, K.; Gertsis, A.; Moshou, D.; Siomos, A.S. Rapid Nondestructive Postharvest Potato Freshness and Cultivar Discrimination Assessment. Appl. Sci. 2021, 11, 2630. [Google Scholar] [CrossRef]
- Yang, Y.; Zhao, X.; Huang, M.; Wang, X.; Zhu, Q. Multispectral image based germination detection of potato by using supervised multiple threshold segmentation model and Canny edge detector. Comput. Electron. Agric. 2021, 182, 106041. [Google Scholar] [CrossRef]
- Rady, A.M.; Guyer, D.E.; Donis-González, I.R.; Kirk, W.; Watson, N.J. A comparison of different optical instruments and machine learning techniques to identify sprouting activity in potatoes during storage. J. Food Meas. Charact. 2020, 14, 3565–3579. [Google Scholar] [CrossRef]
- Žibrat, U.; Gerič Stare, B.; Knapič, M.; Susič, N.; Lapajne, J.; Širca, S. Detection of root-knot nematode meloidogyne luci infestation of potato tubers using hyperspectral remote sensing and real-time PCR molecular methods. Remote Sens. 2021, 13, 1996. [Google Scholar] [CrossRef]
- Garhwal, A.S.; Pullanagari, R.R.; Li, M.; Reis, M.M.; Archer, R. Hyperspectral imaging for identification of Zebra Chip disease in potatoes. Biosyst. Eng. 2020, 197, 306–317. [Google Scholar] [CrossRef]
- Wang, F.; Wang, C.; Song, S.; Xie, S.; Kang, F. Study on starch content detection and visualization of potato based on hyperspectral imaging. Food Sci. Nutr. 2021, 9, 4420–4430. [Google Scholar] [CrossRef] [PubMed]
- Wang, F.; Wang, C.; Song, S. A study of starch content detection and the visualization of fresh-cut potato based on hyperspectral imaging. RSC Adv. 2021, 11, 13636–13643. [Google Scholar] [CrossRef]
- Li, D.; Zhang, F.; Yu, J.; Chen, X.; Liu, B.; Meng, X. A rapid and non-destructive detection of Escherichia coli on the surface of fresh-cut potato slices and application using hyperspectral imaging. Postharvest Biol. Technol. 2021, 171, 111352. [Google Scholar] [CrossRef]
- Xiao, Q.; Bai, X.; He, Y. Rapid screen of the color and water content of fresh-cut potato tuber slices using hyperspectral imaging coupled with multivariate analysis. Foods 2020, 9, 94. [Google Scholar] [CrossRef]
- Tian, X.Y.; Aheto, J.H.; Bai, J.W.; Dai, C.; Ren, Y.; Chang, X. Quantitative analysis and visualization of moisture and anthocyanins content in purple sweet potato by Vis–NIR hyperspectral imaging. J. Food Process. Preserv. 2021, 45, e15128. [Google Scholar] [CrossRef]
- Heo, S.; Choi, J.-Y.; Kim, J.; Moon, K.-D. Prediction of moisture content in steamed and dried purple sweet potato using hyperspectral imaging analysis. Food Sci. Biotechnol. 2021, 9, 1–9. [Google Scholar]
- Shao, Y.; Liu, Y.; Xuan, G.; Wang, Y.; Gao, Z.; Hu, Z.; Han, X.; Gao, C.; Wang, K. Application of hyperspectral imaging for spatial prediction of soluble solid content in sweet potato. RSC Adv. 2020, 10, 33148–33154. [Google Scholar] [CrossRef]
- Bai, X.; Xiao, Q.; Zhou, L.; Tang, Y.; He, Y. Detection of sulfite dioxide residue on the surface of fresh-cut potato slices using near-infrared hyperspectral imaging system and portable near-infrared spectrometer. Molecules 2020, 25, 1651. [Google Scholar] [CrossRef] [PubMed]
- Rady, A.M.; Guyer, D.E.; Watson, N.J. Near-infrared spectroscopy and hyperspectral imaging for sugar content evaluation in potatoes over multiple growing seasons. Food Anal. Methods 2021, 14, 581–595. [Google Scholar] [CrossRef]
- Zhang, W.; Zhu, Q.; Huang, M.; Guo, Y.; Qin, J. Detection and classification of potato defects using multispectral imaging system based on single shot method. Food Anal. Methods 2019, 12, 2920–2929. [Google Scholar] [CrossRef]
- Ye, D.; Sun, L.; Tan, W.; Che, W.; Yang, M. Detecting and classifying minor bruised potato based on hyperspectral imaging. Chemom. Intell. Lab. Syst. 2018, 177, 129–139. [Google Scholar] [CrossRef]
- Amjad, W.; Crichton, S.O.; Munir, A.; Hensel, O.; Sturm, B. Hyperspectral imaging for the determination of potato slice moisture content and chromaticity during the convective hot air drying process. Biosyst. Eng. 2018, 166, 170–183. [Google Scholar] [CrossRef]
- Su, W.-H.; Sun, D.-W. Chemical imaging for measuring the time series variations of tuber dry matter and starch concentration. Comput. Electron. Agric. 2017, 140, 361–373. [Google Scholar] [CrossRef]
- Liu, Y.; Sun, Y.; Xie, A.; Yu, H.; Yin, Y.; Li, X.; Duan, X. Potential of hyperspectral imaging for rapid prediction of anthocyanin content of purple-fleshed sweet potato slices during drying process. Food Anal. Methods 2017, 10, 1–11. [Google Scholar] [CrossRef]
- Ye, D.; Sun, L.; Yang, Z.; Che, W.; Tan, W. Determination of bruised potatoes by GLCM based on hyperspectral imaging technique. In Proceedings of the 2017 International Conference on Service Systems and Service Management (ICSSSM), Dalian, China, 16–18 June 2017; pp. 1–6. [Google Scholar]
- Sun, Y.; Liu, Y.; Yu, H.; Xie, A.; Li, X.; Yin, Y.; Duan, X. Non-destructive prediction of moisture content and freezable water content of purple-fleshed sweet potato slices during drying process using hyperspectral imaging technique. Food Anal. Methods 2017, 10, 1535–1546. [Google Scholar] [CrossRef]
- Su, W.-H.; Sun, D.-W. Hyperspectral imaging as non-destructive assessment tool for the recognition of sweet potato cultivars. Biosyst. Eng. Res. Rev. 2017, 22, 21. [Google Scholar]
- Moscetti, R.; Sturm, B.; Crichton, S.O.; Amjad, W.; Massantini, R. Postharvest monitoring of organic potato (cv. Anuschka) during hot-air drying using visible–NIR hyperspectral imaging. J. Sci. Food Agric. 2017, 98, 2507–2517. [Google Scholar] [CrossRef] [PubMed]
- Su, W.-H.; Sun, D.-W. Multivariate analysis of hyper/multi-spectra for determining volatile compounds and visualizing cooking degree during low-temperature baking of tubers. Comput. Electron. Agric. 2016, 127, 561–571. [Google Scholar] [CrossRef]
- Su, W.-H.; Sun, D.-W. Comparative assessment of feature-wavelength eligibility for measurement of water binding capacity and specific gravity of tuber using diverse spectral indices stemmed from hyperspectral images. Comput. Electron. Agric. 2016, 130, 69–82. [Google Scholar] [CrossRef]
- Su, W.-H.; Sun, D.-W. Rapid visualization of moisture migration in tuber during dehydration using hyperspectral imaging. In Proceedings of the CIGR-AgEng Conference, Aarhus, Denmark, 26–29 June 2016; pp. 1–8. [Google Scholar]
- López-Maestresalas, A.; Keresztes, J.C.; Goodarzi, M.; Arazuri, S.; Jarén, C.; Saeys, W. Non-destructive detection of blackspot in potatoes by Vis-NIR and SWIR hyperspectral imaging. Food Control 2016, 70, 229–241. [Google Scholar] [CrossRef]
- Kjær, A.; Nielsen, G.; Stærke, S.; Clausen, M.R.; Edelenbos, M.; Jørgensen, B. Prediction of starch, soluble sugars and amino acids in potatoes (Solanum tuberosum L.) using hyperspectral imaging, dielectric and LF-NMR methodologies. Potato Res. 2016, 59, 357–374. [Google Scholar] [CrossRef]
- Rady, A.M.; Guyer, D.E.; Kirk, W.; Donis-González, I.R. The potential use of visible/near infrared spectroscopy and hyperspectral imaging to predict processing-related constituents of potatoes. J. Food Eng. 2014, 135, 11–25. [Google Scholar] [CrossRef]
- Groinig, M.; Burgstaller, M.; Pail, M. Industrial application of a new camera system based on hyperspectral imaging for inline quality control of potatoes. In Proceedings of the OAGM, FH Upper Austria, Wels Campus, Vienna, 11–13 May 2011; pp. 1–8. [Google Scholar]
- Do Trong, N.N.; Tsuta, M.; Nicolaï, B.; De Baerdemaeker, J.; Saeys, W. Prediction of optimal cooking time for boiled potatoes by hyperspectral imaging. J. Food Eng. 2011, 105, 617–624. [Google Scholar] [CrossRef]
- Dacal-Nieto, A.; Formella, A.; Carrión, P.; Vazquez-Fernandez, E.; Fernández-Delgado, M. Common scab detection on potatoes using an infrared hyperspectral imaging system. In International Conference on Image Analysis and Processing; Springer: Berlin/Heidelberg, Germany, 2011; pp. 303–312. [Google Scholar]
- Dacal-Nieto, A.; Formella, A.; Carrión, P.; Vazquez-Fernandez, E.; Fernández-Delgado, M. Non–destructive Detection of Hollow Heart in Potatoes Using Hyperspectral Imaging. In Computer Analysis of Images and Patterns; Springer: Berlin/Heidelberg, Germany, 2011; pp. 180–187. [Google Scholar]
- Areekij, S.; Ritthiruangdej, P.; Kasemsumran, S.; Therdthai, N.; Haruthaithanasan, V.; Ozaki, Y. Rapid and nondestructive analysis of deep-fried taro chip qualities using near infrared spectroscopy. J. Near Infrared Spectrosc. 2017, 25, 127–137. [Google Scholar] [CrossRef]
- Gordon, H.R.; Morel, A.Y. Remote Assessment of Ocean Color for Interpretation of Satellite Visible Imagery: A review; Springer Science & Business Media: Berlin/Heidelberg, Germany, 2012; Volume 4. [Google Scholar]
- Clydesdale, F.M. Color as a factor in food choice. Crit. Rev. Food Sci. Nutr. 1993, 33, 83–101. [Google Scholar] [CrossRef]
- Francis, F. Quality as influenced by color. Food Qual. Prefer. 1995, 6, 149–155. [Google Scholar] [CrossRef]
- Szczesniak, A.S. Texture is a sensory property. Food Qual. Prefer. 2002, 13, 215–225. [Google Scholar] [CrossRef]
- Kilcast, D.; Clegg, S. Sensory perception of creaminess and its relationship with food structure. Food Qual. Prefer. 2002, 13, 609–623. [Google Scholar] [CrossRef]
- Davies, H.; Dixon, N. Evaluation of potato texture by taste and by appearance. Am. J. Potato Res. 1976, 53, 205–210. [Google Scholar] [CrossRef]
- Stark, J.; Love, S. Potato Production Systems; Springer: Berlin/Heidelberg, Germany, 2003. [Google Scholar]
- Motes, J.; Greig, J. Specific gravity, potato chip color and tuber mineral content as affected by soil moisture and harvest dates. Am. Potato J. 1970, 47, 413. [Google Scholar] [CrossRef]
- Robertson, J.A.; de Monredon, F.D.; Dysseler, P.; Guillon, F.; Amado, R.; Thibault, J.-F. Hydration properties of dietary fibre and resistant starch: A European collaborative study. LWT-Food Sci. Technol. 2000, 33, 72–79. [Google Scholar] [CrossRef]
- Chen, J.; Piva, M.; Labuza, T. Evaluation of water binding capacity (WBC) of food fiber sources. J. Food Sci. 1984, 49, 59–63. [Google Scholar] [CrossRef]
- M’Hallah, R.; Aboukhamseen, S. Cross-calibration of categorical variables: An evaluation of the genetic algorithm approach. Appl. Soft Comput. 2018, 74, 154–166. [Google Scholar] [CrossRef]
- Frey, L.; Masarotto, L.; Armand, M.; Charles, M.-L.; Lartigue, O. Multispectral interference filter arrays with compensation of angular dependence or extended spectral range. Opt. Express 2015, 23, 11799–11812. [Google Scholar] [CrossRef] [PubMed]
- Magwaza, L.S.; Naidoo, S.I.M.; Laurie, S.M.; Laing, M.D.; Shimelis, H. Development of NIRS models for rapid quantification of protein content in sweetpotato [Ipomoea batatas (L.) LAM.]. LWT-Food Sci. Technol. 2016, 72, 63–70. [Google Scholar] [CrossRef]
- Bernhard, T.; Truberg, B.; Friedt, W.; Snowdon, R.; Wittkop, B. Development of near-infrared reflection spectroscopy calibrations for crude protein and dry matter content in fresh and dried potato tuber samples. Potato Res. 2016, 59, 149–165. [Google Scholar] [CrossRef]
- Bally, I.S.; Johnson, P.; Kulkarni, V. Mango production in Australia. In VI International Symposium on Mango 509; ISHS: Bangkok, Thailand, 1999; pp. 59–68. [Google Scholar]
- Burdon, J.; McLeod, D.; Lallu, N.; Gamble, J.; Petley, M.; Gunson, A. Consumer evaluation of “Hayward” kiwifruit of different at-harvest dry matter contents. Postharvest Biol. Technol. 2004, 34, 245–255. [Google Scholar] [CrossRef]
- Harker, F.; Carr, B.; Lenjo, M.; MacRae, E.; Wismer, W.; Marsh, K.; Williams, M.; White, A.; Lund, C.; Walker, S. Consumer liking for kiwifruit flavour: A meta-analysis of five studies on fruit quality. Food Qual. Prefer. 2009, 20, 30–41. [Google Scholar] [CrossRef]
- Gamble, J.; Harker, F.R.; Jaeger, S.R.; White, A.; Bava, C.; Beresford, M.; Stubbings, B.; Wohlers, M.; Hofman, P.J.; Marques, R. The impact of dry matter, ripeness and internal defects on consumer perceptions of avocado quality and intentions to purchase. Postharvest Biol. Technol. 2010, 57, 35–43. [Google Scholar] [CrossRef]
- Palmer, J.W.; Harker, F.R.; Tustin, D.S.; Johnston, J. Fruit dry matter concentration: A new quality metric for apples. J. Sci. Food Agric. 2010, 90, 2586–2594. [Google Scholar] [CrossRef]
- Ikeogu, U.N.; Davrieux, F.; Dufour, D.; Ceballos, H.; Egesi, C.N.; Jannink, J.-L. Rapid analyses of dry matter content and carotenoids in fresh cassava roots using a portable visible and near infrared spectrometer (Vis/NIRS). PLoS ONE 2017, 12, e0188918. [Google Scholar]
- Coppin, A.; Varre, J.-S.; Lienard, L.; Dauvillee, D.; Guerardel, Y.; Soyer-Gobillard, M.-O.; Buleon, A.; Ball, S.; Tomavo, S. Evolution of plant-like crystalline storage polysaccharide in the protozoan parasite Toxoplasma gondii argues for a red alga ancestry. J. Mol. Evol. 2005, 60, 257–267. [Google Scholar] [CrossRef]
- Su, W.-H.; Sun, D.-W. Rapid determination of starch content of potato and sweet potato by using NIR hyperspectral imaging. Hortscience 2019, 54, S38. [Google Scholar]
- Diaz, J.T.; Veal, M.W.; Chinn, M.S. Development of NIRS models to predict composition of enzymatically processed sweetpotato. Ind. Crop. Prod. 2014, 59, 119–124. [Google Scholar] [CrossRef]
- Haase, N.U. Prediction of potato processing quality by near infrared reflectance spectroscopy of ground raw tubers. J. Near Infrared Spectrosc. 2011, 19, 37–45. [Google Scholar] [CrossRef]
- Wilson, A.; Work, T.; Bushway, A.; Bushway, R. HPLC determination of fructose, glucose, and sucrose in potatoes. J. Food Sci. 1981, 46, 300–301. [Google Scholar] [CrossRef]
- Xie, L.; Ye, X.; Liu, D.; Ying, Y. Quantification of glucose, fructose and sucrose in bayberry juice by NIR and PLS. Food Chem. 2009, 114, 1135–1140. [Google Scholar] [CrossRef]
- Rady, A.; Guyer, D.; Lu, R. Evaluation of sugar content of potatoes using hyperspectral imaging. Food Bioprocess Technol. 2015, 8, 995–1010. [Google Scholar] [CrossRef]
- Su, W.-H.; He, H.-J.; Sun, D.-W. Application of hyperspectral imaging technique for measurement of external defects of potatoes. Biosyst. Eng. Res. Rev. 2015, 20, 9. [Google Scholar]
- Su, W.; Liu, G.; He, J.; Wang, S.; He, X.; Wang, W.; Wu, L. Detection of external defects on potatoes by hyperspectral imaging technology and image processing method. J. Zhejiang Univ. Agric. Life Sci. 2014, 40, 188–196. [Google Scholar]
- Huang, T.; Jin, R.; Ku, J. Non-destructive detection research for hollow heart of potato based on semi-transmission hyperspectral imaging and SVM. Spectrosc. Spectr. Anal. 2015, 35, 198–202. [Google Scholar]
- Su, W.-H.; Zhang, J.; Yang, C.; Page, R.; Szinyei, T.; Hirsch, C.D.; Steffenson, B.J. Evaluation of mask RCNN for learning to detect fusarium head blight in wheat images. In 2020 ASABE Annual International Virtual Meeting; American Society of Agricultural and Biological Engineers: St. Joseph, MI, USA, 2020; p. 1. [Google Scholar]
- Liu, Y.; Pu, H.; Sun, D.-W. Efficient extraction of deep image features using convolutional neural network (CNN) for applications in detecting and analysing complex food matrices. Trends Food Sci. Technol. 2021, 113, 193–204. [Google Scholar] [CrossRef]
- Su, W.-H.; Zhang, J.; Yang, C.; Page, R.; Szinyei, T.; Hirsch, C.D.; Steffenson, B.J. Automatic evaluation of wheat resistance to fusarium head blight using dual mask-RCNN deep learning frameworks in computer vision. Remote Sens. 2021, 13, 26. [Google Scholar] [CrossRef]


| Quality Parameter | Sample Type | Spectral Region | Optimal Model | Accuracy | Reference |
|---|---|---|---|---|---|
| Freshness, Cultivar | Potato | Vis-NIR | PLSR | 0.98 for freshness, 93% for cultivar discrimination | [69] |
| Sprout | Potato | Vis-NIR | SMTSM | 89.28% | [70] |
| Sprouting activity | Potato | Vis-NIR | KNN, PLSDA | 90% | [71] |
| Root-knot nematodes | Potato | Vis-NIR | PLS-SVM | 100% | [72] |
| Zebra chip disease | Potato | Vis-NIR | PLSDA | 92% | [73] |
| Starch | Potato | Vis-NIR | SVR | RP = 0.93 | [74] |
| Starch | Potato | Vis-NIR | PLSR | RP = 0.94 | [75] |
| Escherichia coli | Potato | Vis-NIR | BPNN | 97.60% | [76] |
| Color, moisture content | Potato | Vis-NIR | LSSVM | R2P = 0.84 for color, R2P = 0.77 for moisture content | [77] |
| TA, moisture content | Sweet potato | Vis-NIR | PLSR | R2P = 0.87 for TA, R2P = 0.86 for moisture content | [78] |
| Moisture content | Sweet potato | NIR | PLSR | R2P = 0.95 | [79] |
| SSC | Sweet potato | Vis-NIR | SVR | R2P = 0.86 | [80] |
| Sulfite dioxide residue | Potato | NIR | SVM | 95% | [81] |
| Glucose, sucrose | Potato | Vis-NIR | PLSR | RP = 0.90 glucose, RP = 0.82 for sucrose | [82] |
| Defects | Potato | Vis-NIR | LSSVM | 90.70% | [83] |
| Bruise | Potato | Vis-NIR | SVM | 100% | [84] |
| Hardness, resilience, springiness, cohesiveness, gumminess, chewiness | Potato, sweet potato | MIR | LWPLSR | RP = 0.80, 0.88, 0.58, 0.57, 0.73 and 0.69 for hardness, resilience, springiness, cohesiveness, gumminess and chewiness | [55] |
| Moisture content | Potato | Vis-NIR | PLSR | R2P = 0.98 for moisture content | [85] |
| Dry matter, starch | Potato, sweet potato | NIR | MLR, PLSR | R2P = 0.96 for dry matter, RP2 = 0.96 for starch | [86] |
| Anthocyanin | Sweet potato | Vis-NIR | MLR | R2P = 0.87 | [87] |
| Bruise | Potato | Vis-NIR | GLCM | 93.75% | [88] |
| Moisture content, FWC | Sweet potato | Vis-NIR | MLR | R2P = 0.98 for moisture content, R2P = 0.93 for FWC | [89] |
| Cultivar | Sweet potato | NIR | PLSDA | 100% | [90] |
| Moisture content, color | Potato | Vis-NIR | PLSR | R2P = 0.99 for moisture content, R2P = 0.99 for colour | [91] |
| VTC, TCD | Potato, sweet potato | NIR | TBPANN | R2P = 0.97 for VTC, R2P = 0.98 for TCD | [92] |
| Variety | Potato, sweet potato | NIR | PLSDA | ≥91.60% | [23] |
| WBC, SG | Potato, sweet potato | NIR | LWPCR | R2P = 0.97 for WBC, R2P = 0.98 for SG | [93] |
| Moisture content | Potato, sweet potato | NIR | PLSR | R2P = 0.94 | [94] |
| Blackspot | Potato | Vis-NIR | PLSDA | 98.56% | [95] |
| Starch, glucose, asparagine | Potato | Vis-NIR | PLSR | R2P = 0.70 for starch, R2P = 0.51 for glucose, R2P = 0.70 for asparagine | [96] |
| Leaf counts, glucose, sucrose, soluble solids, specific gravity | Potato | Vis-NIR | PLSR | RP = 0.95 for leaf counts, RP = 0.95 for glucose, RP = 0.55 for soluble solids, RP = 0.95 for sucrose, RP = 0.61 for specific gravity | [97] |
| Sugar-end | Potato | NIR | PLSDA | 91.70% | [98] |
| Cooking time | Potato | Vis-NIR | PLSDA | R2P = 0.96 | [99] |
| Scab | Potato | NIR | SVM | 97.10% | [100] |
| Hollow heart | Potato | NIR | SVM | 89.10% | [101] |
| Moisture, fat content, color properties, maximum force | Taro chip | NIR | PLSR | R2P = 0.85–0.97 | [102] |
Publisher’s Note: MDPI stays neutral with regard to jurisdictional claims in published maps and institutional affiliations. |
© 2021 by the authors. Licensee MDPI, Basel, Switzerland. This article is an open access article distributed under the terms and conditions of the Creative Commons Attribution (CC BY) license (https://creativecommons.org/licenses/by/4.0/).
Share and Cite
Su, W.-H.; Xue, H. Imaging Spectroscopy and Machine Learning for Intelligent Determination of Potato and Sweet Potato Quality. Foods 2021, 10, 2146. https://doi.org/10.3390/foods10092146
Su W-H, Xue H. Imaging Spectroscopy and Machine Learning for Intelligent Determination of Potato and Sweet Potato Quality. Foods. 2021; 10(9):2146. https://doi.org/10.3390/foods10092146
Chicago/Turabian StyleSu, Wen-Hao, and Huidan Xue. 2021. "Imaging Spectroscopy and Machine Learning for Intelligent Determination of Potato and Sweet Potato Quality" Foods 10, no. 9: 2146. https://doi.org/10.3390/foods10092146
APA StyleSu, W.-H., & Xue, H. (2021). Imaging Spectroscopy and Machine Learning for Intelligent Determination of Potato and Sweet Potato Quality. Foods, 10(9), 2146. https://doi.org/10.3390/foods10092146