
Determination of Acrylamide in Selected Foods from the Romanian Market


 ,
,
Abstract
:1. Introduction
2. Materials and Methods
2.1. Chemicals and Reagents
2.2. Calibration Solutions Preparation
2.3. Samples Preparation
- Samples Preparation from bakery products and potato products
- Samples Preparation from ground roasted coffee
2.4. Method Validation
2.5. Limit of Detection (LOD), Limit of Quantification (LOQ)
2.6. Linearity and Calibration Curve
2.7. Specificity
2.8. Precision
2.9. Accuracy
2.10. Acrylamide Analyses by LC-MS/MS
3. Results and Discussion
3.1. Acrylamide Content in Arabica Ground Roasted Coffee and the Exposure through One Cup of Coffee
3.2. Acrylamide Content in White Bread and the Exposure through One Serving
3.3. Acrylamide Content in Pretzesl and the Exposure through One Serving
3.4. Acrylamide Content in Potato Chips and the Exposure through One Serving
4. Conclusions
Author Contributions
Funding
Institutional Review Board Statement
Informed Consent Statement
Data Availability Statement
Conflicts of Interest
References
- Zyzak, D.V.; Sanders, R.A.; Stojanovic, M.; Tallmadge, D.H.; Eberhart, B.L.; Ewald, D.K.; Rizzi, G.P. Acrylamide formation mechanism in heated foods. J. Agric. Food Chem. 2003, 51, 4782–4787. [Google Scholar] [CrossRef]
- Moskowitz, H.R.; Saguy, I.S.; Straus, T. An Integrated Approach to New Food Product Development; CRC Press: Boca Raton, FL, USA, 2009; ISBN 9781420065534. [Google Scholar]
- Morales, F.J.; Martin, S.; Açar, Ö.Ç.; Arribas-Lorenzo, G.; Gökmen, V. Antioxidant activity of cookies and its relationship with heat-processing contaminants: A risk/benefit approach. Eur. Food Res. Technol. 2009, 228, 345. [Google Scholar] [CrossRef]
- Dell’Aquila, C.; Ames, J.M.; Gibson, G.R.; Wynne, A.G. Microbial degradation of heated gluten-glucose systems. Implications for gut health. Melanoidins Food Health 2003, 4, 177–179. [Google Scholar]
- EFSA. Scientific opinion on acrylamide in food. EFSA J. 2015, 13, 4104. [Google Scholar] [CrossRef] [Green Version]
- Virk-Baker, M.K.; Nagy, T.R.; Barnes, S.; Groopman, J. Dietary acrylamide and human cancer: A systematic review of literature. Nutr. Cancer 2014, 66, 774–790. [Google Scholar] [CrossRef] [Green Version]
- Thonning Olesen, P.; Olsen, A.; Frandsen, H.; Frederiksen, K.; Overvad, K.; Tjønneland, A. Acrylamide exposure and incidence of breast cancer among postmenopausal women in the Danish diet, cancer and health study. Int. J. Cancer 2008, 122, 2094–2100. [Google Scholar] [CrossRef]
- Dybing, E.; Farmer, P.B.; Andersen, M.; Fennel, T.R.; Lalljie, S.P.; Muller, D.J.; Olin, S.; Petersen, B.J.; Schlatter, J.; Scholz, G.; et al. Human exposure and internal dose assessment of acrylamide in food. Food Chem. Toxicol. 2005, 43, 365–410. [Google Scholar] [CrossRef]
- Normandin, L.; Bouchard, M.; Ayotte, P.; Blanchet, C.; Becalski, A.; Bonvalot, Y.; Phaneuf, D.; Lapointe, C.; Gagné, M.; Courteau, M. Dietary exposure to acrylamide in adolescents from a Canadian urban center. Food Chem. Toxicol. 2013, 57, 75–83. [Google Scholar] [CrossRef]
- Chen, Y.-H.; Xia, E.-Q.; Xu, X.-R.; Ling, W.-H.; Li, S.; Wu, S.; Deng, G.-F.; Zou, Z.-F.; Zhou, J.; Li, H.-B. Evaluation of acrylamide in food from China by a LC/MS/MS Method. Int. J. Environ. Res. Public Health 2012, 9, 4150–4158. [Google Scholar] [CrossRef] [Green Version]
- Tareke, E.; Rydberg, P.; Karlsson, P.; Eriksson, S.; Törnqvist, M. Analysis of acrylamide, a carcinogen formed in heated foodstuffs. J. Agric. Food Chem. 2002, 50, 4998–5006. [Google Scholar] [CrossRef] [PubMed]
- IARC. IARC monographs on the evaluation of carcinogen risk to humans: Some industrial chemicals. Int. Agency Res. Cancer 1994, 60, 389–433. [Google Scholar]
- American Cancer Society. What Is Acrylamide. Available online: https://www.cancer.org/cancer/cancer-causes/acrylamide.html (accessed on 1 February 2021).
- EC (European Commission). Acrylamide Database. Available online: https://ec.europa.eu/food/safety/chemical_safety/contaminants/catalogue/acrylamide_db_en (accessed on 2 March 2021).
- EC (European Commission). Commission Regulation of 20 November 2017 on Establishing Mitigation Measures and Benchmark Levels for the Reduction of the Presence of Acrylamide in Food. 2018. Available online: http://eur-lex.europa.eu/eli/reco/2017/2158/oj (accessed on 21 October 2020).
- EFSA (European Food Safety Authority). Draft Scientific Opinion on Acrylamide in Food. 2014. Available online: http://www.efsa.europa.eu/en/consultations/call/140701.pdf (accessed on 14 October 2020).
- Roach, J.A.G.; Andrzejewski, D.; Gay, M.L.; Nortrup, D.; Musser, S.M. Rugged LC/MS/MS survey analysis foracrylamide in foods. J. Agric. Food Chem. 2003, 51, 7547–7554. [Google Scholar] [CrossRef]
- Acrylamide Toolbox. 2019. Available online: https://www.fooddrinkeurope.eu/wp-content/uploads/2021/05/FoodDrinkEurope_Acrylamide_Toolbox_2019.pdf (accessed on 23 August 2021).
- Regulation UE 2158/2017. Available online: https://eur-lex.europa.eu/legal-content/RO/TXT/?uri=CELEX%3A32017R2158 (accessed on 20 October 2020).
- Andrzejewski, D.; Roach, J.A.G.; Gay, M.L.; Musser, S.M. Analysis of coffee for the presence of acrylamide by LC-MS/MS. J. Agric. Food Chem. 2004, 52, 1996–2002. [Google Scholar] [CrossRef]
- Abt, E.; Robin, L.P.; McGrath, S.; Srinivasan, J.; DiNovi, M.; Adachi, Y.; Chirtel, S. Acrylamide levels and dietary exposure from foods in the United States, an update 424 based on 2011–2015 data. Food Addit. Contam. Part A 2019, 36, 1475–1490. [Google Scholar] [CrossRef]
- Mesias, M.; Morales, F.J. Acrylamide in coffee: Estimation of exposure from vending machines. J. Food Compos. Anal. 2016, 48, 8–12. [Google Scholar] [CrossRef] [Green Version]
- FSA SC (European Food Safety Authority Scientific Committee). Guidance on selected default values to be used by the EFSA scientific committee, scientific panels and units in the absence of actual measured data. EFSA J. 2012, 10, 2579. [Google Scholar]
- Arisseto, A.P.; Toledo, M.C.F. Preliminary estimate of acrylamide intake in Brazil. Braz. J. Toxicol. 2008, 21, 9–14. [Google Scholar]
- Scientific Opinion on Acrylamide in Food. Available online: https://efsa.onlinelibrary.wiley.com/doi/epdf/10.2903/j.efsa.2015.4104 (accessed on 4 December 2020).
- Andačić, I.M.; Tot, A.; Ivešić, M.; Krivohlavek, A.; Thirumdas, R.; Barba, F.J.; Sabolović, M.B.; Kljusurić, J.G.; Brnčić, S.R. Exposure of the Croatian adult population to acrylamide through bread and bakery products. Food Chem. 2020, 322, 126771. [Google Scholar] [CrossRef]
- Kliemann, N.; Kraemer, M.; Scapin, T.; Rodrigues, V.; Fernandes, A.; Bernardo, G.; Proença, R. Serving size and nutrition labelling: Implications for nutrition information and nutrition claims on packaged foods. Nutrients 2018, 10, 891. [Google Scholar] [CrossRef] [PubMed] [Green Version]
- The EFSA Comprehensive European Food Consumption Database. Available online: https://data.europa.eu/euodp/ro/data/dataset/the-efsa-comprehensive-european-food-consumption-database/resource/0f73e423-b95a-408b-8e5b-a15de4fc97cf (accessed on 15 October 2020).
- Pugajeva, I.; Zumbure, L.; Melngaile, A.; Bartkevics, V. Determination of acrylamide levels in selected foods in Latvia and assessment of the population intake. In Proceedings of the 9th Baltic Conference on Food Science and Technology “Food for Consumer Well-Being” (FOODBALT 2014), Jelgava, Latvia, 8–9 May 2014. [Google Scholar]
- Cieślik, I.; Cieslik, E.; Topolska, K.; Surma, M. Dietary acrylamide exposure from traditional food products in Leser Poland and associated risk assessment. Ann. Agric. Environ. Med. 2020, 27, 225–230. [Google Scholar] [CrossRef]
- Food and Agriculture Organization (FAO); World Health Organization (WHO). Acrylamide. In Summary and Conclusions of the Sixty-Fourth Meeting, Proceedings of the Joint FAO/WHO Expert Committee on Food Additives (JECFA), Rome, Italy, 8–17 February 2005; WHO: Geneva, Switzerland, 2006; pp. 7–17. [Google Scholar]
- Arisseto, A.P.; de Figueiredo Toledo, M.C.; Govaert, Y.; van Loco, J.; Fraselle, S.; Degroodt, J.M.; Rosseto Caroba, D.C. Contribution of selected foods to acrylamide intake by a population of brazilian adolescents. Food Sci. Technol. 2009, 42, 207–211. [Google Scholar] [CrossRef]
- Jackson, L.S.; Al-Taher, F. Effects of consumer food preparation on acrylamide formation. In Chemistry and Safety of Acrylamide in Food; Friedman, M., Mottram, D., Eds.; Springer: Boston, MA, USA, 2005; pp. 447–465. [Google Scholar] [CrossRef]
- Oroian, M.; Amariei, S.; Gutt, G. Acrylamide in Romanian food using HPLC-UV and a health risk assessment. Food Addit. Contam. Part B 2015, 8, 136–141. [Google Scholar] [CrossRef]
- Keramat, J.; Le Bail, A.; Prost, C.; Jafari, M. Acrylamide in baking products: A review article food. Food Bioprocess Technol. 2011, 4, 530–543. [Google Scholar] [CrossRef]
- Becalski, A.; Lau BP, Y.; Lewis, D.; Seaman, S.W. Acrylamide in foods: Occurrence, sources, and modeling. J. Agric. Food Chem. 2003, 51, 802–808. [Google Scholar] [CrossRef]


| Type | Linearity | Precision | Accuracy | Limits | ||||
|---|---|---|---|---|---|---|---|---|
| Range(µg/L) | R2 | Intraday (%) | Interday(%) | Recovery(%) | RSD(%) | LOD(µg/kg) | LOQ(µg/kg) | |
| Standard Solution | 2–50 | 0.9999 | 0.8 | 1.4 | 98.6 | 1.1 | 3.6 | 12 |
| Coffee | 2.6 | 3.6 | 102.6 | 1.8 | 3.6 | 12 | ||
| Bread | 2.3 | 4.1 | 96.9 | 3.6 | 3.6 | 12 | ||
| Pretzel | 4 | 4.9 | 116.5 | 2.8 | 3.6 | 12 | ||
| Potato chips | 3.1 | 3.7 | 108.2 | 3.1 | 3.6 | 12 | ||
| Product | Acrylamide (µg/kg) | Determination Limit (µg/kg) | Measurement Uncertainty ± Uext (µg/kg) | Benchmark Level (µg/kg) | ||
|---|---|---|---|---|---|---|
| Minimum | Mean | Maximum | ||||
| Brand 1 | 69.5 | 85.6 | 101.7 | |||
| Brand 2 | 118.5 | 146 | 173.5 | |||
| Brand 3 | 321 | 374 | 427 | |||
| Brand 4 | 89 | 197 | 305 | |||
| Brand 5 | 112 | 205 | 298 | |||
| Brand 6 | 164 | 192 | 220 | 12 | ±29.8 | 400 |
| Brand 7 | 94 | 126 | 158 | |||
| Brand 8 | 241 | 319 | 397 | |||
| Brand 9 | 112 | 150 | 188 | |||
| Brand 10 | 143 | 165 | 187 | |||
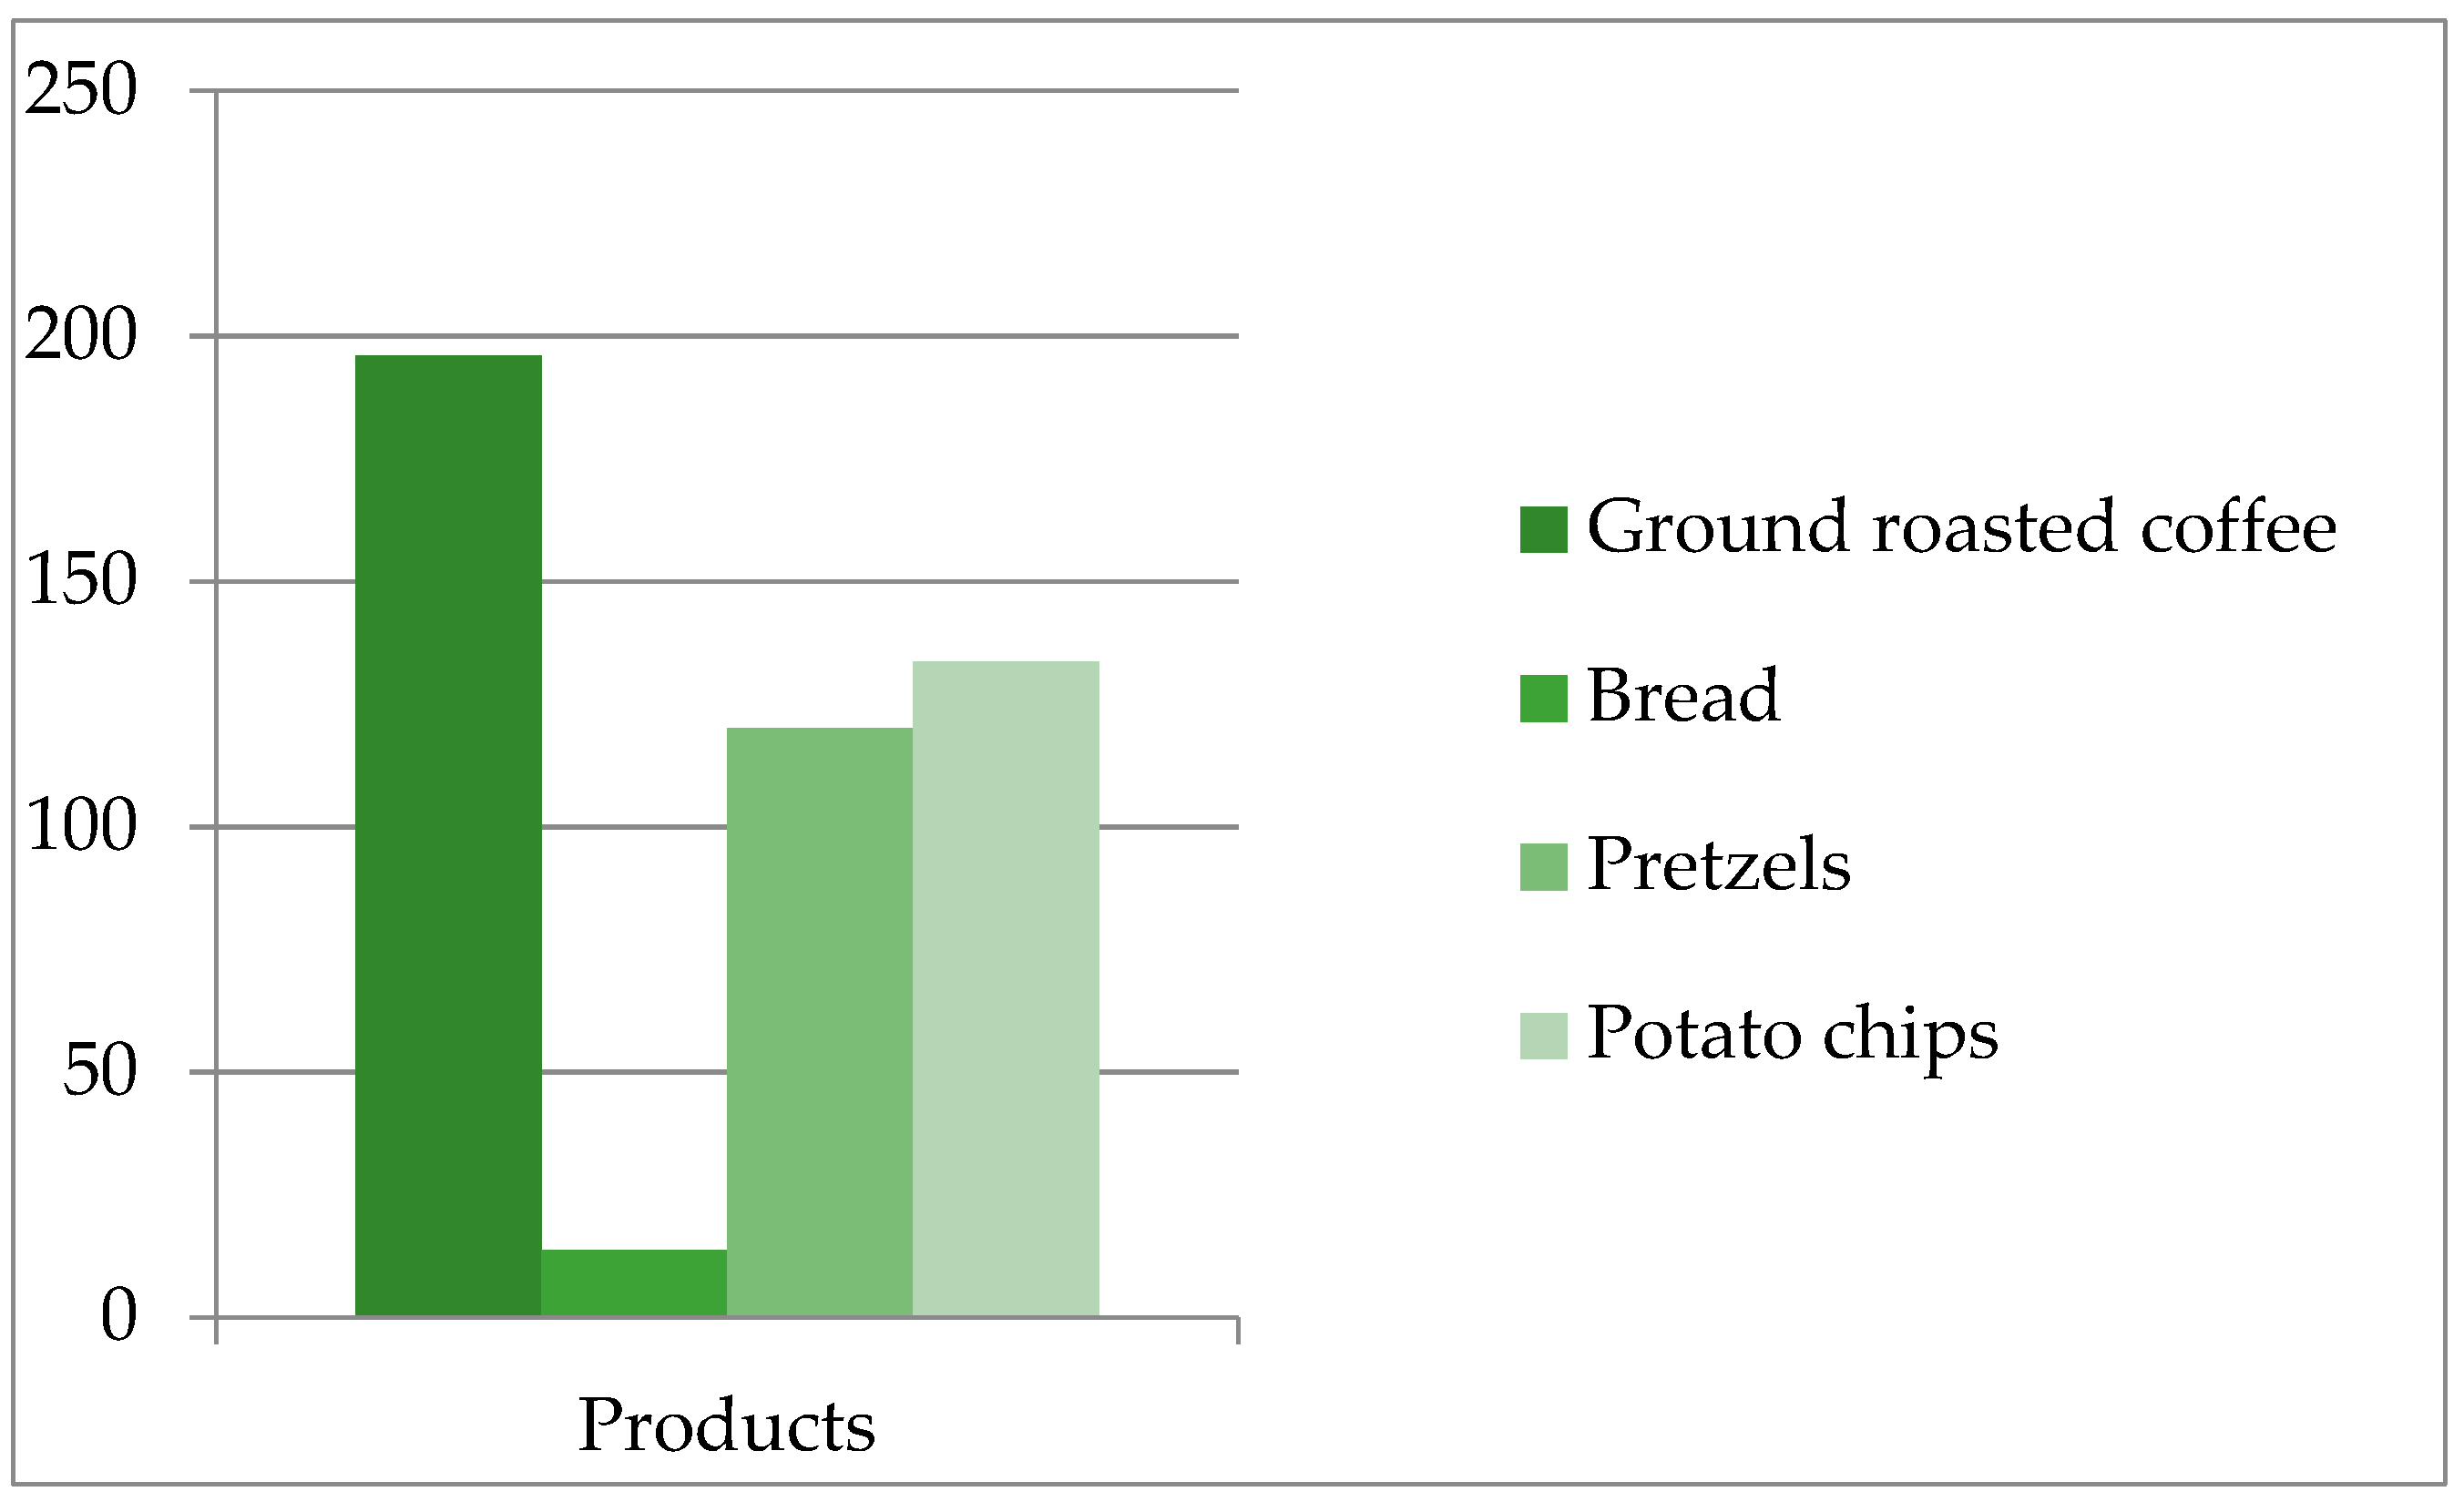
| 195.96 | ||||||
| µg/300 mL of brewed coffee | 2.20 | |||||
| Product | Acrylamide (µg/kg) | Determination Limit (µg/kg) | Measurement Uncertainty ± Uext (µg/kg) | Benchmark Level (µg/kg) | ||
|---|---|---|---|---|---|---|
| Minimum | Mean | Maximum | ||||
| Brand 1 | 13.00 | 14.00 | 15.00 | |||
| Brand 2 | 14.80 | 15.15 | 15.50 | |||
| Brand 3 | 11.00 | 14.00 | 17.00 | |||
| Brand 4 | 9.80 | 12.00 | 14.20 | |||
| Brand 5 | 11.20 | 13.10 | 15.00 | |||
| Brand 6 | 15.80 | 16.55 | 17.30 | 12 | ±6 | 50 |
| Brand 7 | 10.80 | 11.35 | 11.90 | |||
| Brand 8 | 12.00 | 14.00 | 16.00 | |||
| Brand 9 | 10.10 | 11.45 | 12.80 | |||
| Brand 10 | 13.00 | 14.70 | 16.40 | |||
| 13.63 | ||||||
| µg/serving (30 g bread/slice of bread) | 0.40 | |||||
| Product | Acrylamide (µg/kg) | Determination Limit (µg/kg) | Measurement Uncertainty ± Uext (µg/kg) | Benchmark Level (µg/kg) | ||
|---|---|---|---|---|---|---|
| Minimum | Mean | Maximum | ||||
| Brand 1 | 95.00 | 108.00 | 121.00 | |||
| Brand 2 | 80.50 | 96.00 | 111.50 | |||
| Brand 3 | 175.00 | 143.00 | 159.00 | |||
| Brand 4 | 126.00 | 128.50 | 131.00 | |||
| Brand 5 | 115.00 | 118.00 | 121.00 | |||
| Brand 6 | 84.0 | 99.00 | 114.00 | 12 | ±45.6 | 400 |
| Brand 7 | 104.00 | 120.00 | 136.00 | |||
| Brand 8 | 120.00 | 134.00 | 148.00 | |||
| Brand 9 | 100.00 | 110.00 | 120.00 | |||
| Brand 10 | 140.00 | 143.50 | 147.00 | |||
| 120.00 | ||||||
| µg/serving (85 g−1 piece) | 10.20 | |||||
| Product | Acrylamide (µg/kg) | Determination Limit (µg/kg) | Measurement Uncertainty ± Uext (µg/kg) | Benchmark Level (µg/kg) | ||
|---|---|---|---|---|---|---|
| Minimum | Mean | Maximum | ||||
| Brand 1 | 131.00 | 136.00 | 141.00 | |||
| Brand 2 | 106.00 | 119.00 | 132.00 | |||
| Brand 3 | 84.00 | 94.00 | 104.00 | |||
| Brand 4 | 104.00 | 116.00 | 128.00 | |||
| Brand 5 | 119.00 | 130.00 | 141.00 | |||
| Brand 6 | 168.00 | 180.00 | 192.00 | 12 | ±37.8 | 300 |
| Brand 7 | 184.00 | 225.00 | 266.00 | |||
| Brand 8 | 101.00 | 110.00 | 119.00 | |||
| Brand 9 | 118.00 | 124.00 | 130.00 | |||
| Brand 10 | 82.00 | 102.00 | 122.00 | |||
| 133.60 | ||||||
| µg/serving (30 g) | 4.00 | |||||
Publisher’s Note: MDPI stays neutral with regard to jurisdictional claims in published maps and institutional affiliations. |
© 2021 by the authors. Licensee MDPI, Basel, Switzerland. This article is an open access article distributed under the terms and conditions of the Creative Commons Attribution (CC BY) license (https://creativecommons.org/licenses/by/4.0/).
Share and Cite
Pogurschi, E.N.; Zugravu, C.A.; Ranga, I.N.; Trifunschi, S.; Munteanu, M.F.; Popa, D.C.; Tudorache, M.; Custura, I. Determination of Acrylamide in Selected Foods from the Romanian Market. Foods 2021, 10, 2110. https://doi.org/10.3390/foods10092110
Pogurschi EN, Zugravu CA, Ranga IN, Trifunschi S, Munteanu MF, Popa DC, Tudorache M, Custura I. Determination of Acrylamide in Selected Foods from the Romanian Market. Foods. 2021; 10(9):2110. https://doi.org/10.3390/foods10092110
Chicago/Turabian StylePogurschi, Elena Narcisa, Corina Aurelia Zugravu, Ioan Nicolae Ranga, Svetlana Trifunschi, Melania Florina Munteanu, Dana Catalina Popa, Minodora Tudorache, and Ioan Custura. 2021. "Determination of Acrylamide in Selected Foods from the Romanian Market" Foods 10, no. 9: 2110. https://doi.org/10.3390/foods10092110
APA StylePogurschi, E. N., Zugravu, C. A., Ranga, I. N., Trifunschi, S., Munteanu, M. F., Popa, D. C., Tudorache, M., & Custura, I. (2021). Determination of Acrylamide in Selected Foods from the Romanian Market. Foods, 10(9), 2110. https://doi.org/10.3390/foods10092110