
How Individual Variations in the Perception of Basic Tastes and Astringency Relate with Dietary Intake and Preferences for Fruits and Vegetables

 ,
,  ,
, 
 and
and 
Abstract
:1. Introduction
2. Materials and Methods
2.1. Participants
2.2. Anthropometric Evaluation
2.3. Dietary Intake Assessment
2.4. Preference for Fruit and Vegetables
2.5. Taste Sensitivity
2.6. Statistical Analysis
3. Results
3.1. Participant’s Characteristics
3.2. Relationship between Taste Sensitivity and Taste Preferences
3.3. Relationship between Taste Function and Dietary Habits
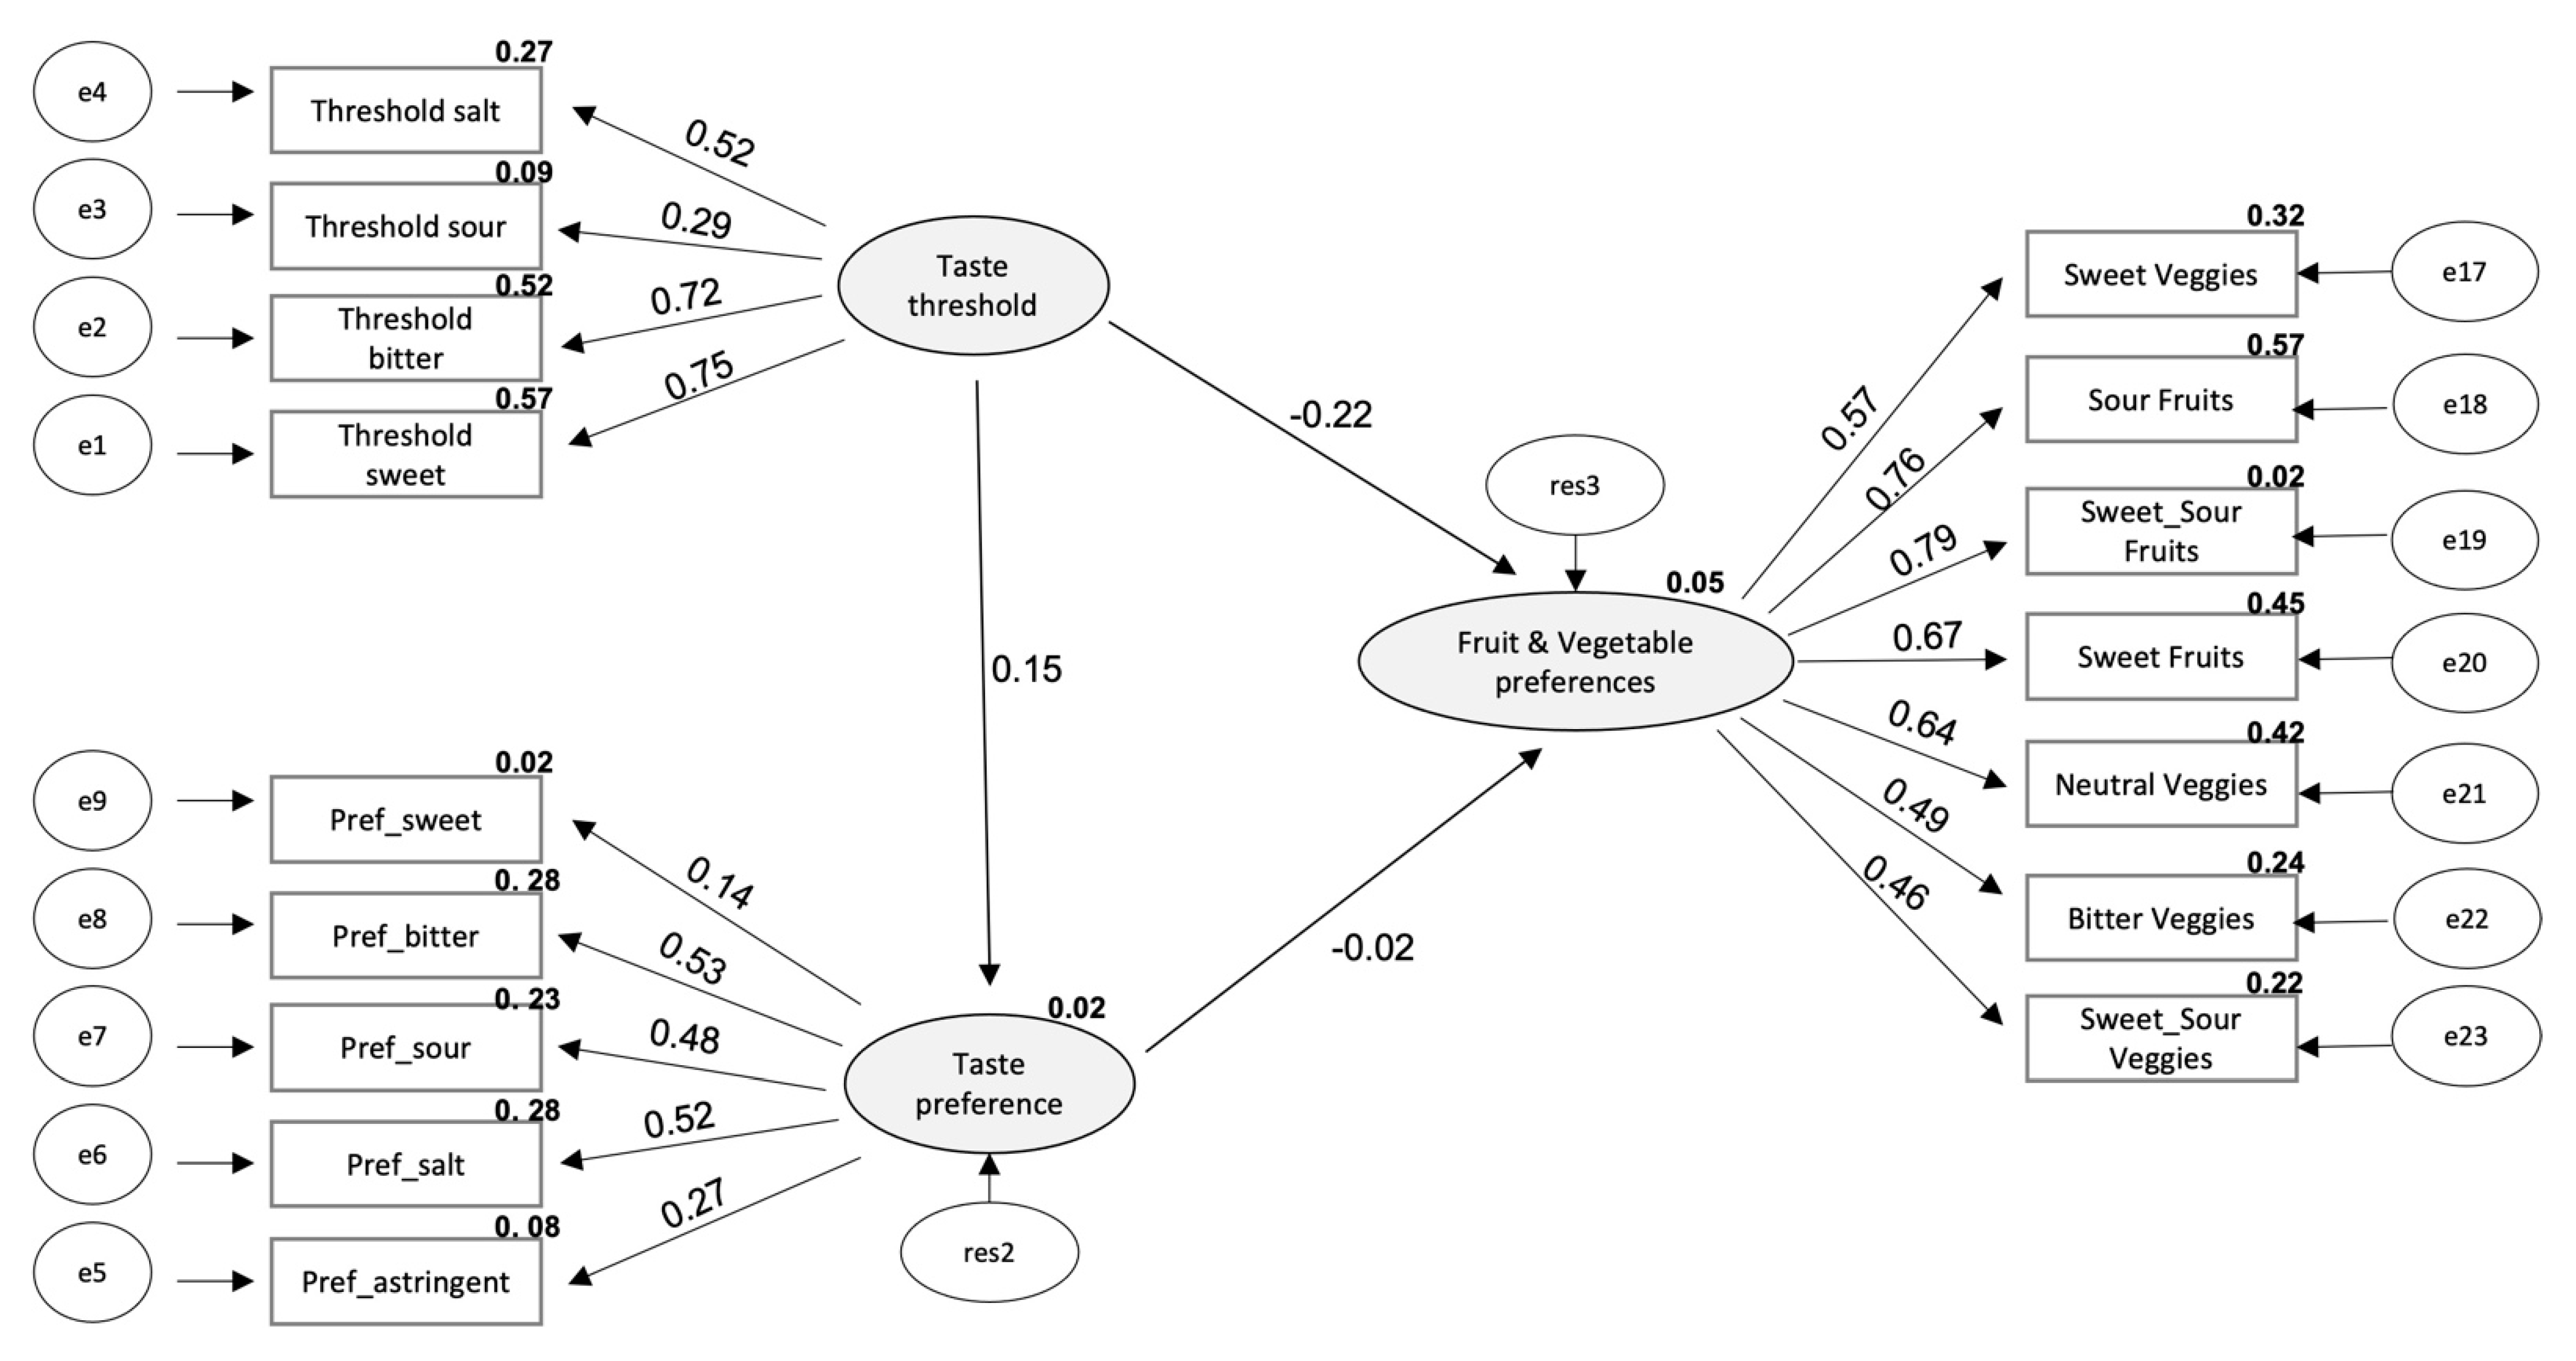
3.4. Relationship between Taste Function and Fruit & Vegetables Preference
4. Discussion
Supplementary Materials
Author Contributions
Funding
Institutional Review Board Statement
Informed Consent Statement
Data Availability Statement
Acknowledgments
Conflicts of Interest
References
- Cordain, L.; Eaton, S.B.; Sebastian, A.; Mann, N.; Lindeberg, S.; Watkins, B.A.; O’Keefe, J.H.; Brand-Miller, J. Origins and evolution of the Western diet: Health implications for the 21st century. Am. J. Clin. Nutr. 2005, 81, 341–354. [Google Scholar] [CrossRef]
- Rodrigues, L.; Silverio, R.; Costa, A.R.; Antunes, C.; Pomar, C.; Infante, P.; Conceição, C.; Amado, F.; Lamy, E. Taste sensitivity and lifestyle are associated with food preferences and BMI in children. Int. J. Food Sci. Nutr. 2020, 71, 1–9. [Google Scholar] [CrossRef] [PubMed]
- Webb, J.; Bolhuis, D.P.; Cicerale, S.; Hayes, J.E.; Keast, R. The Relationships between common measurements of taste function. Chemosens. Percept. 2015, 8, 11–18. [Google Scholar] [CrossRef] [Green Version]
- Simmen, B.; Pasquet, P.; Hladik, C.M. Methods for assessing taste abilities and hedonic responses in human and non-human primates. In Researching Food Habits: Methods and Problems; Berghahn Books: New York, NY, USA, 2004; Volume 5, pp. 87–99. [Google Scholar]
- Reed, D.R.; Knaapila, A. Genetics of Taste and Smell: Poisons and Pleasures. Prog. Mol. Biol. Transl. Sci. 2010, 94, 213–240. [Google Scholar]
- Shen, Y.; Kennedy, O.B.; Methven, L. Exploring the effects of genotypical and phenotypical variations in bitter taste sensitivity on perception, liking and intake of brassica vegetables in the UK. Food Qual. Prefer. 2016, 50, 71–81. [Google Scholar] [CrossRef]
- Bawajeeh, A.O.; Albar, S.A.; Zhang, H.; Zulyniak, M.A.; Evans, C.E.L.; Cade, J.E. Impact of taste on food choices in adolescence—Systematic review and meta-analysis. Nutrients 2020, 12, 1985. [Google Scholar] [CrossRef] [PubMed]
- Tan, S.Y.; Tucker, R.M. Sweet taste as a predictor of dietary intake: A systematic review. Nutrients 2019, 11, 94. [Google Scholar] [CrossRef] [PubMed] [Green Version]
- Henney, J.E.; Taylor, C.L.; Boon, C.S. Taste and Flavor Roles of Sodium in Foods: A Unique Challenge to Reducing Sodium Intake. 2010. Available online: https://www.ncbi.nlm.nih.gov/books/NBK50958/ (accessed on 27 April 2021).
- Law, M. Salt, diet & health: Neptune’s poisoned chalice: The origins of high blood pressure. Fam. Pract. 1999, 16, 316. [Google Scholar]
- Rosenstein, D.; Oster, H. Differential facial responses to four basic tastes in newborns. Child Dev. 1988, 59, 1555–1568. [Google Scholar] [CrossRef] [PubMed]
- Liem, D.G.; Bogers, R.P.; Dagnelie, P.C.; de Graaf, C. Fruit consumption of boys (8–11 years) is related to preferences for sour taste. Appetite 2006, 46, 93–96. [Google Scholar] [CrossRef]
- Teo, P.S.; van Langeveld, A.W.B.; Pol, K.; Siebelink, E.; de Graaf, C.; Yan, S.W.; Mars, M. Similar taste-nutrient relationships in commonly consumed Dutch and Malaysian foods. Appetite 2018, 125, 32–41. [Google Scholar] [CrossRef] [Green Version]
- Kubota, M.; Toda, C.; Nagai-Moriyama, A. Relationship between umami taste acuity with sweet or bitter taste acuity and food selection in Japanese women university students. Asia Pac. J. Clin. Nutr. 2018, 27, 107–112. [Google Scholar] [PubMed]
- Gervis, J.; Coltell, O.; Fernández-Carrión, R.; Asensio, E.; Barragán, D.C.; Lichtenstein, A. Association of Taste Perception for Sweet, Salt, Sour, Bitter and Umami and Food Intake Among Community-dwelling Adults in the PREDIMED-PLUS Trial (P18-065-19). Curr. Dev. Nutr. 2019, 3, nzz039-P18. [Google Scholar] [CrossRef] [Green Version]
- Huang, R.; Xu, C. An overview of the perception and mitigation of astringency associated with phenolic compounds. Compr. Rev. Food Sci. Food Saf. 2021, 20, 1036–1074. [Google Scholar] [CrossRef] [PubMed]
- Dinnella, C.; Recchia, A.; Tuorila, H.; Monteleone, E. Individual astringency responsiveness affects the acceptance of phenol-rich foods. Appetite 2011, 56, 633–642. [Google Scholar] [CrossRef]
- WHO. Obesity: Preventing and Managing the Global Epidemic; Technical Report Series; WHO Press: Geneve, Switzerland, 2019. [Google Scholar]
- Lopes, C.; Aro, A.; Azevedo, A.; Ramos, E.; Barros, H. Intake and adipose tissue composition of fatty acids and risk of myocardial infarction in a male Portuguese community sample. J. Am. Diet Assoc. 2007, 107, 276–286. [Google Scholar] [CrossRef] [PubMed]
- Van Langeveld, A.W.B.; Teo, P.S.; De Vries, J.H.M.; Feskens, E.J.M.; Graaf, C.; Mars, M. Dietary taste patterns by sex and weight status in The Netherlands. Br. J. Nutr. 2018, 119, 1195–1206. [Google Scholar] [CrossRef] [Green Version]
- Ribeiro, J.C.; Chaves, M.; Chaves, C.; Lemos, L.; Silva, A.P.; Paiva, A.; Hummel, T. Cross-cultural validation of a taste test with paper strips. Eur. Arch. Otorhinolaryngol. 2016, 273, 3407–3411. [Google Scholar] [CrossRef]
- Green, B.G.; Dalton, P.; Cowart, B.; Shaffer, G.; Rankin, K.; Higgins, J. Evaluating the “Labeled Magnitude Scale” for measuring sensations of taste and smell. Chem. Senses 1996, 21, 323–334. [Google Scholar] [CrossRef]
- Puputti, S.; Hoppu, U.; Sandell, M. Taste sensitivity is associated with food consumption behavior but not with recalled pleasantness. Foods 2019, 8, 444. [Google Scholar] [CrossRef] [Green Version]
- Hong, J.H.; Chung, J.W.; Kim, Y.K.; Chung, S.-C.; Lee, S.-W.; Kho, H.-S. The relationship between PTC taster status and taste thresholds in young adults. Oral Surg. Oral Med. Oral Pathol. Oral Radiol. Endodontol. 2005, 99, 711–715. [Google Scholar] [CrossRef] [PubMed]
- Han, P.; Mohebbi, M.; Seo, H.S.; Hummel, T. Sensitivity to sweetness correlates to elevated reward brain responses to sweet and high-fat food odors in young healthy volunteers. Neuroimage 2020, 208, 116413. [Google Scholar] [CrossRef] [PubMed]
- Pfaffmann, C. Wundt’s schema of sensory affect in the light of research on gustatory preferences. Psychol. Res. 1980, 42, 165–174. [Google Scholar] [CrossRef]
- Yoshinaka, M.; Ikebe, K.; Uota, M.; Ogawa, T.; Okada, T.; Inomata, C.; Takeshita, H.; Mihara, Y.; Gondo, Y.; Masui, Y.; et al. Age and sex differences in the taste sensitivity of young adult, young-old and old-old Japanese. Geriatr. Gerontol. Int. 2016, 16, 1281–1288. [Google Scholar] [CrossRef] [PubMed]
- Michon, C.; O’Sullivan, M.G.; Delahunty, C.M.; Kerry, J.P. The investigation of gender-related sensitivity differences in food perception. J. Sens. Stud. 2009, 24, 922–937. [Google Scholar] [CrossRef]
- Ervina, E.; Berget, I.; Almli, V.L. Investigating the relationships between basic tastes sensitivities, fattiness sensitivity, and food liking in 11-year-old children. Foods 2020, 9, 1315. [Google Scholar] [CrossRef]
- Wang, J.J.; Liang, K.L.; Lin, W.J.; Chen, C.-Y.; Jiang, R.-S. Influence of age and sex on taste function of healthy subjects. PLoS ONE 2020, 15, e0227014. [Google Scholar] [CrossRef] [PubMed]
- Vignini, A.; Borroni, F.; Sabbatinelli, J.; Pugnaloni, S.; Alia, S.; Taus, M.; Ferrante, L.; Mayyanti, L.; Fabri, M. General decrease of taste sensitivity is related to increase of BMI: A simple method to monitor eating behavior. Dis. Markers 2019, 2019, 2978026. [Google Scholar] [CrossRef] [Green Version]
- Overberg, J.; Hummel, T.; Krude, H.; Wiegand, S. Differences in taste sensitivity between obese and non-obese children and adolescents. Arch. Dis. Child. 2012, 97, 1048–1052. [Google Scholar] [CrossRef]
- Proserpio, C.; Laureati, M.; Bertoli, S.; Battezzati, A.; Pagliarini, E. Determinants of obesity in Italian adults: The role of taste sensitivity, food liking, and food neophobia. Chem. Senses 2016, 41, 169–176. [Google Scholar] [CrossRef] [Green Version]
- Hardikar, S.; Höchenberger, R.; Villringer, A.; Ohla, K. Higher sensitivity to sweet and salty taste in obese compared to lean individuals. Appetite 2017, 111, 158–165. [Google Scholar] [CrossRef] [PubMed] [Green Version]
- Alexy, U.; Schaefer, A.; Sailer, O.; Busch-Stockfisch, M.; Huthmacher, S.; Kunert, J.; Kersting, M. Sensory preferences and discrimination ability of children in relation to their body weight status. J. Sens. Stud. 2011, 26, 158–165. [Google Scholar] [CrossRef]
- Salbe, A.D.; DelParigi, A.; Pratley, R.E.; Drewnowski, A.; Tataranni, A.P. Taste preferences and body weight changes in an obesity-prone population. Am. J. Clin. Nutr. 2004, 79, 372–378. [Google Scholar] [CrossRef] [PubMed]
- Simchen, U.; Koebnick, C.; Hoyer, S.; Issanchou, S.; Zunft, H.-J.F. Odour and taste sensitivity is associated with body weight and extent of misreporting of body weight. Eur. J. Clin. Nutr. 2006, 60, 698–705. [Google Scholar] [CrossRef]
- Bertoli, S. Taste sensitivity, nutritional status and metabolic syndrome: Implication in weight loss dietary interventions. World J. Diabetes 2014, 5, 717. [Google Scholar] [CrossRef] [Green Version]
- De Andrade, S.C.; Previdelli, Á.N.; Cesar, C.L.G.; Marchioni, D.M.L.; Fisberg, R.M. Trends in diet quality among adolescents, adults and older adults: A population-based study. Prev. Med. Rep. 2016, 4, 391–396. [Google Scholar] [CrossRef] [PubMed] [Green Version]
- Duffy, V.B.; Hayes, J.E.; Davidson, A.C.; Kidd, J.R.; Kidd, K.K.; Bartoshuk, L.M. Vegetable Intake in college-aged adults is explained by oral sensory phenotypes and TAS2R38 genotype. Chemosens. Percept. 2010, 3, 137–148. [Google Scholar] [CrossRef] [Green Version]
- Baranowski, T.; Baranowski, J.C.; Watson, K.B.; Jago, R.; Islam, N.; Beltran, A.; Martin, S.J.; Nguyen, N.; Tepper, B.J. 6-n-propylthiouracil taster status not related to reported cruciferous vegetable intake among ethnically diverse children. Nutr. Res. 2011, 31, 594–600. [Google Scholar] [CrossRef] [PubMed] [Green Version]
- Wehling, H.; Lusher, J. People with a body mass index ≥30 under-report their dietary intake: A systematic review. J. Health Psychol. 2019, 24, 2042–2059. [Google Scholar] [CrossRef] [PubMed]


| Oral Sensation | Compound | Conc 1 | Conc 2 | Conc 3 | Conc 4 |
|---|---|---|---|---|---|
| Bitter | Quinine hydrochloride | 0.0004 | 0.0009 | 0.0024 | 0.0060 |
| Sweet | Sucrose | 0.05 | 0.10 | 0.20 | 0.40 |
| Sour | Citric acid | 0.050 | 0.090 | 0.165 | 0.300 |
| Salty | Sodium chloride (NaCl) | 0.016 | 0.040 | 0.100 | 0.250 |
| Astringent | Tannic acid | 0.0017 | 0.0023 | 0.0032 | 0.0045 |
| Men (n = 132) | Women (n = 137) | p-Value | ||
|---|---|---|---|---|
| Age—median [range] | 41.5 [33.0–52.0] | 42.0 [33.5–51.0] | >0.05 | |
| BMI—median [range] | 27.0 [24.1–30.4] | 25.9 [23.0–29.7] | >0.05 | |
| Urban | 60 | 51 | >0.05 | |
| Rural | 72 | 86 | ||
| Sweet taste thresholds (g/mL) | 0.050 | 70 | 79 | 0.0270 * |
| 0.100 | 28 | 43 | ||
| 0.200 | 18 | 7 | ||
| »0.400 | 11 | 7 | ||
| Bitter taste thresholds (g/mL) | 0.0004 | 64 | 79 | 0.501 |
| 0.0009 | 23 | 21 | ||
| 0.0024 | 9 | 11 | ||
| »0.0060 | 25 | 19 | ||
| Sour taste thresholds (g/mL) | 0.050 | 97 | 97 | 0.625 |
| 0.090 | 13 | 21 | ||
| 0.165 | 6 | 6 | ||
| »0.300 | 9 | 8 | ||
| Salty taste thresholds (g/mg) | 0.016 | 55 | 83 | 0.004 * |
| 0.040 | 28 | 26 | ||
| 0.100 | 13 | 14 | ||
| »0.250 | 19 | 5 | ||
| Sweetness intensity—Median [range] | 2.40 [1.40–3.83] | 2.70 [1.40–4.10] | 0.305 | |
| Bitterness intensity—Median [range] | 5.15 [2.98–6.70] | 5.30 [2.90–7.05] | 0.962 | |
| Sourness intensity—Median [range] | 5.95 [3.90–9.20] | 5.80 [4.38–7.88] | 0.526 | |
| Saltiness intensity—Median [range] | 3.50 [0.08–5.20] | 4.30 [2.58–5.90] | 0.006 * | |
| Astringency intensity—Median [range] | 4.00 [2.23–5.80] | 4.00 [3.18–5.53] | 0.534 | |
| Sweetness preference (% within sex) | 1 | 0.9 | 4.30 | 0.114 |
| 2 | 5.7 | 11.1 | ||
| 3 | 14.2 | 17.1 | ||
| 4 | 67.9 | 62.4 | ||
| 5 | 11.3 | 5.1 | ||
| Bitterness preference (% within sex) | 1 | 57.9 | 60.7 | 0.439 |
| 2 | 32.5 | 34.4 | ||
| 3 | 7.9 | 3.3 | ||
| 4 | 0.9 | 1.6 | ||
| 5 | 0.9 | 0.0 | ||
| Sourness preference (% within sex) | 1 | 53.9 | 60.0 | 0.716 |
| 2 | 33.0 | 25.6 | ||
| 3 | 3.5 | 2.4 | ||
| 4 | 7.8 | 9.6 | ||
| 5 | 1.7 | 2.4 | ||
| Saltiness preference (% within sex) | 1 | 20.7 | 26.8 | 0.142 |
| 2 | 49.1 | 35.8 | ||
| 3 | 16.4 | 17.9 | ||
| 4 | 11.2 | 18.7 | ||
| 5 | 2.6 | 0.8 | ||
| Astringency preference (% within sex) | 1 | 54.5 | 56.3 | 0.299 |
| 2 | 34.5 | 33.6 | ||
| 3 | 10.9 | 6.7 | ||
| 4 | 0.0 | 2.5 | ||
| 5 | 0.0 | 0.8 | ||
| Thresholds | Intensities | ||||||
|---|---|---|---|---|---|---|---|
| Bitter | Sour | Salty | Bitter | Sour | Salty | ||
| Thresholds | Sweet | 0.274 (p = 0.0005) | 0.173 (p = 0.002) | 0.205 (p = 0.0005) | |||
| Bitter | 0.253 (p = 0.0005) | 0.215 (p = 0.0005) | |||||
| Sour | 0.183 (p = 0.001) | ||||||
| Intensities | Sweet | 0.190 (p = 0.0005) | 0.214 (p = 0.0005) | 0.174 (p = 0.0005) | |||
| Bitter | 0.230 (p = 0.0005) | 0.289 (p = 0.0005) | |||||
| Sour | 0.278 (p = 0.0005) | ||||||
| Component | 1 | 2 | 3 | 4 | 5 | 6 | 7 | 8 | 9 | 10 | 11 | 12 | 13 | 14 | 15 |
|---|---|---|---|---|---|---|---|---|---|---|---|---|---|---|---|
| % Cumulative variance | 7 | 13 | 18 | 21 | 25 | 27 | 30 | 33 | 35 | 38 | 40 | 42 | 45 | 47 | 50 |
| Fat milk | −0.341 | ||||||||||||||
| Half-fat milk | 0.318 | ||||||||||||||
| Low-fat milk | 0.413 | ||||||||||||||
| Yoghurt | 0.576 | ||||||||||||||
| Cheese | 0.332 | ||||||||||||||
| Milk desert | 0.550 | ||||||||||||||
| Ice cream | 0.305 | ||||||||||||||
| Eggs | 0.615 | ||||||||||||||
| Chicken | 0.585 | ||||||||||||||
| Turkey or rabbit | 0.605 | ||||||||||||||
| Cow or pig | 0.448 | ||||||||||||||
| Liver | |||||||||||||||
| Tongue | 0.855 | ||||||||||||||
| Ham | 0.404 | ||||||||||||||
| Sausage | 0.752 | ||||||||||||||
| Bacon | 0.631 | ||||||||||||||
| Fat fish | 0.331 | ||||||||||||||
| Low-fat fish | 0.830 | ||||||||||||||
| Cod | 0.429 | ||||||||||||||
| Canned fish | 0.320 | 0.400 | |||||||||||||
| Squid or octopus | 0.318 | 0.374 | 0.337 | ||||||||||||
| Shrimp | 0.315 | 0.493 | |||||||||||||
| Olive oil | 0.670 | ||||||||||||||
| Vegetable oil | 0.718 | ||||||||||||||
| Margarine | 0.721 | ||||||||||||||
| Butter | 0.603 | ||||||||||||||
| White bread | 0.419 | −0.398 | |||||||||||||
| Whole grain bread | |||||||||||||||
| Corn bread | 0.321 | ||||||||||||||
| Breakfast cereals | 0.427 | ||||||||||||||
| Rice | 0.826 | ||||||||||||||
| Pasta | 0.754 | ||||||||||||||
| Fried potato (home made) | −0.317 | ||||||||||||||
| Fried potato (industrial) | −0.412 | ||||||||||||||
| Boiled potato | 0.544 | ||||||||||||||
| Low-sugar cookies | 0.389 | −0.322 | |||||||||||||
| Cookies | 0.392 | 0.322 | |||||||||||||
| Pastry | 0.543 | ||||||||||||||
| Chocolate | 0.608 | 0.368 | |||||||||||||
| Chocolate snacks | 0.666 | ||||||||||||||
| Jam | 0.481 | ||||||||||||||
| Sugar | 0.351 | 0.325 | |||||||||||||
| White cucumber | 0.643 | ||||||||||||||
| “Penca” cucumber | 0.634 | 0.368 | |||||||||||||
| “Galega” cucumber | 0.732 | ||||||||||||||
| Broccoli | 0.537 | 0.601 | |||||||||||||
| Cauliflower | 0.663 | ||||||||||||||
| Cabbage sprouts | 0.718 | ||||||||||||||
| Green bean | 0.705 | ||||||||||||||
| Lettuce | 0.317 | 0.478 | |||||||||||||
| Onion | 0.423 | 0.469 | |||||||||||||
| Carrot | 0.355 | 0.301 | 0.369 | ||||||||||||
| Turnip | 0.477 | 0.360 | |||||||||||||
| Tomato | 0.664 | ||||||||||||||
| Pepper | 0.665 | 0.347 | |||||||||||||
| Cucumber | 0.550 | ||||||||||||||
| Pulses | 0.750 | ||||||||||||||
| Peas | 0.432 | ||||||||||||||
| Apple/pear | 0.333 | 0.593 | |||||||||||||
| Orange | 0.428 | 0.401 | |||||||||||||
| Banana | 0.683 | ||||||||||||||
| Kiwi | −0.315 | 0.529 | |||||||||||||
| Strawberry | 0.813 | ||||||||||||||
| Cherries | 0.747 | ||||||||||||||
| Peaches | 0.773 | ||||||||||||||
| Melon | 0.793 | ||||||||||||||
| Persimmon | 0.485 | 0.453 | |||||||||||||
| Fig | 0.809 | ||||||||||||||
| Grape | 0.634 | ||||||||||||||
| Canned fruit | 0.424 | ||||||||||||||
| Nuts | 0.470 | ||||||||||||||
| Olives | 0.577 | ||||||||||||||
| Wine | 0.445 | ||||||||||||||
| Beer | 0.685 | ||||||||||||||
| Spirits | 0.556 | ||||||||||||||
| Sweetened beverages | 0.538 | ||||||||||||||
| Ice Tea | 0.348 | ||||||||||||||
| Coke | 0.517 | ||||||||||||||
| Coffee | |||||||||||||||
| Black tea | 0.376 | ||||||||||||||
| Processed | |||||||||||||||
| Mayonnaise | 0.675 | ||||||||||||||
| Ketchup | 0.648 | ||||||||||||||
| Pizza | 0.652 | ||||||||||||||
| Hamburger | 0.308 | 0.383 | |||||||||||||
| Vegetable Soup | 0.450 |
| Cluster | ||||
|---|---|---|---|---|
| 1 | 2 | 3 | Z | |
| “Less Sensitive” | “Most Sensitive” | “Less Sensitive to Sour” | ||
| (n = 81) | (n = 100) | (n = 100) | ||
| Sex | 50% women | 54% women | 49% women | 0.25 |
| Age | 28 | 41 | 53 | 1045.96 |
| BMI | 26.08 | 26.36 | 28.21 | 6.25 |
| Threshold sweet | 0.15 | 0.08 | 0.14 | 3.23 |
| Pref sweet | 4 | 4 | 3 | 3.42 |
| Threshold bitter | 0.0067 | 0.0037 | 0.0064 | 1.23 |
| Pref bitter | 2 | 1 | 2 | 1.21 |
| Threshold sour | 0.09 | 0.07 | 0.12 | 3.49 |
| Pref sour | 2 | 2 | 2 | 2.51 |
| Threshold salty | 0.084 | 0.050 | 0.079 | 1.91 |
| Pref salty | 3 | 2 | 2 | 5.73 |
| Pref Astringency | 2 | 2 | 2 | 0.35 |
| Pref Sweet_Sour Veggies | 3.92 | 4.18 | 4.20 | 2.05 |
| Pref Bitter Veggies | 3.55 | 3.80 | 3.63 | 3.19 |
| Pref Neutral Veggies | 3.60 | 3.91 | 3.89 | 6.97 |
| Pref Sweet Veggies | 3.82 | 4.27 | 4.09 | 9.18 |
| Pref Sweet_Sour Fruits | 3.96 | 4.29 | 4.23 | 6.43 |
| Pref Sour Fruits | 4.07 | 4.24 | 4.20 | 2.32 |
| Pref Sweet Fruits | 4.04 | 4.28 | 4.25 | 4.38 |
| Comp 1 (high variety fruits) | −0.00622 | −0.07148 | 0.07580 | 0.54 |
| Comp 2 (white meat, sea food and brassica) | −0.13108 | 0.06519 | 0.04164 | 0.99 |
| Comp 3 (sausages) | −0.03615 | −0.10758 | 0.13578 | 1.55 |
| Comp 4 (sweets) | 0.26724 | −0.00134 | −0.21513 | 5.37 |
| Comp 5 (fats) | 0.02783 | 0.06891 | −0.09077 | 0.68 |
| Comp 6 (fast-food) | 0.33285 | 0.04326 | −0.31243 | 10.08 |
| Comp 7 (alcoholic beverages and coke) | −0.00182 | −0.07415 | 0.07488 | 0.55 |
| Comp 8 (animal protein) | 0.13062 | 0.04130 | −0.14669 | 1.86 |
| Comp 9 (bread, half-fat milk) | −0.29482 | 0.03059 | 0.20851 | 5.94 |
| Comp 10 (complex carbohydrates) | 0.28476 | −0.15167 | −0.08050 | 4.88 |
| Comp 11 (low-fat fish, pulses and broccoli) | 0.05189 | 0.04580 | −0.08738 | 0.59 |
| Comp 12 (sea food and salad) | −0.03061 | 0.05494 | −0.02959 | 0.23 |
| Comp 13 (low-fat milk and yoghurt) | 0.08889 | 0.12334 | −0.19411 | 3.0 |
| Comp 14 (cheese, nuts, olives and salad) | −0.04713 | −0.13186 | 0.16872 | 2.40 |
| Comp 15 (“common” fruits) | 0.14243 | −0.13694 | 0.02020 | 1.78 |
Publisher’s Note: MDPI stays neutral with regard to jurisdictional claims in published maps and institutional affiliations. |
© 2021 by the authors. Licensee MDPI, Basel, Switzerland. This article is an open access article distributed under the terms and conditions of the Creative Commons Attribution (CC BY) license (https://creativecommons.org/licenses/by/4.0/).
Share and Cite
Louro, T.; Simões, C.; Castelo, P.M.; Capela e Silva, F.; Luis, H.; Moreira, P.; Lamy, E. How Individual Variations in the Perception of Basic Tastes and Astringency Relate with Dietary Intake and Preferences for Fruits and Vegetables. Foods 2021, 10, 1961. https://doi.org/10.3390/foods10081961
Louro T, Simões C, Castelo PM, Capela e Silva F, Luis H, Moreira P, Lamy E. How Individual Variations in the Perception of Basic Tastes and Astringency Relate with Dietary Intake and Preferences for Fruits and Vegetables. Foods. 2021; 10(8):1961. https://doi.org/10.3390/foods10081961
Chicago/Turabian StyleLouro, Teresa, Carla Simões, Paula Midori Castelo, Fernando Capela e Silva, Henrique Luis, Pedro Moreira, and Elsa Lamy. 2021. "How Individual Variations in the Perception of Basic Tastes and Astringency Relate with Dietary Intake and Preferences for Fruits and Vegetables" Foods 10, no. 8: 1961. https://doi.org/10.3390/foods10081961
APA StyleLouro, T., Simões, C., Castelo, P. M., Capela e Silva, F., Luis, H., Moreira, P., & Lamy, E. (2021). How Individual Variations in the Perception of Basic Tastes and Astringency Relate with Dietary Intake and Preferences for Fruits and Vegetables. Foods, 10(8), 1961. https://doi.org/10.3390/foods10081961