
The Use of SPME-GC-MS IR and Raman Techniques for Botanical and Geographical Authentication and Detection of Adulteration of Honey

 ,
,  ,
,  , ,
, , 

Abstract
:1. Introduction
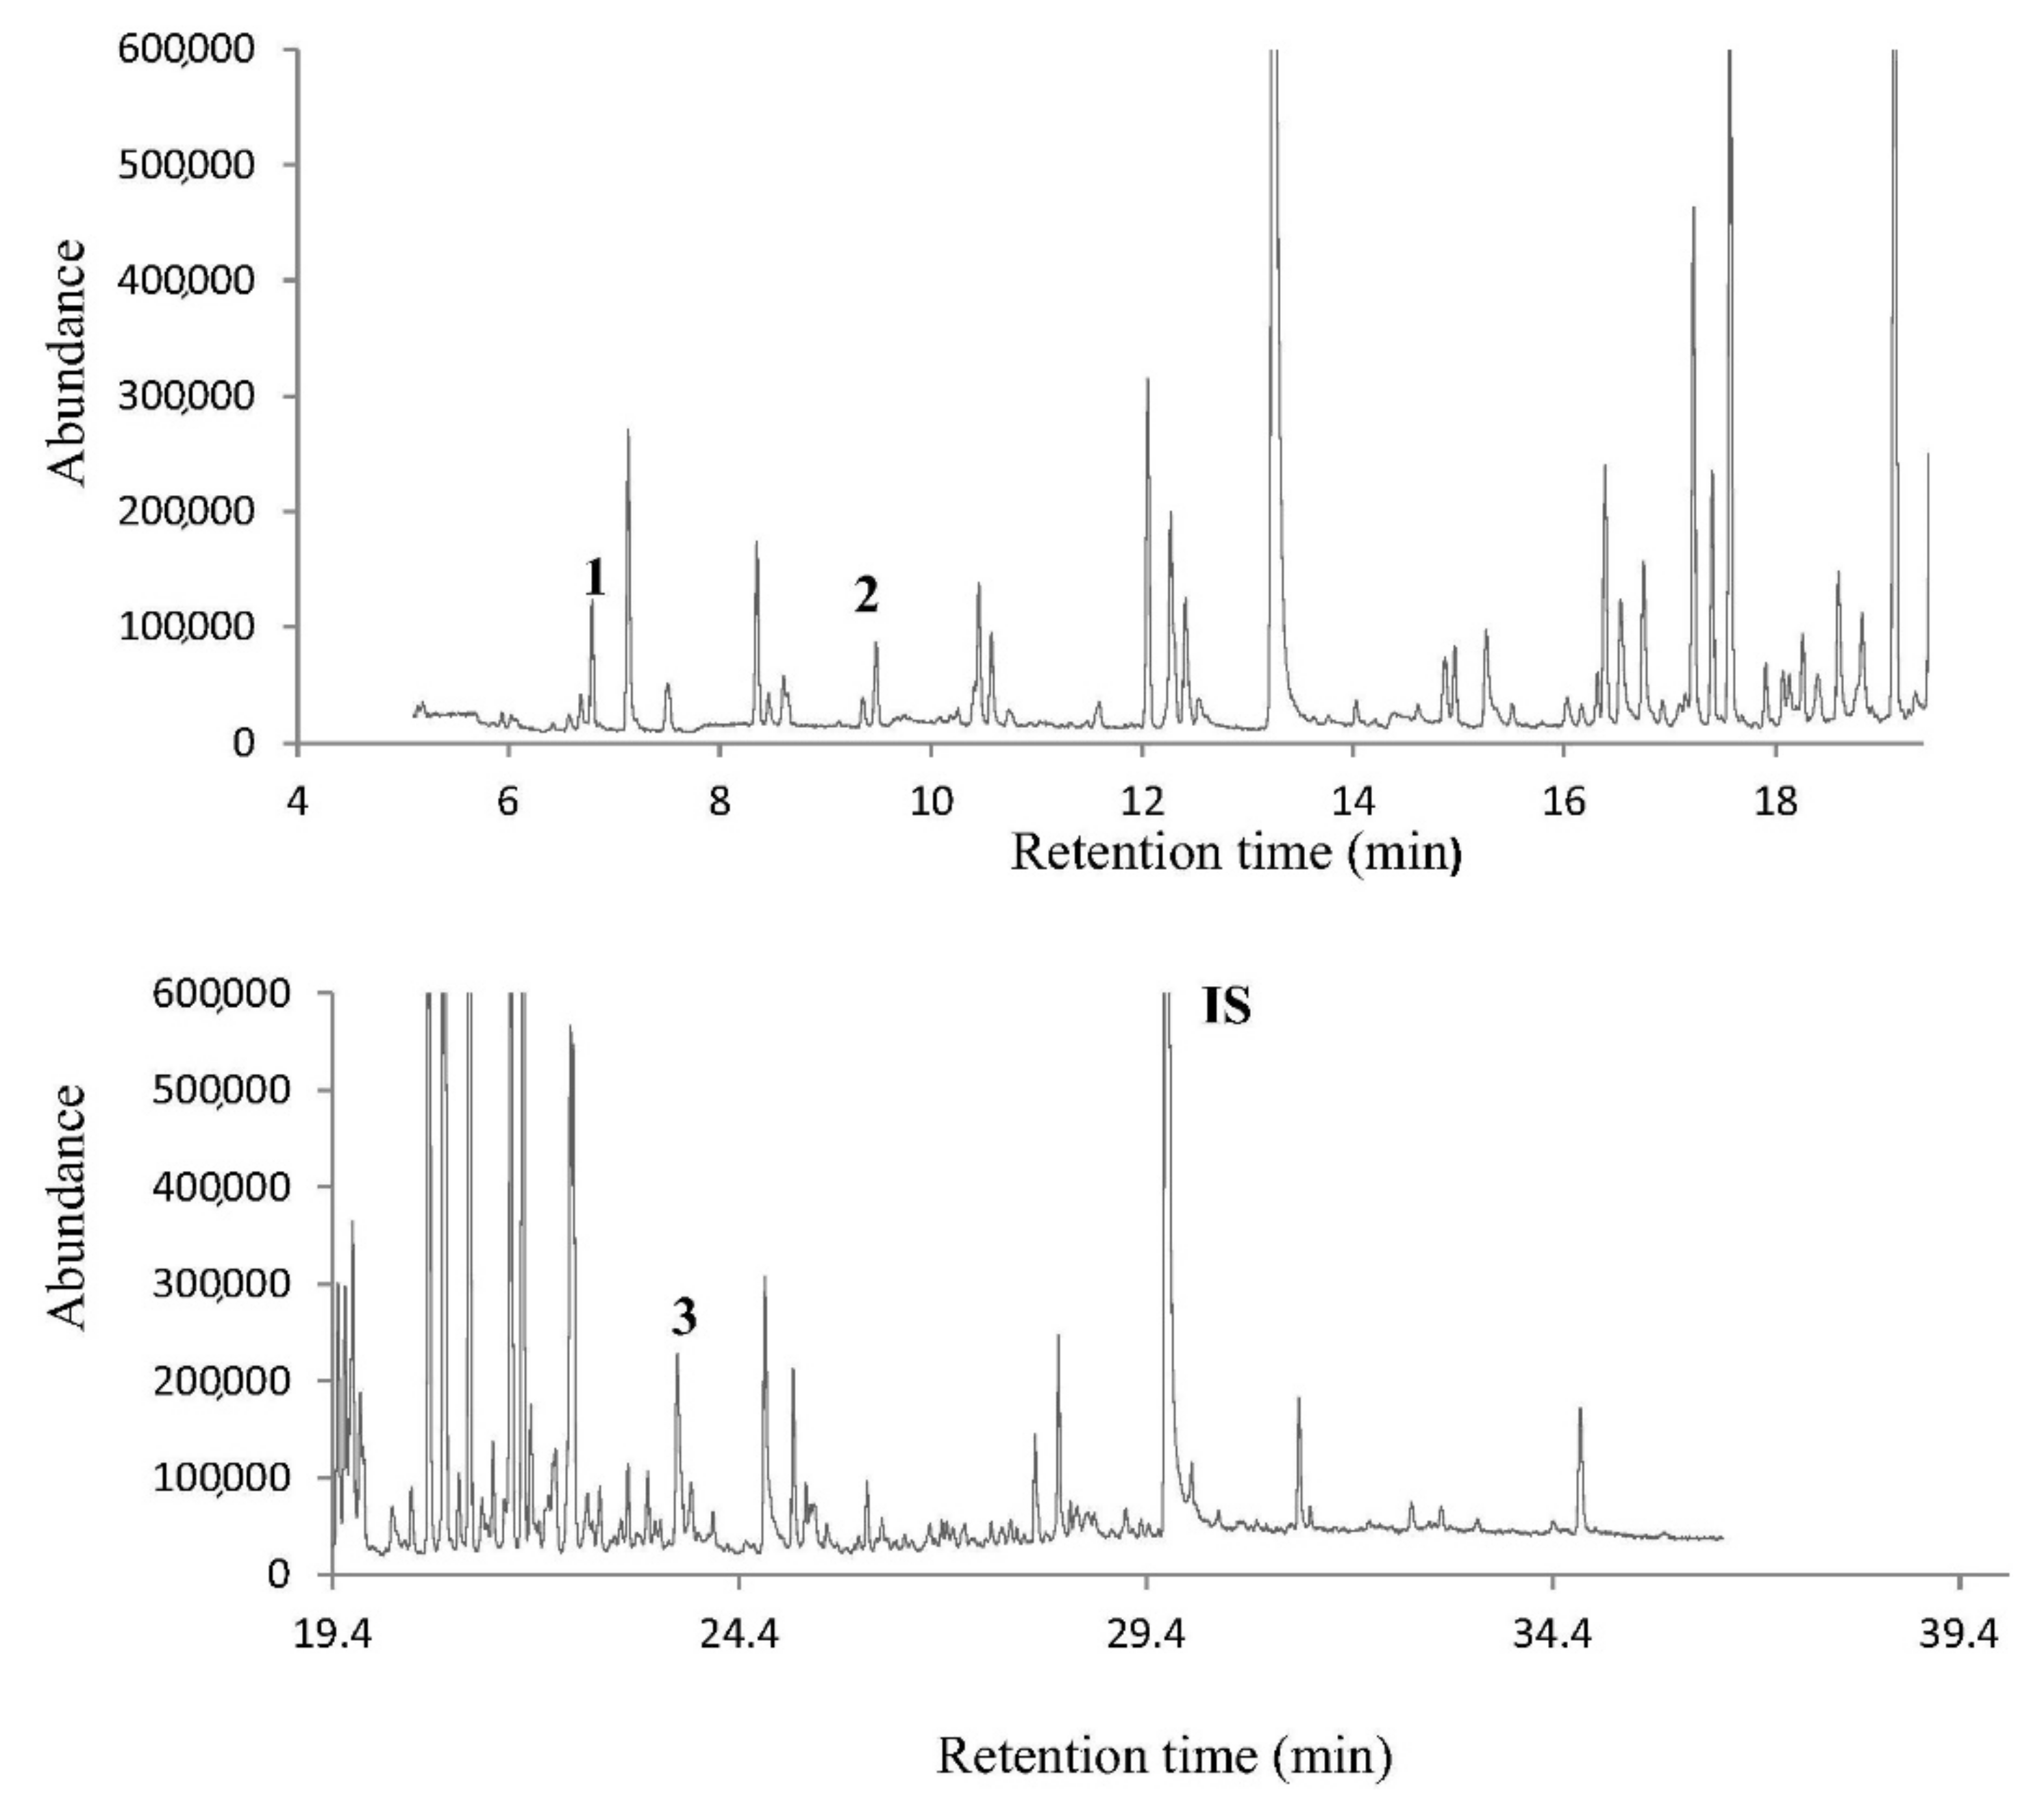
2. Honey Volatile Compounds Analysis Using SPME-GC-MS
2.1. Botanical Characterization of Honey by SPME-GC-MS
2.2. Geographical Characterization of Honey by SPME-GC-MS
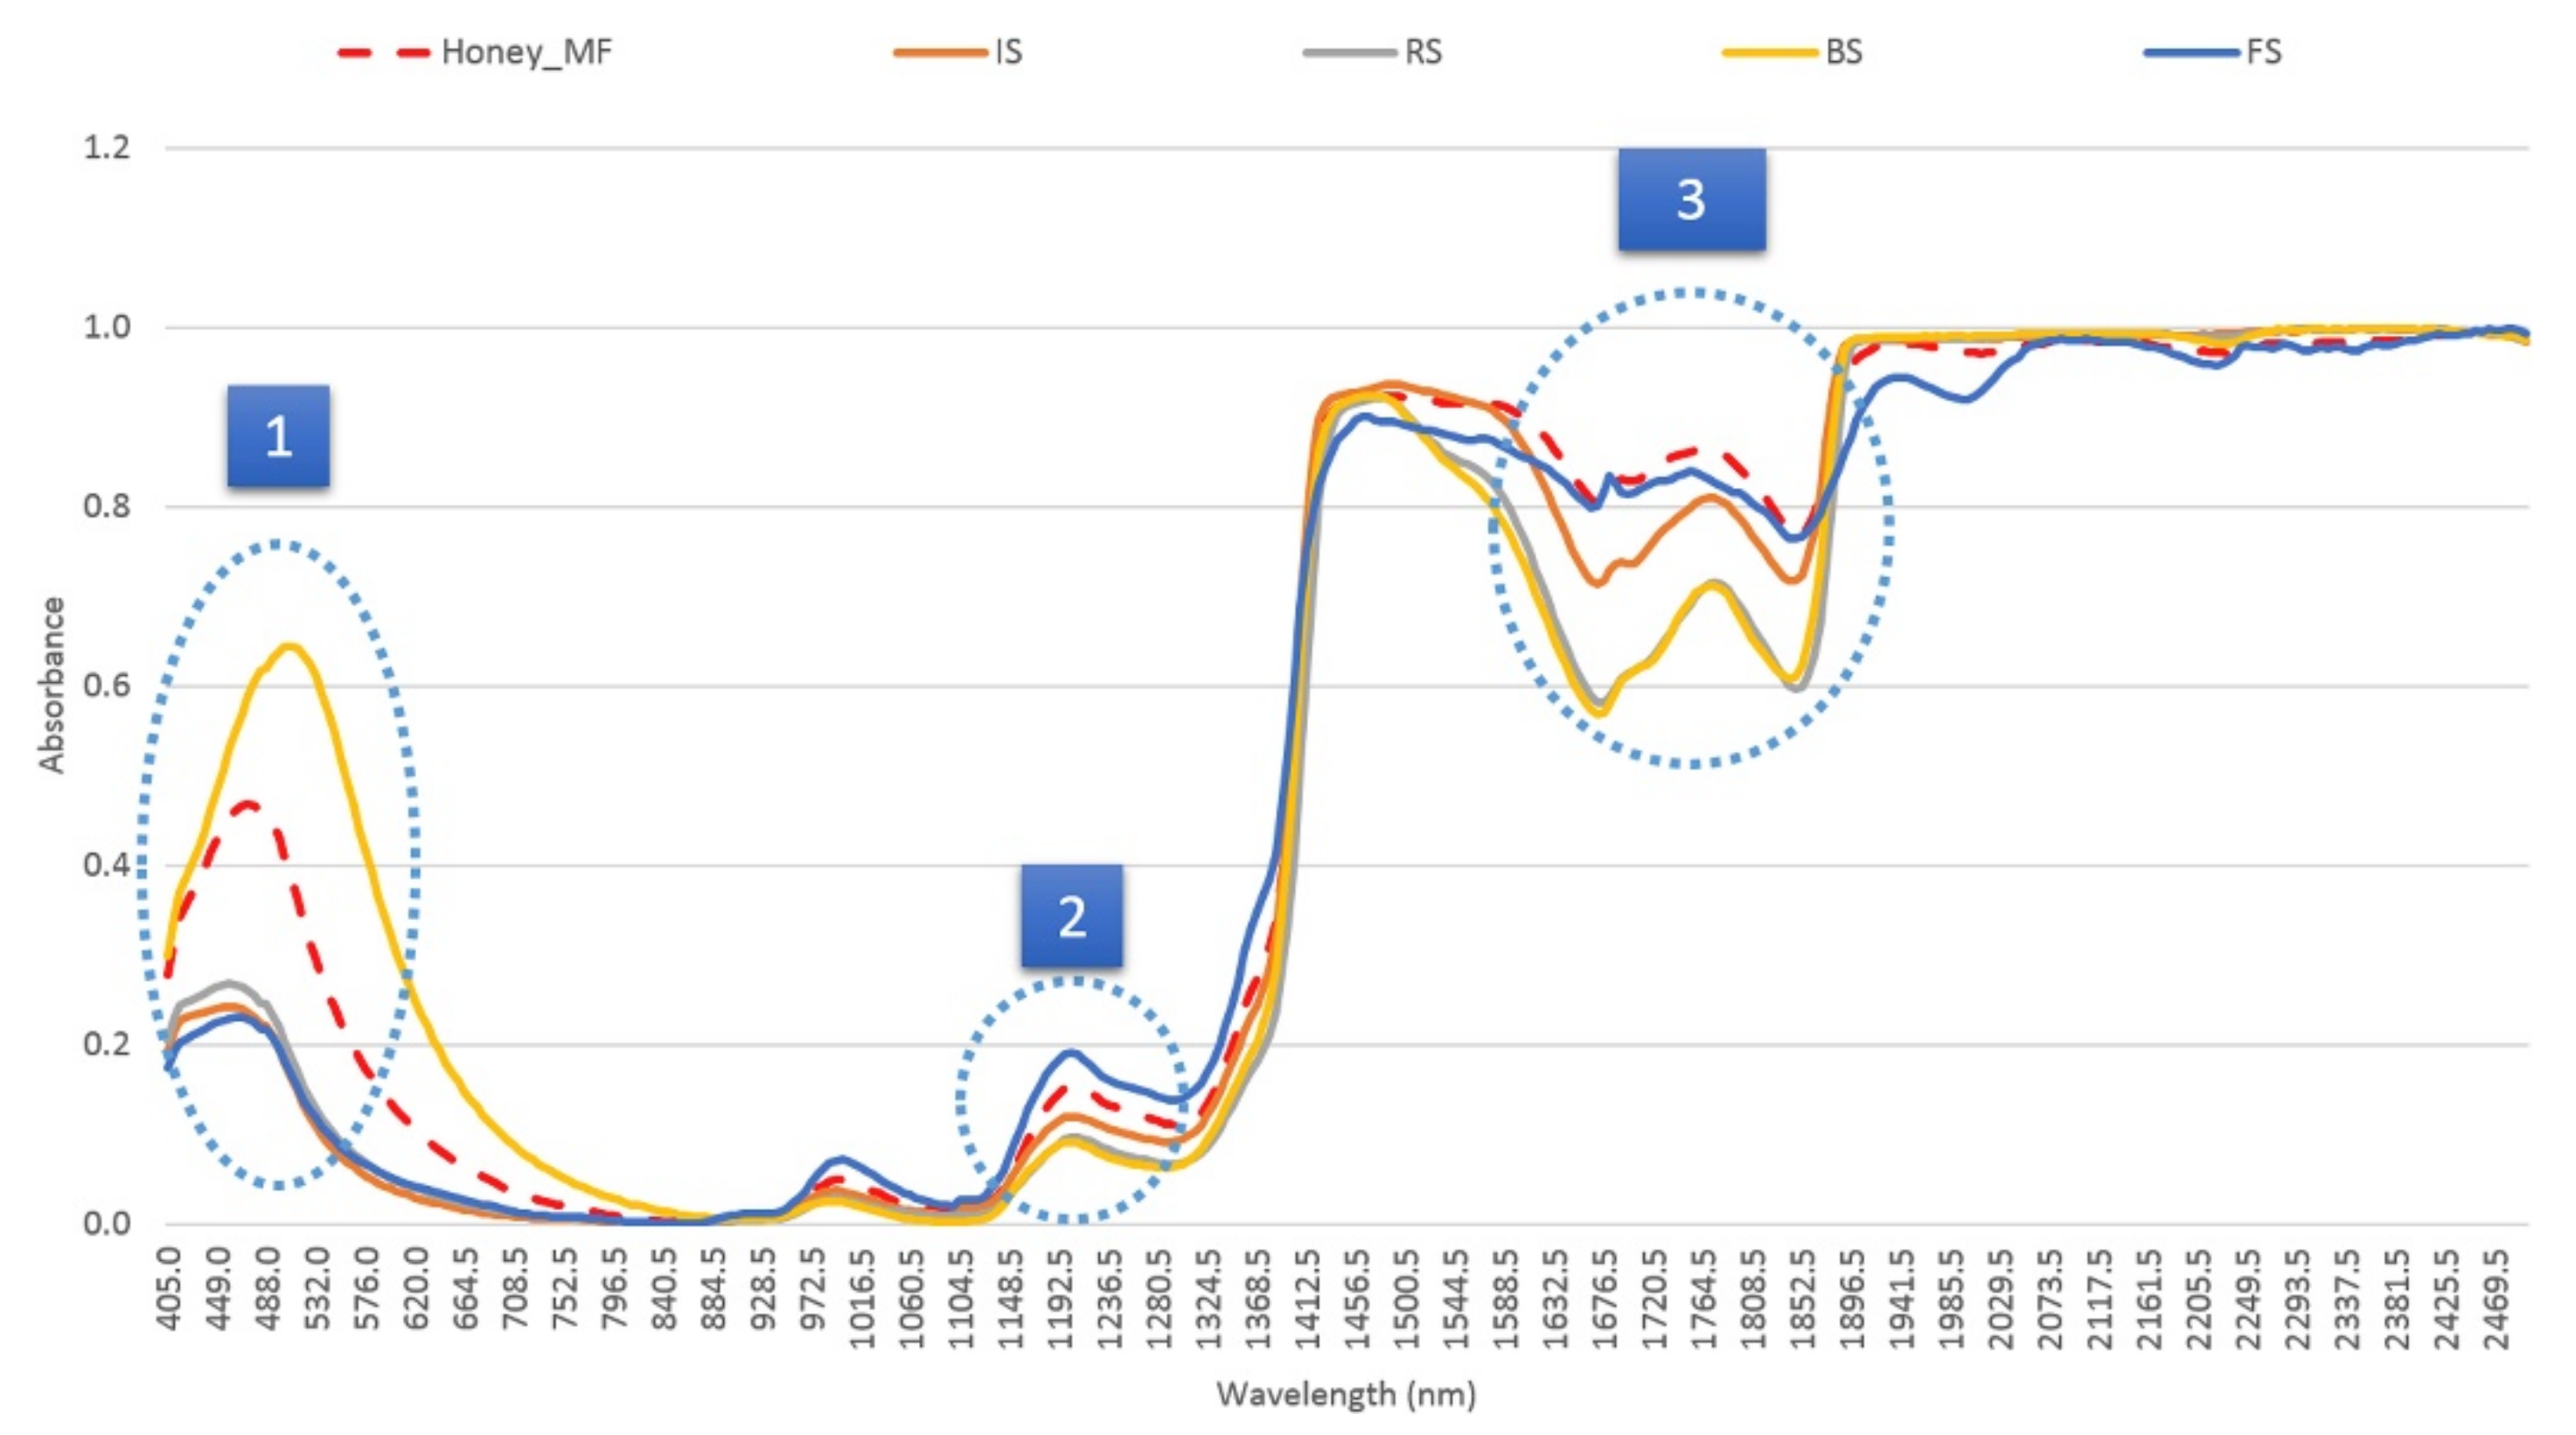
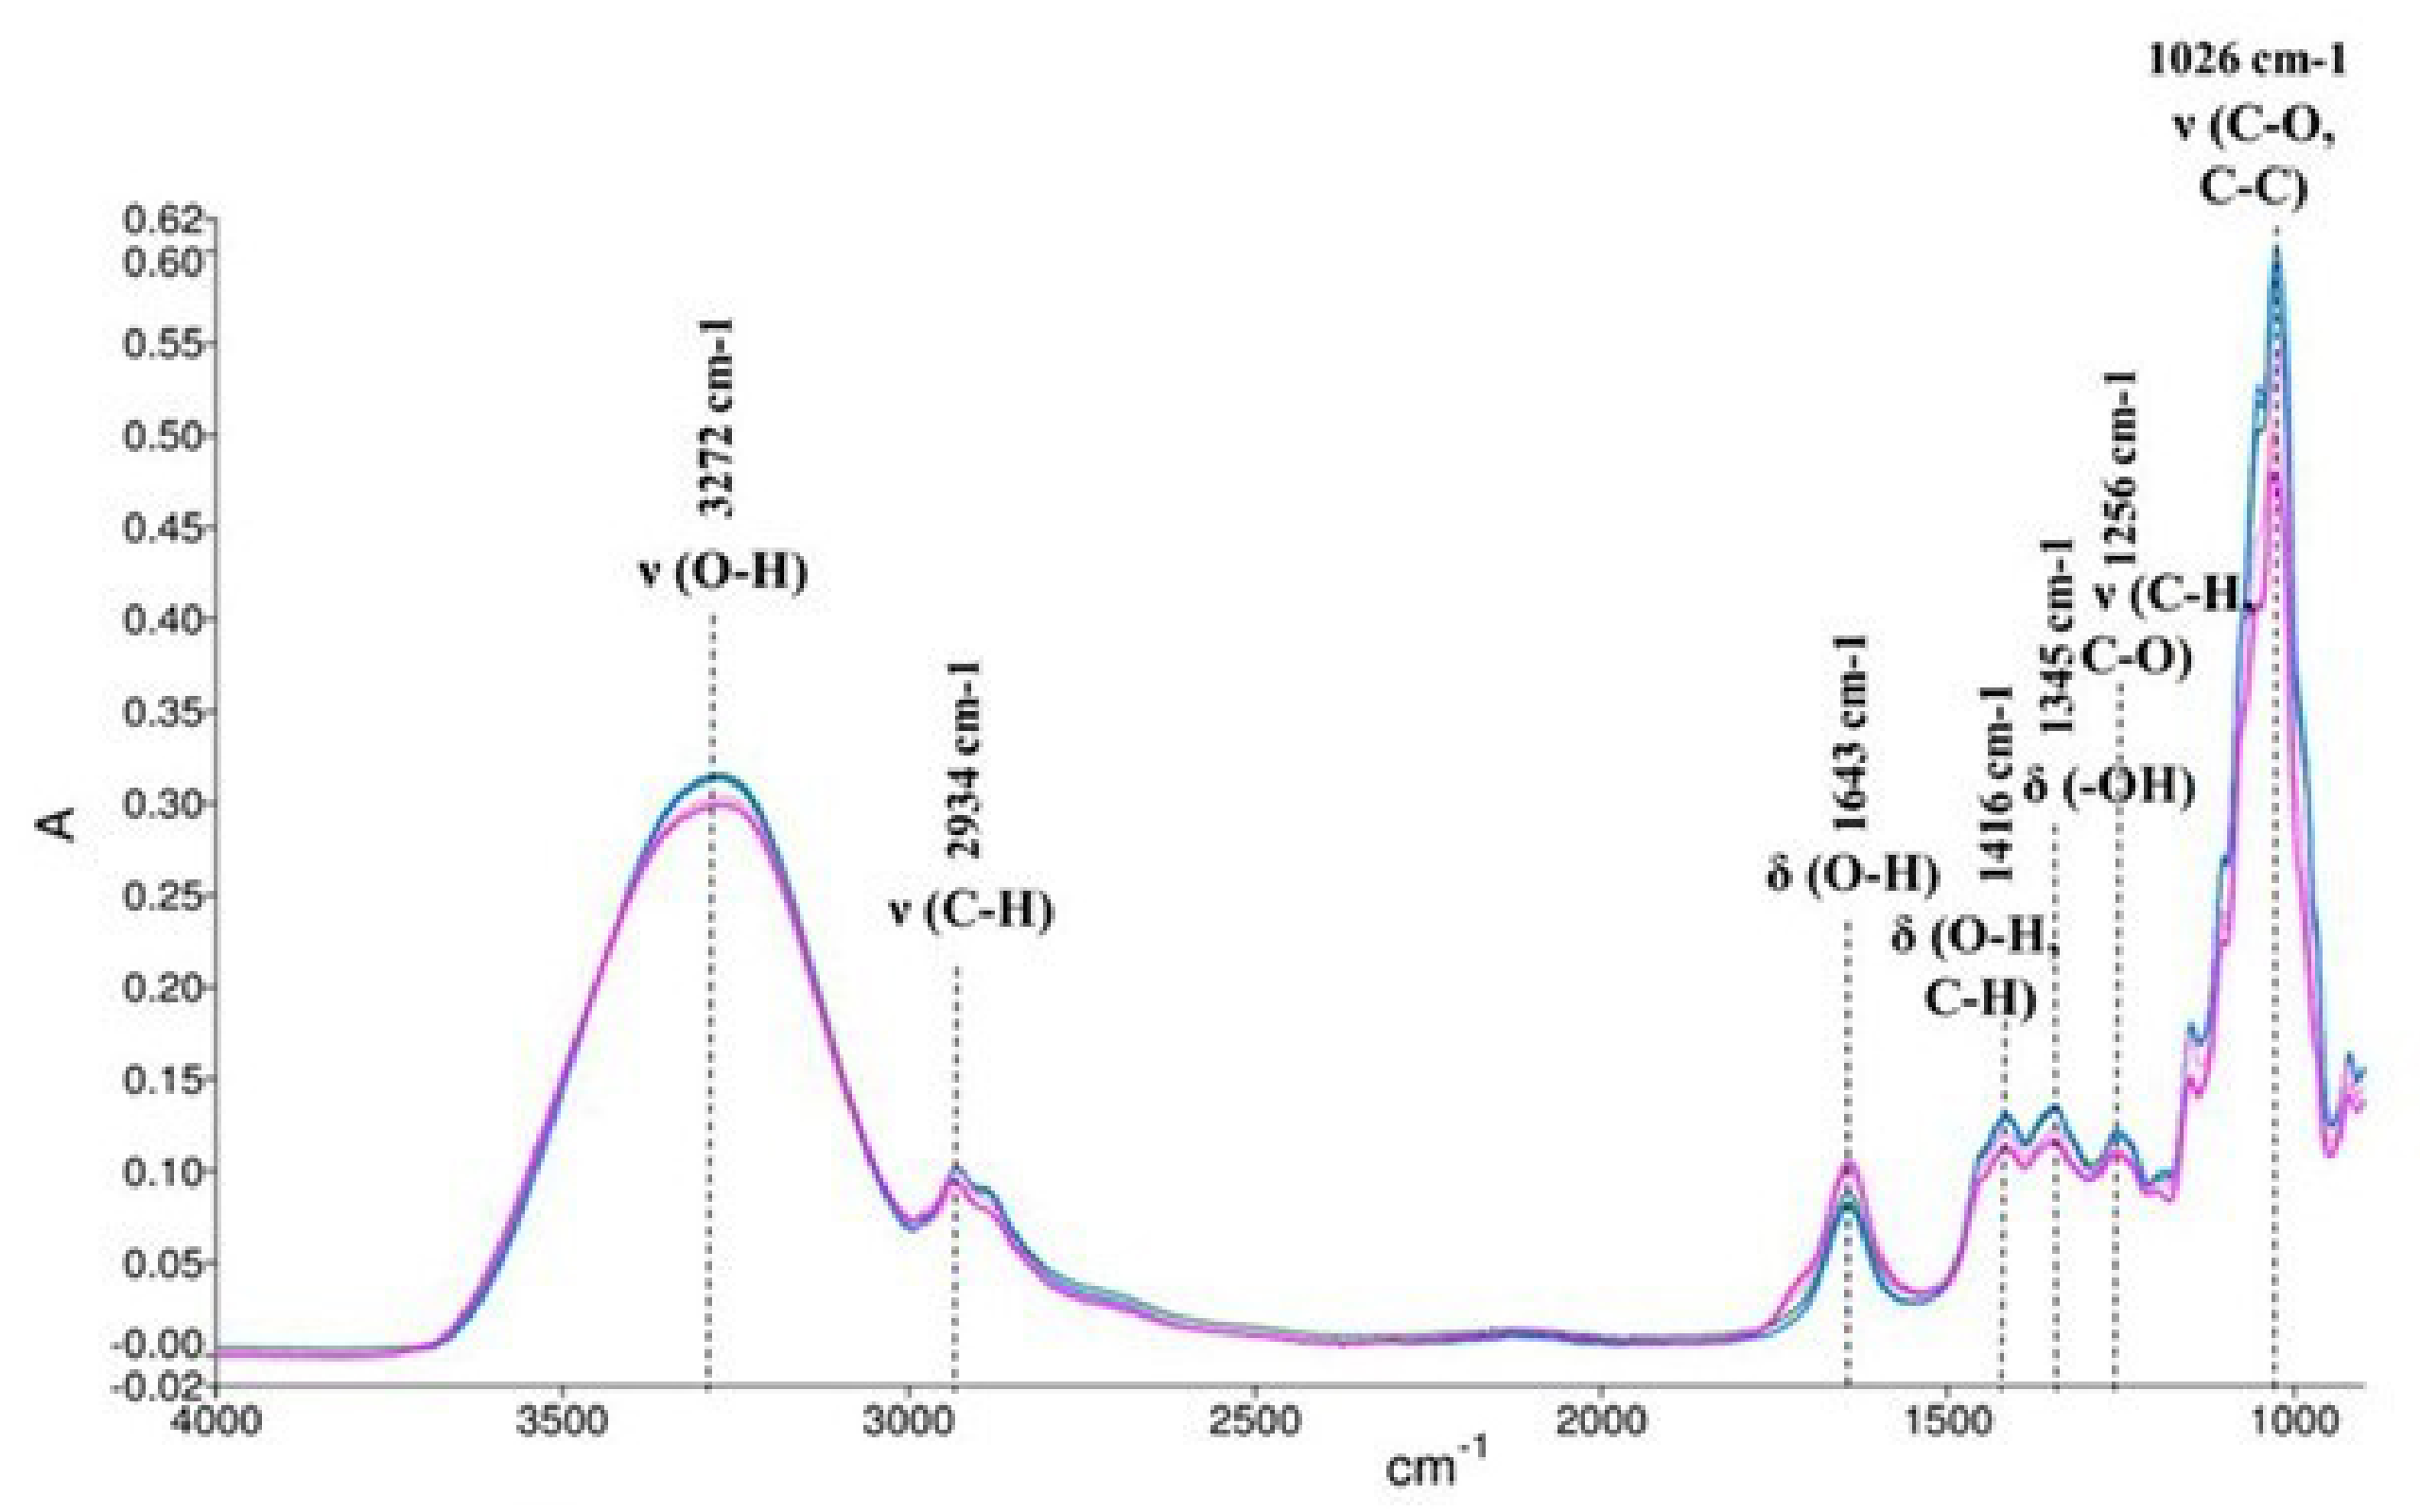
3. Authentication of Honey Using IR Spectroscopy
3.1. Detection of Honey Adulteration Using IR Spectroscopy

| Type of Spectroscopy | Chemometrics Methods | Type of Adulterants | References |
|---|---|---|---|
| ATR-FTIR | PCA, SIMCA, PLS | Fructose syrup, glucose syrup, sucrose syrup, corn syrup, cane sugar | [97] |
| ATR-FTIR | PCA, DA, PLS | Commercial sugars of aren (Arenga pinnata), coconut, cane sugar | [98] |
| ATR-FTIR and Raman | PCA | Sucrose, reducing sugars | [59] |
| MIR and Raman | PLS, Data fusion | High fructose corn syrup, maltose syrup | [57] |
| NIR | DPLS | High fructose corn syrup | [91] |
| NIR | CARS, PLS- LDA | High fructose corn syrup | [93] |
| NIR | PLS-DA | Glucose syrup, fructose syrup, cheap imported honey | [65] |
| NIR | PCA, PLS | Corn syrup, sucrose syrup, high fructose corn syrup, beet syrup, rice syrup | [94] |
| NIR and MIR | PCA, PLS, DA | Rice syrup, corn syrup | [80] |
| NIR and ATR-FIIR | SVM, Data fusion | Type 1: rice and beet syrup, type 2: high fructose corn syrup, corn syrup, maltose syrup, sucrose syrup | [51] |
| Raman | PCA, PLS, artificial neural network ANN | Glucose, fructose, sucrose, maltose | [58] |
| Raman | Adaptive iteratively reweighted penalized least squares airPLS, PLS, DA | High fructose corn syrup, maltose syrup | [64] |
| Raman | SIMCA | Molasses, date molasses, grape molasses, high fructose corn syrup, corn syrup (dark and light), sucrose, inverted sugar | [63] |
| NIR | HCA, PCA, LDA, PLS | High fructose corn syrup | [55] |
| NIR | HCA, LDA, PLS | Inverted sugar, rice syrup, brown cane sugar, fructose syrup | [50] |
3.2. Determination of Honey Origin Using IR Spectroscopy
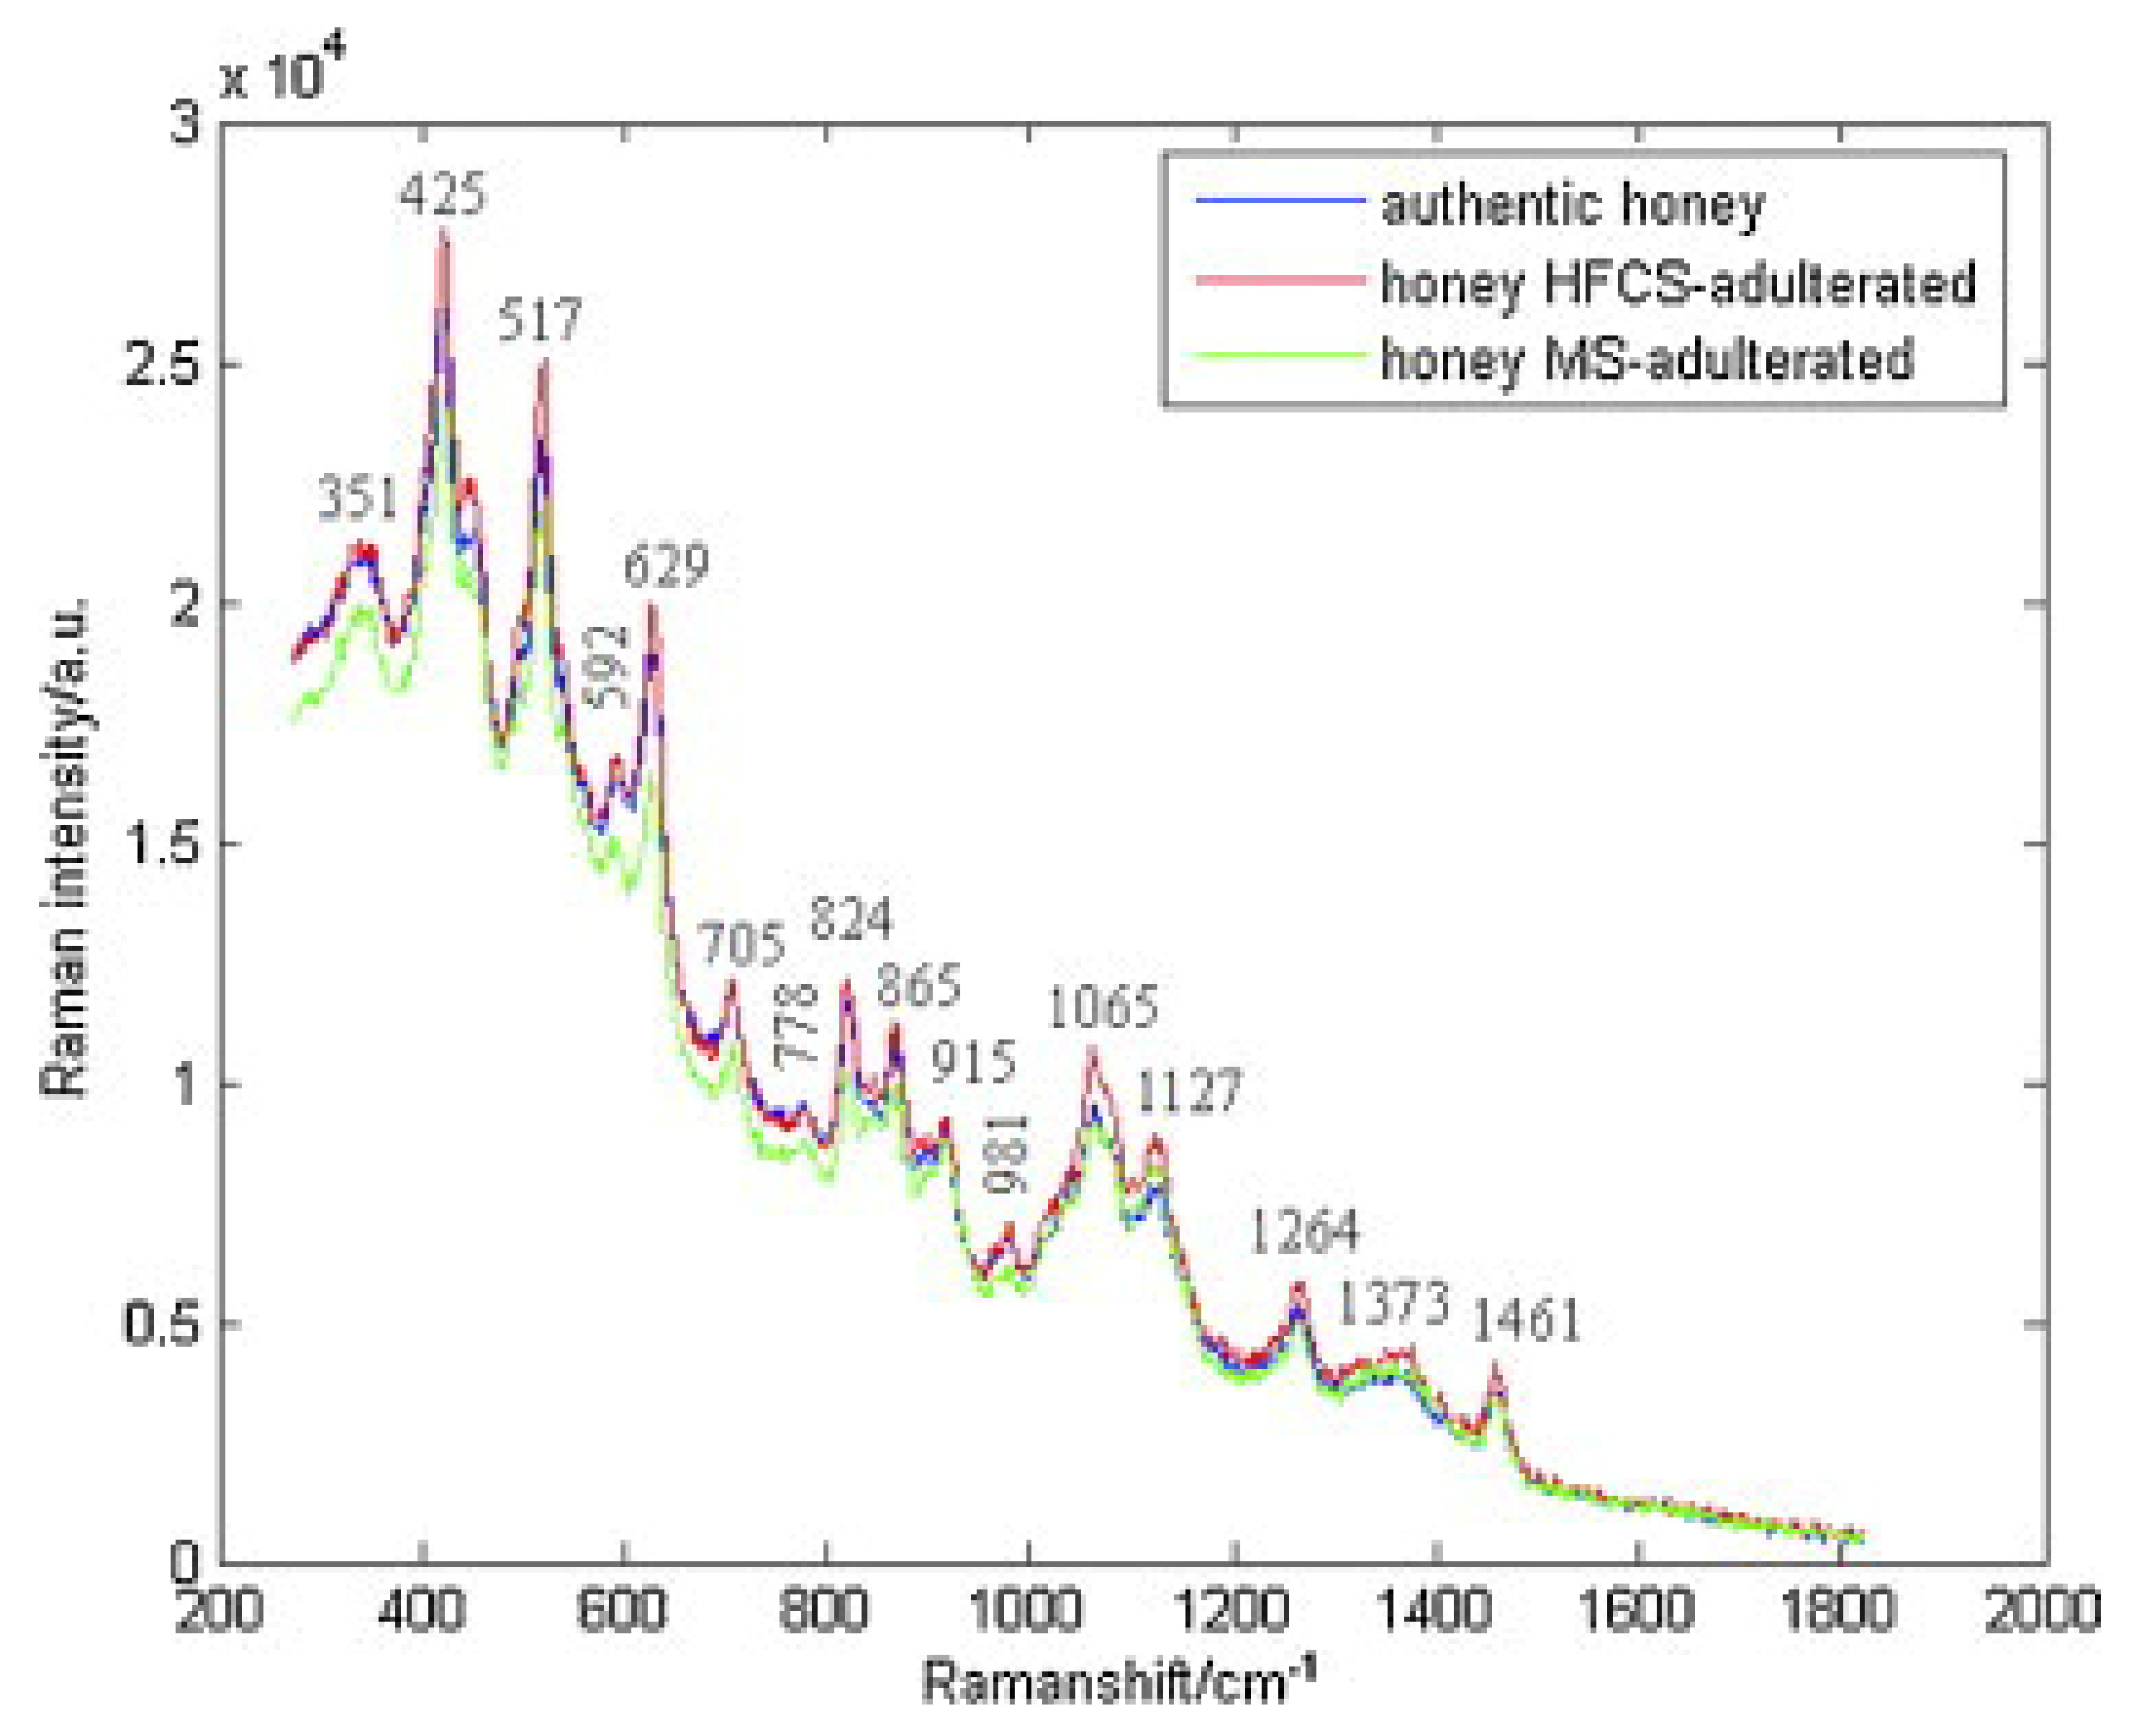
4. Authentication of Honey Using Raman Spectroscopy
4.1. Detection of Honey Adulteration Using Raman Spectroscopy
4.2. Detection of Honey Origin Using Raman Spectroscopy
5. Conclusions
Author Contributions
Funding
Institutional Review Board Statement
Informed Consent Statement
Acknowledgments
Conflicts of Interest
References
- Bianchin, J.N.; Nardini, G.; Merib, J.; Dias, A.N.; Martendal, E.; Carasek, E. Screening of volatile compounds in honey using a new sampling strategy combining multiple extraction temperatures in a single assay by HS-SPME-GC-MS. Food Chem. 2014, 145, 1061–1065. [Google Scholar] [CrossRef]
- Mădaş, N.M.; Mărghitaş, L.A.; Dezmirean, D.S.; Bonta, V.; Bobiş, O.; Fauconnier, M.L.; Francis, F.; Haubruge, E.; Nguyen, K.B. Volatile profile and physico-chemical analysis of acacia honey for geographical origin and nutritional value determination. Foods 2019, 8, 445. [Google Scholar] [CrossRef] [PubMed] [Green Version]
- Castro-Vázquez, L.; Díaz-Maroto, M.C.; de Torres, C.; Pérez-Coello, M.S. Effect of geographical origin on the chemical and sensory characteristics of chestnut honeys. Food Res. Int. 2010, 43, 2335–2340. [Google Scholar] [CrossRef]
- Kuś, P.M.; Jerković, I.; Marijanović, Z.; Kranjac, M.; Tuberoso, C.I.G. Unlocking Phacelia tanacetifolia Benth. honey characterization through melissopalynological analysis, color determination and volatiles chemical profiling. Food Res. Int. 2018, 106, 243–253. [Google Scholar] [CrossRef] [PubMed]
- Alissandrakis, E.; Tarantilis, P.A.; Pappas, C.; Harizanis, P.C.; Polissiou, M. Investigation of organic extractives from unifloral chestnut (Castanea sativa L.) and eucalyptus (Eucalyptus globulus Labill.) honeys and flowers to identification of botanical marker compounds. LWT Food Sci. Technol. 2011, 44, 1042–1051. [Google Scholar] [CrossRef]
- Da Silva, P.M.; Gauche, C.; Gonzaga, L.V.; Costa, A.C.O.; Fett, R. Honey: Chemical composition, stability and authenticity. Food Chem. 2016, 196, 309–323. [Google Scholar] [CrossRef]
- Siddiqui, A.J.; Musharraf, S.G.; Choudhary, M.I.; Rahman, A. ur Application of analytical methods in authentication and adulteration of honey. Food Chem. 2017, 217, 687–698. [Google Scholar] [CrossRef]
- Ciotlaus, I.; Balea, A.; Pojar-Fenesan, M.; Petean, I. Cromathographic profile of volatiles of multifloral and unifloral honey collected by apis mellifera from Transilvania, Romania. Rev. Chim. 2020, 71, 91–99. [Google Scholar] [CrossRef]
- Devi, A.; Jangir, J.; Anu-Appaiah, K.A. Chemical characterization complemented with chemometrics for the botanical origin identification of unifloral and multifloral honeys from India. Food Res. Int. 2018, 107, 216–226. [Google Scholar] [CrossRef]
- De Lima Morais da Silva, P.; de Lima, L.S.; Caetano, Í.K.; Torres, Y.R. Comparative analysis of the volatile composition of honeys from Brazilian stingless bees by static headspace GC–MS. Food Res. Int. 2017, 102, 536–543. [Google Scholar] [CrossRef] [PubMed]
- Escriche, I.; Visquert, M.; Juan-Borrás, M.; Fito, P. Influence of simulated industrial thermal treatments on the volatile fractions of different varieties of honey. Food Chem. 2009, 112, 329–338. [Google Scholar] [CrossRef]
- Kaškoniene, V.; Venskutonis, P.R.; Čeksteryte, V. Composition of volatile compounds of honey of various floral origin and beebread collected in Lithuania. Food Chem. 2008, 111, 988–997. [Google Scholar] [CrossRef]
- Kortesniemi, M.; Rosenvald, S.; Laaksonen, O.; Vanag, A.; Ollikka, T.; Vene, K.; Yang, B. Sensory and chemical profiles of Finnish honeys of different botanical origins and consumer preferences. Food Chem. 2018, 246, 351–359. [Google Scholar] [CrossRef] [PubMed]
- Acevedo, F.; Torres, P.; Oomah, B.D.; de Alencar, S.M.; Massarioli, A.P.; Martín-Venegas, R.; Albarral-Ávila, V.; Burgos-Díaz, C.; Ferrer, R.; Rubilar, M. Volatile and non-volatile/semi-volatile compounds and in vitro bioactive properties of Chilean Ulmo (Eucryphia cordifolia Cav.) honey. Food Res. Int. 2017, 94, 20–28. [Google Scholar] [CrossRef] [PubMed]
- Aliaño-González, M.J.; Ferreiro-González, M.; Espada-Bellido, E.; Barbero, G.F.; Palma, M. Novel method based on ion mobility spectroscopy for the quantification of adulterants in honeys. Food Control. 2020, 114, 107236. [Google Scholar] [CrossRef]
- Ballabio, D.; Robotti, E.; Grisoni, F.; Quasso, F.; Bobba, M.; Vercelli, S.; Gosetti, F.; Calabrese, G.; Sangiorgi, E.; Orlandi, M.; et al. Chemical profiling and multivariate data fusion methods for the identification of the botanical origin of honey. Food Chem. 2018, 266, 79–89. [Google Scholar] [CrossRef]
- Bianchi, F.; Mangia, A.; Mattarozzi, M.; Musci, M. Characterization of the volatile profile of thistle honey using headspace solid-phase microextraction and gas chromatography-mass spectrometry. Food Chem. 2011, 129, 1030–1036. [Google Scholar] [CrossRef]
- Patrignani, M.; Fagúndez, G.A.; Tananaki, C.; Thrasyvoulou, A.; Lupano, C.E. Volatile compounds of Argentinean honeys: Correlation with floral and geographical origin. Food Chem. 2018, 246, 32–40. [Google Scholar] [CrossRef]
- Stanimirova, I.; Üstün, B.; Cajka, T.; Riddelova, K.; Hajslova, J.; Buydens, L.M.C.; Walczak, B. Tracing the geographical origin of honeys based on volatile compounds profiles assessment using pattern recognition techniques. Food Chem. 2010, 118, 171–176. [Google Scholar] [CrossRef]
- Castro-Vázquez, L.; Leon-Ruiz, V.; Alañon, M.E.; Pérez-Coello, M.S.; González-Porto, A.V. Floral origin markers for authenticating Lavandin honey (Lavandula angustifolia × latifolia). Discrimination from Lavender honey (Lavandula latifolia). Food Control 2014, 37, 362–370. [Google Scholar] [CrossRef]
- Da Costa, A.C.V.; Sousa, J.M.B.; da Silva, M.A.A.P.; dos Garruti, D.S.; Madruga, M.S. Sensory and volatile profiles of monofloral honeys produced by native stingless bees of the brazilian semiarid region. Food Res. Int. 2018, 105, 110–120. [Google Scholar] [CrossRef]
- Castro-Vázquez, L.; Díaz-Maroto, M.C.; González-Viñas, M.A.; Pérez-Coello, M.S. Differentiation of monofloral citrus, rosemary, eucalyptus, lavender, thyme and heather honeys based on volatile composition and sensory descriptive analysis. Food Chem. 2009, 112, 1022–1030. [Google Scholar] [CrossRef]
- Escriche, I.; Kadar, M.; Juan-Borrás, M.; Domenech, E. Using flavonoids, phenolic compounds and headspace volatile profile for botanical authentication of lemon and orange honeys. Food Res. Int. 2011, 44, 1504–1513. [Google Scholar] [CrossRef]
- Escriche, I.; Sobrino-Gregorio, L.; Conchado, A.; Juan-Borrás, M. Volatile profile in the accurate labelling of monofloral honey. The case of lavender and thyme honey. Food Chem. 2017, 226, 61–68. [Google Scholar] [CrossRef] [PubMed]
- Juan-Borrás, M.; Domenech, E.; Hellebrandova, M.; Escriche, I. Effect of country origin on physicochemical, sugar and volatile composition of acacia, sunflower and tilia honeys. Food Res. Int. 2014, 60, 86–94. [Google Scholar] [CrossRef]
- Soria, A.C.; Martínez-Castro, I.; Sanz, J. Some aspects of dynamic headspace analysis of volatile components in honey. Food Res. Int. 2008, 41, 838–848. [Google Scholar] [CrossRef]
- Jerković, I.; Tuberoso, C.I.G.; Marijanović, Z.; Jelić, M.; Kasum, A. Headspace, volatile and semi-volatile patterns of Paliurus spina-christi unifloral honey as markers of botanical origin. Food Chem. 2009, 112, 239–245. [Google Scholar] [CrossRef]
- Albergamo, A.; Mottese, A.F.; Bua, G.D.; Caridi, F.; Sabatino, G.; Barrega, L.; Costa, R.; Dugo, G. Discrimination of the Sicilian Prickly Pear (Opuntia Ficus-Indica L., CV. Muscaredda) According to the Provenance by Testing Unsupervised and Supervised Chemometrics. J. Food Sci. 2018, 83, 2933–2942. [Google Scholar] [CrossRef]
- Dorota, D.; Rupert, M.; Wołosiak, R.; Bzducha-Wróbel, A.; Ścibisz, I.; Matuszewska-Janica, A. Volatiles as markers of bioactive components found in Croatian extra virgin olive oils. LWT 2021, 139, 110532. [Google Scholar] [CrossRef]
- Gatzias, I.S.; Karabagias, I.K.; Kontominas, M.G.; Badeka, A.V. Geographical differentiation of feta cheese from northern Greece based on physicochemical parameters, volatile compounds and fatty acids. LWT 2020, 131, 109615. [Google Scholar] [CrossRef]
- Micić, D.; Ostojić, S.; Pezo, L.; Blagojević, S.; Pavlić, B.; Zeković, Z.; Đurović, S. Essential oils of coriander and sage: Investigation of chemical profile, thermal properties and QSRR analysis. Ind. Crops Prod. 2019, 138, 111438. [Google Scholar] [CrossRef]
- Moniruzzaman, M.; Rodríguez, I.; Ramil, M.; Cela, R.; Sulaiman, S.A.; Gan, S.H. Assessment of gas chromatography time-of-flight accurate mass spectrometry for identification of volatile and semi-volatile compounds in honey. Talanta 2014, 129, 505–515. [Google Scholar] [CrossRef]
- Salvo, A.; Costa, R.; Albergamo, A.; Arrigo, S.; Rotondo, A.; La Torre, G.L.; Mangano, V.; Dugo, G. An in-depth study of the volatile variability of chinotto (Citrus myrtifolia Raf.) induced by the extraction procedure. Eur. Food Res. Technol. 2019, 245, 873–883. [Google Scholar] [CrossRef]
- Šiškovič, N.; Strojnik, L.; Grebenc, T.; Vidrih, R.; Ogrinc, N. Differentiation between species and regional origin of fresh and freeze-dried truffles according to their volatile profiles. Food Control 2021, 123, 107698. [Google Scholar] [CrossRef]
- Soria, A.C.; Martínez-Castro, I.; Sanz, J. Study of the precision in the purge-and-trap-gas chromatography-mass spectrometry analysis of volatile compounds in honey. J. Chromatogr. A 2009, 1216, 3300–3304. [Google Scholar] [CrossRef] [Green Version]
- Tufariello, M.; Pati, S.; D’Amico, L.; Bleve, G.; Losito, I.; Grieco, F. Quantitative issues related to the headspace-SPME-GC/MS analysis of volatile compounds in wines: The case of Maresco sparkling wine. LWT 2019, 108, 268–276. [Google Scholar] [CrossRef]
- Plutowska, B.; Chmiel, T.; Dymerski, T.; Wardencki, W. A headspace solid-phase microextraction method development and its application in the determination of volatiles in honeys by gas chromatography. Food Chem. 2011, 126, 1288–1298. [Google Scholar] [CrossRef]
- Seisonen, S.; Kivima, E.; Vene, K. Characterisation of the aroma profiles of different honeys and corresponding flowers using solid-phase microextraction and gas chromatography-mass spectrometry/olfactometry. Food Chem. 2015, 169, 34–40. [Google Scholar] [CrossRef]
- Boyce, M.C.; White, J.; Hudson, D.; Malajczuk, N.; Bennett, I.J. Characterisation of Tuber melanosporum (Perigord Black Truffle) of French and Australian Origin Using Solid-Phase Microextraction. Int. J. Chromatogr. 2018, 10, 115. [Google Scholar]
- Costa, R.; Albergamo, A.; Arrigo, S.; Gentile, F.; Dugo, G. Solid-phase microextraction-gas chromatography and ultra-high performance liquid chromatography applied to the characterization of lemon wax, a waste product from citrus industry. J. Chromatogr. A 2019, 1603, 262–268. [Google Scholar] [CrossRef] [PubMed]
- Cuevas-Glory, L.F.; Pino, J.A.; Santiago, L.S.; Sauri-Duch, E. A review of volatile analytical methods for determining the botanical origin of honey. Food Chem. 2007, 103, 1032–1043. [Google Scholar] [CrossRef]
- Dias, L.G.; Hacke, A.; Bergara, S.F.; Villela, O.V.; Mariutti, L.R.B.; Bragagnolo, N. Identification of volatiles and odor-active compounds of aromatic rice by OSME analysis and SPME/GC-MS. Food Res. Int. 2021, 142, 110206. [Google Scholar] [CrossRef]
- Díaz, P.; Ibáñez, E.; Reglero, G.; Señoráns, F.J. Optimization of summer truffle aroma analysis by SPME: Comparison of extraction with different polarity fibres. LWT Food Sci. Technol. 2009, 42, 1253–1259. [Google Scholar] [CrossRef]
- Farag, M.A.; Hegazi, N.; Dokhalahy, E.; Khattab, A.R. Chemometrics based GC-MS aroma profiling for revealing freshness, origin and roasting indices in saffron spice and its adulteration. Food Chem. 2020, 331, 127358. [Google Scholar] [CrossRef] [PubMed]
- Frank, N.; Dubois, M.; Huertas Pérez, J.F. Detection of Furan and five Alkylfurans, including 2-Pentylfuran, in various Food Matrices. J. Chromatogr. A 2020, 1622, 461119. [Google Scholar] [CrossRef]
- Hou, J.; Liang, L.; Wang, Y. Volatile composition changes in navel orange at different growth stages by HS-SPME–GC–MS. Food Res. Int. 2020, 136, 109333. [Google Scholar] [CrossRef] [PubMed]
- Aliferis, K.A.; Tarantilis, P.A.; Harizanis, P.C.; Alissandrakis, E. Botanical discrimination and classification of honey samples applying gas chromatography/mass spectrometry fingerprinting of headspace volatile compounds. Food Chem. 2010, 121, 856–862. [Google Scholar] [CrossRef]
- Karabagias, I.K.; Louppis, A.P.; Karabournioti, S.; Kontakos, S.; Papastephanou, C.; Kontominas, M.G. Characterization and geographical discrimination of commercial Citrus spp. honeys produced in different Mediterranean countries based on minerals, volatile compounds and physicochemical parameters, using chemometrics. Food Chem. 2017, 217, 445–455. [Google Scholar] [CrossRef]
- WHO; FAO. Codex Alimentarius Commission and Council Directive 2001/110/EC of 20 December 2001 Relating to Honey. In Codex Alimentarius; CXS 12-1981; Codex Alimentarius Commission: Rome, Italy, 2001; pp. 1–8. [Google Scholar]
- Aliaño-González, M.J.; Ferreiro-González, M.; Espada-Bellido, E.; Palma, M.; Barbero, G.F. A screening method based on Visible-NIR spectroscopy for the identification and quantification of different adulterants in high-quality honey. Talanta 2019, 203, 235–241. [Google Scholar] [CrossRef]
- Huang, F.; Song, H.; Guo, L.; Guang, P.; Yang, X.; Li, L.; Zhao, H.; Yang, M. Detection of adulteration in Chinese honey using NIR and ATR-FTIR spectral data fusion. Spectrochim. Acta Part A Mol. Biomol. Spectrosc. 2020, 235, 118297. [Google Scholar] [CrossRef]
- Arroyo-Manzanares, N.; García-Nicolás, M.; Castell, A.; Campillo, N.; Viñas, P.; López-García, I.; Hernández-Córdoba, M. Untargeted headspace gas chromatography—Ion mobility spectrometry analysis for detection of adulterated honey. Talanta 2019, 205, 120123. [Google Scholar] [CrossRef]
- Esteki, M.; Simal-Gandara, J.; Shahsavari, Z.; Zandbaaf, S.; Dashtaki, E.; Vander Heyden, Y. A review on the application of chromatographic methods, coupled to chemometrics, for food authentication. Food Control 2018, 93, 165–182. [Google Scholar] [CrossRef]
- Anjos, O.; Santos, A.J.A.; Paixão, V.; Estevinho, L.M. Physicochemical characterization of Lavandula spp. honey with FT-Raman spectroscopy. Talanta 2018, 178, 43–48. [Google Scholar] [CrossRef] [PubMed] [Green Version]
- Ferreiro-González, M.; Espada-Bellido, E.; Guillén-Cueto, L.; Palma, M.; Barroso, C.G.; Barbero, G.F. Rapid quantification of honey adulteration by visible-near infrared spectroscopy combined with chemometrics. Talanta 2018, 188, 288–292. [Google Scholar] [CrossRef] [PubMed]
- Jandrić, Z.; Haughey, S.A.; Frew, R.D.; McComb, K.; Galvin-King, P.; Elliott, C.T.; Cannavan, A. Discrimination of honey of different floral origins by a combination of various chemical parameters. Food Chem. 2015, 189, 52–59. [Google Scholar] [CrossRef]
- Li, Y.; Huang, Y.; Xia, J.; Xiong, Y.; Min, S. Quantitative analysis of honey adulteration by spectrum analysis combined with several high-level data fusion strategies. Vib. Spectrosc. 2020, 108, 103060. [Google Scholar] [CrossRef]
- Özbalci, B.; Boyaci, I.H.; Topcu, A.; Kadilar, C.; Tamer, U. Rapid analysis of sugars in honey by processing Raman spectrum using chemometric methods and artificial neural networks. Food Chem. 2013, 136, 1444–1452. [Google Scholar] [CrossRef]
- Salvador, L.; Guijarro, M.; Rubio, D.; Aucatoma, B.; Guillén, T.; Jentzsch, P.V.; Ciobotă, V.; Stolker, L.; Ulic, S.; Vásquez, L.; et al. Exploratory monitoring of the quality and authenticity of commercial honey in Ecuador. Foods 2019, 8, 105. [Google Scholar] [CrossRef] [Green Version]
- Karabagias, I.K.; Badeka, A.V.; Kontakos, S.; Karabournioti, S.; Kontominas, M.G. Botanical discrimination of Greek unifloral honeys with physico-chemical and chemometric analyses. Food Chem. 2014, 165, 181–190. [Google Scholar] [CrossRef]
- Karabagias, I.K.; Badeka, A.; Kontakos, S.; Karabournioti, S.; Kontominas, M.G. Characterization and classification of Thymus capitatus (L.) honey according to geographical origin based on volatile compounds, physicochemical parameters and chemometrics. Food Res. Int. 2014, 55, 363–372. [Google Scholar] [CrossRef]
- Karabagias, I.K.; Badeka, A.; Kontakos, S.; Karabournioti, S.; Kontominas, M.G. Characterisation and classification of Greek pine honeys according to their geographical origin based on volatiles, physicochemical parameters and chemometrics. Food Chem. 2014, 146, 548–557. [Google Scholar] [CrossRef] [PubMed]
- Aykas, D.P.; Shotts, M.-L.; Rodriguez-Saona, L.E. Authentication of commercial honeys based on Raman fingerprinting and pattern recognition analysis. Food Control 2020, 117, 107346. [Google Scholar] [CrossRef]
- Li, S.; Shan, Y.; Zhu, X.; Zhang, X.; Ling, G. Detection of honey adulteration by high fructose corn syrup and maltose syrup using Raman spectroscopy. J. Food Compos. Anal. 2012, 28, 69–74. [Google Scholar] [CrossRef]
- Guelpa, A.; Marini, F.; du Plessis, A.; Slabbert, R.; Manley, M. Verification of authenticity and fraud detection in South African honey using NIR spectroscopy. Food Control 2017, 73, 1388–1396. [Google Scholar] [CrossRef]
- Basalekou, M.; Pappas, C.; Tarantilis, P.; Kotseridis, Y.; Kallithraka, S. Wine authentication with Fourier Transform Infrared Spectroscopy: A feasibility study on variety, type of barrel wood and ageing time classification. Int. J. Food Sci. Technol. 2017, 52, 1307–1313. [Google Scholar] [CrossRef]
- Feizi, N.; Hashemi-Nasab, F.S.; Golpelichi, F.; Sabouruh, N.; Parastar, H. Recent trends in application of chemometric methods for GC-MS and GC×GC-MS-based metabolomic studies. TrAC Trends Anal. Chem. 2021, 138, 116239. [Google Scholar] [CrossRef]
- Gianneti, V.; Boccaci Mariani, M.; Marini, F.; Torrelli, P.; Biancolillo, A. Flavour fingerprint for the differentiation of Grappa from other Italiandistillates by GC-MS and chemometrics. Food Control 2019, 105, 123–130. [Google Scholar] [CrossRef]
- Kucharska-Ambrożej, K.; Karpinska, J. The application of spectroscopic techniques in combination with chemometrics for detection adulteration of some herbs and spices. Microchem. J. 2020, 153, 104278. [Google Scholar] [CrossRef]
- Valasi, L.; Arvanitaki, D.; Mitropoulou, A.; Georgiadou, M.; Pappas, C.S. Study of the quality parameters and the antioxidant capacity for the Ftir-chemometric differentiation of pistacia vera oils. Molecules 2020, 25, 1614. [Google Scholar] [CrossRef] [Green Version]
- Da Costa, A.C.V.; Sousa, J.M.B.; Bezerra, T.K.A.; da Silva, F.L.H.; Pastore, G.M.; da Silva, M.A.A.P.; Madruga, M.S. Volatile profile of monofloral honeys produced in Brazilian semiarid region by stingless bees and key volatile compounds. LWT 2018, 94, 198–207. [Google Scholar] [CrossRef]
- Mottese, A.F.; Fede, M.R.; Caridi, F.; Sabatino, G.; Marcianò, G.; Calabrese, G.; Albergamo, A.; Dugo, G. Chemometrics and innovative multidimensional data analysis (MDA) based on multi-element screening to protect the Italian porcino (Boletus sect. Boletus) from fraud. Food Control 2020, 110, 107004. [Google Scholar] [CrossRef]
- Mottese, A.F.; Albergamo, A.; Bartolomeo, G.; Bua, G.D.; Rando, R.; De Pasquale, P.; Saija, E.; Donato, D.; Dugo, G. Evaluation of fatty acids and inorganic elements by multivariate statistics for the traceability of the Sicilian Capparis spinosa L. J. Food Compos. Anal. 2018, 72, 66–74. [Google Scholar] [CrossRef]
- Pérez-Castaño, E.; Medina-Rodríguez, S.; Bagur-González, M.G. Discrimination and classification of extra virgin olive oil using a chemometric approach based on TMS-4,4′-desmetylsterols GC(FID) fingerprints of edible vegetable oils. Food Chem. 2019, 274, 518–525. [Google Scholar] [CrossRef] [PubMed]
- Pollo, B.J.; Teixeira, C.A.; Belinato, J.R.; Furlan, M.F.; de Cunha, I.C.M.; Vaz, C.R.; Volpato, G.V.; Augusto, F. Chemometrics, Comprehensive Two-Dimensional gas chromatography and “omics” sciences: Basic tools and recent applications. TrAC Trends Anal. Chem. 2021, 134, 116111. [Google Scholar] [CrossRef]
- Guo, T.; Li, Y.; Yong, W.; Fang, P.; Qin, Z.; Yan, A.; Dong, Y. Non-target geographic region discrimination of Cabernet Sauvignonwine by direct analysis in real time mass spectrometry withchemometrics methods. Int. J. Mass Spectrom. 2021, 464, 116577. [Google Scholar] [CrossRef]
- Karabagias, I.K.; Badeka, A.; Kontominas, M.G. A decisive strategy for monofloral honey authentication using analysis of volatile compounds and pattern recognition techniques. Microchem. J. 2020, 152, 104263. [Google Scholar] [CrossRef]
- Tahir, H.E.; Xiaobo, Z.; Zhihua, L.; Yaodi, Z. Comprehensive evaluation of antioxidant properties and volatile compounds of sudanese honeys. J. Food Biochem. 2015, 39, 349–359. [Google Scholar] [CrossRef]
- Tahir, H.E.; Xiaobo, Z.; Xiaowei, H.; Jiyong, S.; Mariod, A.A. Discrimination of honeys using colorimetric sensor arrays, sensory analysis and gas chromatography techniques. Food Chem. 2016, 206, 37–43. [Google Scholar] [CrossRef]
- Gan, Z.; Yang, Y.; Li, J.; Wen, X.; Zhu, M.; Jiang, Y.; Ni, Y. Using sensor and spectral analysis to classify botanical origin and determine adulteration of raw honey. J. Food Eng. 2016, 178, 151–158. [Google Scholar] [CrossRef]
- Wang, X.; Yang, S.; He, J.; Chen, L.; Zhang, J.; Jin, Y.; Zhou, J.; Zhang, Y. A green triple-locked strategy based on volatile-compound imaging, chemometrics, and markers to discriminate winter honey and sapium honey using headspace gas chromatography-ion mobility spectrometry. Food Res. Int. 2019, 119, 960–967. [Google Scholar] [CrossRef]
- D’Arcy, B.R.; Rintoul, G.B.; Rowland, C.Y.; Blackman, A.J. Composition of Australian Honey Extractives. 1. Norisoprenoids, Monoterpenes, and Other Natural Volatiles from Blue Gum (Eucalyptus leucoxylon) and Yellow Box (Eucalyptus melliodora) Honeys. J. Agric. Food Chem. 1997, 45, 1834–1843. [Google Scholar] [CrossRef]
- Tanleque-Alberto, F.; Juan-Borrás, M.; Escriche, I. Quality parameters, pollen and volatile profiles of honey from North and Central Mozambique. Food Chem. 2019, 277, 543–553. [Google Scholar] [CrossRef] [PubMed]
- Murray, R.A. Limitations to the use of solid-phase microextraction for quantitation of mixtures of volatile organic sulfur compounds. Anal. Chem. 2001, 73, 1646–1649. [Google Scholar] [CrossRef] [PubMed]
- Rivellino, S.R.; Hantao, L.W.; Risticevic, S.; Carasek, E.; Pawliszyn, J.; Augusto, F. Detection of extraction artifacts in the analysis of honey volatiles using comprehensive two-dimensional gas chromatography. Food Chem. 2013, 141, 1828–1833. [Google Scholar] [CrossRef] [Green Version]
- Odeh, I.; Abu-Lafi, S.; Dewik, H.; Al-Najjar, I.; Imam, A.; Dembitsky, V.M.; Hanuš, L.O. A variety of volatile compounds as markers in Palestinian honey from Thymus capitatus, Thymelaea hirsuta, and Tolpis virgata. Food Chem. 2007, 101, 1393–1397. [Google Scholar] [CrossRef]
- Pasini, F.; Gardini, S.; Marcazzan, G.L.; Caboni, M.F. Buckwheat honeys: Screening of composition and properties. Food Chem. 2013, 141, 2802–2811. [Google Scholar] [CrossRef]
- Špánik, I.; Pažitná, A.; Šiška, P.; Szolcsányi, P. The determination of botanical origin of honeys based on enantiomer distribution of chiral volatile organic compounds. Food Chem. 2014, 158, 497–503. [Google Scholar] [CrossRef]
- Yang, Y.; Battesti, M.J.; Djabou, N.; Muselli, A.; Paolini, J.; Tomi, P.; Costa, J. Melissopalynological origin determination and volatile composition analysis of Corsican “chestnut grove” honeys. Food Chem. 2012, 132, 2144–2154. [Google Scholar] [CrossRef]
- Rodríguez-Flores, M.S.; Falcão, S.I.; Escuredo, O.; Seijo, M.C.; Vilas-Boas, M. Description of the volatile fraction of Erica honey from the northwest of the Iberian Peninsula. Food Chem. 2021, 336, 127758. [Google Scholar] [CrossRef] [PubMed]
- Chen, L.; Xue, X.; Ye, Z.; Zhou, J.; Chen, F.; Zhao, J. Determination of Chinese honey adulterated with high fructose corn syrup by near infrared spectroscopy. Food Chem. 2011, 128, 1110–1114. [Google Scholar] [CrossRef]
- Shiddiq, M.; Zulkarnain, Z.; Asyana, V.; Aliyah, H. Identification of Pure and Adulterated Honey Using Two Spectroscopic Methods. J. Phys. Conf. Ser. 2019, 1351, 012022. [Google Scholar] [CrossRef]
- Li, S.; Zhang, X.; Shan, Y.; Su, D.; Ma, Q.; Wen, R.; Li, J. Qualitative and quantitative detection of honey adulterated with high-fructose corn syrup and maltose syrup by using near-infrared spectroscopy. Food Chem. 2017, 218, 231–236. [Google Scholar] [CrossRef]
- Yang, X.; Guang, P.; Xu, G.; Zhu, S.; Chen, Z.; Huang, F. Manuka honey adulteration detection based on near-infrared spectroscopy combined with aquaphotomics. LWT 2020, 132, 109837. [Google Scholar] [CrossRef]
- Das, C.; Chakraborty, S.; Acharya, K.; Bera, N.K.; Chattopadhyay, D.; Karmakar, A.; Chattopadhyay, S. FT-MIR supported Electrical Impedance Spectroscopy based study of sugar adulterated honeys from different floral origin. Talanta 2017, 171, 327–334. [Google Scholar] [CrossRef]
- Mail, M.H.; Ab Rahim, N.; Amanah, A.; Khawory, M.H.; Shahudin, M.A.; Seeni, A. FTIR and elementary analysis of Trigona honey, Apis honey and adulterated honey mixtures. Biomed. Pharmacol. J. 2019, 12, 2011–2017. [Google Scholar] [CrossRef]
- Se, K.W.; Ghoshal, S.K.; Wahab, R.A.; Ibrahim, R.K.R.; Lani, M.N. A simple approach for rapid detection and quantification of adulterants in stingless bees (Heterotrigona itama) honey. Food Res. Int. 2018, 105, 453–460. [Google Scholar] [CrossRef]
- Riswahyuli, Y.; Rohman, A.; Setyabudi, F.M.C.S.; Raharjo, S. Indonesian wild honey authenticity analysis using attenuated total reflectance-fourier transform infrared (ATR-FTIR) spectroscopy combined with multivariate statistical techniques. Heliyon 2020, 6, e03662. [Google Scholar] [CrossRef] [PubMed]
- Ghanavati Nasab, S.; Javaheran Yazd, M.; Marini, F.; Nescatelli, R.; Biancolillo, A. Classification of honey applying high performance liquid chromatography, near-infrared spectroscopy and chemometrics. Chemom. Intell. Lab. Syst. 2020, 202, 104037. [Google Scholar] [CrossRef]


| Floral Origin | Volatile Compounds as Markers for Botanical Source | Geographical Origin | References |
|---|---|---|---|
| Acacia | 8-Hydroxylinalool, 2-furfural-aldehyde, 2-hexen-1-ol, 2-hydroxycyclopent-2-en-1-one, 2-phenylethyl isothiocyanate, 2-phenylpropenal, 5-hydroxymethylfurfural, decanal, dimethyl palmitamine, hotreniol, lilac aldehyde C, lilac aldehyde D, linalool oxide, myrtenal, octanoic acid, oleic acid, pinocarvone | Romania | [8] |
| Benzaldehyde, nonanal, phenylacetaldehyde | Poland | [37] | |
| (2S,2′R,5′R)- Lilac aldehyde B, (2S,2′R,5′S)-lilac aldehyde C, hotrienol | Slovakia, Czech Republic, Romania, Germany, Serbia, Georgia, Poland, Moldova | [88] | |
| Buckwheat | Furfural, 2-methylbutanoic acid, 3-methylbutanoic acid, 2-methylbutyraldehyde, 3-methylbutyraldehyde | Poland | [37] |
| 3-Methylbutanoic acid, 2-methylbutanal, phenylacetaldehyde | Italy, east Europe | [87] | |
| 3-Methylbutanal, butanoic acid, 3-hydroxy-4,5-dimethyl-2(5H)-furanone, phenylacetaldehyde | Finland | [13] | |
| Chestnut | trans-Linalool oxide, hotrienol, (R)-4-terpineol | Italy | [88] |
| 2-Aminoacetophenone, benzaldehyde, acetophenone, nonaic acid, octanoic acid, 3-furaldehyde | Corsica Island | [89] | |
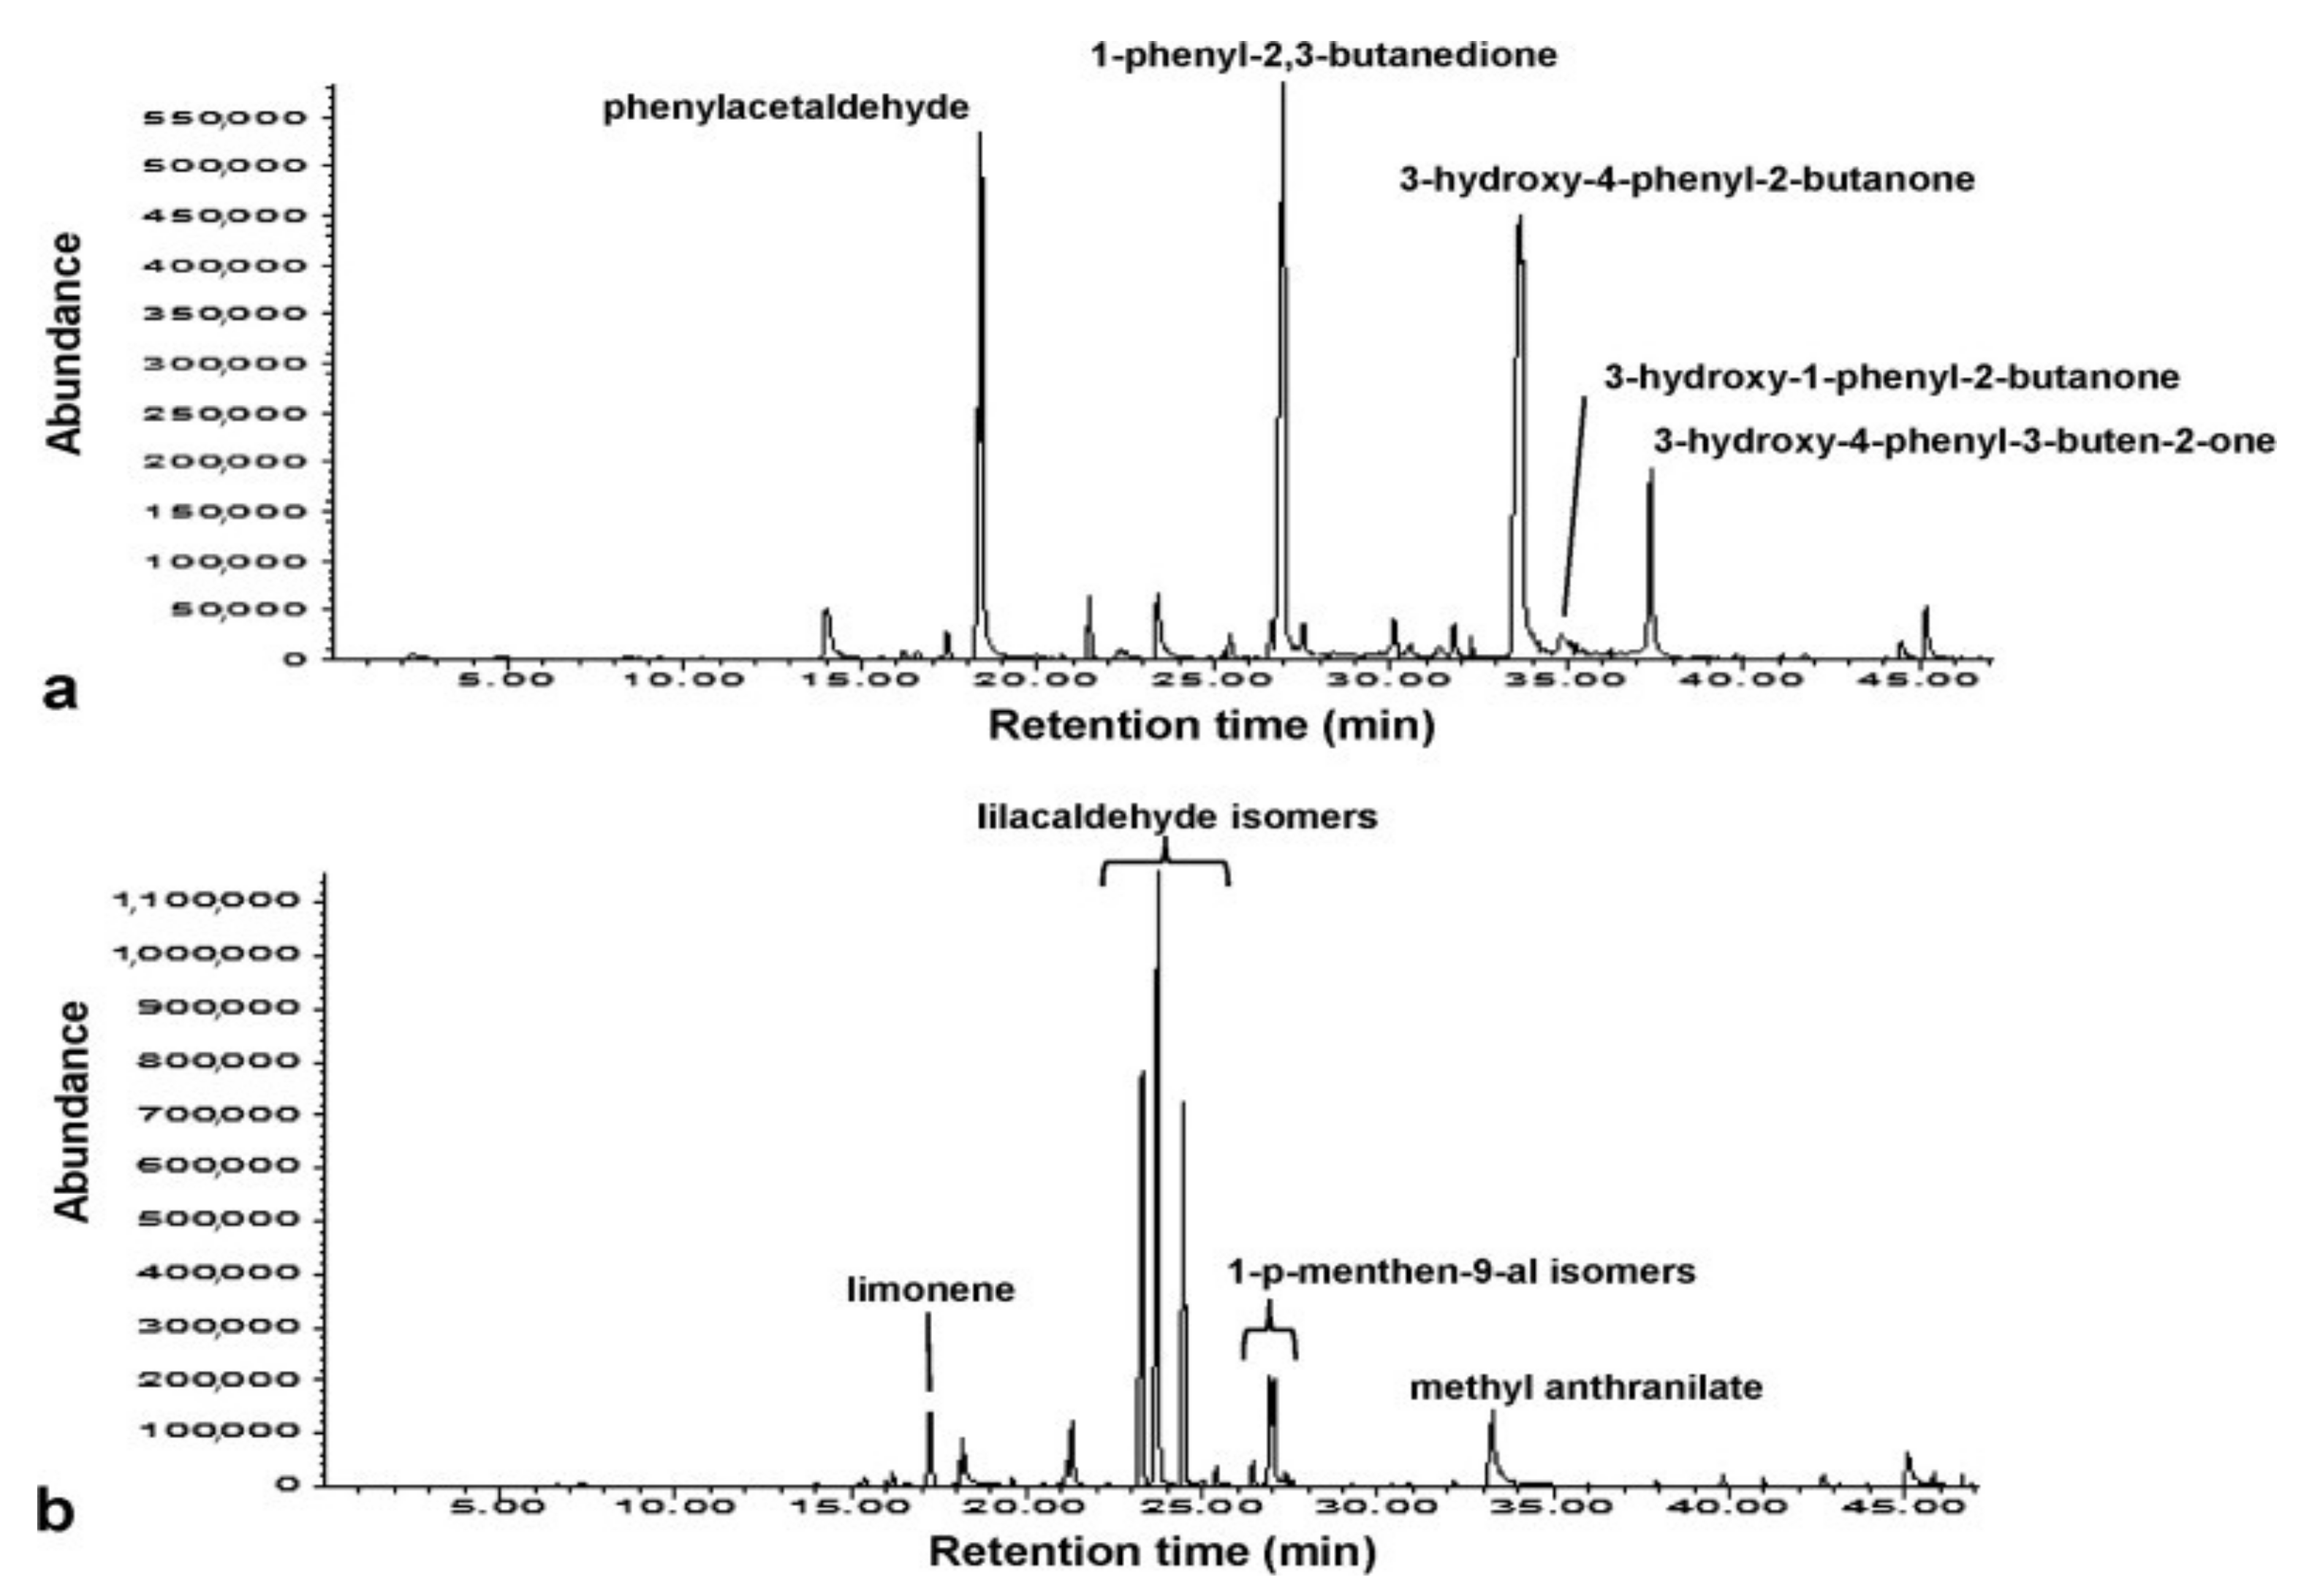
| Citrus | Lilac aldehyde, 1-p-menthen-9-al isomers, limonene, methyl anthranilate | Greece | [47] |
| Linalool, E-linalool oxide, limonene | Greece | [48] | |
| 4-Methoxy-benzaldehyde, lilac aldehydes A- D (isomers I-IV), α-4-dimethyl-3-cyclohexene-1-acetaldehyde, 2-cyclohexene-1-propanal, methylanthranilate, linalool, herboxide (isomer II), cis-linalool oxide, dill ether | Greece | [77] | |
| Citrus aurantium | (2S,2′R,5′R)- Lilac aldehyde B, (2S,2′R,5′S)-lilac aldehyde C, (2R,2′R,5′S)-lilac aldehyde D | Greece, Italy, France | [88] |
| Fir | Ethyl hexanoate, ethyl heptanoate, ethyl octanoate, ethyl nonanoate, ethyl decanoate, ethyl dodecanoate, ethyl tetradecanoate, 6-methyl-5-hepten-2-one, 2-hydroxy-3,5,5-trimethyl- cyclohex-2-en-one, 1-(2-furanyl)-ethanone, nonane, (Z)-5-methyl-4-nonene, 3,4,5-trimethyl-phenol, nonanal | Greece | [60] |
| Nonanal | Greece | [77] | |
| Heather | 3,4,5-Trimethylphenol, phenylic acid, benzoic acid, β-damascenone, isophorone | Poland | [37] |
| Isophorone, 2-methylbutyric acid | Estonia | [38] | |
| Hotrienol | Northwest of Iberian Peninsula (Spain, Portugal) | [90] | |
| Linden | 6-Allyl-o-cresol, allylphenylsulfide, butanoic acid, 3,6-dimethyl-4,5,6,7-tetrahydro-1-benzofuran, 1-methyl-4-(1-methylpropyl)-benzene, trans-dihydrocarvone, o-methylacetophenone, isoneral, isopropyl benzene, geranic acid, sabinene, teresantalol, 2-undecenal, p-cymene, myrtenyl acetate | Romania | [8] |
| Dimethylstyrene | Poland | [37] | |
| 4-Terpineol | Slovakia, Czech Republic, Romania, Hungary, Moldova | [88] | |
| Pine | β-Thujone, octane | Greece | [60] |
| 2-Hydroxybenzaldehyde | Greece | [77] | |
| Rapessed | 3-Methylpentanol, pentanoic acid, ethyl 2-hydroxy-4-methylbenzoate, trans-linalool oxide, α,α,4- trimethylbenzyl alcohol, lilac alcohol C, 3-phenyl propanol, dihydro-5-propyl-2(3H)-furanone, ethyl decanoate, ethyl 3-hydroxytridecanoate, ethyl dodecanoate, 2,2,4-trimethyl-1,3-pentanediol diisobutyrate, ethyl palmitate, ethyl oleate, ethyl benzoate, 3-methylbutanol | Romania | [8] |
| Hexanal, p-cymene, 4-methyloctane, cumene, 3-caren-2-ol, β-phellandrene, 4-methyl-2,7-octadiene, 2,6-dimethyl-3,5,7-octatriene, trans-sabinene hydrate, verbenone, 1,3,8-p-menthatriene, p-sec-butyltoluene, o-anisaldehyde, carvacrol | Lithuania | [12] | |
| Benzoic acid, benzyl alcohol | Poland | [37] | |
| (R)-Linalool | Slovakia | [88] | |
| Sunflower | 3-Furfural aldehyde, (3,3-dimethylcyclohexylidene) acetaldehyde, 1,3,3-trimethylcyclohex-1-ene-4-carboxaldehyde, p-menthan-3-one, endo-borneol, menthol, myrtenol, verbenone, isopiperitone, p-cymen-7-ol, eugenol, β-calarene, cis-linalool oxide(furanoid), hotrienol | Romania | [8] |
| 4-Terpineol, trans-linalool oxide | Slovakia, Ukraine | [88] | |
| Thyme | Formic acid, hexadecanoic acid, 1-octanol, 1-hydroxy-2-propanone, decane | Greece | [60] |
| Thymus capitatus | 1,3-Diphenyl-2-propanone, 1-butyl-3-methylbenzene, 3,4,5-trimethoxy benzaldehyde, 3,4-dimethoxy benzaldehyde, vanilline, thymol | Palestine | [86] |
| Thymus capitatus | Phenylacetaldehyde, 1-phenyl-2,3-butanedione, 3-hydroxy-4-phenyl-2-butanone, 3-hydroxy-1-phenyl-2-butanone, 3-hydroxy-4-phenyl-3-buten-2-one | Greece | [47] |
| Thymus capitatus | Pentanoic acid, phenylacetonitrile | Greece | [77] |
| Algaroba (Prosopis juliflora (Sw.) DC) | Rose oxide | Brazil | [71] |
| Angico (Anadenanthera colubrina) | Benzenethanol | Brazil | [71] |
| Caraway | Benzaldehyde | Lithuania | [12] |
| Chanana (Turnera ulmifolia L.) | D-Sylvestrene | Brazil | [71] |
| Christ’s thorn (Paliurus spina-christi) | Nonanal, lilac aldehyde (isomers I-IV), decana, methyl nonanoate, hexanoic acid, 2-ethylhexanoic acid | Croatia | |
| Cloudberry | 1-Propanol, p-cymene, isophorone, citral | Finland | [13] |
| Honey-dew | 2,3-Butanethiol, acetic acids isomers | Poland | [37] |
| Juazeiro (Ziziphus juazeiro Mart) | Aromatic aldehydes, benzaldehyde, benzeneacetaldehyde | Brazil | [21] |
| Jurema branca (Mimosa arenosa willd Poir) | Sulfur compounds, ketones, hexanol, limonene, α-farnesene, δ-cardinene | Brazil | [21] |
| Lacy phacelia | Hexan-1-ol, lavender lactone | Poland | [4] |
| Lingonberry | Vanillin, 3-hydroxy-4,5-dimethyl-2(5H)-furanone, ethyl 3-phenylpropanoate | Finland | [13] |
| Malicia (Mimosa quadrivalvis L.) | Linalool | Brazil | [71] |
| Sweetclover | Phenylc acetic acid, (Z)-3-nonenal | Finland | [13] |
| Thistle | Nonanal, furfural, decanal, 3,6-dimethyl- 2,3,3a,4,5,7a-hexahydrobenzofuran, benzaldehyde, α-linalool, lilac aldehyde (isomer IV), hotrienol, phenylacetaldehyde, 4-oxoisophorone, benzyl alcohol, 2-phenylethanol, octanoic acid, nonanoic acid, methyl anthranilate | Italy | [17] |
| Thymelaea hirsuta | Benzene propanol, benzylalcohol, hexanol, 4-methoxyphenol | Palestine | [86] |
| Tolpis virgata | 3,5-Dihydroxytoluene, tridecane | Palestine | [86] |
| Ulmo | Benzaldehyde, octane, nonanal, 4-methoxybenzaldehyde, isophorone, β-damascenone, lyrame, 4-vinylanisole | Chile | [14] |
| Velame branco (Croton heliotropiifolius Kunth) | Volatile acids | Brazil | [21] |
Publisher’s Note: MDPI stays neutral with regard to jurisdictional claims in published maps and institutional affiliations. |
© 2021 by the authors. Licensee MDPI, Basel, Switzerland. This article is an open access article distributed under the terms and conditions of the Creative Commons Attribution (CC BY) license (https://creativecommons.org/licenses/by/4.0/).
Share and Cite
Sotiropoulou, N.S.; Xagoraris, M.; Revelou, P.K.; Kaparakou, E.; Kanakis, C.; Pappas, C.; Tarantilis, P. The Use of SPME-GC-MS IR and Raman Techniques for Botanical and Geographical Authentication and Detection of Adulteration of Honey. Foods 2021, 10, 1671. https://doi.org/10.3390/foods10071671
Sotiropoulou NS, Xagoraris M, Revelou PK, Kaparakou E, Kanakis C, Pappas C, Tarantilis P. The Use of SPME-GC-MS IR and Raman Techniques for Botanical and Geographical Authentication and Detection of Adulteration of Honey. Foods. 2021; 10(7):1671. https://doi.org/10.3390/foods10071671
Chicago/Turabian StyleSotiropoulou, Nefeli Sofia, Marinos Xagoraris, Panagiota Kyriaki Revelou, Eleftheria Kaparakou, Charalabos Kanakis, Christos Pappas, and Petros Tarantilis. 2021. "The Use of SPME-GC-MS IR and Raman Techniques for Botanical and Geographical Authentication and Detection of Adulteration of Honey" Foods 10, no. 7: 1671. https://doi.org/10.3390/foods10071671
APA StyleSotiropoulou, N. S., Xagoraris, M., Revelou, P. K., Kaparakou, E., Kanakis, C., Pappas, C., & Tarantilis, P. (2021). The Use of SPME-GC-MS IR and Raman Techniques for Botanical and Geographical Authentication and Detection of Adulteration of Honey. Foods, 10(7), 1671. https://doi.org/10.3390/foods10071671