
Chemical Extraction and Gastrointestinal Digestion of Honey: Influence on Its Antioxidant, Antimicrobial and Anti-Inflammatory Activities

 ,
,  ,
, 
Abstract
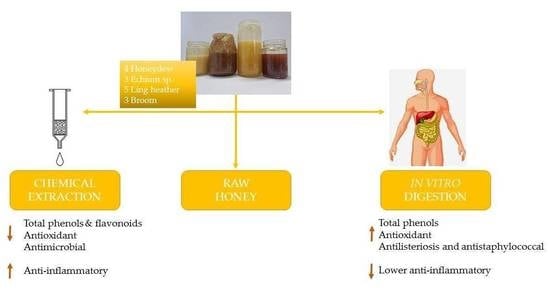
1. Introduction
2. Materials and Methods
2.1. Materials
2.2. Samples
2.3. Chemical Extraction
2.4. Simulated In Vitro Digestion
2.5. Total Phenolics and Flavonoids Content
2.6. Antioxidant Activities
2.7. Anti-Inflammatory Activity
2.8. Antimicrobial Activity
2.9. Statistical Analysis
3. Results and Discussion
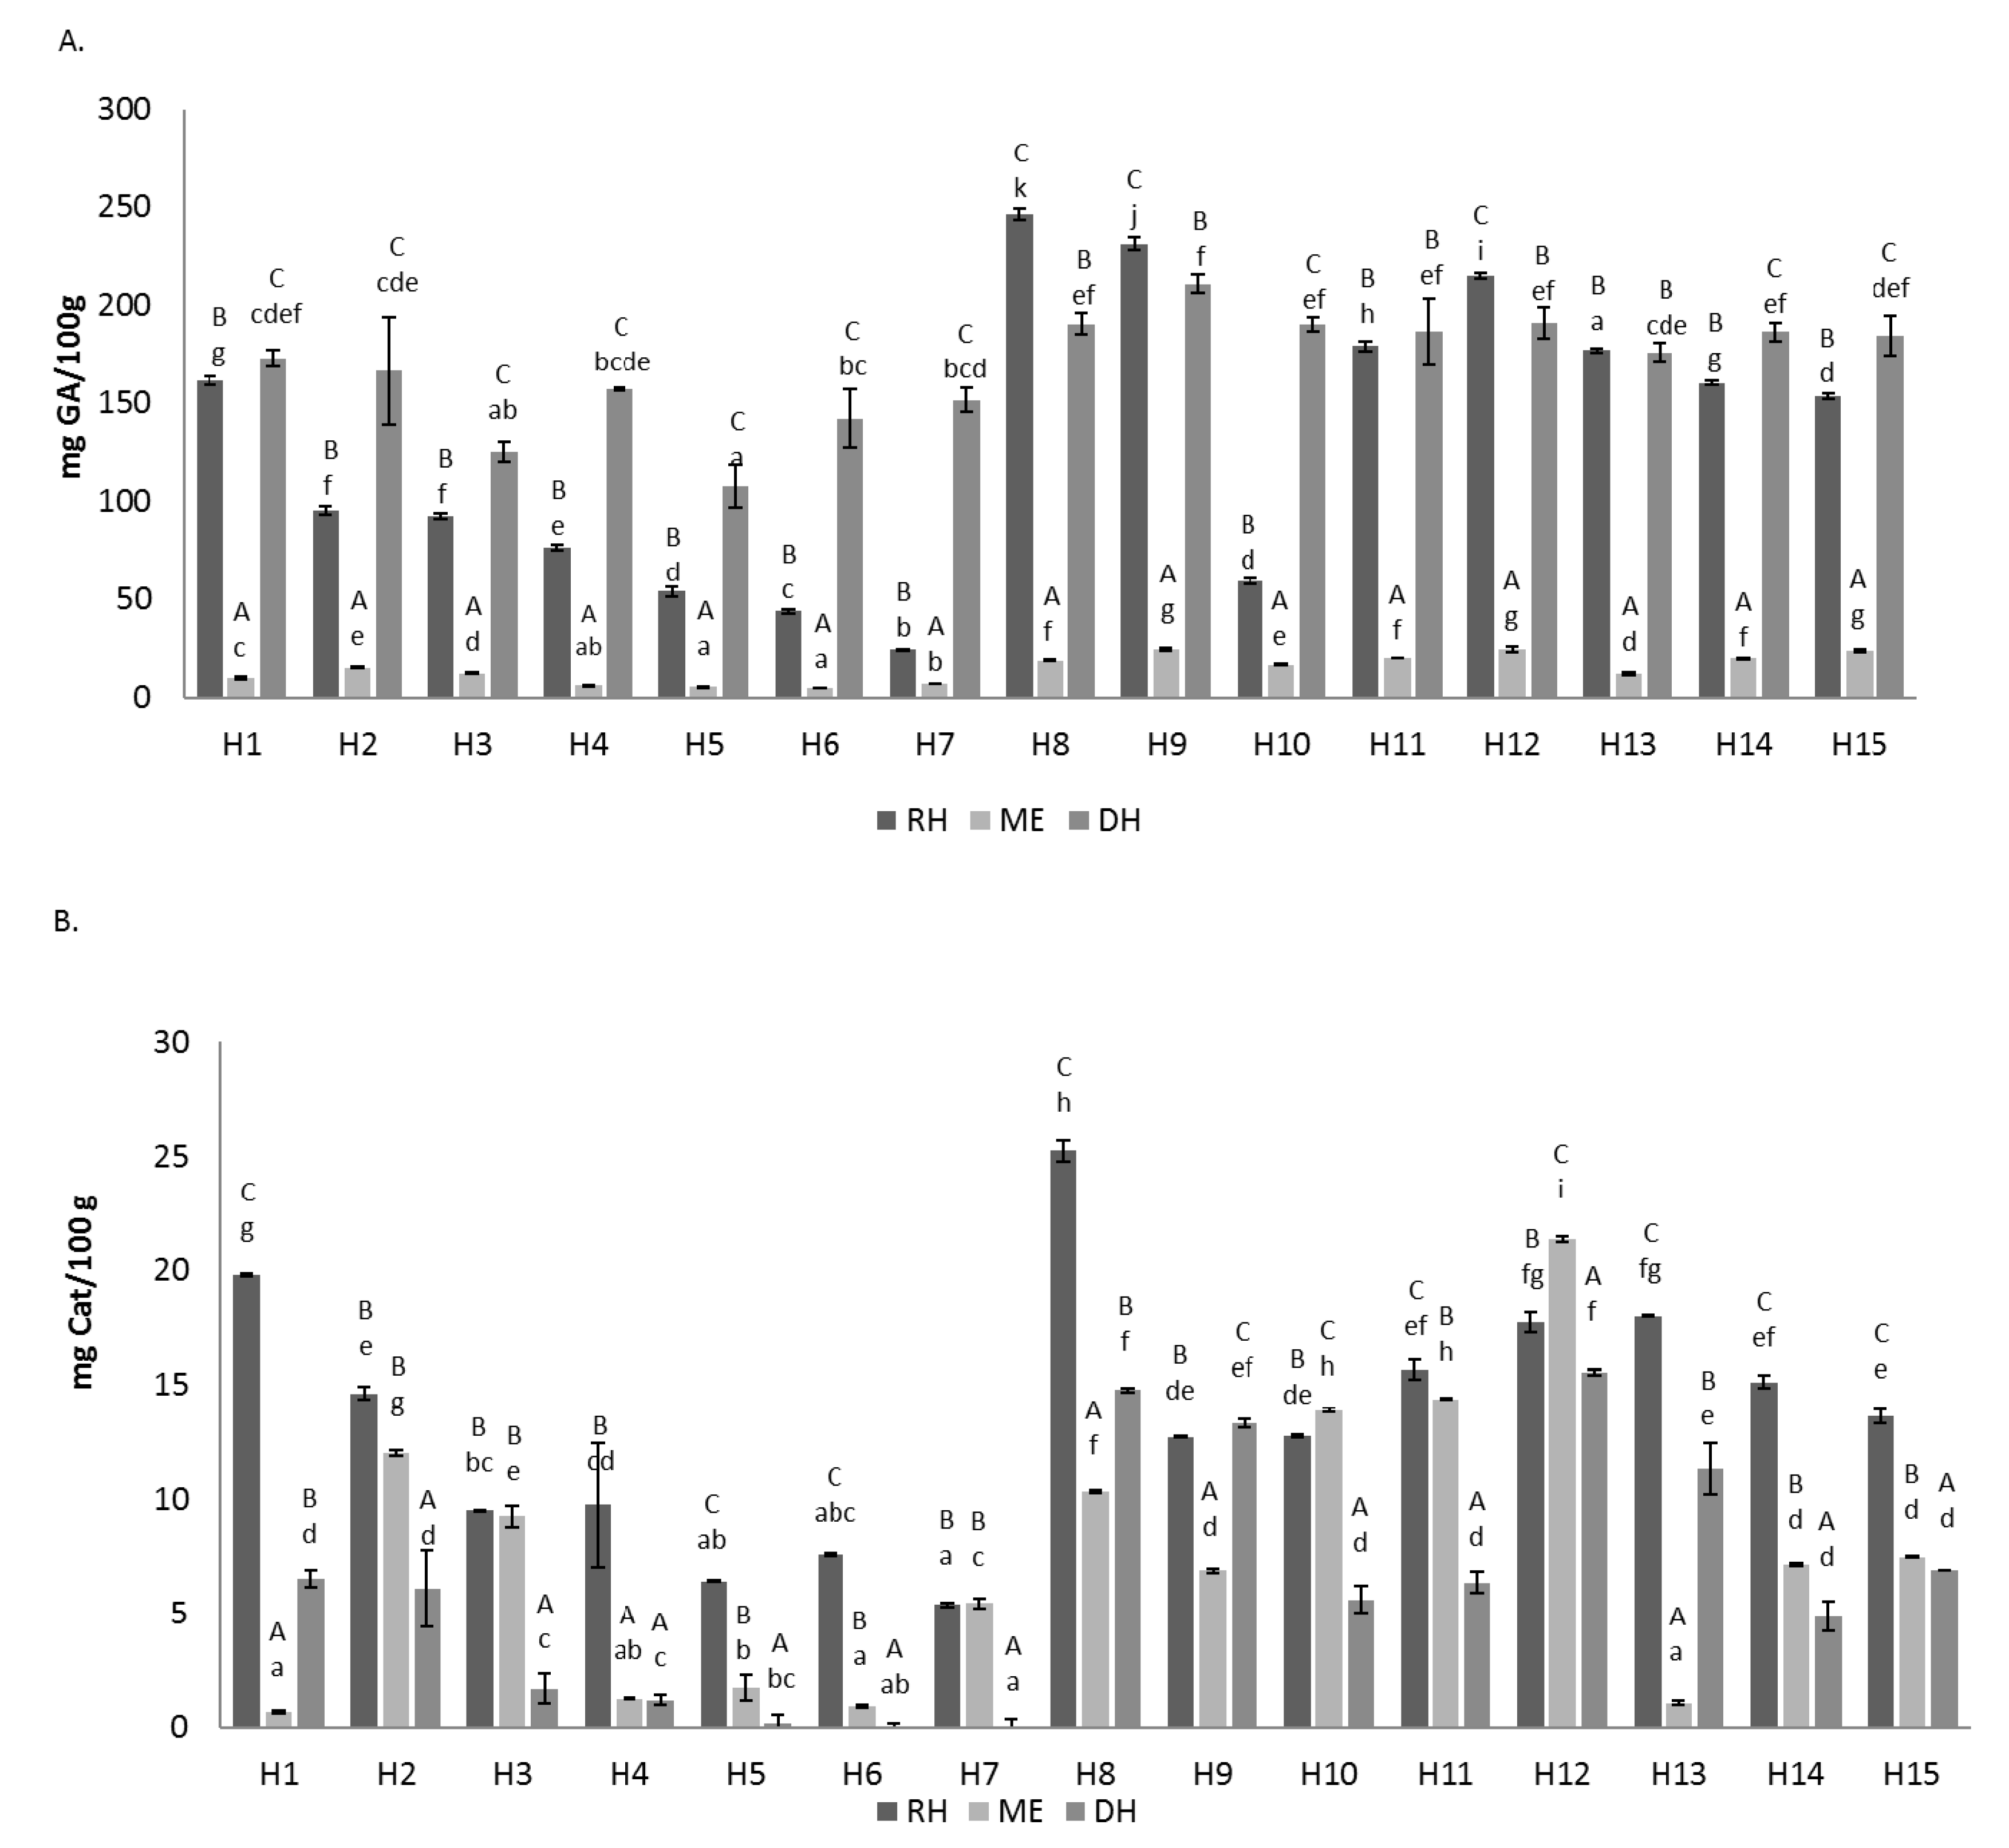
3.1. Total Phenolics and Total Flavonoids
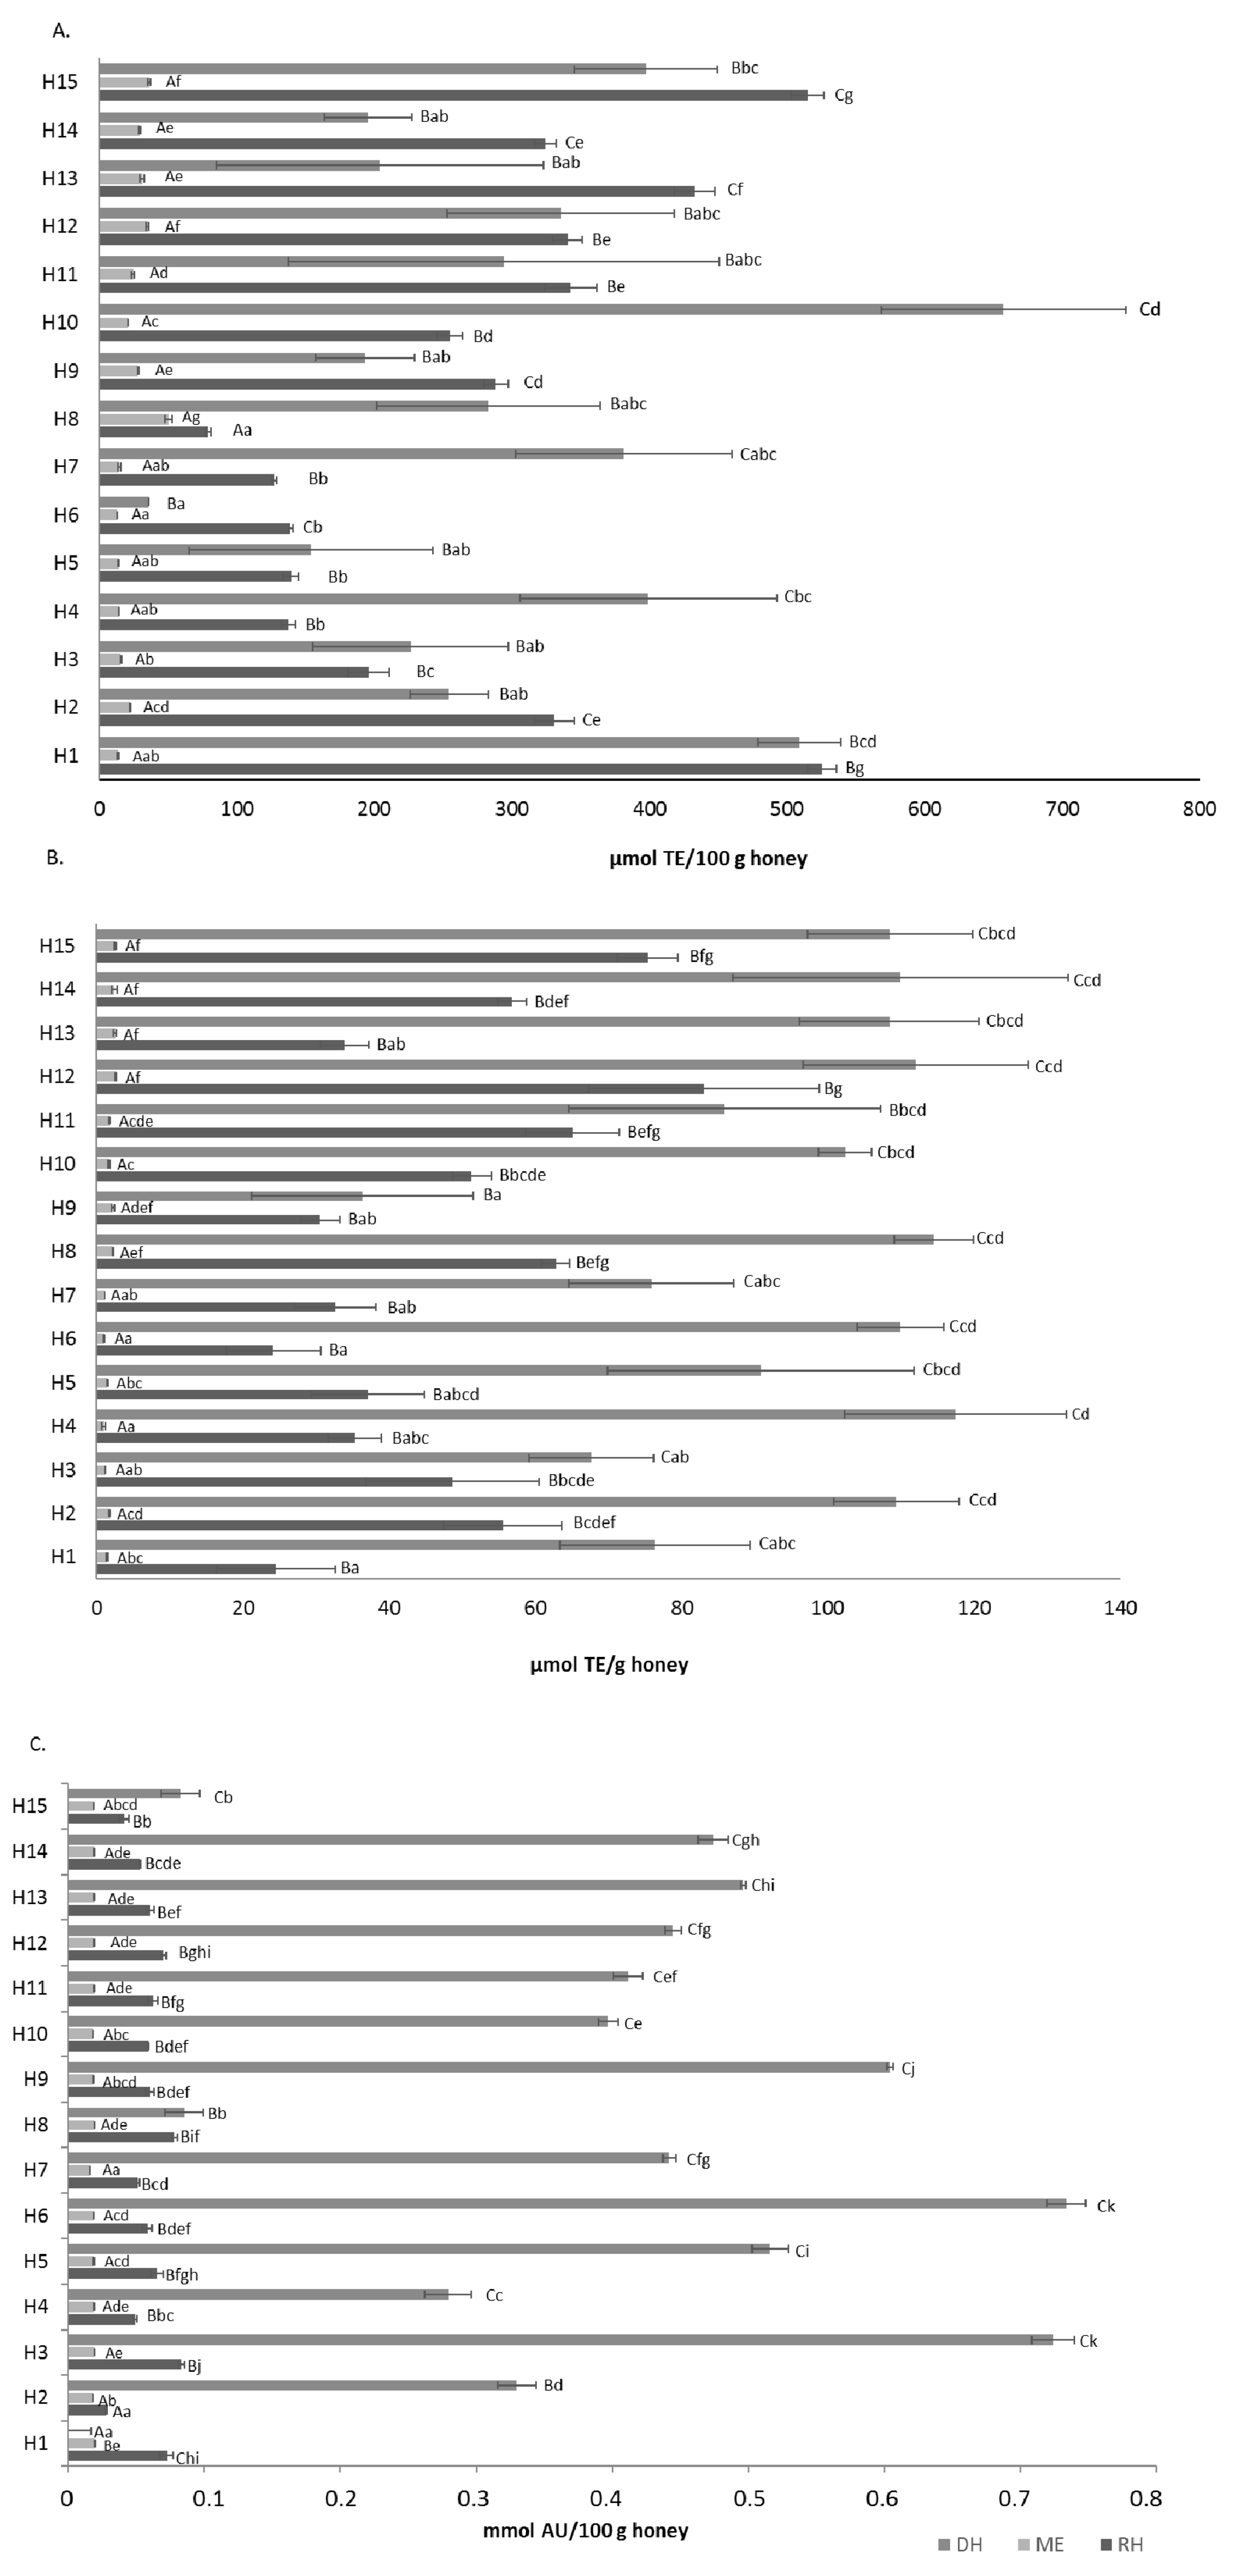
3.2. Antioxidant Activities
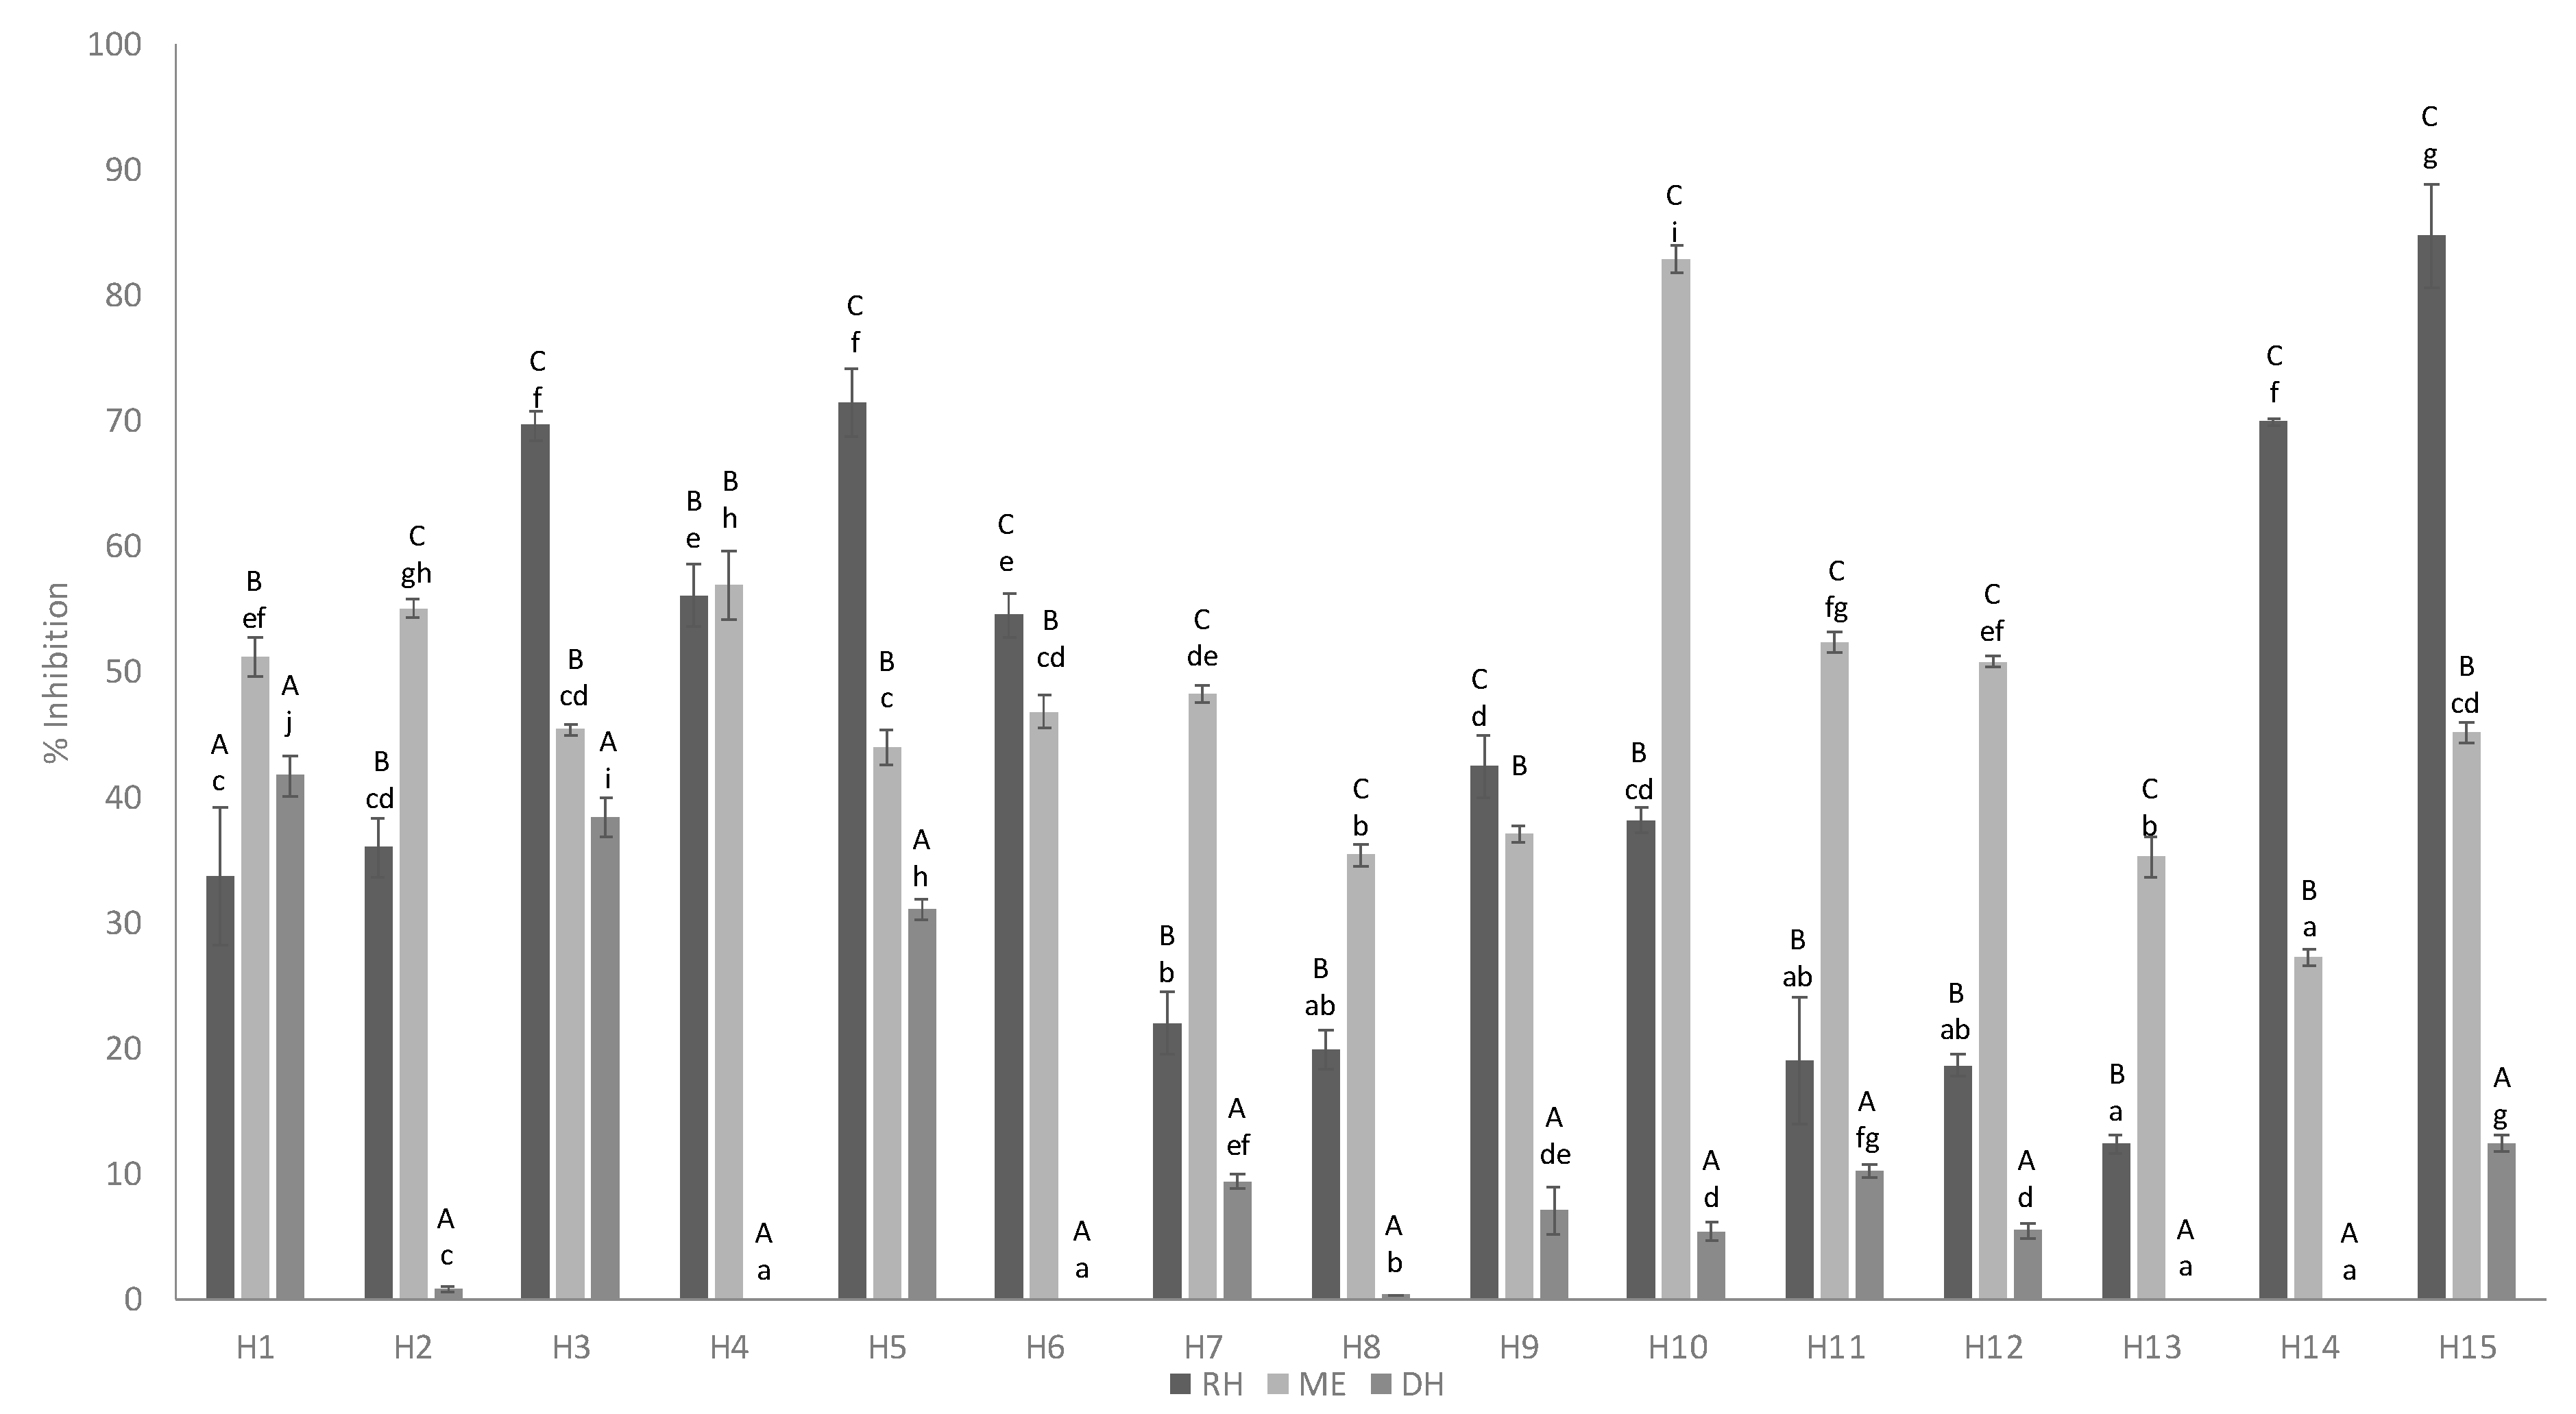
3.3. Anti-Inflammatory Activity
3.4. Antimicrobial Activity
3.5. Principal Components Analysis (PCA)
4. Conclusions
Author Contributions
Funding
Data Availability Statement
Acknowledgments
Conflicts of Interest
References
- Vela, L.; De Lorenzo, C.; Pérez, R.A. Antioxidant capacity of Spanish honeys and its correlation with polyphenol content and other physicochemical properties. J. Sci. Food Agric. 2007, 87, 1069–1075. [Google Scholar] [CrossRef]
- Bogdanov, S. Honey composition. In The Honey Book; Science and Education: Kokand, Uzbekistan, 2011; Chapter 5; pp. 1–10. [Google Scholar]
- Seraglio, S.K.T.; Valese, A.C.; Daguer, H.; Bergamo, G.; Azevedo, M.S.; Nehring, P.; Gonzaga, L.V.; Fett, R.; Costa, A.C.O. Effect of in vitro Gastrointestinal digestion on the bioaccessibility of phenolic compounds, minerals, and antioxidant capacity of Mimosa scabrella bentham Honeydew honeys. Food Res. Int. 2017, 99, 670–678. [Google Scholar] [CrossRef]
- Bueno-Costa, F.M.; Zambiazi, R.C.; Bohmer, B.W.; Chaves, F.C.; da Silva, W.P.; Zanusso, J.T.; Dutra, I. Antibacterial and antioxidant activity of honeys from the state of Rio Grande do Sul, Brazil. LWT 2016, 65, 333–340. [Google Scholar] [CrossRef]
- Kassim, M.; Yusoff, K.M.; Ong, G.; Sekaran, S.; Yusof, M.Y.B.M.; Mansor, M. Gelam honey inhibits lipopolysaccharide-induced endotoxemia in rats through the induction of heme oxygenase-1 and the inhibition of cy-tokines, nitric oxide, and high-mobility group protein B1. Fitoterapia 2012, 83, 1054–1059. [Google Scholar] [CrossRef]
- Gheldof, N.; Xiao-Hong, W.; Engeseth, N.J. Identification and quantification of antioxidant components of honeys from var-ious floral sources. J. Agric. Food Chem. 2002, 50, 5870–5877. [Google Scholar] [CrossRef]
- Kaškonienė, V.; Venskutonis, P.R. Floral Markers in Honey of Various Botanical and Geographic Origins: A Review. Compr. Rev. Food Sci. Food Saf. 2010, 9, 620–634. [Google Scholar] [CrossRef] [PubMed]
- Navarrete, P.; Eileen, S. Caracterización Fisicoquímica, Determinación de la Capacidad Antioxidante y Capacidad Antimicrobiana de la Miel Monofloral de Nabo. Bachelor’s Thesis, Universidad de las Américas, Quito, Ecuador, 2018. [Google Scholar]
- Osés, S.M.; Nieto, S.; Rodrigo, S.; Pérez, S.; Rojo, S.; Sancho, M.T.; Fernández-Muiño, M. Ángel Authentication of strawberry tree (Arbutus unedo L.) honeys from southern Europe based on compositional parameters and biological activities. Food Biosci. 2020, 38, 100768. [Google Scholar] [CrossRef]
- Wootton-Beard, P.C.; Moran, A.; Ryan, L. Stability of the total antioxidant capacity and total polyphenol content of 23 com-mercially available vegetable juices before and after in vitro digestion measured by FRAP, DPPH, ABTS and FolinCiocalteu methods. Food Biosci. 2011, 44, 217–224. [Google Scholar]
- Cianciosi, D.; Forbes-Hernández, T.Y.; Afrin, S.; Gasparrini, M.; Quiles, J.L.; Gil, E.; Bompadre, S.; Simal-Gandara, J.; Battino, M.; Giampieri, F. The Influence of In Vitro Gastrointestinal Digestion on the Anticancer Activity of Manuka Honey. Antioxidants 2020, 9, 64. [Google Scholar] [CrossRef]
- Daglia, M.; Ferrari, D.; Collina, S.; Curti, V. Influence of in vitro simulated gastroduodenal digestion on methylglyoxal concen-tration of Manuka (Lectospermum scoparium) honey. J. Agric. Food Chem. 2013, 61, 2140–2145. [Google Scholar] [CrossRef]
- O’Sullivan, A.M.; O’Callaghan, Y.C.; O’Connor, T.P.; O’Brien, N.M. Comparison of the Antioxidant Activity of Commercial Honeys, Before and After In-Vitro Digestion. Pol. J. Food Nutr. Sci. 2013, 63, 167–171. [Google Scholar] [CrossRef]
- Parkar, S.G.; Jobsis, C.M.; Herath, T.D.; Stoklosinski, H.M.; van Klink, J.W.; Sansom, C.E.; Sims, I.M.; Hedderley, D. Metabolic and microbial responses to the complexation of manuka honey with α-cyclodextrin after simulated gastrointestinal digestion and fermentation. J. Funct. Foods 2017, 31, 266–273. [Google Scholar] [CrossRef]
- Mannina, L.; Sobolev, A.P.; Coppo, E.; Di Lorenzo, A.; Nabavi, S.M.; Marchese, A.; Daglia, M. Antistaphylococcal activity and metabolite profiling of manuka honey (Leptospermum scoparium L.) after in vitro simulated digestion. Food Funct. 2016, 7, 1664–1670. [Google Scholar] [CrossRef] [PubMed]
- Seraglio, S.K.T.; Schulz, M.; Gonzaga, L.V.; Fett, R.; Oliveira Costa, A.C. Current status of the gastrointestinal digestion effects on honey: A comprenhensive review. Food Chem. 2021, 357, 129807. [Google Scholar] [CrossRef]
- Louveaux, J.; Maurizio, A.; Vorwohl, G. International commission for bee botany of IUBS. Methods of Melissopalynology. Bee World 1978, 59, 139–157. [Google Scholar] [CrossRef]
- Terradillos, L.A.; Muniategui, S.; Sancho, M.T.; Huidobro, J.F.; Simal-Lozano, J. An alternative method for analysis of honey sediment. Bee Sci. 1994, 3, 86–93. [Google Scholar]
- Von der Ohe, W.; Persano, O.L.; Piana, M.L.; Morlot, M.; Martin, P. Harmonized methods of melissopalynology. Apidologie 2004, 35, 18–25. [Google Scholar] [CrossRef]
- Marcazzan, G.L.; Mucignat-Caretta, C.; Marchese, C.M.; Piana, M.L. A review of methods for honey sensory analysis. J. Apic. Res. 2017, 57, 75–87. [Google Scholar] [CrossRef]
- Piana, M.L.; Oddo, L.P.; Bentabol, A.; Bruneau, E.; Bogdanov, S.; Declerck, C.G. Sensory analysis applied to honey: State of the art. Apidologie 2004, 35, S26–S37. [Google Scholar] [CrossRef]
- Baltrušaitytė, V.; Venskutonis, P.R.; Čeksterytė, V. Radical scavenging activity of different floral origin honey and beebread phenolic extracts. Food Chem. 2007, 101, 502–514. [Google Scholar] [CrossRef]
- Pastoriza, S.; Delgado-Andrade, C.; Haro, A.; Rufián-Henares, J. A physiologic approach to test the global antioxidant response of foods. The GAR method. Food Chem. 2011, 129, 1926–1932. [Google Scholar] [CrossRef]
- Rufián-Henares, J.A.; Delgado-Andrade, C. Effect of digestive process on Maillard reaction indexes and antioxidant proper-ties of breakfast cereals. Food Res. Int. 2009, 42, 394–400. [Google Scholar] [CrossRef]
- Meda, A.; Lamien, C.E.; Romito, M.; Millogo, J.; Nacoulma, O.G. Determination of the total phenolic, flavonoid and proline contents in Burkina Fasan honey, as well as their radical scavenging activity. Food Chem. 2005, 91, 571–577. [Google Scholar] [CrossRef]
- Pękal, A.; Pyrzynska, K. Evaluation of Aluminium Complexation Reaction for Flavonoid Content Assay. Food Anal. Methods 2014, 7, 1776–1782. [Google Scholar] [CrossRef]
- Sancho, M.T.; Pascual-Mate, A.; Rodríguez-Morales, E.G.; Oses, S.M.; Escriche, I.; Periche, A.; Fernández-Muiño, M.A. Critical assessment of antioxidant-related parameters of honey. J. Food Sci. Technol. 2016, 51, 30–36. [Google Scholar] [CrossRef]
- Koracevic, D.; Koracevic, G.; Djordjevic, V.; Andrejevic, S.; Cosic, V. Method for the measurement of antioxidant activity in human fluids. J. Clin. Pathol. 2001, 54, 356–361. [Google Scholar] [CrossRef]
- Huang, D.; Ou, B.; Hampsch-Woodill, M.; Flanagan, J.A.; Prior, R.L. Throughput assay of oxygen radical absorbance capacity (ORAC) using a multichannel liquid handling system coupled with a microplate fluorescence reader in 96-well format. J. Agric. Food Chem. 2002, 50, 4437–4444. [Google Scholar] [CrossRef]
- Ferreres, F.; Lopes, G.; Gil-Izquierdo, A.; Andrade, P.B.; Sousa, C.; Mouga, T.; Valentão, P. Phlorotannin Extracts from Fucales Characterized by HPLC-DAD-ESI-MSn: Approaches to Hyaluronidase Inhibitory Capacity and Antioxidant Properties. Mar. Drugs 2012, 10, 2766–2781. [Google Scholar] [CrossRef]
- Ferreira, I.C.; Aires, E.; Barreira, J.C.; Estevinho, L.M. Antioxidant activity of Portuguese honey samples: Different contributions of the entire honey and phenolic extract. Food Chem. 2009, 114, 1438–1443. [Google Scholar] [CrossRef]
- Pita-Calvo, C.; Vázquez, M. Differences between honeydew and blossom honeys: A review. Trends Food Sci. Technol. 2017, 59, 79–87. [Google Scholar] [CrossRef]
- Socha, R.; Juszczak, L.; Pietrzyk, S.; Fortuna, T. Antioxidant activity and phenolic composition of herb honeys. Food Chem. 2009, 113, 568–574. [Google Scholar] [CrossRef]
- Jara-Palacios, M.J.; Ávila, F.J.; Escudero-Gilete, M.L.; Pajuelo, A.G.; Heredia, F.J.; Hernanz, D.; Terrab, A. Physicochemical properties, colour, chemical composition, and antioxidant activity of Spanish Quercus honeydew honeys. Eur. Food Res. Technol. 2019, 245, 2017–2026. [Google Scholar] [CrossRef]
- Almeida da Silva, I.A.; Sarmento da Silva, T.M.; Camara, C.A.; Queiroz, N.; Magnani, M.; Santos de Novais, J.; Bastos Soledade, L.E.; de Oliveira Lima, E.; de Souza, A.L.; Gouveia de Souza, A. Phenolic profile, antioxidant activity and palynological analysis of stingless bee honey from Amazonas, Northern Brazil. Food Chem. 2013, 141, 3552–3558. [Google Scholar] [CrossRef]
- Petretto, G.L.; Cossu, M.; Alamanni, M.C. Phenolic content, antioxidant and physico-chemical properties of Sardinian mon-ofloral honeys. Int. J. Agric. Food Chem. 2015, 50, 482–491. [Google Scholar]
- Rodriguez-Romero, B.A. Caracterización química y evaluación de las actividades antioxidantes y antimicrobiana de mieles florales. Naranjo, cactáceas y manzanilla. Ph.D. Thesis, Universidad Autónoma de Queretaro, Queretaro, Mexico, 2012. [Google Scholar]
- Alvarez-Suarez, J.M.; Tulipani, S.; Díaz, D.; Estevez, Y.; Romandini, S.; Giampieri, F.; Damiani, E.; Astolfi, P.; Bompadre, S.; Battino, M. Antioxidant and antimicrobial capacity of several monofloral Cuban honeys and their correlation with color, polyphenol content and other chemical compounds. Food Chem. Toxicol. 2010, 48, 2490–2499. [Google Scholar] [CrossRef] [PubMed]
- Carrillo, C.; Rey, R.; Hendrickx, M.; Cavia, M.D.M.; Alonso-Torre, S. Antioxidant Capacity of Beetroot: Traditional vs Novel Approaches. Plant Foods Hum. Nutr. 2017, 72, 266–273. [Google Scholar] [CrossRef] [PubMed]
- Osés, S.M.; Pascual-Maté, A.; de la Fuente, D.; de Pablo, A.; Muiño, M.A.F.; Sancho, M. Comparison of methods to determine antibacterial activity of honeys against Staphylococcus aureus. NJAS Wagening. J. Life Sci. 2016, 78, 29–33. [Google Scholar] [CrossRef]
- Miyague, L.; Macedo, R.E.; Meca, G.; Holley, R.A.; Luciano, F.B. Combination of phenolic acids and essential oils against Listeria monocytogenes. LWT 2015, 64, 333–336. [Google Scholar] [CrossRef]
- Malheiro, J.F.; Maillard, J.; Borges, F.; Simoes, M. Evaluation of cinnamaldehyde and cinnamic acid derivatives in microbial growth control. Int. Biodeterior. Biodegrd. 2018, 141, 71–78. [Google Scholar] [CrossRef]
- Khochapong, W.; Ketnawa, S.; Ogawa, Y.; Punbusayakul, N. Effect of in vitro digestion on bioactive compounds, antioxidant and antimicrobial activities of coffee (Coffea arabica L.) pulp aqueous extract. Food Chem. 2021, 348, 129094. [Google Scholar] [CrossRef]
- López-Nicolás, R.; González-Bermúdez, C.A.; Ros-Berruezo, G.; Frontela-Saseta, C. Influence of in vitro gastrointestinal digestion of fruit juices enriched with pine bark extract on intestinal microflora. Food Chem. 2014, 157, 14–19. [Google Scholar] [CrossRef] [PubMed]
- Piscopo, M.; Tenore, G.C.; Notariale, R.; Maresca, V.; Maisto, M.; De Ruberto, F.; Heydari, M.; Sorbo, S.; Basile, A. Antimicrobial and antioxidant activity of proteins from Feijoa sellowiana Berg. fruit before and after in vitro gastrointestinal digestion. Nat. Prod. Res. 2020, 34, 2607–2611. [Google Scholar] [CrossRef] [PubMed]


| Honey Samples | Botanical Origin | Cientific Name |
|---|---|---|
| H1 | Honeydew | |
| H2 | Honeydew | |
| H3 | Honeydew | |
| H4 | Honeydew | |
| H5 | Viper’s bugloss/Blueweed | Echium sp. |
| H6 | Viper’s bugloss/Blueweed | Echium sp. |
| H7 | Viper’s bugloss/Blueweed | Echium sp. |
| H8 | Ling heather | Calluna vulgaris (L.) Hull |
| H9 | Ling heather | Calluna vulgaris (L.) Hull |
| H10 | Ling heather | Calluna vulgaris (L.) Hull |
| H11 | Ling heather | Calluna vulgaris (L.) Hull |
| H12 | Ling heather | Calluna vulgaris (L.) Hull |
| H13 | Broom | Leguminosae Genista sp. |
| H14 | Broom | Leguminosae Genista sp. |
| H15 | Broom | Leguminosae Genista sp. |
| E. coli | ||||||||||||||||
| H1 | H2 | H3 | H4 | H5 | H6 | H7 | H8 | H9 | H10 | H11 | H12 | H13 | H14 | H15 | ||
| RH | MIC | 18.75 (18.75) | 37.5 (37.5) | 18.75 (18.75) | 9.38 (9.38) | 18.75 (18.75) | 9.38 (9.38) | 18.75 (18.75) | 18.75 (18.75) | 9.38 (9.38) | 18.75 (18.75) | 9.38 (9.38) | 9.38 (9.38) | 9.38 (9.38) | 9.38 (9.38) | 18.75 (18.75) |
| MBC | 18.75 (18.75) | >37.5 (>37.5) | 18.75 (18.75) | 9.38 (9.38) | 18.75 (18.75) | 9.38 (9.38) | 18.75 (18.75) | 18.75 (18.75) | 18.75 (18.75) | 37.5 (37.5) | 18.75 (18.75) | 9.38 (9.38) | 9.38 (9.38) | 9.38 (9.38) | 18.75 (18.75) | |
| ME | MIC | 5 (25) | 5 (25) | 5 (25) | 5 (25) | 5 (25) | 5 (25) | 5 (25) | 15 (75) | 5 (25) | 5 (25) | 5 (25) | 5 (25) | 5 (25) | 5 (25) | 5 (25) |
| MBC | 5 (25) | 5 (25) | 5 (25) | 5 (25) | 5 (25) | 5 (25) | 5 (25) | 15 (75) | 5 (25) | 5 (25) | 5 (25) | 5 (25) | 5 (25) | 5 (25) | 5 (25) | |
| DH | MIC | >90 (>7) | >90 (>7) | >90 (>7) | >90 (>7) | >90 (>7) | >90 (>7) | >90 (>7) | >90 (>7) | >90 (>7) | >90 (>7) | >90 (>7) | >90 (>7) | >90 (>7) | >90 (>7) | >90 (>7) |
| MBC | >90 (>7) | >90 (>7) | >90 (>7) | >90 (>7) | >90 (>7) | >90 (>7) | >90 (>7) | >90 (>7) | >90 (>7) | >90 (>7) | >90 (>7) | >90 (>7) | >90 (>7) | >90 (>7) | >90 (>7) | |
| S. aureus | ||||||||||||||||
| H1 | H2 | H3 | H4 | H5 | H6 | H7 | H8 | H9 | H10 | H11 | H12 | H13 | H14 | H15 | ||
| RH | MIC | 9.38 (9.38) | >37.5 (>37.5) | 9.38 (9.38) | 4.69 (4.69) | 9.38 (9.38) | 4.69 (4.69) | 9.38 (9.38) | 9.38 (9.38) | 9.38 (9.38) | 9.38 (9.38) | 4.69 (4.69) | 9.38 (9.38) | 4.69 (4.69) | 4.69 (4.69) | 9.38 (9.38) |
| MBC | 9.38 (9.38) | >37.5 (>37.5) | 9.38 (9.38) | 4.69 (4.69) | 9.38 (9.38) | 4.69 (4.69) | 9.38 (9.38) | 9.38 (9.38) | 9.38 (9.38) | 9.38 (9.38) | 4.69 (4.69) | 9.38 (9.38) | 4.69 (4.69) | 4.69 (4.69) | 9.38 (9.38) | |
| ME | MIC | 15 (75) | 5 (25) | 5 (25) | 5 (25) | 5 (25) | 15 (75) | 5 (25) | 5 (25) | 5 (25) | 5 (25) | 5 (25) | 5 (25) | 5 (25) | 5 (25) | 5 (25) |
| MBC | 15 (75) | 15 (75) | 15 (75) | 15 (75) | 15 (75) | 15 (75) | 15 (75) | 15 (75) | 15 (75) | 15 (75) | 15 (75) | 15 (75) | 15 (75) | 15 (75) | 15 (75) | |
| DH | MIC | 40 (3.13) | <5 (<0.39) | <5 (<0.39) | <5 (<0.39) | <5 (<0.39) | 12.5 (0.98) | 25 (1.95) | 25 (1.95) | 25 (1.95) | <5 (<0.39) | 25 (1.95) | 25 (1.95) | 25 (1.95) | <5 (<0.39) | 25 (1.95) |
| MBC | >90 (>7) | 25 (1.95) | 25 (1.95) | 25 (1.95) | 25 (1.95) | 25 (1.95) | 40 (3.13) | >90 (7) | 25 (1.95) | 25 (1.95) | 25 (1.95) | 25 (1.95) | 75 (5.85) | 25 (1.95) | 90 (7) | |
| L. monocytogenes | ||||||||||||||||
| H1 | H2 | H3 | H4 | H5 | H6 | H7 | H8 | H9 | H10 | H11 | H12 | H13 | H14 | H15 | ||
| RH | MIC | 18.75 (18.75) | 37.5 (37.5) | 18.75 (18.75) | 18.75 (18.75) | 18.75 (18.75) | 18.75 (18.75) | 18.75 (18.75) | 18.75 (18.75) | 18.75 (18.75) | 18.75 (18.75) | 18.75 (18.75) | 18.75 (18.75) | 18.75 (18.75) | 18.75 (18.75) | 18.75 (18.75) |
| MBC | 37.5 (37.5) | >37.5 (37.5) | 37.5 (37.5) | 18.75 (18.75) | 37.5 (37.5) | 37.5 (37.5) | 37.5 (37.5) | 18.75 (18.75) | 18.75 (18.75) | 37.5 (37.5) | 18.75 (18.75) | 37.5 (37.5) | 18.75 (18.75) | 18.75 (18.75) | 18.75 (18.75) | |
| ME | MIC | 5 (25) | <1 (<5) | <1 (<5) | 5 (25) | <1 (<5) | 5 (25) | 5 (25) | <1 (<5) | 5 (25) | <1 (<5) | 5 (25) | 5 (25) | <1 (<5) | <1 (<5) | 5 (25) |
| MBC | 15 (75) | <1 (<1) | <1 (<1) | 15 (75) | <1 (<1) | 15 (75) | 15 (75) | 15 (75) | 15 (75) | 5 (25) | 15 (75) | 15 (75) | 5 (25) | <1 (<1) | 15 (75) | |
| DH | MIC | 40 (3.13) | 40 (3.13) | 40 (3.13) | 40 (3.13) | 40 (3.13) | 40 (3.13) | 40 (3.13) | 40 (3.13) | 40 (3.13) | 40 (3.13) | >90 (>7) | >90 (>7) | 40 (3.13) | 40 (3.13) | 40 (3.13) |
| MBC | >90 (>7) | >90 (>7) | >90 (>7) | >90 (>7) | >90 (>7) | >90 (>7) | >90 (>7) | >90 (>7) | 40 (3.13) | >90 (>7) | >90 (>7) | >90 (>7) | >90 (>7) | >90 (>7) | >90 (>7) | |
| St. mutans | ||||||||||||||||
| H1 | H2 | H3 | H4 | H5 | H6 | H7 | H8 | H9 | H10 | H11 | H12 | H13 | H14 | H15 | ||
| RH | MIC | 18.75 (18.75) | 37.5 (37.5) | 18.75 (18.75) | 18.75 (18.75) | 18.75 (18.75) | 18.75 (18.75) | 18.75 (18.75) | 18.75 (18.75) | 18.75 (18.75) | 18.75 (18.75) | 18.75 (18.75) | 18.75 (18.75) | 18.75 (18.75) | 18.75 (18.75) | 18.75 (18.75) |
| MBC | 18.75 (18.75) | 37.5 (37.5) | 18.75 (18.75) | 18.75 (18.75) | 37.5 (37.5) | 18.75 (18.75) | 18.75 (18.75) | 18.75 (18.75) | 18.75 (18.75) | 37.5 (37.5) | 18.75 (18.75) | 18.75 (18.75) | 18.75 (18.75) | 18.75 (18.75) | 18.75 (18.75) | |
| ME | MIC | 15 (75) | 15 (75) | 15 (75) | 15 (75) | 15 (75) | 15 (75) | 15 (75) | 15 (75) | 15 (75) | 15 (75) | 15 (75) | 5 (25) | 15 (75) | 15 (75) | 15 (75) |
| MBC | 15 (75) | 15 (75) | 15 (75) | 15 (75) | 15 (75) | 15 (75) | 15 (75) | 15 (75) | 15 (75) | 15 (75) | 15 (75) | 15 (75) | 15 (75) | 15 (75) | 15 (75) | |
| DH | MIC | >90 (>7) | >90 (>7) | >90 (>7) | >90 (>7) | >90 (>7) | >90 (>7) | >90 (>7) | >90 (>7) | >90 (>7) | >90 (>7) | >90 (>7) | >90 (>7) | >90 (>7) | >90 (>7) | >90 (>7) |
| MBC | >90 (>7) | >90 (>7) | >90 (>7) | >90 (>7) | >90 (>7) | >90 (>7) | >90 (>7) | >90 (>7) | >90 (>7) | >90 (>7) | >90 (>7) | >90 (>7) | >90 (>7) | >90 (>7) | >90 (>7) | |
| C. albicans | ||||||||||||||||
| H1 | H2 | H3 | H4 | H5 | H6 | H7 | H8 | H9 | H10 | H11 | H12 | H13 | H14 | H15 | ||
| RH | MIC | 37.5 (37.5) | 37.5 (37.5) | 37.5 (37.5) | 37.5 (37.5) | 37.5 (37.5) | 37.5 (37.5) | 37.5 (37.5) | 37.5 (37.5) | 37.5 (37.5) | 37.5 (37.5) | 37.5 (37.5) | 37.5 (37.5) | 37.5 (37.5) | 37.5 (37.5) | 37.5 (37.5) |
| MBC | >45 (>45) | >45 (>45) | >45 (>45) | >45 (>45) | >45 (>45) | >45 (>45) | >45 (>45) | >45 (>45) | >45 (>45) | >45 (>45) | >45 (>45) | >45 (>45) | >45 (>45) | 45 (>45) | >45 (>45) | |
| ME | MIC | 15 (75) | 15 (75) | 15 (75) | 15 (75) | 15 (75) | 15 (75) | 15 (75) | 15 (75) | 15 (75) | 15 (75) | 15 (75) | 15 (75) | 15 (75) | 15 (75) | 15 (75) |
| MBC | 15 (75) | 15 (75) | 15 (75) | 15 (75) | 15 (75) | 15 (75) | 15 (75) | 15 (75) | 15 (75) | 15 (75) | 15 (75) | 15 (75) | 15 (75) | 15 (75) | 15 (75) | |
| DH | MIC | >90 (>7) | >90 (>7) | >90 (>7) | >90 (>7) | >90 (>7) | >90 (>7) | >90 (>7) | >90 (>7) | >90 (>7) | >90 (>7) | >90 (>7) | >90 (>7) | >90 (>7) | >90 (>7) | >90 (>7) |
| MBC | >90 (>7) | >90 (>7) | >90 (>7) | >90 (>7) | >90 (>7) | >90 (>7) | >90 (>7) | >90 (>7) | >90 (>7) | >90 (>7) | >90 (>7) | >90 (>7) | >90 (>7) | >90 (>7) | >90 (>7) | |
| Ps. aeruginosa | ||||||||||||||||
| H1 | H2 | H3 | H4 | H5 | H6 | H7 | H8 | H9 | H10 | H11 | H12 | H13 | H14 | H15 | ||
| RH | MIC | 9.38 (9.38) | 37.5 (37.5) | 9.38 (9.38) | 9.38 (9.38) | 9.38 (9.38) | 9.38 (9.38) | 9.38 (9.38) | 9.38 (9.38) | 9.38 (9.38) | 9.38 (9.38) | 9.38 (9.38) | 9.38 (9.38) | 9.38 (9.38) | 9.38 (9.38) | 9.38 (9.38) |
| MBC | 9.38 (9.38) | 37.5 (37.5) | 9.38 (9.38) | 9.38 (9.38) | 9.38 (9.38) | 9.38 (9.38) | 9.38 (9.38) | 9.38 (9.38) | 9.38 (9.38) | 9.38 (9.38) | 9.38 (9.38) | 9.38 (9.38) | 9.38 (9.38) | 9.38 (9.38) | 9.38 (9.38) | |
| ME | MIC | 5 (25) | 5 (25) | 5 (25) | 5 (25) | 5 (25) | 5 (25) | 5 (25) | 5 (25) | 5 (25) | 5 (25) | 5 (25) | 5 (25) | 5 (25) | 5 (25) | 5 (25) |
| MBC | 5 (25) | 5 (25) | 5 (25) | 5 (25) | 5 (25) | 5 (25) | 5 (25) | 5 (25) | 5 (25) | 5 (25) | 5 (25) | 5 (25) | 5 (25) | 5 (25) | 5 (25) | |
| DH | MIC | >90 (>7) | >90 (>7) | >90 (>7) | >90 (>7) | >90 (>7) | >90 (>7) | >90 (>7) | >90 (>7) | >90 (>7) | >90 (>7) | >90 (>7) | >90 (>7) | >90 (>7) | >90 (>7) | >90 (>7) |
| MBC | >90 (>7) | >90 (>7) | >90 (>7) | >90 (>7) | >90 (>7) | >90 (>7) | >90 (>7) | >90 (>7) | >90 (>7) | >90 (>7) | >90 (>7) | >90 (>7) | >90 (>7) | >90 (>7) | >90 (>7) | |
Publisher’s Note: MDPI stays neutral with regard to jurisdictional claims in published maps and institutional affiliations. |
© 2021 by the authors. Licensee MDPI, Basel, Switzerland. This article is an open access article distributed under the terms and conditions of the Creative Commons Attribution (CC BY) license (https://creativecommons.org/licenses/by/4.0/).
Share and Cite
Alevia, M.; Rasines, S.; Cantero, L.; Sancho, M.T.; Fernández-Muiño, M.A.; Osés, S.M. Chemical Extraction and Gastrointestinal Digestion of Honey: Influence on Its Antioxidant, Antimicrobial and Anti-Inflammatory Activities. Foods 2021, 10, 1412. https://doi.org/10.3390/foods10061412
Alevia M, Rasines S, Cantero L, Sancho MT, Fernández-Muiño MA, Osés SM. Chemical Extraction and Gastrointestinal Digestion of Honey: Influence on Its Antioxidant, Antimicrobial and Anti-Inflammatory Activities. Foods. 2021; 10(6):1412. https://doi.org/10.3390/foods10061412
Chicago/Turabian StyleAlevia, Marta, Sandra Rasines, Leire Cantero, M. Teresa Sancho, Miguel A. Fernández-Muiño, and Sandra M. Osés. 2021. "Chemical Extraction and Gastrointestinal Digestion of Honey: Influence on Its Antioxidant, Antimicrobial and Anti-Inflammatory Activities" Foods 10, no. 6: 1412. https://doi.org/10.3390/foods10061412
APA StyleAlevia, M., Rasines, S., Cantero, L., Sancho, M. T., Fernández-Muiño, M. A., & Osés, S. M. (2021). Chemical Extraction and Gastrointestinal Digestion of Honey: Influence on Its Antioxidant, Antimicrobial and Anti-Inflammatory Activities. Foods, 10(6), 1412. https://doi.org/10.3390/foods10061412