
Consumer Perception of Red Wine by the Degree of Familiarity Using Consumer-Based Methodology


Abstract
1. Introduction
2. Materials and Methods
2.1. Samples
2.2. Participants
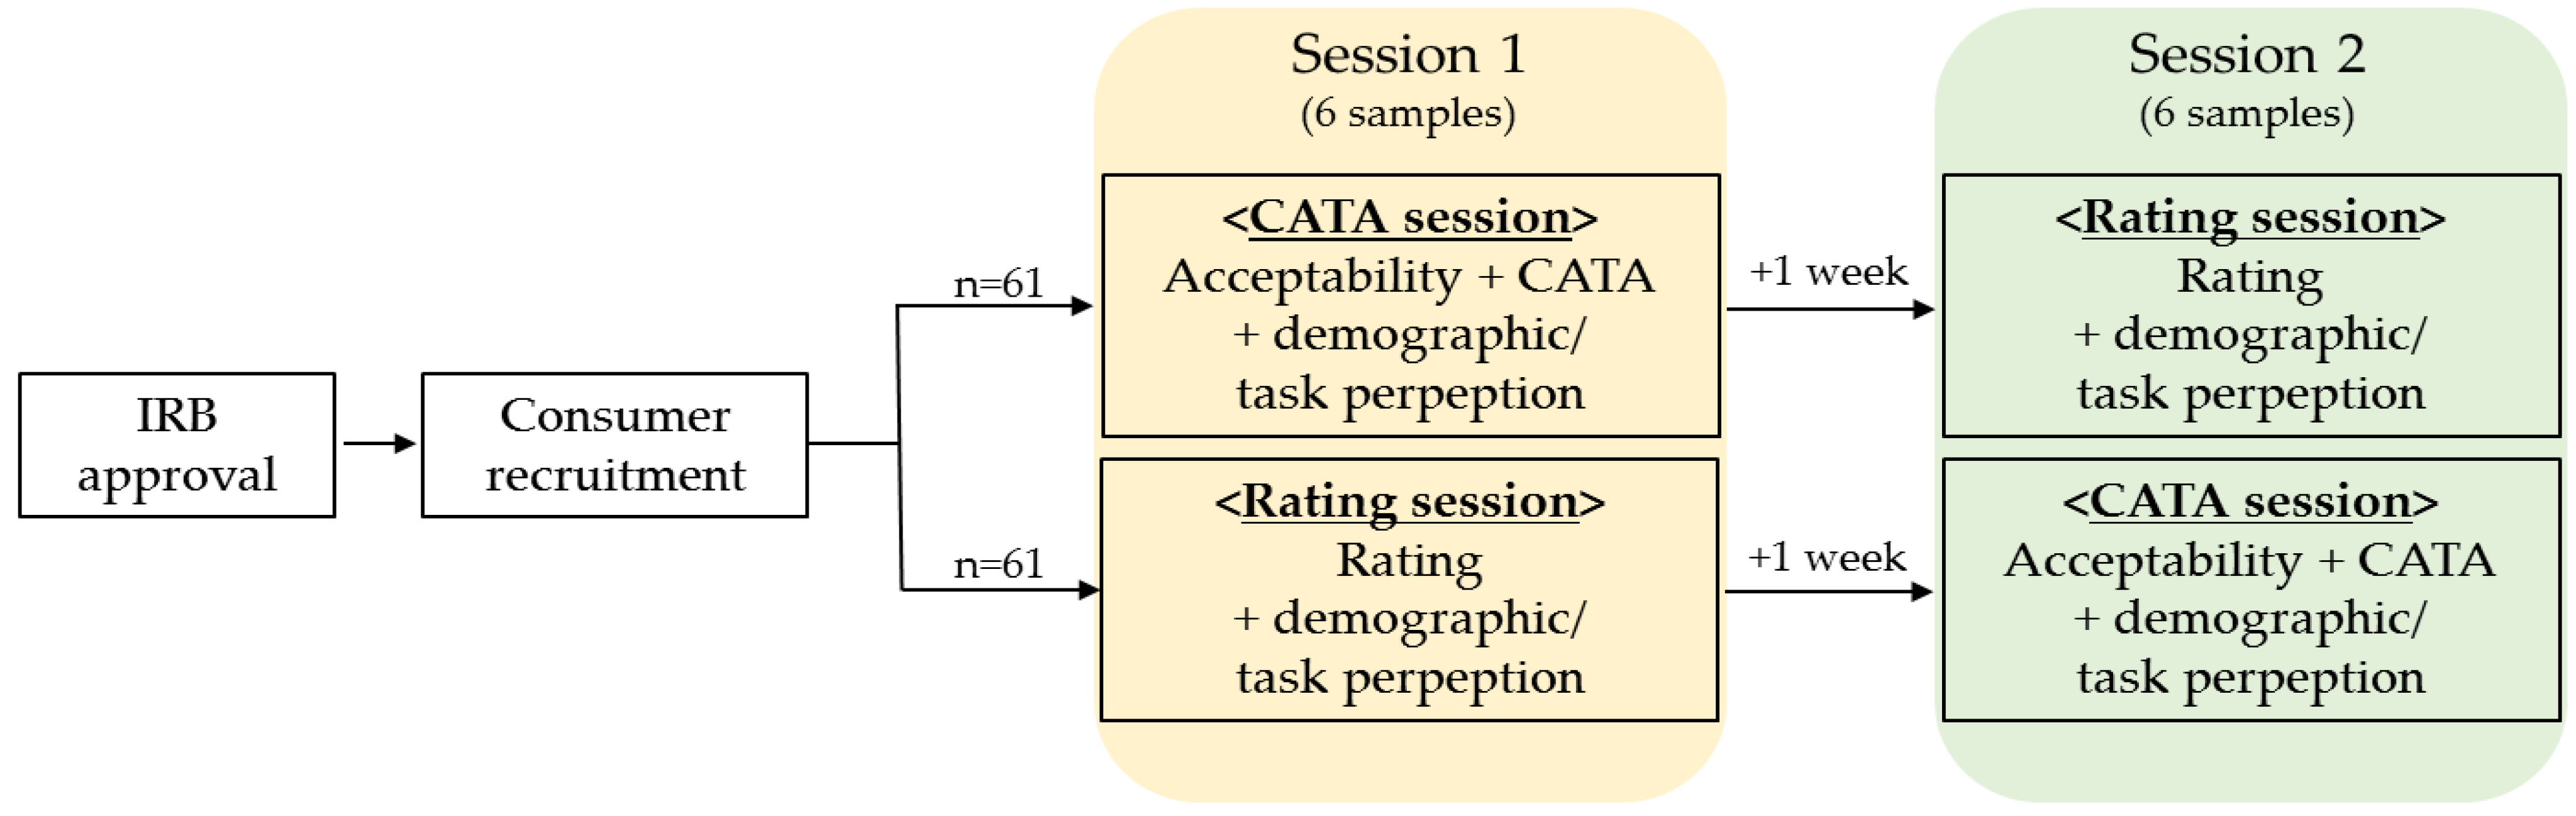
2.3. Consumer Test
2.4. Data Analysis
3. Results
3.1. Comparison of Consumers’ Wine Perception by CATA and Rating Scales
3.1.1. Significant Term and Its Number in CATA vs. Rating
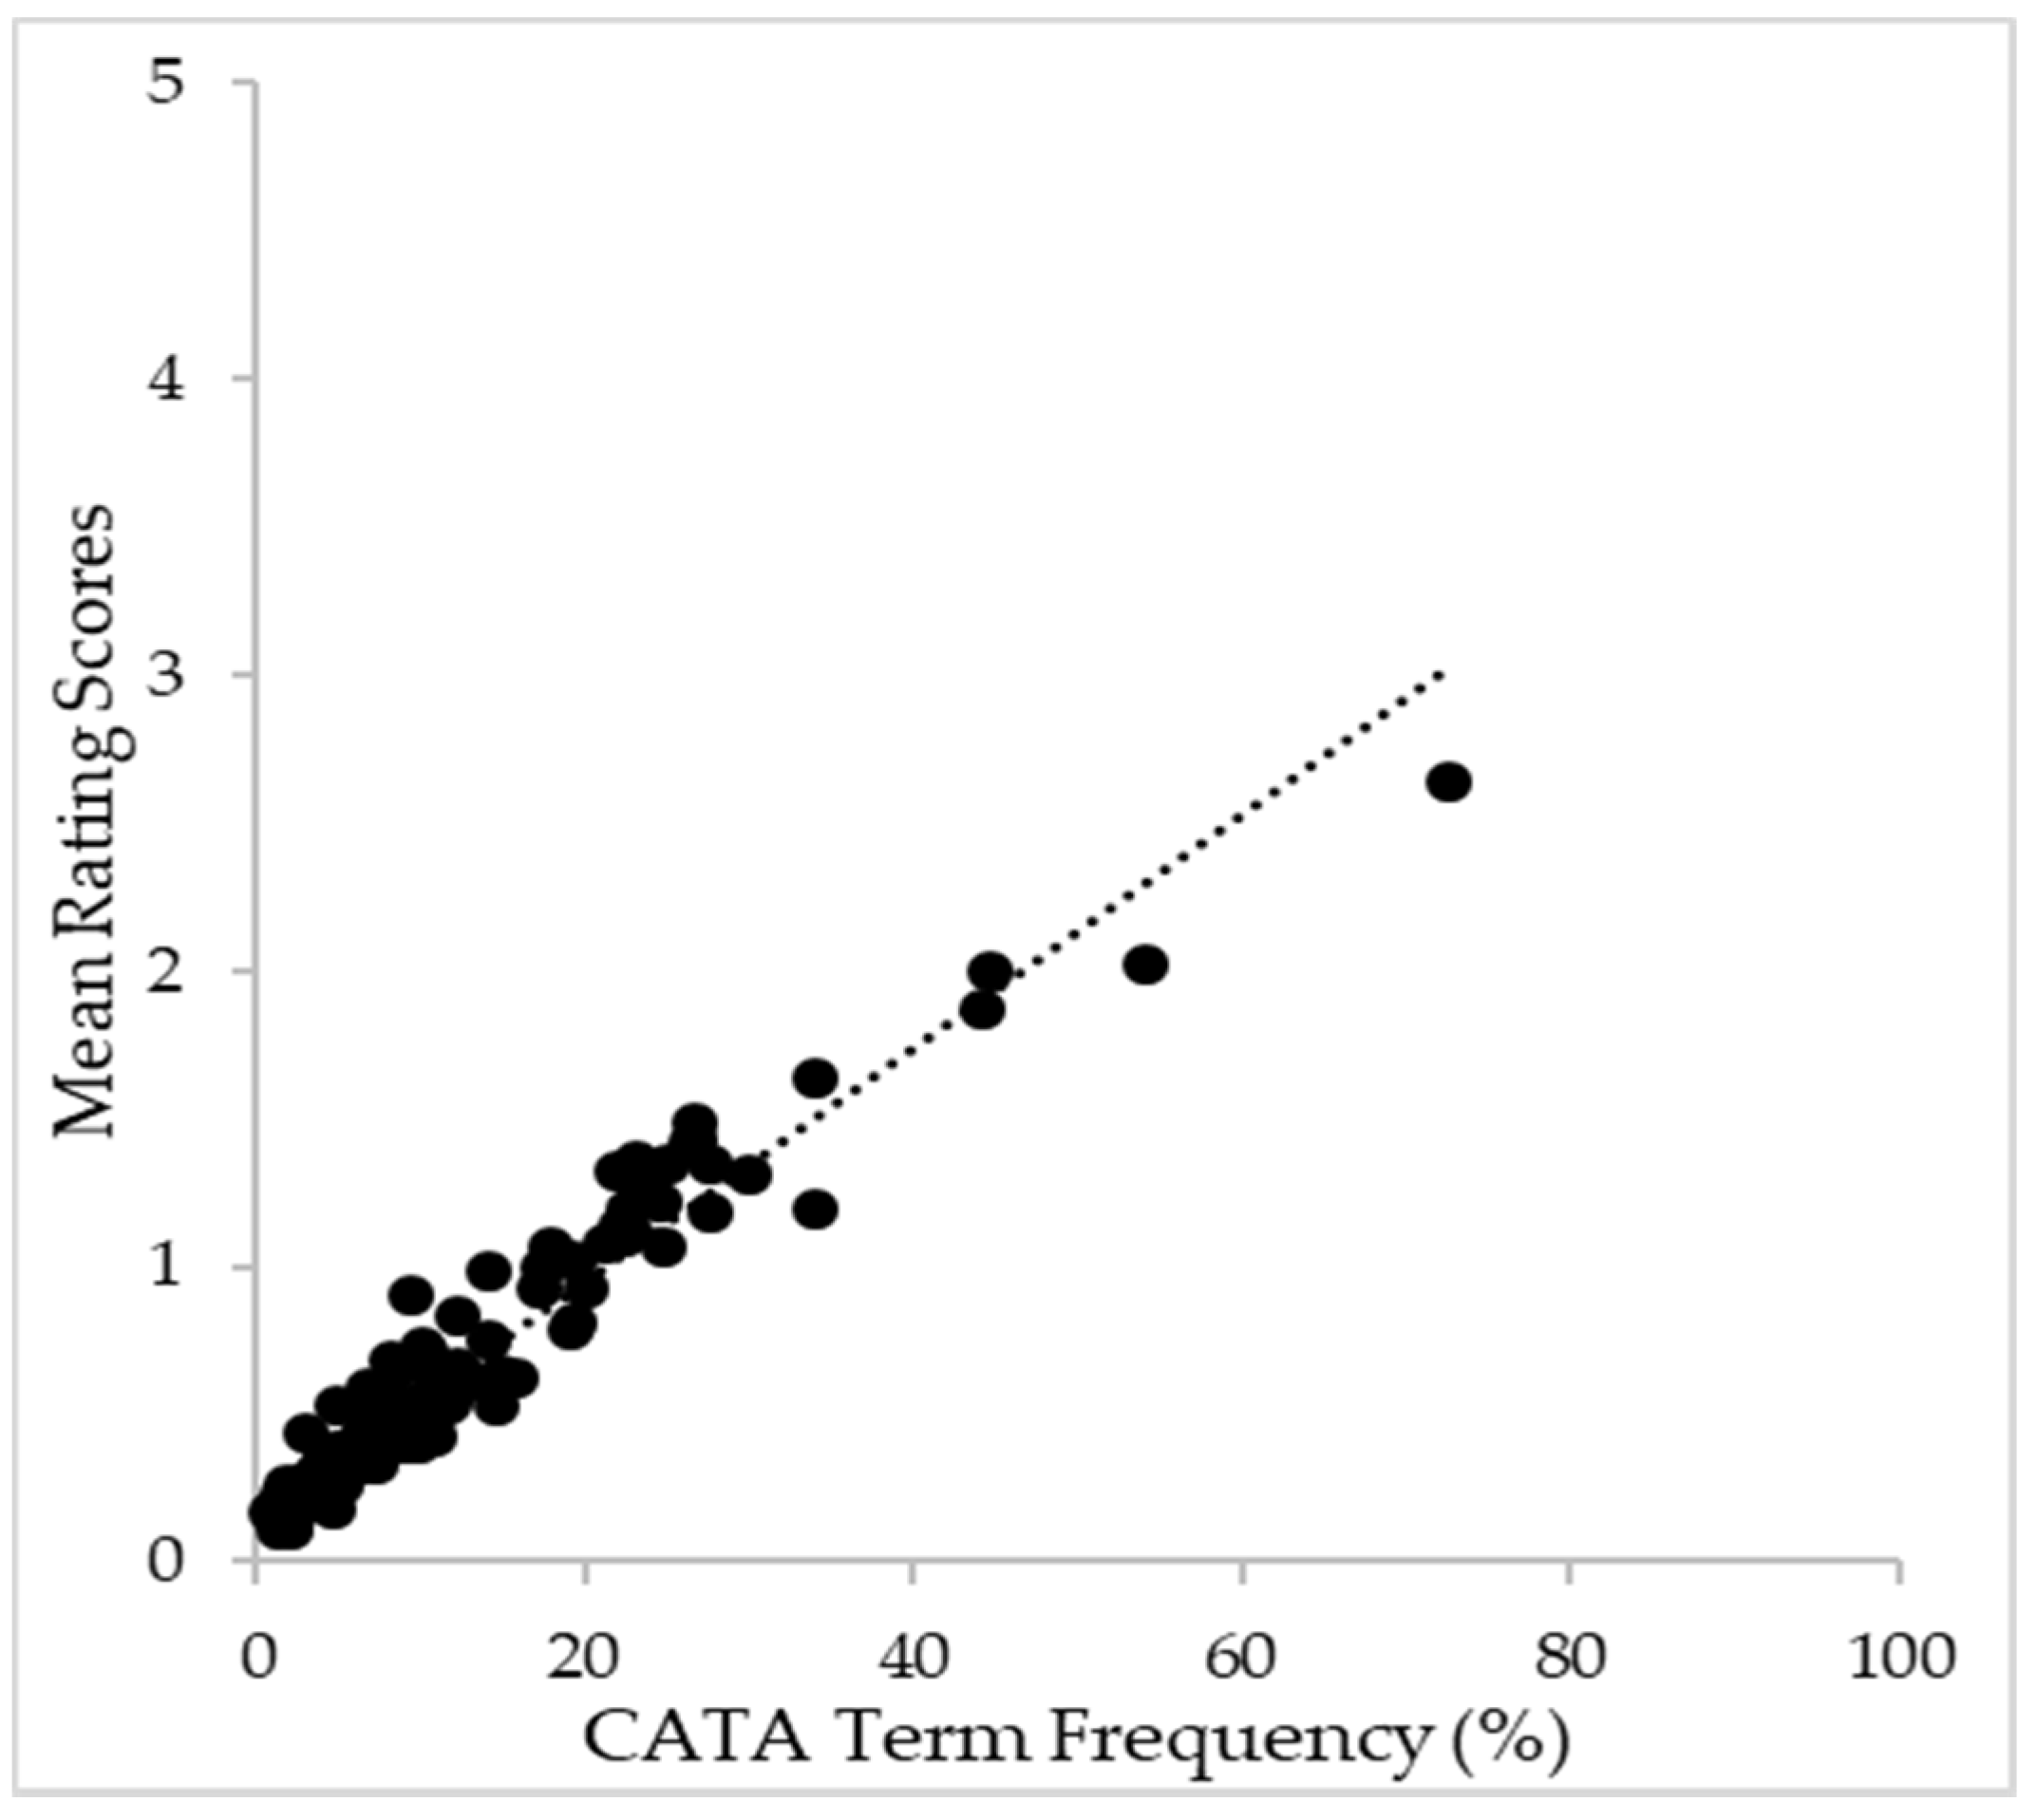
3.1.2. Checked or Not Checked in CATA and Their Respective Rating Intensity Comparisons
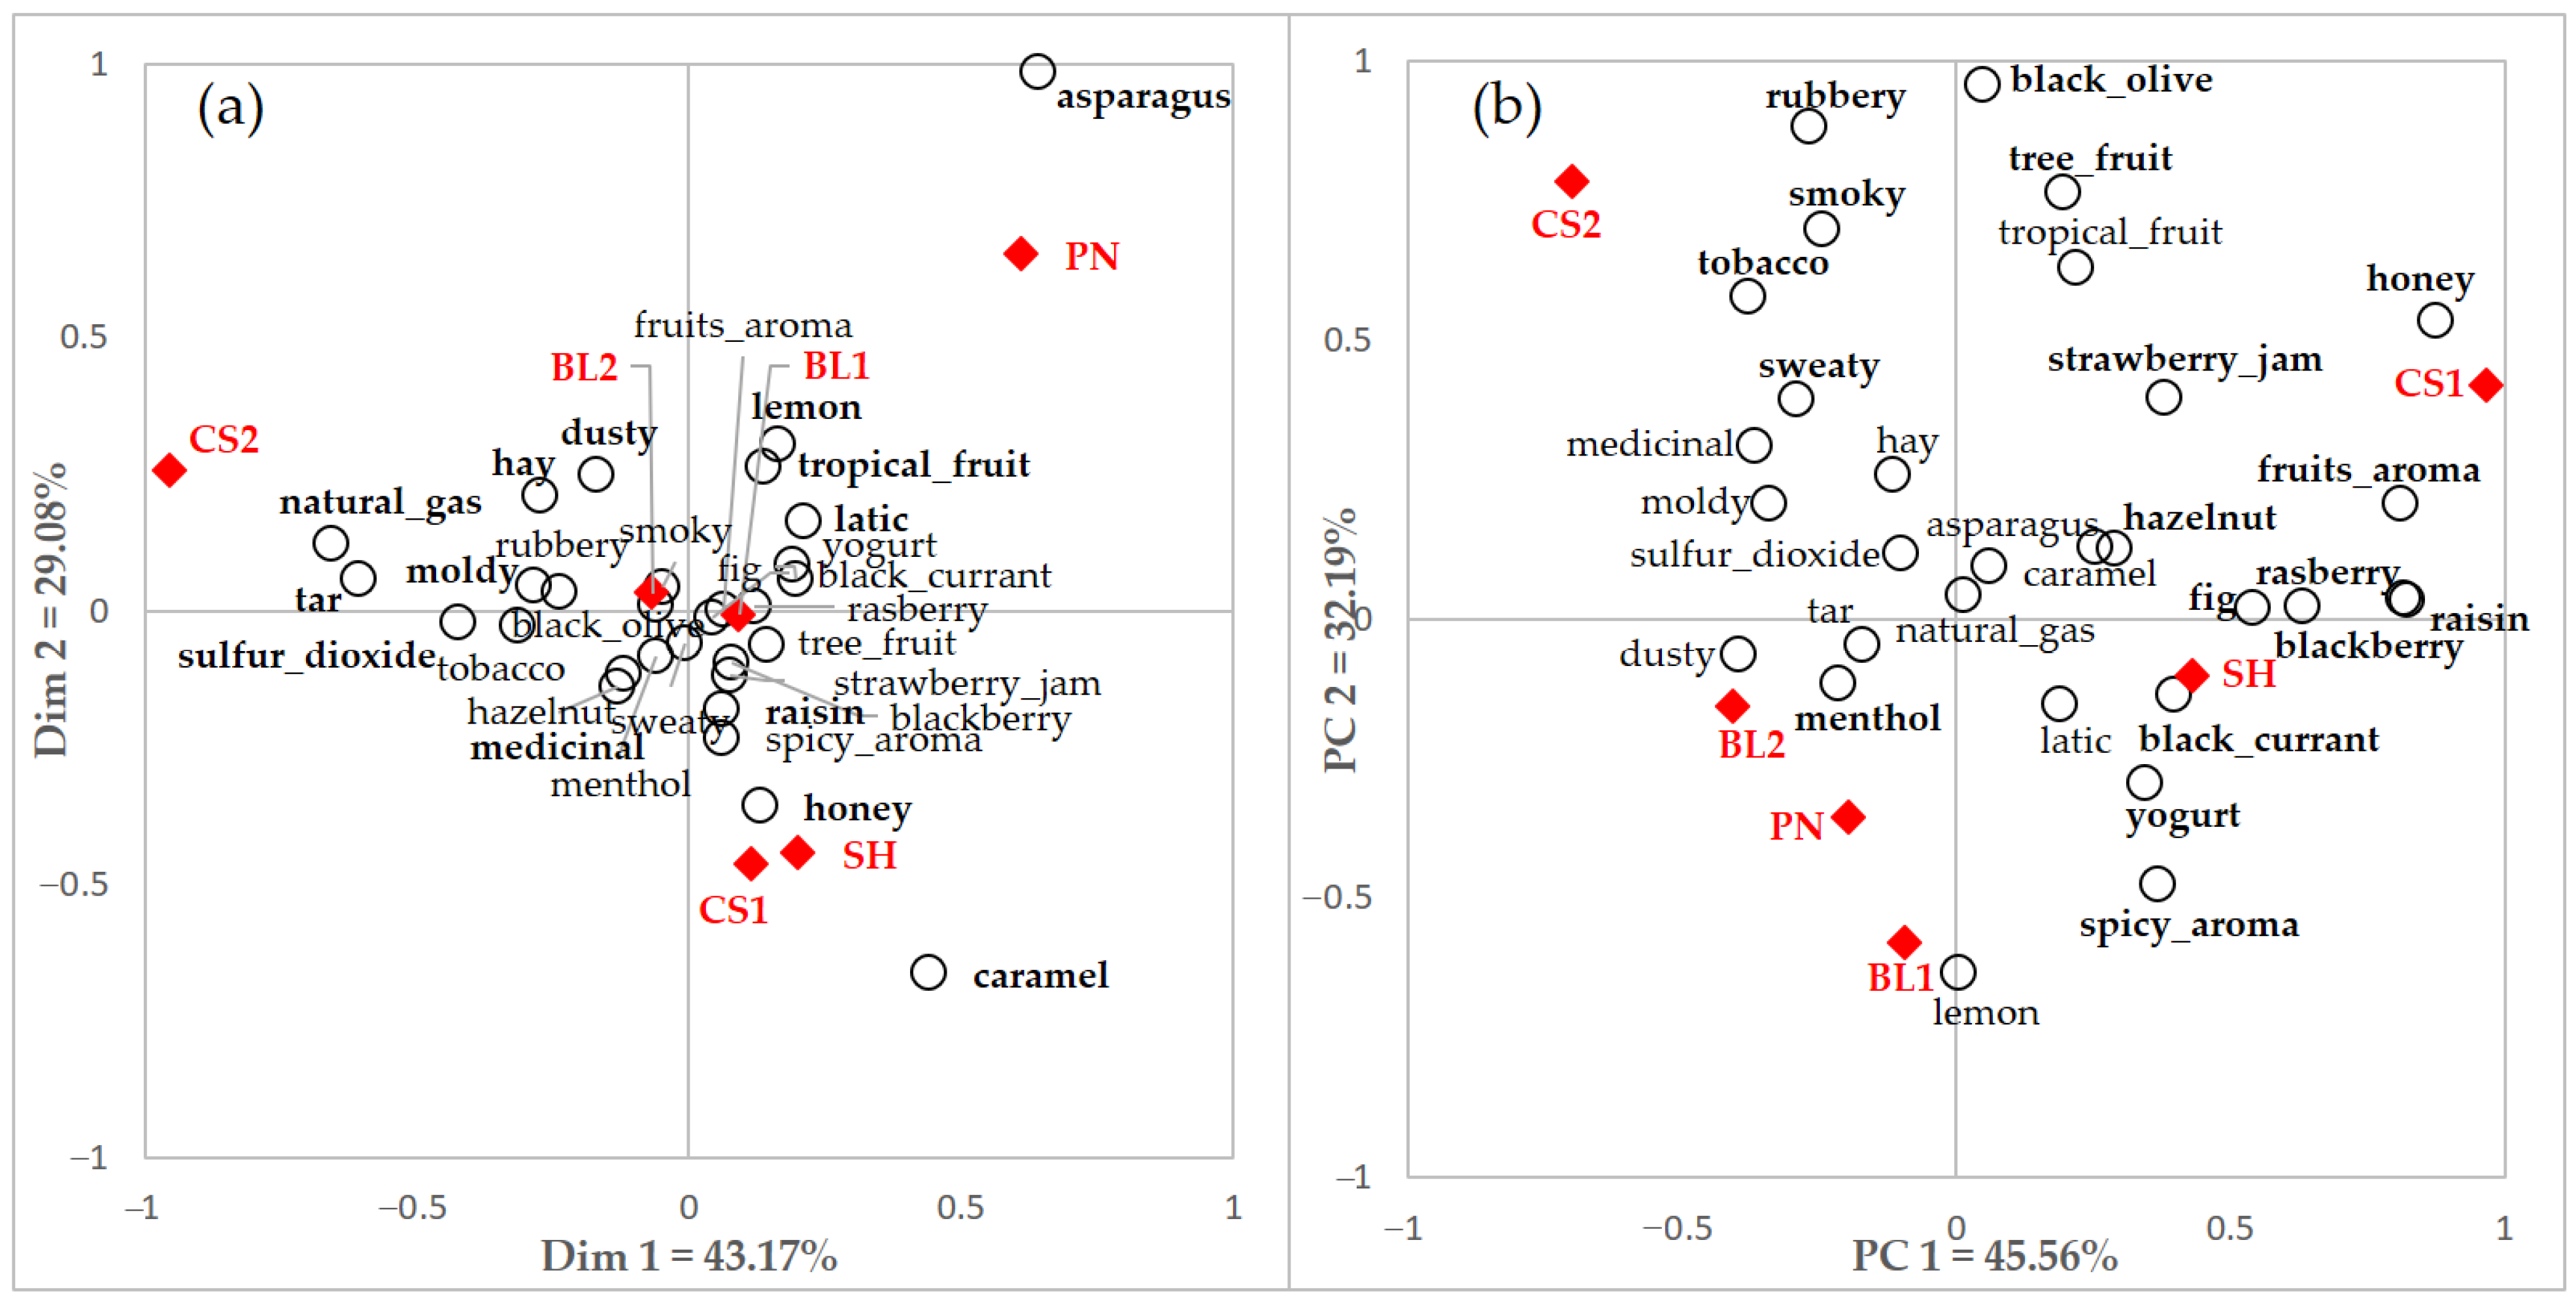
3.1.3. Wine Sample Configuration Comparison between CATA and Rating
3.2. Effects of Familiarity with Wine
3.2.1. Comparison of Significant Terms between Users and Non-Users of Wine Evaluation Using CATA
3.2.2. Significant Terms Comparison between Users and Non-Users of Wine Evaluated Using Rating
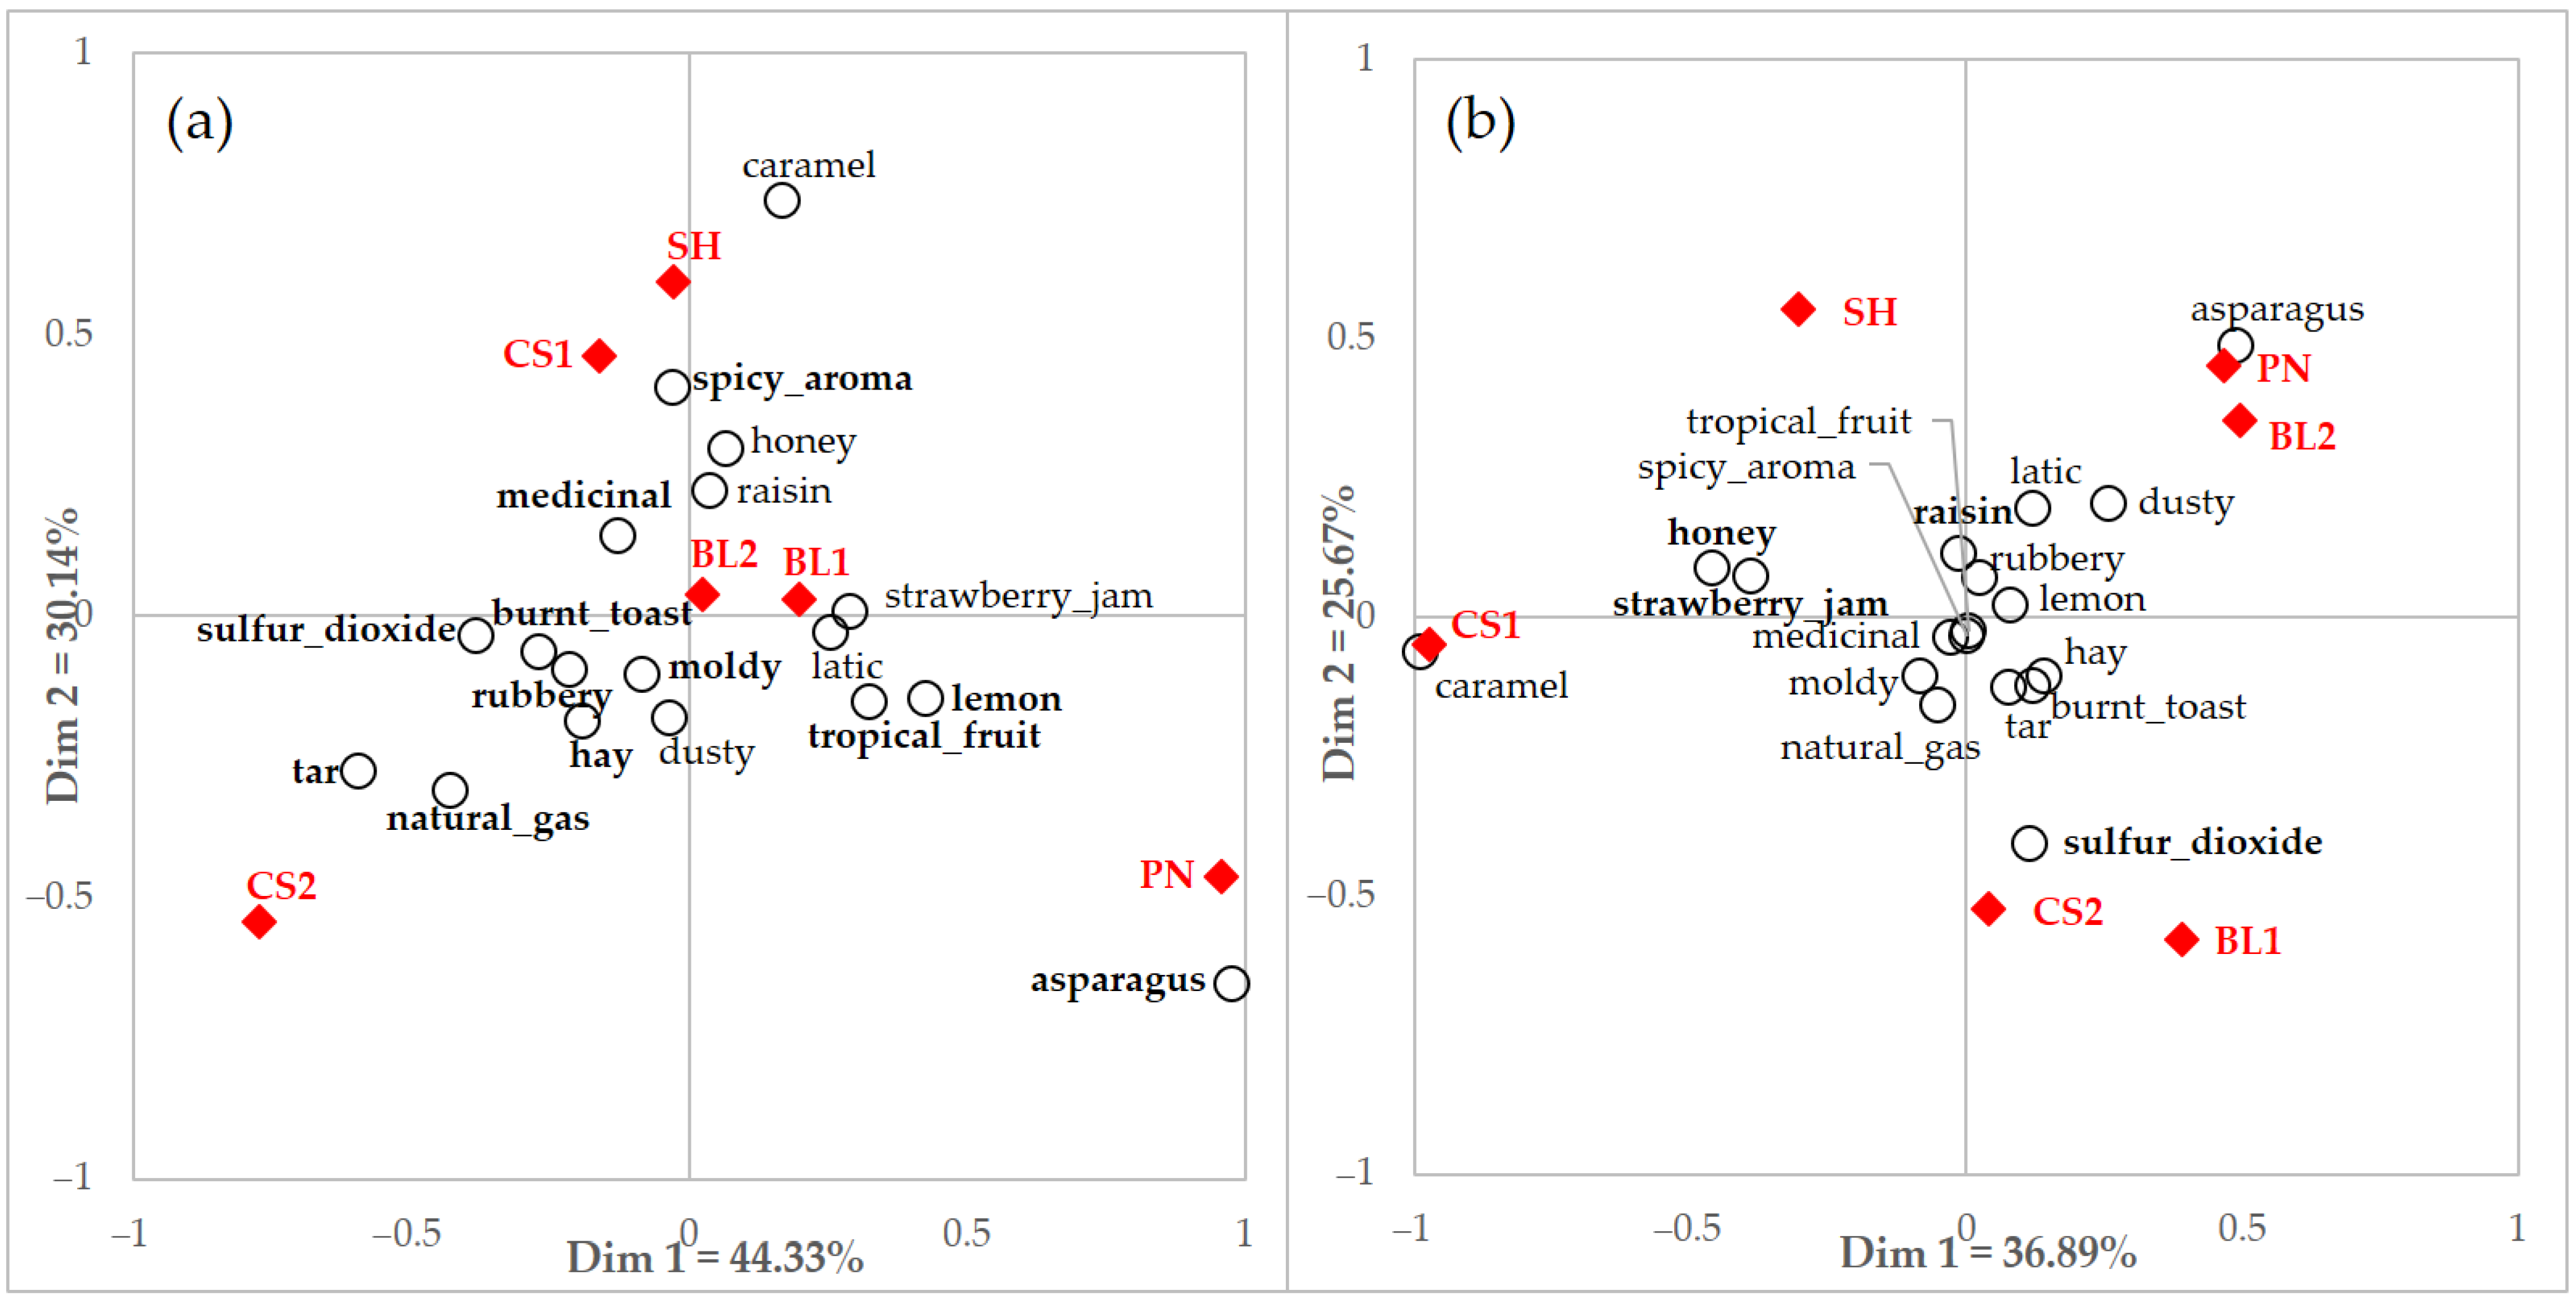
3.2.3. Wine Sample Configuration Comparison between CATA and Rating by User and Non-User Consumers
3.2.4. Acceptability of Wine
3.3. Consumers’ Acceptability Clusters
4. Discussion
4.1. Investigation of Consumers’ Wine Perception Using Consumer-Based Methodologies
4.2. Comparison of Wine Perception Differences for Consumer Group According to Familiarity
4.3. Consumer Acceptance of Wine by Their Preference Trend
5. Conclusions
Author Contributions
Funding
Institutional Review Board Statement
Informed Consent Statement
Data Availability Statement
Conflicts of Interest
References
- Shankar, M.U.; Levitan, C.A.; Spence, C. Grape expectations: The role of cognitive influences in color–flavor interactions. Conscious. Cogn. 2010, 19, 380–390. [Google Scholar] [CrossRef] [PubMed]
- Zampini, M.; Sanabria, D.; Phillips, N.; Spence, C. The multisensory perception of flavor: Assessing the influence of color cues on flavor discrimination responses. Food Qual. Prefer. 2007, 18, 975–984. [Google Scholar] [CrossRef]
- Small, D.M.; Prescott, J. Odor/taste integration and the perception of flavor. Exp. Brain Res. 2005, 166, 345–357. [Google Scholar] [CrossRef]
- Cardello, A.V. Measuring consumer expectations to improve food product development. In Consumer-Led Food Product Development, 1st ed.; Macfie, H.J.H., Ed.; Woodhead Publishing: Cambridge, UK, 2007; pp. 223–261. [Google Scholar]
- Prescott, J.; Johnstone, V.; Francis, J. Odor-Taste Interactions: Effects of Attentional Strategies during Exposure. Chem. Senses 2004, 29, 331–340. [Google Scholar] [CrossRef]
- Monteleone, E.; Spinelli, S.; Dinnella, C.; Endrizzi, I.; Laureati, M.; Pagliarini, E.; Sinesio, F.; Gasperi, F.; Torri, L.; Aprea, E.; et al. Exploring influences on food choice in a large population sample: The Italian Taste project. Food Qual. Prefer. 2017, 59, 123–140. [Google Scholar] [CrossRef]
- Köster, E. Diversity in the determinants of food choice: A psychological perspective. Food Qual. Prefer. 2009, 20, 70–82. [Google Scholar] [CrossRef]
- Sáenz-Navajas, M.P.; Avizcuri, J.M.; Ballester, J.; Fernández-Zurbano, P.; Ferreira, V.; Peyron, D.; Valentin, D. Sensory-active compounds influencing wine experts’ and consumers’ perception of red wine intrinsic quality. LWT Food Sci. Technol. 2015, 60, 400–411. [Google Scholar] [CrossRef]
- Troy, D.; Kerry, J. Consumer perception and the role of science in the meat industry. Meat Sci. 2010, 86, 214–226. [Google Scholar] [CrossRef]
- Deliza, R.; MacFie, H.; Hedderley, D. The consumer sensory perception of passion-fruit juice using free-choice profiling. J. Sens. Stud. 2005, 20, 17–27. [Google Scholar] [CrossRef]
- Costell, E.; Tárrega, A.; Bayarri, S. Food Acceptance: The Role of Consumer Perception and Attitudes. Chemosens. Percept. 2010, 3, 42–50. [Google Scholar] [CrossRef]
- Park, C.W.; Lessig, V.P. Familiarity and Its Impact on Consumer Decision Biases and Heuristics. J. Consum. Res. 1981, 8, 223–230. [Google Scholar] [CrossRef]
- Raju, P.S. Product familiarity, brand name, and price influences on product evaluation. Adv. Consum. Res. 1977, 4, 64–71. [Google Scholar]
- Schwanenflugel, P.J.; Rey, M. The relationship between category typicality and concept familiarity: Evidence from Spanish- and English-speaking monolinguals. Mem. Cogn. 1986, 14, 150–163. [Google Scholar] [CrossRef]
- Torrico, D.D.; Fuentes, S.; Viejo, C.G.; Ashman, H.; Dunshea, F.R. Cross-cultural effects of food product familiarity on sensory acceptability and non-invasive physiological responses of consumers. Food Res. Int. 2019, 115, 439–450. [Google Scholar] [CrossRef]
- Goodman, J.K.; Broniarczyk, S.M.; Griffin, J.G.; McAlister, L. Help or hinder? When recommendation signage expands con-sideration sets and heightens decision difficulty. J. Consum. Psychol. 2013, 23, 165–174. [Google Scholar] [CrossRef]
- Giacalone, D.; Frøst, M.B.; Bredie, W.L.; Pineau, B.; Hunter, D.C.; Paisley, A.G.; Beresford, M.K.; Jaeger, S.R. Situational ap-propriateness of beer is influenced by product familiarity. Food Qual. Prefer. 2015, 39, 16–27. [Google Scholar] [CrossRef]
- Mukherjee, A.; Hoyer, W.D. The Effect of Novel Attributes on Product Evaluation. J. Consum. Res. 2001, 28, 462–472. [Google Scholar] [CrossRef]
- Arvola, A.; Lähteenmäki, L.; Tuorila, H. Predicting the intent to purchase unfamiliar and familiar cheeses: The effects of atti-tudes, expected liking and food neophobia. Appetite 1999, 32, 113–126. [Google Scholar] [CrossRef]
- Alemu, M.H.; Olsen, S.B. An analysis of the impacts of tasting experience and peer effects on consumers’ willingness to pay for novel foods. Agribusiness 2020, 36, 653–674. [Google Scholar] [CrossRef]
- Booth, D.A. Measuring sensory and marketing influences on consumers’ choices among food and beverage product brands. Trends Food Sci. Technol. 2014, 35, 129–137. [Google Scholar] [CrossRef]
- Grunert, K.G. Purchase and consumption: The interdisciplinary nature of analysing food choice. Food Qual. Prefer. 2003, 14, 39–40. [Google Scholar] [CrossRef]
- Jackson, R.S. Wine Science Principles and Applications, 4th ed.; Academic Press: San Diego, CA, USA, 2014; p. 9. [Google Scholar]
- Bird, D. Understanding Wine Technology the Science of Wine Explained, 3rd ed.; The Wine Appreciation Guild: San Francisco, CA, USA, 2011; pp. 10–11. [Google Scholar]
- Parr, W.V.; Mouret, M.; Blackmore, S.; Pelquest-Hunt, T.; Urdapilleta, I. Representation of complexity in wine: Influence of expertise. Food Qual. Prefer. 2011, 22, 647–660. [Google Scholar] [CrossRef]
- Brochet, F.; Dubourdieu, D. Wine Descriptive Language Supports Cognitive Specificity of Chemical Senses. Brain Lang. 2001, 77, 187–196. [Google Scholar] [CrossRef] [PubMed]
- Yang, J.; Lee, J. Current Research Related to Wine Sensory Perception Since 2010. Beverages 2020, 6, 47. [Google Scholar] [CrossRef]
- Williamson, P.; Robichaud, J.; Francis, I. Comparison of Chinese and Australian consumers’ liking responses for red wines. Aust. J. Grape Wine Res. 2012, 18, 256–267. [Google Scholar] [CrossRef]
- Lattey, K.A.; Bramley, B.R.; Francis, I.L. Consumer acceptability, sensory properties and expert quality judgements of Aus-tralian Cabernet Sauvignon and Shiraz wines. Aust. J. Grape Wine Res. 2010, 16, 189–202. [Google Scholar] [CrossRef]
- Hopfer, H.; Heymann, H. Judging wine quality: Do we need experts, consumers or trained panelists? Food Qual. Prefer. 2014, 32, 221–233. [Google Scholar] [CrossRef]
- Charters, S.; Pettigrew, S. The dimensions of wine quality. Food Qual. Prefer. 2007, 18, 997–1007. [Google Scholar] [CrossRef]
- Francis, I.; Williamson, P. Application of consumer sensory science in wine research. Aust. J. Grape Wine Res. 2015, 21, 554–567. [Google Scholar] [CrossRef]
- Lesschaeve, I. Sensory evaluation of wine and commercial realities: Review of current practices and perspectives. Am. J. Enol. Viticult. 2007, 58, 252–258. [Google Scholar]
- Tempere, S.; Pérès, S.; Espinoza, A.F.; Darriet, P.; Giraud-Héraud, E.; Pons, A. Consumer preferences for different red wine styles and repeated exposure effects. Food Qual. Prefer. 2019, 73, 110–116. [Google Scholar] [CrossRef]
- Korea International Trade Association. “Export-Import of Item”. Available online: https://stat.kita.net/stat/kts/pum/ItemImpExpDetailPopup.screen (accessed on 18 December 2020).
- Jeon, S.; Seo, S.; Bartolini, F. Wine Market Segmentation Considering New Consumption Trend: Focusing on Korea Wine Fes-tival Participants. Korean J. Agric. Econ. 2019, 60, 153–175. [Google Scholar] [CrossRef]
- Valentin, D.; Chollet, S.; Lelièvre, M.; Abdi, H. Quick and dirty but still pretty good: A review of new descriptive methods in food science. Int. J. Food Sci. Technol. 2012, 47, 1563–1578. [Google Scholar] [CrossRef]
- Ares, G.; Deliza, R.; Barreiro, C.; Giménez, A.; Gámbaro, A. Comparison of two sensory profiling techniques based on con-sumer perception. Food Qual. Prefer. 2010, 21, 417–426. [Google Scholar] [CrossRef]
- Alencar, N.M.M.; Ribeiro, T.G.; Barone, B.; Barros, A.P.A.; Marques, A.T.B.; Behrens, J.H. Sensory profile and check-all-that-apply (cata) as tools for evaluating and characterizing syrah wines aged with oak chips. Food Res. Int. 2019, 124, 156–164. [Google Scholar] [CrossRef]
- Ares, G.; Jaeger, S.R. Check-all-that-apply (CATA) questions with consumers in practice: Experimental considerations and impact on outcome. In Rapid Sensory Profiling Techniques, 1st ed.; Delarue, J., Lawlor, J.B., Rogeaux, M., Eds.; Woodhead Publishing: Cambridge, UK, 2015; pp. 227–245. [Google Scholar]
- Ares, G.; Varela, P. Comparison of Novel Methodologies for Sensory Characterization. In Novel Techniques in Sensory Characterization and Consumer Profiling; Apple Academic Press: Boca Raton, FL, USA, 2014; pp. 365–390. [Google Scholar]
- Ares, G.; Antúnez, L.; Bruzzone, F.; Vidal, L.; Giménez, A.; Pineau, B.; Beresford, M.K.; Jin, D.; Paisley, A.G.; Chheang, S.L.; et al. Comparison of sensory product profiles generated by trained assessors and consumers using CATA questions: Four case studies with complex and/or similar samples. Food Qual. Prefer. 2015, 45, 75–86. [Google Scholar] [CrossRef]
- Ares, G.; Antúnez, L.; Giménez, A.; Roigard, C.M.; Pineau, B.; Hunter, D.C.; Jaeger, S.R. Further investigations into the re-producibility of check-all-that-apply (CATA) questions for sensory product characterization elicited by consumers. Food Qual. Prefer. 2014, 36, 111–121. [Google Scholar] [CrossRef]
- Jaeger, S.R.; Chheang, S.L.; Yin, J.; Bava, C.M.; Gimenez, A.; Vidal, L.; Ares, G. Check-all-that-apply (CATA) responses elicited by consumers: Within-assessor reproducibility and stability of sensory product characterizations. Food Qual. Prefer. 2013, 30, 56–67. [Google Scholar] [CrossRef]
- Meyners, M.; Jaeger, S.R.; Ares, G. On the analysis of rate-all-that-apply (RATA) data. Food Qual. Prefer. 2016, 49, 1–10. [Google Scholar] [CrossRef]
- Reinbach, H.C.; Giacalone, D.; Ribeiro, L.M.; Bredie, W.L.; Frøst, M.B. Comparison of three sensory profiling methods based on consumer perception: CATA, CATA with intensity and Napping®. Food Qual. Prefer. 2014, 32, 160–166. [Google Scholar] [CrossRef]
- Danner, L.; Crump, A.M.; Croker, A.; Gambetta, J.M.; Johnson, T.E.; Bastian, S.E. Comparison of rate-all-that-apply and de-scriptive analysis for the sensory profiling of wine. Am. J. Enol. Viticult. 2018, 69, 12–21. [Google Scholar] [CrossRef]
- Vidal, L.; Ares, G.; Hedderley, D.I.; Meyners, M.; Jaeger, S.R. Comparison of rate-all-that-apply (RATA) and check-all-that-apply (CATA) questions across seven consumer studies. Food Qual. Prefer. 2018, 67, 49–58. [Google Scholar] [CrossRef]
- Ares, G.; Bruzzone, F.; Vidal, L.; Cadena, R.S.; Giménez, A.; Pineau, B.; Hunter, D.C.; Paisley, A.G.; Jaeger, S.R. Evaluation of a rating-based variant of check-all-that-apply questions: Rate-all-that-apply (RATA). Food Qual. Prefer. 2014, 36, 87–95. [Google Scholar] [CrossRef]
- Oppermann, A.; De Graaf, C.; Scholten, E.; Stieger, M.; Piqueras-Fiszman, B. Comparison of Rate-All-That-Apply (RATA) and Descriptive sensory Analysis (DA) of model double emulsions with subtle perceptual differences. Food Qual. Prefer. 2017, 56, 55–68. [Google Scholar] [CrossRef]
- Corsi, A.M.; Cohen, J.; Lockshin, L.; Williamson, P. Testing lexical equivalences for wine flavours in emerging markets: Do hawthorns taste like blackberries? Food Qual. Prefer. 2017, 62, 296–306. [Google Scholar] [CrossRef]
- Franco-Luesma, E.; Sáenz-Navajas, M.-P.; Valentin, D.; Ballester, J.; Rodrigues, H.; Ferreira, V. Study of the effect of H 2 S, MeSH and DMS on the sensory profile of wine model solutions by rate-all-that-apply (RATA). Food Res. Int. 2016, 87, 152–160. [Google Scholar] [CrossRef] [PubMed]
- Puyares, V.; Ares, G.; Carrau, F. Searching a specific bottle for Tannat wine using a check-all-that apply question and con-joint analysis. Food Qual. Prefer. 2010, 21, 684–691. [Google Scholar] [CrossRef]
- Biasoto, A.C.T.; Netto, F.M.; Marques, E.J.N.; Da Silva, M.A.A.P. Acceptability and preference drivers of red wines produced from Vitis labrusca and hybrid grapes. Food Res. Int. 2014, 62, 456–466. [Google Scholar] [CrossRef]
- Sáenz-Navajas, M.P.; Ballester, J.; Pêcher, C.; Peyron, D.; Valentin, D. Sensory drivers of intrinsic quality of red wines: Effect of culture and level of expertise. Food Res. Int. 2013, 54, 1506–1518. [Google Scholar] [CrossRef]
- Noble, A.C.; Arnold, R.A.; Buechsenstein, J.; Leach, E.J.; Schmidt, J.O.; Stern, P.M. Modification of a standardized system of wine aroma terminology. Am. J. Enol. Viticult. 1987, 38, 143–146. [Google Scholar]
- Choi, Y.; Lee, J. The effect of extrinsic cues on consumer perception: A study using milk tea products. Food Qual. Prefer. 2019, 71, 343–353. [Google Scholar] [CrossRef]
- Jaeger, S.R.; Chheang, S.L.; Jin, D.; Roigard, C.M.; Ares, G. Check-all-that-apply (CATA) questions: Sensory term citation frequency reflects rated term intensity and applicability. Food Qual. Prefer. 2020, 86, 103986. [Google Scholar] [CrossRef]
- Cochran, W.G.; Cox, G.M. Experimental Designs, 2nd ed.; John Wiley & Sons Inc.: La Vergne, TN, USA, 1992; pp. 95–147. [Google Scholar]
- Cochran, W.G. The comparison of percentages in matched samples. Biometrika 1950, 37, 256–266. [Google Scholar] [CrossRef] [PubMed]
- Robert, P.; Escoufier, Y. A Unifying Tool for Linear Multivariate Statistical Methods: The RV- Coefficient. J. R. Stat. Soc. Ser. C Appl. Stat. 1976, 25, 257. [Google Scholar] [CrossRef]
- Heo, J.; Choi, K.S.; Wang, S.; Adhikari, K.; Lee, J. Cold brew coffee: Consumer acceptability and characterization using the check-all-that-apply (CATA) method. Foods 2019, 8, 344. [Google Scholar] [CrossRef]
- King, S.C.; Meiselman, H.L. Development of a method to measure consumer emotions associated with foods. Food Qual. Prefer. 2010, 21, 168–177. [Google Scholar] [CrossRef]
- Pramudya, R.C.; Seo, H.-S. Using Check-All-That-Apply (CATA) method for determining product temperature-dependent sensory-attribute variations: A case study of cooked rice. Food Res. Int. 2018, 105, 724–732. [Google Scholar] [CrossRef]
- Meyners, M.; Castura, J.C. Randomization of CATA attributes: Should attribute lists be allocated to assessors or to samples? Food Qual. Prefer. 2016, 48, 210–215. [Google Scholar] [CrossRef]
- Lee, Y.; Findlay, C.; Meullenet, J.-F. Experimental consideration for the use of check-all-that-apply questions to describe the sensory properties of orange juices. Int. J. Food Sci. Technol. 2012, 48, 215–219. [Google Scholar] [CrossRef]
- Jaeger, S.R.; Beresford, M.K.; Lo, K.R.; Hunter, D.C.; Chheang, S.L.; Ares, G. What does it mean to check-all-that-apply? Four case studies with beverages. Food Qual. Prefer. 2020, 80, 103794. [Google Scholar] [CrossRef]
- Clark, C.C.; Lawless, H.T. Limiting response alternatives in time-intensity scaling: An examination of the halo-dumping effect. Chem. Senses 1994, 19, 583–594. [Google Scholar] [CrossRef]
- Melo, L.; Delahunty, C.; Cox, D.N. A new approach using consumers’ ‘drinking histories’ to explain current wine acceptance. Food Res. Int. 2011, 44, 3235–3242. [Google Scholar] [CrossRef]
- Prescott, J.; Bell, G.; Gillmore, R.; Yoshida, M.; O’Sullivan, M.; Korac, S.; Allen, S.; Yamazaki, K. Cross-cultural comparisons of Japanese and Australian responses to manipulations of sourness, saltiness and bitterness in foods. Food Qual. Prefer. 1998, 9, 53–66. [Google Scholar] [CrossRef]
- Borgogno, M.; Favotto, S.; Corazzin, M.; Cardello, A.V.; Piasentier, E. The role of product familiarity and consumer involve-ment on liking and perceptions of fresh meat. Food Qual. Prefer. 2015, 44, 139–147. [Google Scholar] [CrossRef]
- Deliza, R.; MacFie, H.J. The generation of sensory expectation by external cues and its effect on sensory perception and hedonic ratings: A review. J. Sens. Stud. 1996, 11, 103–128. [Google Scholar] [CrossRef]


| Label | Product Name | Type | Cultivar | Vintage | Country | Alcohol (In Label) | Price (KRW) 1 | Price (USD) |
|---|---|---|---|---|---|---|---|---|
| BL1 | Ca’Marcanda Promis | Blending | Merlot, Syrah, Sangiovese | 2014 | Italia | 13% | 65,000 | 57.52 |
| BL2 | Marqués de Riscal, Reserva | Blending | Tempranillo, Graciano, Mazuelo | 2013 | Spain | 14% | 40,000 | 35.40 |
| CS1 | Columbia Crest | Monovarietal | Cabernet Sauvignon | 2016 | USA | 13.5% | 20,000 | 17.70 |
| CS2 | Cono Sur Bicicleta | Monovarietal | Cabernet Sauvignon | 2017 | Chile | 13.5% | 14,500 | 12.83 |
| PN | Chambolle–Musigny Louis Jadot | Monovarietal | Pinot Noir | 2014 | France | 13% | 130,000 | 115.04 |
| SH | The Lackey | Monovarietal | Shiraz | 2016 | Australia | 14.5% | 19,000 | 16.81 |
| Group A 2 | Group B 3 | Group C 4 | |||||
|---|---|---|---|---|---|---|---|
| Dusty | Acetic acid | Dried | Leesy | Rubbery | Almond | Diacetyl butter | Skunk |
| Hay | Alcohol | Dried fruit | Licorice | Sauerkraut | Artichoke | Eucalyptus | Strawberry jam |
| Honey | Apple | Earthy aromas | Menthol | Smoky | Asparagus | Garlic | Sulfur |
| Lactic | Apricot | Ethanol | Micro scents | Soybean | Bacon | Geranium | Sweaty |
| Lemon | Artificial fruit | Ethyl acetate | Mint | Spicy | Banana | Green beans | Tar |
| Medicinal | Berry | Fig | Moldy cork | Spicy aroma | Bell pepper | Hazelnut | Vanilla |
| Moldy | Black currant | Floral | Orange blossom | Strawberry | Black pepper | Hydrogen sulfide | Violet |
| Natural gas | Black olive | Floral aromas | Oxidized | Tea | Burnt match | Melon | Walnut |
| Raisin | Blackberry | Fresh | Petroleum | Tobacco | Butterscotch | Molasses | Wet wool |
| Sulfur dioxide | Burnt toast | Fruits aroma | Phenolic | Tree fruit | Cabbage | Mushroom | |
| Tropical fruit | Cedar | Grapefruit | Pineapple | Wood aromas | Caramel | Oak | |
| Chemical | Green grass | Prune | Yeast | Chocolate | Other | ||
| Cherry | Green olive | Pungent | Yogurt | Cloves | Peach | ||
| Citrus | Herbaceous | Raspberry | Coffee | Plastic | |||
| Diesel | Kerosene | Rose | Cooked | Resinous | |||
| Wine Sample | Rating Mean 2 | CATA Frequency Sum | Rating Mean | t-Value | p-Value | |
|---|---|---|---|---|---|---|
| Not check (n) | Check (n) | |||||
| Alcohol | ||||||
| BL1 | 2.7 | 85 | 2.2 (n = 37) | 2.9 (n = 85) | −2.73 | 0.0074 |
| BL2 | 2.7 | 91 | 2.3 (n = 31) | 2.8 (n = 91) | −1.89 | 0.0609 |
| CS1 | 2.5 | 90 | 2.2 (n = 32) | 2.6 (n = 90) | −1.44 | 0.1538 |
| CS2 | 2.7 | 87 | 1.8 (n = 35) | 3.1 (n = 87) | −4.79 | <0.0001 |
| PN | 2.6 | 88 | 1.9 (n = 34) | 2.8 (n = 88) | −3.60 | 0.0005 |
| SH | 2.6 | 91 | 2.3 (n = 31) | 2.8 (n = 91) | −1.61 | 0.1103 |
| Artificial fruit | ||||||
| BL1 | 1.7 | 46 | 1.3 (n = 76) | 2.4 (n = 76) | −4.60 | <0.0001 |
| BL2 | 1.6 | 36 | 1.4 (n = 86) | 2.2 (n = 36) | −2.82 | 0.0056 |
| CS1 | 1.6 | 35 | 1.5 (n = 87) | 1.9 (n = 35) | −1.72 | 0.0875 |
| CS2 | 1.6 | 44 | 1.2 (n = 78) | 2.3 (n = 43) | −4.88 | <0.0001 |
| PN | 1.6 | 41 | 1.2 (n = 81) | 2.5 (n = 41) | −5.80 | <0.0001 |
| SH | 1.7 | 47 | 1.4 (n = 75) | 2.0 (n = 47) | −2.54 | 0.0123 |
| Ethanol | ||||||
| BL1 | 2.0 | 55 | 1.4 (n = 67) | 2.7 (n = 55) | −4.86 | <0.0001 |
| BL2 | 1.9 | 58 | 1.4 (n = 64) | 2.4 (n = 58) | −4.03 | <0.0001 |
| CS1 | 1.8 | 52 | 1.4 (n = 70) | 2.4 (n = 52) | −3.92 | 0.0001 |
| CS2 | 1.8 | 60 | 1.2 (n = 62) | 2.6 (n = 60) | −5.55 | <0.0001 |
| PN | 1.8 | 50 | 1.2 (n = 72) | 2.6 (n = 50) | −6.17 | <0.0001 |
| SH | 1.9 | 48 | 1.4 (n = 74) | 2.6 (n = 48) | −4.77 | <0.0001 |
| Fruit aroma | ||||||
| BL1 | 2.0 abc | 64 | 1.7 (n = 57) | 2.3 (n = 64) | −2.32 | 0.0221 |
| BL2 | 1.8 c | 65 | 1.5 (n = 57) | 2.0 (n = 62) | −2.03 | 0.0451 |
| CS1 | 2.2 a | 70 | 2.0 (n = 52) | 2.4 (n = 70) | −1.67 | 0.0970 |
| CS2 | 2.0 bc | 59 | 1.7 (n = 61) | 2.2 (n = 59) | −1.57 | 0.1180 |
| PN | 2.1 ac | 71 | 1.9 (n = 51) | 2.2 (n = 71) | −1.29 | 0.1994 |
| SH | 2.1 ac | 68 | 1.7 (n = 54) | 2.4 (n = 68) | −2.96 | 0.0037 |
| Oxidized | ||||||
| BL1 | 2.1 | 51 | 1.7 (n = 71) | 2.7 (n = 51) | −3.93 | 0.0001 |
| BL2 | 2.0 | 63 | 1.5 (n = 59) | 2.5 (n = 63) | −3.38 | 0.0010 |
| CS1 | 1.8 | 53 | 1.3 (n = 69) | 2.5 (n = 53) | −4.91 | <0.0001 |
| CS2 | 2.1 | 57 | 1.5 (n = 65) | 2.7 (n = 57) | −4.62 | <0.0001 |
| PN | 2.0 | 53 | 1.5 (n = 69) | 2.6 (n = 53) | −4.72 | <0.0001 |
| SH | 2.0 | 50 | 1.5 (n = 72) | 2.8 (n = 50) | −4.98 | <0.0001 |
| Pungent | ||||||
| BL1 | 1.2 | 39 | 1.0 (n = 83) | 1.8 (n = 39) | −2.83 | 0.0055 |
| BL2 | 1.3 | 47 | 1.1 (n = 75) | 1.6 (n = 47) | −2.09 | 0.0385 |
| CS1 | 1.1 | 46 | 0.6 (n = 76) | 2.0 (n = 46) | −5.37 | <0.0001 |
| CS2 | 1.1 | 38 | 1.0 (n = 83) | 1.5 (n = 38) | −1.94 | 0.0550 |
| PN | 1.2 | 39 | 0.9 (n = 83) | 1.9 (n = 39) | −3.9 | 0.0002 |
| SH | 1.1 | 40 | 1.0 (n = 82) | 1.5 (n = 40) | −1.84 | 0.0687 |
| All Participants (n = 122) | Users (n = 77) | Non-Users (n = 45) | ||||
|---|---|---|---|---|---|---|
| Frequency | (%) | Frequency | (%) | Frequency | (%) | |
| Sex | ||||||
| Male | 52 | 42.6 | 30 | 39.0 | 22 | 48.9 |
| Female | 70 | 57.4 | 47 | 61.0 | 23 | 51.1 |
| Age | ||||||
| 19–26 years | 86 | 70.5 | 49 | 63.6 | 37 | 82.3 |
| 26–35 years | 31 | 25.4 | 25 | 32.5 | 6 | 13.3 |
| 36–45 years | 3 | 2.5 | 2 | 2.6 | 1 | 2.2 |
| 46–55 years | 1 | 0.8 | 1 | 1.3 | 0 | 0.0 |
| 56–65 years | 1 | 0.8 | 0 | 0.0 | 1 | 2.2 |
| Occupation | ||||||
| Student | 100 | 82.0 | 59 | 76.6 | 41 | 91.2 |
| Employed | 15 | 12.3 | 13 | 16.9 | 2 | 4.4 |
| Others | 7 | 5.7 | 5 | 6.5 | 2 | 4.4 |
| Consumption frequency | ||||||
| Never drink | 45 | 36.9 | 0 | 0.0 | 45 | 100.0 |
| Once a month | 59 | 48.4 | 59 | 76.6 | 0 | 0.0 |
| 2–3 times a month | 14 | 11.5 | 14 | 18.2 | 0 | 0.0 |
| Once a week | 3 | 2.4 | 3 | 3.9 | 0 | 0.0 |
| 2–3 times a week | 1 | 0.8 | 1 | 1.3 | 0 | 0.0 |
| Ease of CATA response | ||||||
| Not at all | 3 | 2.5 | 2 | 2.6 | 1 | 2.2 |
| Not really | 28 | 22.9 | 13 | 16.9 | 15 | 33.3 |
| Neutral | 35 | 28.7 | 24 | 31.2 | 11 | 24.5 |
| Somewhat | 44 | 36.1 | 31 | 40.2 | 13 | 28.9 |
| Very much | 12 | 9.8 | 7 | 9.1 | 5 | 11.1 |
| Ease of rating response | ||||||
| Not at all | 5 | 4.1 | 3 | 3.9 | 2 | 4.4 |
| Not really | 32 | 26.2 | 17 | 22.1 | 15 | 33.3 |
| Neutral | 45 | 36.9 | 32 | 41.5 | 13 | 28.9 |
| Somewhat | 35 | 28.7 | 24 | 31.2 | 11 | 24.5 |
| Very much | 5 | 4.1 | 1 | 1.3 | 4 | 8.9 |
| Boredom of CATA response | ||||||
| Not at all | 12 | 9.8 | 7 | 9.1 | 5 | 11.1 |
| Not really | 57 | 46.7 | 41 | 53.2 | 16 | 35.6 |
| Neutral | 39 | 32.0 | 21 | 27.3 | 18 | 40.0 |
| Somewhat | 11 | 9.0 | 6 | 7.8 | 5 | 11.1 |
| Very much | 3 | 2.5 | 2 | 2.6 | 1 | 2.2 |
| Boredom of rating response | ||||||
| Not at all | 15 | 12.3 | 5 | 6.5 | 10 | 22.2 |
| Not really | 59 | 48.4 | 41 | 53.2 | 18 | 40.0 |
| Neutral | 35 | 28.7 | 21 | 27.3 | 14 | 31.1 |
| Somewhat | 10 | 8.2 | 8 | 10.4 | 2 | 4.5 |
| Very much | 3 | 2.4 | 2 | 2.6 | 1 | 2.2 |
| All 1 | Users | Non-Users | |||
|---|---|---|---|---|---|
| No. | No. | Attributes | No. | Attributes | |
| CATA | 14 | 12 | asparagus, burnt toast, hay, lemon, medicinal, moldy, natural gas, rubbery, spicy aroma, sulfur dioxide, tar, tropical fruit | 4 | honey, raisin, strawberry jam, sulfur dioxide |
| Rating | 18 | 9 | black olive, honey, oxidized, rubbery, smoky, spicy aroma, sweaty, tobacco, yogurt | 10 | berry, burnt toast, butterscotch, cherry, fig, fruits aroma, molasses, prune, strawberry, strawberry jam |
| Consumer Liking by Familiarity | Consumer Liking by Cluster | ||||||
|---|---|---|---|---|---|---|---|
| All (n = 122) | Users (n = 77) | Non-Users (n = 45) | Cluster 1 (n = 47) | Cluster 2 (n = 36) | Cluster 3 (n = 11) | Cluster 4 (n = 22) | |
| BL1 | 5.1 ab | 5.3 ab | 4.7 bc | 5.7 a | 3.9 abc | 5.1 c | 5.2 bc |
| BL2 | 4.8 bc | 4.8 bc | 4.7 bc | 5.5 ab | 4.3 ab | 6.3 b | 3.0 d |
| CS1 | 5.4 a | 5.6 a | 4.9 ab | 5.2 bc | 4.4 a | 7.5 a | 6.1 ab |
| CS2 | 4.5 c | 4.7 c | 4.2 c | 4.8 c | 3.3 b | 7.1 ab | 4.5 c |
| PN | 5.2 a | 5.6 a | 4.5 bc | 5.3 abc | 3.6 bc | 7.0 ab | 6.7 a |
| SH | 5.4 a | 5.5 a | 5.3 a | 5.8 a | 4.2 ac | 6.8 ab | 5.6 b |
Publisher’s Note: MDPI stays neutral with regard to jurisdictional claims in published maps and institutional affiliations. |
© 2021 by the authors. Licensee MDPI, Basel, Switzerland. This article is an open access article distributed under the terms and conditions of the Creative Commons Attribution (CC BY) license (https://creativecommons.org/licenses/by/4.0/).
Share and Cite
Yang, J.; Lee, J. Consumer Perception of Red Wine by the Degree of Familiarity Using Consumer-Based Methodology. Foods 2021, 10, 749. https://doi.org/10.3390/foods10040749
Yang J, Lee J. Consumer Perception of Red Wine by the Degree of Familiarity Using Consumer-Based Methodology. Foods. 2021; 10(4):749. https://doi.org/10.3390/foods10040749
Chicago/Turabian StyleYang, Jiyun, and Jeehyun Lee. 2021. "Consumer Perception of Red Wine by the Degree of Familiarity Using Consumer-Based Methodology" Foods 10, no. 4: 749. https://doi.org/10.3390/foods10040749
APA StyleYang, J., & Lee, J. (2021). Consumer Perception of Red Wine by the Degree of Familiarity Using Consumer-Based Methodology. Foods, 10(4), 749. https://doi.org/10.3390/foods10040749