Article

Industrial Fruits By-Products and Their Antioxidant Profile: Can They Be Exploited for Industrial Food Applications?

by
Cássia H. Barbosa
1,†,
Mariana A. Andrade
1,2,†,
Raquel Séndon
3,
Ana Sanches Silva
4,5,*,
Fernando Ramos
2,*,
Fernanda Vilarinho
1,
Khaoula Khwaldia
6 and
Letricia Barbosa-Pereira
3
1
Department of Food and Nutrition, National Institute of Health Dr. Ricardo Jorge, Av. Padre Cruz, 1649-016 Lisbon, Portugal
2
Faculty of Pharmacy, University of Coimbra, REQUIMTE/LAQV, Coimbra, Azinhaga de Santa Comba, 3000-548 Coimbra, Portugal
3
Analytical Chemistry, Nutrition and Food Science Department, Pharmacy Faculty, University of Santiago de Compostela, 15782 Santiago de Compostela, Spain
4
National Institute for Agricultural and Veterinary Research (INIAV), I.P., Rua dos Lagidos, Lugar da Madalena, 4485-655 Vairão, Vila do Conde, Portugal
5
Center for Study in Animal Science (CECA), ICETA, University of Oporto, 4051-501 Oporto, Portugal
6
Laboratoire des Substances Naturelles, Institut National de Recherche et d’Analyse Physico-Chimique, INRAP, Pôle Technologique de Sidi Thabet, Sidi Thabet 2020, Tunisia
*
Authors to whom correspondence should be addressed.
These authors contributed equally to the work.
Foods 2021, 10(2), 272; https://doi.org/10.3390/foods10020272
Submission received: 31 December 2020 / Revised: 14 January 2021 / Accepted: 25 January 2021 / Published: 29 January 2021
(This article belongs to the Section Food Quality and Safety)

Abstract

:
Fruit by-products have a low economic value and have proven biological activities, such as antioxidant capacity due to the presence of active compounds. The main objective of this study was to obtain and determine the antioxidant capacity, through DPPH radical assay and β-carotene bleaching assay, of three food grade extracts from apple, lemon, and orange industrial by-products. Furthermore, the extracts were characterized by ultra-high performance liquid chromatography coupled to mass spectrometry (UHPLC-MS/MS). LC with diode array detector (LC-DAD) was used for the quantification of the main polyphenols. Lemon extract presented the highest inhibition percentage of DPPH radical (51.7%) and the highest total phenolics content (43.4 mg GAE/g) from the by-products studied. Orange by-product was that with the higher number of polyphenols while lemon extract was that with the highest content of individual phenolics. The by-product obtained from the lemon was that with higher amounts of hydroxycinnamic acids (407 µg/g of by-product), mainly chlorogenic acid (386.7 µg/g), followed by the apple by-product (128.0 µg/g of by-product), which showed higher amounts of rosmarinic and chlorogenic acids. These industrial by-products have great potential as a source of natural antioxidants to be used directly as food additives or to be incorporated in packaging to produce active food packaging.

1. Introduction

Fruits are often presented to consumers in several forms, such as jams, juices, concentrates, and pastes. The manufacturing processes of these formulations do not use the fruit entirely, originating a large quantity of fruit by-products that, in turn, have to be discarded in a responsible and sustainable way, which may imply a significant increase in the final price of the product [1,2]. Additionally, fruit by-products have a low economic value and have proven biological activities derived from the presence of phenolic compounds, vitamins, carotenoids, among other active compounds. Phenolic compounds, chemically characterized for having at least one phenol unit, are present in most terrestrial plants, and they are responsible for the plant’s defense against external stimuli such as radiation, predators and microorganisms [3,4]. The presence of these compounds is directly linked to the occurrence of antioxidant and antimicrobial activities, making these compounds of major interest for the food, cosmetic and pharmaceutical industries.
Apple is a well-known fruit of the genus Malus (family Rosaceae) [5] and one of the most-consumed fruits all over the world [6]. According to the Food and Agriculture Organization of the United Nations, the global production of apples was over 85 million tons in 2019 [7]. Although the majority is consumed as a fresh fruit, 25–30% are converted into processed products, with apple juice being the main product [8]. Apples represent an important source of bioactive compounds like pectins, dietary fibers, vitamins, oligosaccharides, triterpenic acids and phenolic compounds, such as flavonols, monomeric and oligomeric flavanols, dihydrochalcones, anthocyanidins, p-hydroxycinnamic and p-hydroxybenzoic acids [5,6]. Apples with a higher content in phenolic compounds tend to have a higher antioxidant capacity. The content in phenolic compounds varies with edaphoclimatic conditions (such as weather and water availability), cultivation practices, harvesting, storage conditions, and apple cultivars, the apple cultivar being the main factor in determining the content on bioactive compounds [6,9]. Furthermore, differences can also be found among the different parts of the apple, since the peel contains a higher content in phenolic compounds than the flesh [5]. Apple pomace, the mixture of peel, core, seed, calyx, stem and soft tissue resulting from apple juice production, is the main by-product generated, accounting for close to 25% of the fresh apple weight [8,10] and has approximately 20–30% of dried matter [11].
Lemons and oranges are other well-known fruits, belonging to the genus Citrus, with a production of more than 95 million tones worldwide, in 2019 [7]. Lemon is mostly consumed as juice, originating a large quantity of lemon by-products, which are a very good source of dietary fiber, pectin, flavonoids, limonoids, coumarins and carotenoids [12]. Lemon essential oil can be obtained from lemon peels, which has proven antimicrobial activity against Escherichia coli, Staphylococcus aureus and Pseudomonas aeruginosa [13,14]. Oranges are also largely consumed in juice form, leaving a large trail of by-products. The orange peel, similar to lemon peel, is a good source of dietary fiber, pectin, phenolic acids and flavonoids, including polymethoxylated flavones and flavonols [15,16]. Dietary fiber is an important resource used in the prevention of cardiovascular diseases, diabetes, cancer and gastrointestinal disorders [17].
To delay the natural degradation of foods, the food industry resorts to antioxidant and antimicrobial additives, normally from a synthetic origin. The indirect and unaware consumption of these compounds has been associated with the promotion of carcinogenesis and their effects on human health due to long exposure are still unknown [2,18,19,20]. Therefore, it is important to find alternatives to these additives not associated with adverse health effects, such as extracts, and essential oils obtained from fruit by-products. Fruits are a good source of antioxidants, with important health benefits. Their by-products (peel, stems, and seeds) are also an excellent source of antioxidants [2,21]. However, there are not many studies on industrial fruit by-products. The majority of the studies are with specific parts of the by-products, such as peel, stems or seeds. Furthermore, there is not a method that can measure the antioxidant capacity precisely, therefore, different assays should be performed to obtain a more accurate result [22,23].
The main objective of this study was to obtain and determine three food-grade extracts from apple, lemon, and orange by-products and determine their antioxidant capacity. Moreover, the three extracts were chemically characterized, and their main compounds were quantified by UHPLC-ESI-MS/MS.

2. Materials and Methods

2.1. Fruits By-Product Extraction

The by-products of lemon, orange and apple were kindly supplied by the Portuguese juice company, Frubaça—Cooperativa de Hortofruticultores. Absolute ethanol was the chosen solvent for the production of the extracts since the main goal of the extract is to be applied directly or indirectly (through an active packaging) in foods. Ethanol is authorized by the Directive 2009/32/EC [24] in the extractions of bioactive compounds to be applied in foods. The samples were first grinded and freeze-dried, followed by the extraction process. Briefly, 5 g of sample 50 mL of absolute ethanol was added, the mixture was agitated on a compact shaker (Edmund Bühler GmbH model KS-15, Hechingen, Germany) at 450 rpm for 30 min at room temperature (23 ± 1 °C), protected from the light. Then, the mixture was centrifuged (Heraeus Multifuge X3 FR, Thermo Scientific, Langenbold, Germany) at 6000 rpm at 10 °C for 10 min. After that, the supernatant was removed to an amber pear-shaped flask and the ethanol was completely evaporated on a rotary evaporator (Büchi model R-210 Labortechnik, Switzerland) at 35 °C. The extract was removed with an aid of a spatula, held at −20 °C, protected from the light, until further use. To evaluate the antioxidant capacities of the different extracts, free radical DPPH inhibition and β-carotene bleaching assays were performed. In addition, the Total Phenolic Compounds (TPC) and the Total Flavonoid Content (TFC) were determined. To perform the antioxidant activity assays, the extracts obtained were dissolved in absolute ethanol, at a concentration of 3 mg/mL.

2.2. Antioxidant Activity

2.2.1. Free Radical DPPH Inhibition Assay

For the free radical DPPH inhibition assay, the method described by Moure et al. (2001) [25] and modified by Andrade et al. (2018) [4], was applied. Briefly, 2 mL of a DPPH methanolic solution (14.2 μg/mL) were added to 50 μL of the sample. The mixture was homogenized and kept in the dark for 30 min, at room temperature (23 ± 1 °C). Absorbance was then measured at 515 nm using a spectrophotometer Evolution 300 UV-Vis (ThermoScientific™, England). A control assay was performed with the solvent in which the sample was dissolved. The inhibition percentage (IP) of DPPH was calculated according to the following Equation (1):
IP % = Ac As Ac × 100
where Ac is the absorbance of the control and As is the absorbance of the sample.
Furthermore, a calibration curve using Trolox (6-hydroxy-2,5,7,8-tetramethylchroman-2-carboxylic acid) as a standard was drawn with a working range of 10–175 μg/mL.

2.2.2. β-Carotene Bleaching Assay

The β-carotene bleaching assay was performed according to the described by Miller (1971) [26] and modified by Andrade et al. (2018) [4] Firstly, a solution with 20 mg of linoleic acid, 200 mg of Tween®40 and 1 mL of β-carotene in chloroform (0.2 mg/mL) was prepared. The chloroform was evaporated on a rotary evaporator at 40 °C. Then, 50 mL of MilliQ™ water was added, and vigorously agitated, until an emulsion was formed. Finally, to 200 µL of the sample, 5 mL of the emulsion was added. Afterwards, the absorbance of the control was measured at 470 nm and the mixtures were subjected to 50 °C for 120 min. The antioxidant activity coefficient (AAC) was calculated according to the Equation (2):
AAC = A s 120 A c 120 A c 0 A c 120 × 1000
where, As120 is the absorbance of the sample after 120 min, Ac120 is the absorbance of the control after 120 min and Ac0 is the absorbance of the control at 0 min.

2.3. Total Phenolic Compounds Content (TPC)

The determination of the Total Phenolic Compounds Content was carried out according to the Erkan et al. (2008) [27] method. According to the method, 7.5 mL of an aqueous solution of Folin-Cioucalteu (10%, v/v) was added to 1 mL of sample. After 5 min, 7.5 mL of an aqueous solution of sodium carbonate (60 mg/mL, w/v) was added. Then, the samples were kept in the dark for 120 min, and the absorbance was measured at 725 nm. Gallic acid was used as a standard for the calibration curve, with a working range between 5–150 µg/mL.

2.4. Total Flavonoid Compounds (TFC)

The Total Flavonoid Content method was performed according to the Yoo et al. (2008) [28] method. To 1 mL of sample, 4 mL of MilliQ water and 0.3 mL of aqueous solution of sodium nitrite (5%, w/v) were added, and the solution was homogenized. After 5 min, 0.6 mL of aqueous solution of aluminum chloride (10%, w/v) were added and the solution was once again homogenized. After 6 min, 2 mL of sodium hydroxide (1 M, w/v) and 2.1 mL of MilliQ™ water were added. The solution was homogenized and the absorbance was measured at 510 nm. Epicatequin was used as a standard for the calibration curve with a working range between 5–125 µg/mL.

2.5. Identification of the Polyphenolic Compounds by UHPLC-ESI-MS/MS

The identification/tentative identification of phenolic compounds in the fruit by-products extracts was performed with a UHPLC-ESI-MS/MS (Thermo Fisher Scientific, San José, CA, USA), equipped with a degasser, Accela quaternary pump, autosampler, and column oven, coupled to a triple quadrupole mass spectrometer TSQ Quantum Access max. The instrument control and data collection and processing were performed with Xcalibur 2.1 software (Thermo Fisher Scientific, San José, CA, USA).
A reverse-phase Kinetex® EVO C18 100Å column (150 × 3 mm internal diameter, 5 μm particle size) (Phenomenex, Torrance, CA, USA) was used for phenolic compound separation at 30 °C, according to Andrade et al. [21] The injection volume was 20 μL, and the mobile phase flow rate used was 0.6 mL/min. The solvents used as mobile phase were water (solvent A) and methanol (solvent B), both acidified with formic acid at 0.1% (v/v). The gradient elution used was as follows: 95% A; 3 min, 90% A; 10 min, 80% A; 18 min, 70% A; 25 min, 30% A; 33 min, 0% A; 33–40 min, 0% A and 100% B isocratic; and finally, the column was washed and reconditioned with 95% A (40–46 min).
The mass spectrometer electrospray ionization source (ESI) operated in both negative and positive mode, according to the nature of the phenolic compound. The optimized MS/MS detector settings were as follows: spray voltage 2500 V; vaporizer and capillary temperatures were set at 340 °C and 350 °C, respectively. Nitrogen (purity > 99.98%) was used as sheath gas (pressure 35 psi) and as auxiliary gas (the pressure set 10 arbitrary units), and Argon as the collision gas (1.5 mTorr).
The MS/MS data acquisition was performed in a Single Reaction Monitoring (SRM) mode. After the first screening at MS scan range of 100–800 m/z, tentative identification of polyphenols was accomplished by comparing their precursor ion [M-H]−1 and mass spectrometry fragmentation pattern (MS/MS) with those already described in the literature. The identification of the individual phenolic compounds was accomplished by comparison of the retention time with those obtained by injecting pure standards, when available, under the same chromatographic conditions, and with the molecular ion and product-ions data provided by MS/MS analysis.

2.6. Quantification of the Polyphenolic Compounds by HPLC-DAD/UV

The quantification of phenolic compounds was performed with an Agilent HPLC system 1100 (Hewlett-Packard, Waldbronn, Germany), equipped with a quaternary pump, a degassing device, an autosampler, a column thermostat system, coupled to a diode array detector (DAD), and controlled by HP ChemStation software (version B.03.0.1). The column and chromatographic conditions used were the same described above for UHPLC-ESI-MS/MS analysis. DAD spectra acquisition was performed continuously in full scan modality during the run time ranging from 200 to 400 nm. The identification of individual phenolic compounds was achieved by comparing their retention times and the UV spectrum (λmax) characteristics of the different family of phenolic compounds or with that obtained with commercial standards injected under the same chromatographic conditions, whenever available. Phenolic compounds were monitored and quantified at 230, 278, 300, 325, and 360 nm. Quantification was carried out by the external-standard method with six-point calibration curves.

2.7. Statistical Analysis

All experiments were conducted using a completely randomized design with three replications. Statistical analysis of data was performed through a one-way analysis of variance (ANOVA) using the Software IBM® SPSS® Statistics, version 26.0.0.0, and differences among mean values were processed by the Tukey test. All requirements necessary to carry out the ANOVA (namely, normality of data and homogeneity of variances) have been validated. Significance was defined at p < 0.05. Results are expressed as the means of the replicants ± standard deviation.

3. Results and Discussion

3.1. Antioxidant Capacity

In this study, four assays were performed for a better characterization of the antioxidant. For antioxidant potential, DPPH radical scavenging capacity and β-carotene bleaching assay were performed. Besides that, TPC and TFC were quantified for antioxidant potential assessment. For all the assays, the extracts were analyzed in the concentration of 3 mg of extract per mL of ethanol.
Table 1 shows the IP of DPPH and the Trolox Equivalent (TE) for all the extracts. Lemon extract presented the highest IP of DPPH radical (51.67 ± 4.61%) followed by the apple extract (39.92 ± 1.68%) and orange extract (31.20 ± 1.28%). The DPPH radical scavenging capacity assay measures the reducing capacity of antioxidants.
Different results were obtained in other studies. Albuquerque et al. [29] evaluated a water extract obtained from industrial oranges by-products. The authors found lower values (898.9 µmol Trolox/L fruit by-products water extracts) when compared to the ethanolic extract of the orange by-products. This can be explained by the use of different extraction solvents in the two studies. Guimarães et al. [30] evaluated the antioxidant capacity of orange and lemon peel essential oils. The authors obtained good EC50 values for orange (95.67 ± 2.21 mg/mL) and lemon (116.25 ± 10.56 mg/mL). M'hiri et al. [12] studied the effects of different drying processes on the antioxidant activity of industrial lemon by-products. The authors concluded that all the drying processes decreased the total content of phenolic compounds, and antioxidant radical scavenging activity, supporting the room temperature extraction procedure of active compounds, such as the method used in the present study [12].
Regarding the β-carotene bleaching assay, orange extract (3 mg/mL) presented the highest AAC (237.21 ± 29.78) (Table 2). The β-carotene bleaching assay is also based on color change. In the absence of antioxidants, the free linoleic acid radical bonds to the β-carotene molecule and the orange color fade.
The lemon by-products extract presented the highest TPC (43.38 mg GAE/g ± 0.84 mg GAE/g) from the studied extracts. The TPC of orange and apple were 23.32 ± 0.18 mg GAE/g and 14.02 mg ± 0.13 mg GAE/g, respectively (Table 2). Phenolic compounds are recognized for their contribution as one of the most important antioxidants in the diet [29,31]. Therefore, it is essential to quantify the TPC presented in the food and its by-products. Guimarães et al. [30] analyzed lemon and orange peel and obtained a higher value of TPC, 87.77 mg/g extract and 79.75 mg/g, respectively. Li et al. [32] analyzed lemon and orange peel too, and the results presented as fresh matter were 118.75 mg/g and 73.59 mg/g, respectively. M’hiri et al. [12] analyzed lemon by-products and for TPC the results were 5.52 g/100 g as dry matter. On the other hand, the TPC obtained for apple by-products in this study were higher than the ones of Diñeiro García et al. [33]. Raudone et al. [6] quantified the TPC in apple by-products and the result was 31.01 mg/g as dry weight. It is also important to identify the individual phenolic compounds present in the fruits’ by-products.
The TFC of lemon, orange, and apple were 20.76 mg ± 0.61 mg ECE/g, 7.29 mg ± 0.32 mg ECE/g, and 24.63 mg ± 1.61 mg ECE/g (Table 2). Apple extract showed the highest TFC and orange extract showed the lowest TFC. Flavonoids are important phytonutrients too. The results obtained in this study for lemon by-products were higher than those from Guimarães et al. [30] M’hiri et al. [12] obtained 4.35 g/100 g as dry matter for TFC. For orange by-products, there were studies with higher and lower values than those obtained in this study [16,30]. No studies with TFC for apple by-products were found in the literature.
Dissimilarities in all results can be due to different fruits’ variability and their degrees of maturation. External factors such as climate, soil and fertilization applied can also affect the results. Apart from these, the results can be affected by the variability in the solvents used for the extractions and changes in the methods used [34,35,36,37].
In general, all three fruit by-products presented a good source of antioxidant compounds, able to be incorporated as dry extracts in food and in food packaging. However, from the studied industrial by-products, lemon extract was revealed to have the greatest potential as an antioxidant extract.

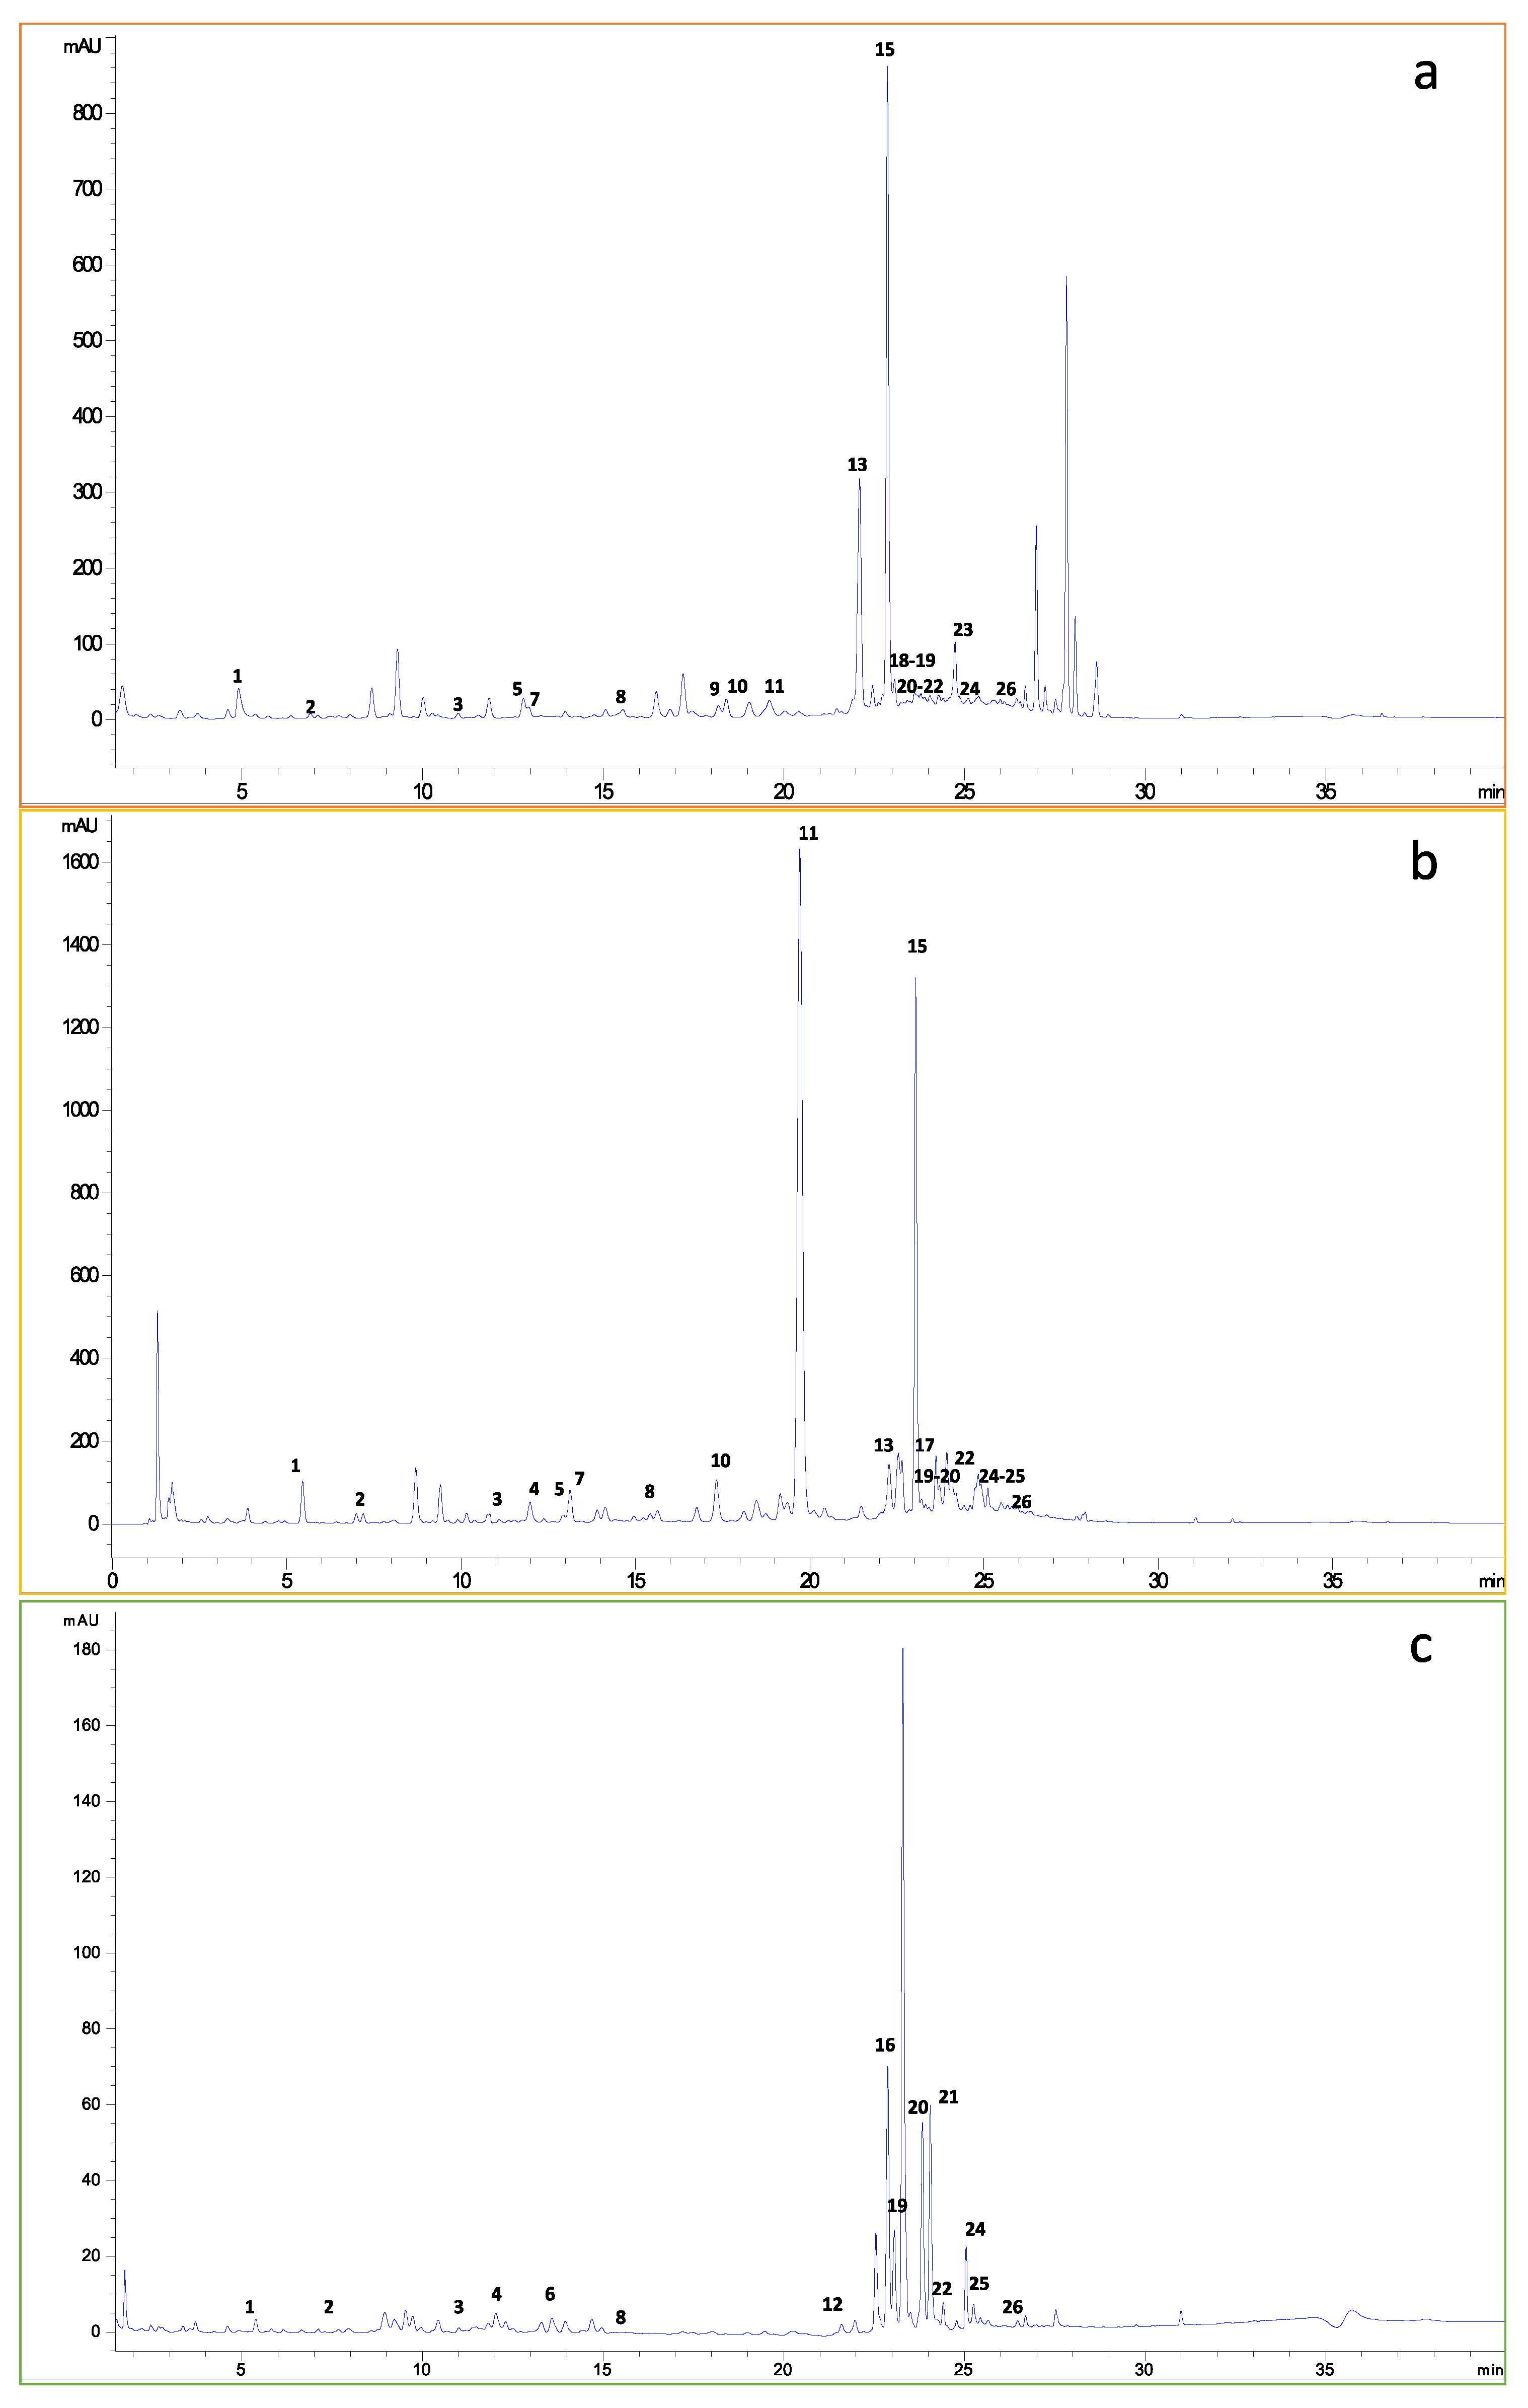
3.2. Chromatographic Polyphenolic Profile of the Fruit By-Products

The phenolic compounds of fruit by-products identified or tentatively identified by HPLD-DAD and UHPLC-ESI-MS/MS are described in Table 3. The identification of phenolic compounds was based on the elemental composition data determined from accurate mass measurements in negative ionization mode and comparison with the literature and that obtained with the available standards, except for compound 25 (Quercetin), which was measured in the positive mode as described previously by Andrade et al. [21] Each compound was characterized by its retention time (Rt), maximum absorption wavelengths (λmax), structural class, molecular formula, molecular ion, and main MS/MS fragments. The peak names of the Table 3 correspond to the peak labels of the chromatograms obtained at 278 nm by HPLC–DAD for each fruit by-product represented in Figure 1. In this work, a total of 26 compounds (19 for orange, 18 for lemon, and 16 for apple by-products) from different classes of polyphenols were identified, including phenolic acids (benzoic acid derivates, hydroxycinnamic acids derivatives, and their glycosides) and flavonoids (flavonols, flavones, flavanones, and dihydrochalcones, as well as their glycosides). The confirmation of the identity of 17 polyphenols was achieved by a comparative analysis of authentic standards based on compounds retention time, the UV–visible spectra, and MS/MS fragmentation patterns.

3.2.1. Benzoic Acid Derivates

The benzoic acid derivates identified in the fruit by-products analyzed were protocatechuic acid (compound 1) and hydroxybenzoic acid (compound 2) detected at UV λmax 293 and 255 nm, respectively. The identification was performed by a comparison of their retention times and MS/MS fragmentation patterns with standards. The hydroxybenzoic acids are widely distributed in nature and have been identified by other authors in citrus and apple fruits and products [38,39,40]. On the other hand, protocatechuic acid has been described in apple fruits and less in citrus. Indeed, this study identifies for the first time protocatechuic acid in orange by-products.

3.2.2. Hydroxycinnamic Acids and Their Glycosides

Several compounds from the group of hydroxycinnamic acids were identified in the fruit by-products by comparison of their retention times, UV–visible typical spectra at λmax 325 nm, and MS/MS fragmentation patterns with standards. Caffeic and p-coumaric acids (compounds 3 and 8, respectively) were identified in all fruit by-products analyzed. Chlorogenic acid (compound 4) was found in lemon and apple by-products, while ferulic acid was determined just in orange by-products. Rosmarinic acid was found for the first time in orange by-products besides apple by-products [39]. Compound 5, with [M-H] ion at m/z 355 and the MS/MS fragment 193 m/z from ferulic acid, was tentatively identified as ferulic acid-O-hexoside. Additionally, compound 7, with [M-H] ion at m/z 385 and the MS/MS fragment 223 m/z from sinapic acid, was identified as sinapic acid-O-hexoside. These hydroxycinnamic acid glycosides were already described for orange pulp and juices by De Ancos et al. (2017) [41] Both compounds were considered for the first time for orange and lemon by-products in this work.

3.2.3. Flavanones Glycosides

Together with hydroxycinnamic acids, flavanone glycosides were the main group of phenolic compounds present in the by-products analyzed in this study, mainly in those obtained from citrus fruits.
Compound 24, with [M-H] ion at m/z 271, MS/MS fragment 151 m/z, and the UV–visible spectra typical at λmax 290 nm, was identified as Naringenin in all by-products analyzed (orange, lemon, and apple). Besides, compound 11, with [M-H] ion at m/z 595 that displayed the same fragmentation pattern in negative ionization mode that results in the fragment 151 m/z, was identified as eriodyctiol-O-rutinoside (eriocitrin). For this compound, the UV–visible spectrum showed two λmax at 290 and 330 nm, which are characteristic of flavanone glycosides and are usual to the following compounds identified in this group of phenolics. Naringenin-7-O-rutinoside (narirutin) (compound 13), with [M-H] ion at m/z 579, and naringenin-7-O-glucoside (prunin) (compound 20), with [M-H] ion at m/z 433, showed the same fragmentation pattern that results in the fragment 271 m/z of naringenin [40].
The MS/MS fragmentation of hesperidin (compound 15) and neohesperidin (compound 18), with the identical [M-H] ion at m/z 609, results in the same fragment 286 m/z and the UV–visible spectra λmax at 290 and 355. On the other hand, compound 23 was tentatively identified as isosakuranetin-7-O-rutinoside (dydimin), with [M-H] ion at m/z 593, and MS/MS fragment 285 m/z, as described by De Ancos et al. 2017 [41] for orange.
The identity of compounds 11, 15, and 24 (eriocitrin, hesperidin, and naringenin, respectively) was confirmed by comparison with the retention time and fragmentation pattern of commercial standards. Naringenin and prunin were identified in all by-products analyzed, while neohesperidin and dydimin were found just in orange by-products. Eriocitrin, narirutin, and hesperidin were identified in citrus by-products (orange and lemon).
The identification of phenolics, for which standards were not available, was supported by recent studies found in the literature on these groups of compounds described for citrus peels (orange and lemon) [41,42,43], besides some studies for apple products including peels [38,40,44].

3.2.4. Flavonols and Flavonol Glycosides

The MS1 scan spectra, the UV–visible spectra typical at λmax 270 nm and 360 nm, and the same fragmentation pattern in negative ionization mode that results in the fragment 301 m/z in negative ionization mode compared with those of authentic standards determined that compounds 17, 19, and 22 are flavonols glycosides. Quercetin-3-O-rutinoside (rutin) (compound 19) and quercitrin (compound 22) standards allowed the identification of these flavonols in all by-products analyzed (orange, lemon, and apple). These phenolics have been described in other studies for orange, lemon, and apple products/by-products [40]. Despite isoquercetin (compound 17) being described in apple fruit by Sommella et al. (2015) [44], in this study, it was just found in orange by-product and confirmed by the standard of reference. The identification of the aglycone quercetin (compound 25) in all fruit by-products was achieved by comparing the data with that obtained from the authentic standard. On the other hand, compound 14, with a [M-H] ion at m/z 593, was tentatively identified as kaempferol-3-O-rutinoside in orange and apple by-products based on the MS/MS fragment 285 m/z, the UV–visible spectra typical at λmax 356 nm and supported by literature where this flavonol glycoside was described before for apple fruit [40].

3.2.5. Others (Flavones and Glycosides, Dihydrochalcone Glycosides and Flavan-3-ols)

Compound 10 showed UV–visible spectra typical of flavones, and the MS1 spectra revealed a high intensity [M-H] ion at m/z 593. Moreover, the comparison of the relative absorbance at 270 and 340 nm allowed the identification flavone nature of the phenolic compound. Additionally, the fragment ion at m/z 473 described in the literature for di-C-glucoside flavanone confirmed the identification of this compound as apigenin-6,8-di-C-glucoside, more commonly identified as Vicenin-2. Apigenin-6,8-di-C-glucoside was previously identified in pulp and juices of orange and mandarins by De Ancos et al. (2017) [41], but was described for the first time in this study for orange and lemon by-products. Compound 26, with [M-H] ion at m/z 269, was identified as another flavone, the aglycone apigenin, that followed the same fragmentation pattern of the reference standard that results in the fragment 117 m/z in negative mode. This compound was described before for orange products such as pulp, juice, and peels [40,41]. Still, in this study, apigenin was detected for the by-products obtained from lemon and apple fruits. Phenolic compounds 12 and 16, with [M-H] ion at m/z 567 and [M-H] ion at m/z 435, respectively, followed the same fragmentation pattern that results in the fragment 273 m/z, were tentatively identified as dihydrochalcone glycosides. Compound 12 was, tentatively, identified as phloretin-O-apiofuranosyl-glucopyranoside, and compound 16 was identified as phloretin-2′-O-beta-glucoside (phlorizin) by comparison with the reference standard. These compounds have been described in the literature for apple pomace and were detected in the apple by-product analyzed in this study [40,45].
Finally, also exclusive for apple by-product, phenolic compound 6 with the [M-H] ion at m/z 289, the fragment ions at m/z 245 and 203, and the UV–visible spectra typical of flavan-3-ols at λmax 278 nm, was identified as epicatechin and its identity confirmed with the commercial standard. Epicatechin was also already described in the literature for apple products [40,44].

3.3. Quantitative Distribution of Polyphenolic Compounds in Fruit By-Products

The quantification of phenolic compounds, for which the standards were available, was performed by HPLC-DAD following the parameters described in Table 4. The results on total and 15 individual phenolic compound contents are shown in Table 5. The total amount of phenolic compounds varied according to the nature of the by-product as follows: lemon (20,969 µg/g) < orange (5393 µg/g) < apple (894.8 µg/g). The results were in agreement with those obtained in the spectrophotometric assays of total phenolic compounds, even though several compounds present in the extracts were not identified and quantified (see Figure 1). The polyphenol content determined for lemon by-products using TPC assay was 2-fold higher than orange. However, according to the determination by HPLC-DAD, the lemon content was 4-fold higher than orange, since a substantial number of polyphenols in the orange extract were not able to be quantified.
Benzoic acid derivates and flavanones glycosides were the most representative phenolics in the orange by-product, while for the lemon by-product, the most abundant were hydroxycinnamic acids, flavanone glycosides, and flavonol glycosides. The hydroxycinnamic acids and flavonol glycosides were the most relevant groups of compounds present in apple by-products, together with the flavanols glycosides and dihydrochalcone glycosides, which were exclusively present for this by-product.
The by-product obtained from lemon fruits was that with higher amounts of hydroxycinnamic acids (407 µg/g of by-product), manly chlorogenic acid (386.7 µg/g), followed by the apple by-product (128.0 µg/g), which showed higher amounts of rosmarinic acid (88.62 µg/g), besides chlorogenic acid (39.41 µg/g). These amounts in apple by-products could justify the highest antioxidant capacity of apple extract rather than the orange extract described in Section 3.1 for the DPPH assay. Similar contents of chlorogenic acid were determined in lemon peels by Xi et al. (2017) [46] in different lemon varieties, but not in other parts of the lemon fruit such as the pulp or juice that were more than 10-fold lower. On the other hand, the orange by-product was that with higher amounts of caffeic, ferulic, and p-coumaric acids, but the total amount (80.53 µg/g) was the lowest among the fruit by-products analyzed. These results were in agreement with those observed in the recent study on apple and orange peels, where the total amounts of phenolic acids, and in particular chlorogenic acid, were higher for the apple rather than orange peels [38]. Still, a high amount of protocatechuic acid (317.3 µg/g) was determined, in this study, for the orange by-product. These authors observed the same tendency for benzoic acid derivates such as hydroxybenzoic acid. However, the concentrations on orange and apple peels determined by these authors were higher than those observed in the by-products analyzed in this work.
Taking into account the flavanone glycosides as the most relevant group of compounds for citrus by-products, eriocitrin, hesperidin, and naringenin were those quantified. The compound present in high quantities in the orange by-product was the hesperidin (4901 µg/g), followed by naringenin, and finally Eriocitrin, in a total amount of 4956 µg/g. The content of hesperidin was up to 3-fold higher than those described by Molina-Calle et al. (2015) [42] for orange peels from different varieties in the range of 1200 and 1800 µg/g. De Ancos et al. (2017) [41] also determine these compounds for orange pulps and juices from different varieties (49–434 µg/g). Nevertheless, the results could not be compared with the literature since the authors express the results as fresh weight. However, the amounts of hesperidin were also significantly higher than eriocitrin for pulps and juices. On the other hand, the most abundant compound in lemon by-products was the eriocitrin (17,493 µg/g), followed by hesperidin (2728 µg/g), and finally naringenin (42.12 µg/g), in a total amount of flavanone glycosides of 20,263 µg/g. The amount of hesperidin was lower than that observed for the orange by-product. The amounts were lower than those described by Gómez-Mejía et al. (2019) [43], but these authors also observed that hesperidin was 2-fold higher in orange peels than in lemon peels.
Considering the flavonols glycosides, considerable amounts were determined for lemon by-product (262.3 µg/g), followed by apple (172.7 µg/g), and finally orange (39.40 µg/g). Isoquecetin and quercitrin were the most abundant in lemon with concentrations of 111.6 µg/g and 106.0 µg/g, respectively. The main compound in apple by-product was the quercitrin (150.3 µg/g), while in orange was the rutin (31.43 µg/g). Similar results for the rutin ratio among citrus samples (lemon and orange) have been described in the literature. However, the amounts depended on the variety or part of the fruit analyzed [43,46]. The amounts of quercitrin in apple by-product (150.3 µg/g) were more than 12-fold higher than those determined by Li et al. (2019) [45] in 7 varieties of apple flesh (2.7–12.4 µg/g). These authors also determined the epicatechin content for all varieties, and the values ranged from 5.8 to 80.7 µg/g. The amount of epicatechin in the apple by-product analyzed in this study was in the range with a concentration of 31.24 µg/g. This concentration of epicatechin could be related to the high values of TFC described for apple by-products in Section 3.1 and might display a higher response to this assay. These results highlighted that the chromatographic analysis should be considered to complement and achieve a correct characterization of extracts µg/g and therefore avoid the potential lack of specificity of spectrophotometric assays.
Finally, phlorizin was the main phenolic compound quantified in apple by-product (542.0 µg/g), significantly higher than those observed in the apple fruit (11.4–40.9 µg/g). These compounds also may be related to the high antioxidant capacity of the apple by-product on the DPPH assay.
Since the phenolic composition of the fruits and their products may change with the variety and these by-products obtained from the food industry may result from a mix of varieties, predicting the content of polyphenols and their antioxidant potential could be a complex task. Therefore, a complete characterization of the by-products by chromatography is mandatory before their application as a food ingredient or additive.

4. Conclusions

The phenolic profile and the content of polyphenols of orange, lemon, and apple fruit by-products were determined by UHPLC-ESI–MS/MS and HPLC-DAD. This methodology may be employed for the routine screening of fruit by-products and the identification and quantification of polyphenols. The phenolic compounds responsible for the high antioxidant activity of citrus by-products, in particular for lemon, were hydroxycinnamic acids, flavonols glycosides, and flavanone glycosides. Eriocitrin was the main phenolic compound (17.49 mg/g) determined in lemon by-products, while for orange by-products it was hesperidin (4.9 mg/g). On the other hand, the antioxidant capacity of the apple byproduct could be due to the high content in hydroxycinnamic acids (e.g., rosmarinic acid) and other specific compounds such as epicatechin and phlorizin.
The results encourage the valorization of the fruit by-products as powerful sources of natural antioxidants to be used as food additives or ingredients to increase the shelf life of foods and develop functional foods and active packaging, with potential health benefits creating new food market perspectives within the concept of a circular economy.

Author Contributions

Conceptualization, M.A.A. and A.S.S.; Data curation, M.A.A. and L.B.-P.; Formal analysis, C.H.B. and L.B.-P.; Funding acquisition, A.S.S., F.R. and K.K.; Investigation, C.H.B., M.A.A., R.S., F.V. and L.B.-P.; Methodology, M.A.A., F.V. and L.B.-P.; Project administration, R.S. and A.S.S.; Resources, A.S.S.; Software, F.V.; Supervision, R.S., A.S.S., F.R. and K.K.; Validation, M.A.A., R.S., K.K. and L.B.-P.; Writing—original draft, C.H.B., M.A.A., F.V. and L.B.-P.; Writing—review & editing, R.S., A.S.S., F.R. and K.K. All authors have read and agreed to the published version of the manuscript.

Funding

This work was carried out in the frame of the VIPACFood project (grant agreement no. 618127). This project is funded by ARIMNet2 (Coordination of Agricultural Research in the Mediterranean; 2014–2017), an ERA-NET Action financed by the European Union under the Seventh Framework Programme. In Spain this action is co-funded by the Spanish National Institute for Agricultural and Food Research and Technology (MINECO-INIA) ref. APCIN2016-00061-00-00. Cássia H. Barbosa is grateful for her research grant in the frame of the VIPACFood project (ARIMNET2/0003/2016). Mariana Andrade and Fernando Ramos would like to thank the INTERREG V A Spain-Portugal Programme (POCTEP) through the project 0377_IBERPHENOL_6_E regarding the phenolic compounds part. L. Barbosa-Pereira is grateful to the Spanish Ministry of Science, Innovation and Universities for her “Juan de la Cierva—Incorporación” Grant (Agreement No. IJCI-2017-31665). The work was supported by UIDB/00211/2020 and by UIDB/50006/2020 with funding from FCT/MCTES.

Data Availability Statement

No new data were created or analyzed in this study. Data sharing is not applicable to this article.

Conflicts of Interest

The authors declare no conflict of interest.

References

  1. Ayala-Zavala, J.F.; Vega-Vega, V.; Rosas-Domínguez, C.; Palafox-Carlos, H.; Villa-Rodriguez, J.A.; Siddiqui, M.W.; Dávila-Aviña, J.E.; González-Aguilar, G.A. Agro-industrial potential of exotic fruit byproducts as a source of food additives. Food Res. Int. 2011, 44, 1866–1874. [Google Scholar] [CrossRef]
  2. Andrade, M.A.; Lima, V.; Sanches Silva, A.; Vilarinho, F.; Castilho, M.C.; Khwaldia, K.; Ramos, F. Pomegranate and grape by-products and their active compounds: Are they a valuable source for food applications? Trends Food Sci. Technol. 2019, 86, 68–84. [Google Scholar] [CrossRef]
  3. de la Rosa, L.A.; Moreno-Escamilla, J.O.; Rodrigo-García, J.; Alvarez-Parrilla, E. Phenolic Compounds. In Postharvest Physiology and Biochemistry of Fruits and Vegetables; Elsevier: Amsterdam, The Netherlands, 2019; pp. 253–271. [Google Scholar]
  4. Andrade, M.A.; Ribeiro-Santos, R.; Costa Bonito, M.C.; Saraiva, M.; Sanches-Silva, A. Characterization of rosemary and thyme extracts for incorporation into a whey protein based film. LWT Food Sci. Technol. 2018, 92, 497–508. [Google Scholar] [CrossRef]
  5. Ćetković, G.; Čanadanović-Brunet, J.; Djilas, S.; Savatović, S.; Mandić, A.; Tumbas, V. Assessment of polyphenolic content and in vitro antiradical characteristics of apple pomace. Food Chem. 2008, 109, 340–347. [Google Scholar] [CrossRef]
  6. Raudone, L.; Raudonis, R.; Liaudanskas, M.; Janulis, V.; Viskelis, P. Phenolic antioxidant profiles in the whole fruit, flesh and peel of apple cultivars grown in Lithuania. Sci. Hortic. 2017, 216, 186–192. [Google Scholar] [CrossRef]
  7. Food and Agriculture Organization of the United Nations (FAO) FAOSTAT. Available online: http://www.fao.org/faostat/en/#data/QC (accessed on 30 December 2020).
  8. Cruz, M.G.; Bastos, R.; Pinto, M.; Ferreira, J.M.; Santos, J.F.; Wessel, D.F.; Coelho, E.; Coimbra, M.A. Waste mitigation: From an effluent of apple juice concentrate industry to a valuable ingredient for food and feed applications. J. Clean. Prod. 2018, 193, 652–660. [Google Scholar]
  9. Kalinowska, M.; Bielawska, A.; Lewandowska-Siwkiewicz, H.; Priebe, W.; Lewandowski, W. Apples: Content of phenolic compounds vs. variety, part of apple and cultivation model, extraction of phenolic compounds, biological properties. Plant Physiol. Biochem. 2014, 84, 169–188. [Google Scholar] [CrossRef]
  10. Grigoras, C.G.; Destandau, E.; Fougère, L.; Elfakir, C. Evaluation of apple pomace extracts as a source of bioactive compounds. Ind. Crops Prod. 2013, 49, 794–804. [Google Scholar] [CrossRef]
  11. Yates, M.; Gomez, M.R.; Martin-Luengo, M.A.; Ibañez, V.Z.; Martinez Serrano, A.M. Multivalorization of apple pomace towards materials and chemicals. Waste to wealth. J. Clean. Prod. 2017, 143, 847–853. [Google Scholar] [CrossRef] [Green Version]
  12. M’hiri, N.; Ghali, R.; Ben Nasr, I.; Boudhrioua, N. Effect of different drying processes on functional properties of industrial lemon byproduct. Process Saf. Environ. Prot. 2018, 116, 450–460. [Google Scholar] [CrossRef]
  13. Yazgan, H.; Ozogul, Y.; Kuley, E. Antimicrobial influence of nanoemulsified lemon essential oil and pure lemon essential oil on food-borne pathogens and fish spoilage bacteria. Int. J. Food Microbiol. 2019, 306, 108266. [Google Scholar] [CrossRef]
  14. AL-Jabri, N.N.; Hossain, M.A. Chemical composition and antimicrobial potency of locally grown lemon essential oil against selected bacterial strains. J. King Saud Univ. Sci. 2018, 30, 14–20. [Google Scholar] [CrossRef] [Green Version]
  15. Larrauri, J.A.; Rupérez, P.; Bravo, L.; Saura-Calixto, F. High dietary fibre powders from orange and lime peels: Associated polyphenols and antioxidant capacity. Food Res. Int. 1996, 29, 757–762. [Google Scholar] [CrossRef]
  16. Chen, X.M.; Tait, A.R.; Kitts, D.D. Flavonoid composition of orange peel and its association with antioxidant and anti-inflammatory activities. Food Chem. 2017, 218, 15–21. [Google Scholar] [CrossRef]
  17. de Moraes Crizel, T.; Jablonski, A.; de Oliveira Rios, A.; Rech, R.; Flôres, S.H. Dietary fiber from orange byproducts as a potential fat replacer. LWT-Food Sci. Technol. 2013, 53, 9–14. [Google Scholar] [CrossRef]
  18. Pereira de Abreu, D.A.; Losada, P.P.; Maroto, J.; Cruz, J.M. Evaluation of the effectiveness of a new active packaging film containing natural antioxidants (from barley husks) that retard lipid damage in frozen Atlantic salmon (Salmo salar L.). Food Res. Int. 2010, 43, 1277–1282. [Google Scholar] [CrossRef]
  19. Carocho, M.; Morales, P.; Ferreira, I.C.F.R. Natural food additives: Quo vadis? Trends Food Sci. Technol. 2015, 45, 284–295. [Google Scholar] [CrossRef]
  20. Sanches-Silva, A.; Costa, D.; Albuquerque, T.G.; Buonocore, G.G.; Ramos, F.; Castilho, M.C.; Machado, A.V.; Costa, H.S. Trends in the use of natural antioxidants in active food packaging: A review. Food Addit. Contam. Part A 2014, 31, 374–395. [Google Scholar]
  21. Andrade, M.A.; de Oliveira Torres, L.R.; Silva, A.S.; Barbosa, C.H.; Vilarinho, F.; Ramos, F.; de Quirós, A.R.B.; Khwaldia, K.; Sendón, R. Industrial multi-fruits juices by-products: Total antioxidant capacity and phenolics profile by LC–MS/MS to ascertain their reuse potential. Eur. Food Res. Technol. 2020, 1, 3. [Google Scholar] [CrossRef]
  22. Kedare, S.B.; Singh, R.P. Genesis and development of DPPH method of antioxidant assay. J. Food Sci. Technol. 2011, 48, 412–422. [Google Scholar] [CrossRef] [Green Version]
  23. Huang, D.; Ou, B.; Prior, R.L. The Chemistry behind Antioxidant Capacity Assays. J. Agric. Food Chem. 2005, 53, 1841–1856. [Google Scholar] [CrossRef] [PubMed]
  24. The European Parliament and the Council of The European Union. Directive 2009/32/EC of the European Parliament and of the Council of 23 April 2009 on the approximation of the laws of the Member States on extraction solvents used in the production of foodstuffs and food ingredients. Off. J. Eur. Union 2009, L141, 3–10. [Google Scholar]
  25. Moure, A.; Franco, D.; Sineiro, J.; Domínguez, H.; Núñez, M.J.; Lema, J.M. Antioxidant activity of extracts from Gevuina avellana and Rosa rubiginosa defatted seeds. Food Res. Int. 2001, 34, 103–109. [Google Scholar] [CrossRef]
  26. Miller, H.E. A simplified method for the evaluation of antioxidants. J. Am. Oil Chem. Soc. 1971, 48, 91. [Google Scholar] [CrossRef]
  27. Erkan, N.; Ayranci, G.; Ayranci, E. Antioxidant activities of rosemary (Rosmarinus Officinalis L.) extract, blackseed (Nigella sativa L.) essential oil, carnosic acid, rosmarinic acid and sesamol. Food Chem. 2008, 110, 76–82. [Google Scholar] [CrossRef]
  28. Yoo, K.M.; Lee, C.H.; Lee, H.; Moon, B.; Lee, C.Y. Relative antioxidant and cytoprotective activities of common herbs. Food Chem. 2008, 106, 929–936. [Google Scholar] [CrossRef]
  29. de Albuquerque, M.A.C.; Levit, R.; Beres, C.; Bedani, R.; de Moreno de LeBlanc, A.; Saad, S.M.I.; LeBlanc, J.G. Tropical fruit by-products water extracts of tropical fruit by-products as sources of soluble fibres and phenolic compounds with potential antioxidant, anti-inflammatory, and functional properties. J. Funct. Foods 2019, 52, 724–733. [Google Scholar] [CrossRef]
  30. Guimarães, R.; Barros, L.; Barreira, J.C.M.; Sousa, M.J.; Carvalho, A.M.; Ferreira, I.C.F.R. Targeting excessive free radicals with peels and juices of citrus fruits: Grapefruit, lemon, lime and orange. Food Chem. Toxicol. 2010, 48, 99–106. [Google Scholar] [CrossRef]
  31. Espinosa-Pardo, F.A.; Nakajima, V.M.; Macedo, G.A.; Macedo, J.A.; Martínez, J. Extraction of phenolic compounds from dry and fermented orange pomace using supercritical CO2 and cosolvents. Food Bioprod. Process. 2017, 101, 1–10. [Google Scholar] [CrossRef]
  32. Li, B.B.; Smith, B.; Hossain, M.M. Extraction of phenolics from citrus peels: II. Enzyme-assisted extraction method. Sep. Purif. Technol. 2006, 48, 189–196. [Google Scholar] [CrossRef]
  33. Diñeiro García, Y.; Valles, B.S.; Picinelli Lobo, A. Phenolic and antioxidant composition of by-products from the cider industry: Apple pomace. Food Chem. 2009, 117, 731–738. [Google Scholar] [CrossRef]
  34. Anagnostopoulou, M.A.; Kefalas, P.; Papageorgiou, V.P.; Assimopoulou, A.N.; Boskou, D. Radical scavenging activity of various extracts and fractions of sweet orange peel (Citrus sinensis). Food Chem. 2006, 94, 19–25. [Google Scholar] [CrossRef]
  35. De Moraes Barros, H.R.; De Castro Ferreira, T.A.P.; Genovese, M.I. Antioxidant capacity and mineral content of pulp and peel from commercial cultivars of citrus from Brazil. Food Chem. 2012, 134, 1892–1898. [Google Scholar] [CrossRef]
  36. Garau, M.C.; Simal, S.; Rosselló, C.; Femenia, A. Effect of air-drying temperature on physico-chemical properties of dietary fibre and antioxidant capacity of orange (Citrus aurantium v. Canoneta) by-products. Food Chem. 2007, 104, 1014–1024. [Google Scholar] [CrossRef]
  37. Vieira, F.G.K.; Borges, G.D.S.C.; Copetti, C.; Di Pietro, P.F.; Nunes, E.D.C.; Fett, R. Phenolic compounds and antioxidant activity of the apple flesh and peel of eleven cultivars grown in Brazil. Sci. Hortic. 2011, 128, 261–266. [Google Scholar] [CrossRef]
  38. Suleria, H.A.R.; Barrow, C.J.; Dunshea, F.R. Screening and Characterization of Phenolic Compounds and Their Antioxidant Capacity in Different Fruit Peels. Foods 2020, 9, 1206. [Google Scholar] [CrossRef]
  39. Lee, J.; Chan, B.L.S.; Mitchell, A.E. Identification/quantification of free and bound phenolic acids in peel and pulp of apples (Malus domestica) using high resolution mass spectrometry (HRMS). Food Chem. 2017, 215, 301–310. [Google Scholar] [CrossRef] [PubMed] [Green Version]
  40. Zhang, Z.; Poojary, M.M.; Choudhary, A.; Rai, D.K.; Tiwari, B.K. Comparison of selected clean and green extraction technologies for biomolecules from apple pomace. Electrophoresis 2018, 39, 1934–1945. [Google Scholar] [CrossRef] [PubMed]
  41. De Ancos, B.; Cilla, A.; Barberá, R.; Sánchez-Moreno, C.; Cano, M.P. Influence of orange cultivar and mandarin postharvest storage on polyphenols, ascorbic acid and antioxidant activity during gastrointestinal digestion. Food Chem. 2017, 225, 114–124. [Google Scholar] [CrossRef] [PubMed] [Green Version]
  42. Molina-Calle, M.; Priego-Capote, F.; Luque de Castro, M.D. Development and application of a quantitative method for determination of flavonoids in orange peel: Influence of sample pretreatment on composition. Talanta 2015, 144, 349–355. [Google Scholar] [CrossRef] [PubMed]
  43. Gómez-Mejía, E.; Rosales-Conrado, N.; León-González, M.E.; Madrid, Y. Citrus peels waste as a source of value-added compounds: Extraction and quantification of bioactive polyphenols. Food Chem. 2019, 295, 289–299. [Google Scholar] [PubMed]
  44. Sommella, E.; Pepe, G.; Pagano, F.; Ostacolo, C.; Tenore, G.C.; Russo, M.T.; Novellino, E.; Manfra, M.; Campiglia, P. Detailed polyphenolic profiling of Annurca apple (M. pumila Miller cv Annurca) by a combination of RP-UHPLC and HILIC, both hyphenated to IT-TOF mass spectrometry. Food Res. Int. 2015, 76, 466–477. [Google Scholar] [PubMed]
  45. Li, X.; Wu, X.; Bi, J.; Liu, X.; Li, X.; Guo, C. Polyphenols accumulation effects on surface color variation in apple slices hot air drying process. LWT 2019, 108, 421–428. [Google Scholar] [CrossRef]
  46. Xi, W.; Lu, J.; Qun, J.; Jiao, B. Characterization of phenolic profile and antioxidant capacity of different fruit part from lemon (Citrus limon Burm.) cultivars. J. Food Sci. Technol. 2017, 54, 1108–1118. [Google Scholar] [CrossRef] [PubMed] [Green Version]
  47. Mcharek, N.; Hanchi, B. Maturational effects on phenolic constituents, antioxidant activities and LC-MS / MS profiles of lemon (Citrus limon) peels. J. Appl. Bot. Food Qual. 2017, 90, 1–9. [Google Scholar]
Figure 1. HPLC-DAD chromatograms of fruit by-products (a) orange, (b) lemon, and (c) apple, recorded at 278 nm.
Foods 10 00272 g001
Table 1. DPPH radical scavenging capacity of different fruit by-products. The results are expressed as mean of three replicas ± SD. Different letters indicate statistical differences.
Fruits By-ProductsInhibition Percentage
(%)
Trolox Equivalent
(mg Trolox/g of Extract)
Lemon51.67 ± 4.61 a33.17 ± 2.94 d
Orange31.20 ± 1.28 b20.13 ± 0.43 e
Apple39.92 ±1.68 c25.69 ± 0.56 f
Table 2. Antioxidant capacity and characterization of different fruit by-products. The results are expressed as Mean ± SD. Different letters indicate statistical differences.
β-Carotene Bleaching AssayTPC
(mg GAE/g)
TFC
(mg ECE/g)
Mean ± SDMean ± SDMean ± SD
Lemon67.35 ± 1.96 a43.38 ± 0.84 c20.76 ± 0.61 f
Orange237.21 ± 29.78 b23.32 ± 0.18 d7.29 ± 0.32 g
Apple107.44 ± 23.81 a14.02 ± 0.13 e24.63 ± 1.61 h
Table 3. Phenolic compounds identified in the fruit by-products from orange, lemon and apple by HPLC-DAD and UHPLC-ESI-MS/MS.
PeakRt (min)λmax[M-H] (m/z)Main MS/MS Fragments (m/z)Molecular FormulaStructural ClassTentative IdentificationBy-ProductConfirmation/
Ref. §
OrangeLemonApple
14.31260, 293153109, 108C7H6O4Benzoic acid derivatesProtocatechuic acid[38,39], Std*
27.0925513793, 65C7H6O3Benzoic acid derivatesHydroxybenzoic acid[38,39,40,41], Std*
39.59325179134, 135C9H8O4Hydroxycinnamic acidsCaffeic acid[39,40,46], Std*
49.99250, 325353191, 173C16H18O9Hydroxycinnamic acidsChlorogenic acid [38,39,40], Std*
511.42240, 330355193C16H20O9Hydroxycinnamic acids glycosidesFerulic acid-O-hexoside [41]
611.64280289245, 203C15H14O6Flavan-3-olsEpicatechin [40,44], Std*
711.8270, 330385223C17H22O10Hydroxycinnamic acids glycosidesSinapic acid-O-hexoside [41]
813.39310163119, 93C9H8O3Hydroxycinnamic acidsp-Coumaric acid[38,39,40,46], Std*
915.26325193134C10H10O4Hydroxycinnamic acidsFerulic acid [38,39,40,46], Std*
1015.68270, 340593473C26H28O14Flavone glycosidesApigenin-6,8-di-C-glucoside (Vicenin-2) [41]
1117.95285, 330595287, 151, 135C27H32O15Flavanone glycosidesEriodyctiol-O-rutinoside (Eriocitrin) [41,46,47], Std*
1220.29270, 350567273C26H31O14Dihydrochalcone glycosidesPhloretin-O-apiofuranosyl-glucopyranoside [40]
1320.56290, 330579271C27H32O14Flavanone glycosidesNaringenin-7-O-rutinoside (Narirutin) [40,41,42]
1421.00356593285C27H30O15Flavonol glycosidesKaempferol-3-O-rutinoside [40]
1521.36290, 355609300, 286, 242 C28H34O15Flavanone glycosidesHesperetin-7-O-rutinoside (Hesperidin) [40,41,42,43,46,47], Std*
1621.37278435273, 167, 123C21H24O10Dihydrochalcone glycosidesPhloretin-2′-O-beta-glucoside (Phlorizin) [40], Std*
1721.49360463301, 271C21H20O12Flavonol glycosidesQuercetin-3-O-glucoside (Isoquercetin) [38], Std*
1821.52290, 355609286C28H34O15Flavanone glycosidesHesperetin-7-O-neohesperidoside (Neohesperidin) [42]
1921.58255, 360609300, 271C27H30O16Flavonol glycosidesQuercetin-3-O-rutinoside (Rutin)[40,41,43,44,46,47], Std*
2022.28270, 350433301, 271C21H22O10Flavanone glycosidesNaringenin-7-O-glucoside (Prunin)[40]
2122.49250, 330359197, 161C18H16O8Hydroxycinnamic acidsRosmarinic acid [39], Std*
2222.51250, 350447331, 300, 301C21H20O11Flavonol glycosidesQuercetin-3-O-rhamnoside (Quercitrin)[38,40,44,45], Std*
2323.19285, 330593285C28H34O14Flavanone glycosidesIsosakuranetin-7-O-rutinoside (Dydimin) [41]
2423.71295271151, 119C15H12O5Flavanone Naringenin[40,41,42,44,46], Std*
2523.84270, 36027470, 88C15H10O7FlavonolsQuercetin[21,38,40,41,47], Std*
2624.9280, 360269117C15H10O5FlavonesApigenin Std*
Rt—retention time; λmax—maximum absorption wavelengths; [M–H]—molecular ions; ✓—indicates the presence of the compound identified; § Ref—references used to support tentative identification of compounds and Std* (standards available) to confirm the identification.
Table 4. Analytical parameters of detection maximum absorption wavelength (λmax), linearity, LOD, and LOQ employed to determine bioactive phenolic compounds studied.
Phenolic CompoundDetection λmax (nm)SlopeInterceptR2Concentration Range (µg/mL)LOD
(µg/g By-Product)
LOQ
(µg/g By-Product)
Protocatechuic acid30040.63−4.3340.99800.05–200.040.10
Hydroxybenzoic acid278210.0−14.520.99900.10–200.100.20
Caffeic acid325146.6−40.500.99800.10–200.100.21
Chlorogenic acid32561.58−14.270.99890.10–200.100.20
Epicatechin27821.66−2.0060.99960.10–200.100.20
p-Coumaric acid325169.6−10.050.99900.05–200.040.10
Ferulic acid325159.91.1280.99990.05–200.050.20
Eriocitrin27819.12−1.0250.99990.05–200.040.10
Hesperidin27850.42−2.9750.99970.03–200.010.05
Phlorizin27824.780.12480.99990.05–200.040.10
Isoquercitrin36052.555.2180.99940.05–200.040.10
Rutin36049.90−3.9780.99990.05–200.040.10
Rosmarinic acid325117.5−21.470.99870.05–200.040.10
Quercetrin36067.76−4.6160.99980.05–200.050.10
Naringenin30070.09−22.150.99700.05–200.030.05
R2—Coefficient of determination; LOD—Limit of determination; LOQ—Limit of quantification.
Table 5. Total and individual phenolic compounds contents (µg/g dry basis) in the by-products from orange, lemon and apple fruits determined by HPLC-DAD.
Phenolic Compound (µg/g of By-Product)Fruit By-Product
OrangeLemonApple
Benzoic acid derivates
Protocatechuic acid317.3 ± 7.17316.08 ± 1.7292.465 ± 0.0248
Hydroxybenzoic acid<LOQ20.27 ± 1.0531.939 ± 0.0472
Σ317.3 ± 7.17336.35 ± 0.72084.404 ± 0.0682
Hydroxycinnamic acids
Caffeic acid26.19 ± 1.19514.67 ± 0.4107<LOQ
Chlorogenic acidn.a.386.7 ± 11.8039.41 ± 1.016
p-Coumaric acid18.49 ± 0.55476.424 ± 0.2468<LOQ
Ferulic acid22.88 ± 0.9469n.a.n.a.
Rosmarinic acid12.97 ± 0.6995n.a.88.62 ± 3.606
Σ80.53 ± 2.915407.8 ± 12.17128.0 ± 4.554
Flavan-3-ols
Epicatechinn.a.n.a.31.24 ± 0.7253
Σ 31.24 ± 0.7253
Flavanone glycosides
Eriocitrin24.63 ± 1.40917,493 ± 115.5n.a.
Hesperidin4901 ± 155.42728 ± 17.32n.a.
Naringenin30.09 ± 0.464742.12 ± 0.860516.33 ± 0.834
Σ4956 ± 156.920,263 ± 131.616.33 ± 0.834
Flavonols glycosides
Isoquercetinn.a.111.6 ± 0.8220n.a.
Rutin31.43 ± 1.13044.72 ± 0.578822.44 ± 0.977
Quercetrin7.964 ± 0.4449106.0 ± 0.3979150.3 ± 3.769
Σ39.40 ± 0.9735262.3 ± 1.793172.7 ± 4.709
Dihydrochalcone
glycosides
Phlorizinn.a.n.a.542.0 ± 7.882
Σ 542.0 ± 7.882
Total content (µg/g)5393 ± 166.120,969 ± 144.7894.8 ± 16.22
Results expressed as mean values (n = 3) ± standard deviation. n.a. Not applicable. The summation (Σ) of each class of phenolic compounds is highlighted in bold.
Publisher’s Note: MDPI stays neutral with regard to jurisdictional claims in published maps and institutional affiliations.

