Article

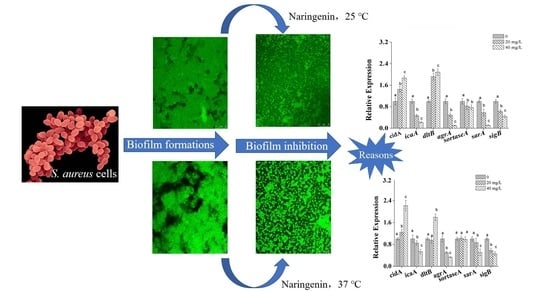
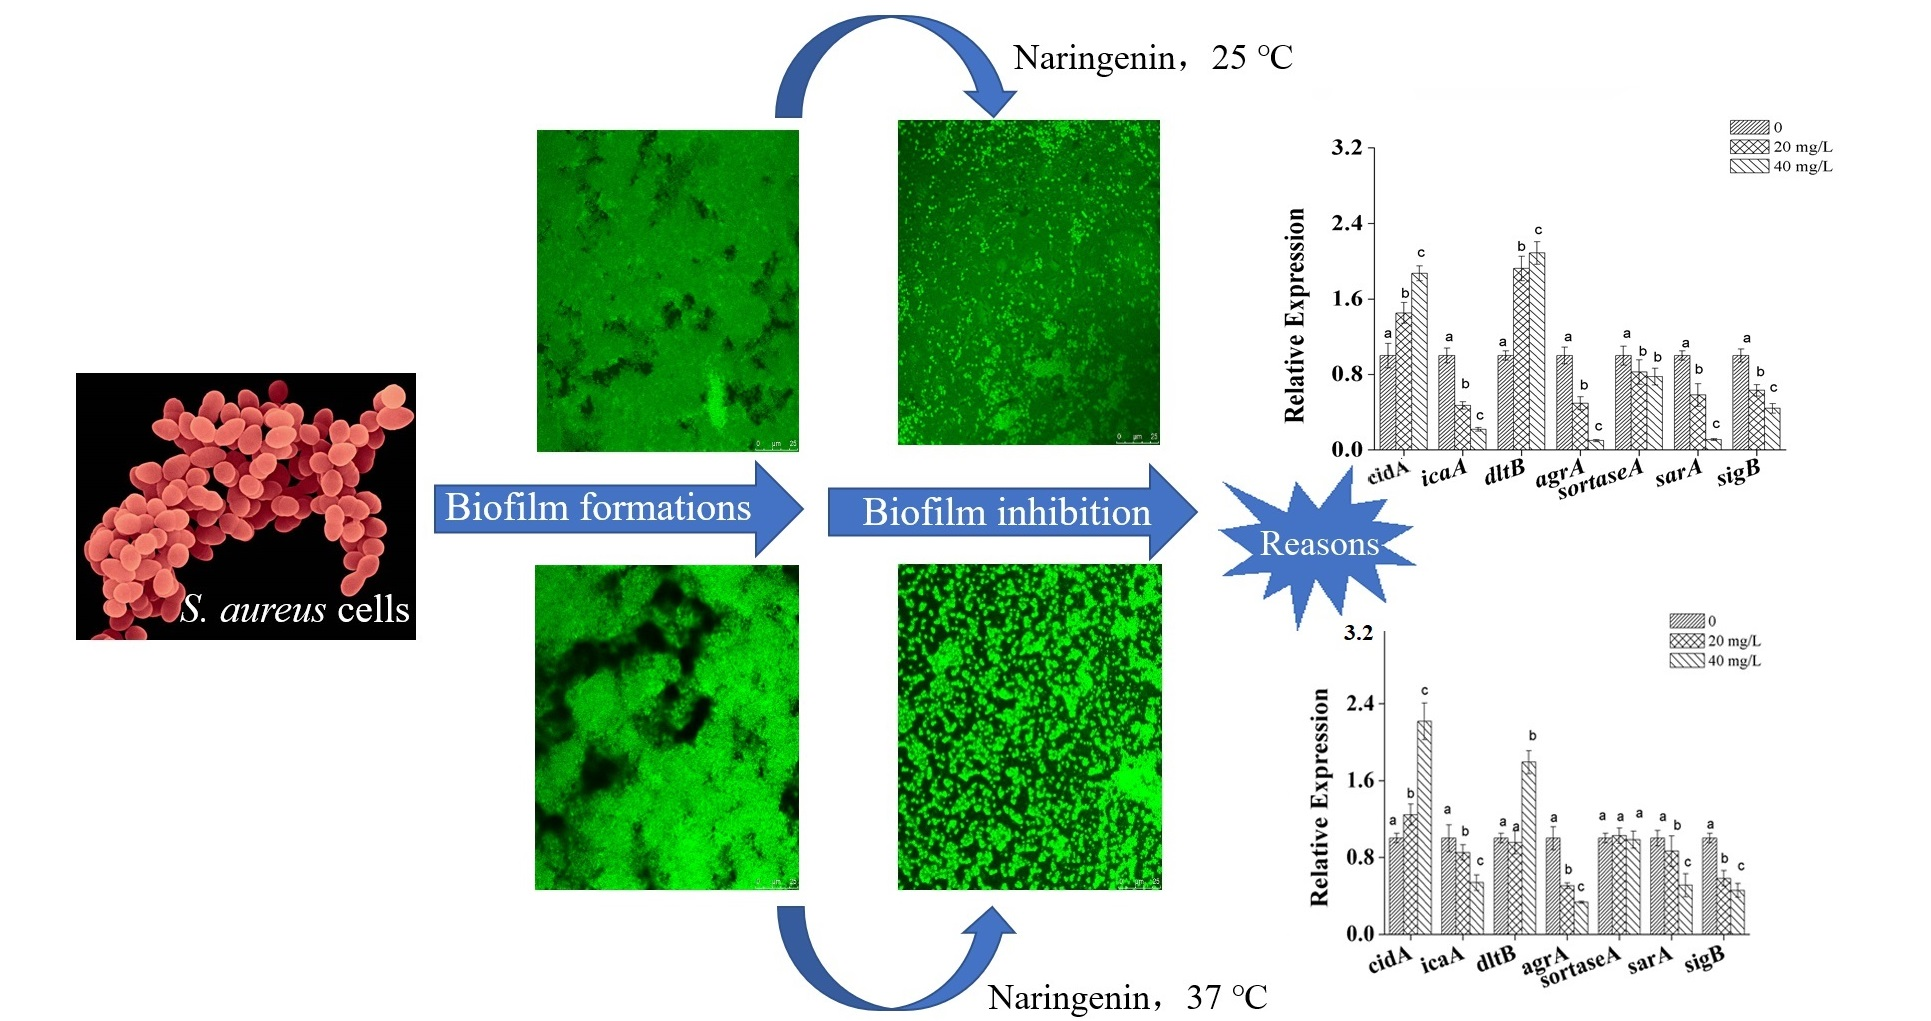
Inhibition of Biofilm Formation of Foodborne Staphylococcus aureus by the Citrus Flavonoid Naringenin

1
School of Food Science and Engineering, South China University of Technology, Guangzhou 510641, China
2
Overseas Expertise Introduction Center for Discipline Innovation of Food Nutrition and Human Health (111 Center), Guangzhou 510641, China
3
School of Food Science and Engineering, Foshan University, Foshan 528000, China
*
Author to whom correspondence should be addressed.
Foods 2021, 10(11), 2614; https://doi.org/10.3390/foods10112614
Submission received: 23 September 2021 / Revised: 22 October 2021 / Accepted: 25 October 2021 / Published: 28 October 2021

Abstract

:
Taking into consideration the importance of biofilms in food deterioration and the potential risks of antiseptic compounds, antimicrobial agents that naturally occurring are a more acceptable choice for preventing biofilm formation and in attempts to improve antibacterial effects and efficacy. Citrus flavonoids possess a variety of biological activities, including antimicrobial properties. Therefore, the anti-biofilm formation properties of the citrus flavonoid naringenin on the Staphylococcus aureus ATCC 6538 (S. aureus) were investigated using subminimum inhibitory concentrations (sub-MICs) of 5~60 mg/L. The results were confirmed using laser and scanning electron microscopy techniques, which revealed that the thick coating of S. aureus biofilms became thinner and finally separated into individual colonies when exposed to naringenin. The decreased biofilm formation of S. aureus cells may be due to a decrease in cell surface hydrophobicity and exopolysaccharide production, which is involved in the adherence or maturation of biofilms. Moreover, transcriptional results show that there was a downregulation in the expression of biofilm-related genes and alternative sigma factor sigB induced by naringenin. This work provides insight into the anti-biofilm mechanism of naringenin in S. aureus and suggests the possibility of naringenin being used in the industrial food industry for the prevention of biofilm formation.

Graphical Abstract

1. Introduction

Staphylococcus aureus is a common pathogen and is responsible for food poisoning through the production of thermally stable enterotoxins in various kinds of food [1,2]. A microbial biofilm is an aggregation of bacteria that is composed of extracellular polymeric substances, which are attached on the surface of microorganisms [3]. The most common feature of microbial lifestyles is attachment onto a surface by biofilm formation. Notably, S. aureus can form biofilms on different surfaces in food processing plants and is very adaptable to various environmental stressors including acids, salts, antibiotics, and detergents [4,5,6]. The presence of S. aureus biofilm on food contact surfaces creates serious problems for the food industry because it can lead to food spoilage and disease transmission [7,8]. Therefore, it is important to inhibit the formation of S. aureus biofilms on food contact to surfaces ensure the manufacture of safe food products.
Flavonoids from fruits and vegetables have been shown to has a range of biological activities [9,10]. For example, the citrus flavonoid naringenin have beneficial effects on human health by preventing various diseases, including diabetes, hypertension and cancer [11,12,13]. Moreover, naringenin has wide antibacterial activity and can prevent the growth of numerous microorganisms [14,15]. Specifically, naringenin from bergamot peel inhibits Escherichia coli, Lactococcus lactis, Salmonella Enteritidis, and Pseudomonas putida with minimum inhibitory concentration (MIC) values ranging from 0.25 to 1.0 g/L [9]. A small number of studies have reported that naringenin inhibits the biofilm formation of microorganisms (Escherichia coli, Vibrio harveyi and Streptococcus mutans) by affecting the expression of bacteria related genes and surface hydrophobicity [16,17]. In our earlier study, we determined that naringenin has strong antibacterial activity against S. aureus via such mechanisms of action as disrupting the bacterial cytoplasmic membrane and binding to its genomic DNA [18]. Moreover, we also found that naringenin has a strong effect in suppressing the biofilm formation of S. aureus on the surface of glass and plastic well plates. However, to the best of our knowledge, research into biofilm inhibition by naringenin is limited, and its anti-biofilm mechanism is also unclear.
Hence, we aimed to study the effect of naringenin on the inhibition of the biofilm formation of S. aureus at different temperatures (25 and 37 °C) using confocal laser and scanning electron microscopy techniques and exopolysaccharide production (EPS) and hydrophobicity assays. Furthermore, our study also investigated the genes (sigB) related to S. aureus biofilms using RT-qPCR, which is the main regulator of gene transcription and expression under the stress conditions induced by naringenin.

2. Materials and Methods

2.1. Bacterial Strain and Biofilm Formation

The foodborne strain S. aureus was obtained from the Microbial Culture Collection Center of Guangdong Institute of Microbiology (Guangzhou, China) and activated by culturing twice in 100 mL of sterile tryptic soy broth (TSB, Beijing Aoboxing Biotechnology Co., Ltd., Beijing, China) at 37 °C for 24 h. The effect of naringenin (purity ≥ 98%, Aladdin Chemical Co., Shanghai, China) on S. aureus growth was evaluated by transferring pre-cultured S. aureus cells into fresh TSB liquid medium (OD600 nm ≈ 0.08) and cultivating in 96-well polystyrene plates at different temperature (25 and 37 °C) with gentle shaking. In order to measure the absorbance value of S. aureus growth, a FilterMax F5 multifunctional microplate reader (American molecular devices company, Sunnyvale, CA, USA) was used.
The biofilm assay was performed under similar conditions without shaking. The volume of DMSO, that was used to dissolve naringenin was equal in all of the samples, while the final concentration of naringenin varied from 0 to 60 mg/L. The crystal violet staining method was used to quantify S. aureus biofilm according to a relevant publication [19].

2.2. Cell Surface Hydrophobicity of S. aureus

The effects of naringenin on S. aureus cell surface hydrophobicity were evaluated at 25 and 37 °C by analyzing cells adhesion to xylene, as previously described [20]. After cultivation to the stationary-phase (48 h for S. aureus at 25 °C, and 12 h for S. aureus at 37 °C), S. aureus cells were collected by refrigerated centrifugation at 4000× g for 5 min. The S. aureus pellet was washed twice using distilled water and resuspended in 3 mL of a 0.85% NaCl solution (OD600 nm ≈ 0.3), which defined as A1. Xylene (1 mL) was added to a 3 mL suspension of S. aureus and then incubated for 15 min at 25 °C. After vortexing for two minutes and then incubating for 15 min, the mixture separated into a xylene/water bilayer system. The OD600 nm of the aqueous phase of the bilayer was recorded as A2. The index of cell surface hydrophobicity (I) was determined using Equation (1):
I = (1 − A2/A1) × 100%

2.3. Quantification EPS Production of S. aureus

After growing in the various subminimum inhibitory concentrations of naringenin, the S. aureus cells were centrifuged (12,000× g for 15 min at 4 °C) and the supernatant of S. aureus was then filtered through glass fiber filters. An equal volume of absolute ethanol was then added to this supernatant of S. aureus and incubated overnight at 4 °C to precipitate EPS. The precipitate was resuspended in water with gentle heating (50 °C) and then quantified using a phenol–sulfuric acid procedure [21]. The percentage of EPS reduction upon exposure to naringenin was evaluated using Equation (2):
Reduction of EPS (%) = (1 − E2/E1) × 100%
where E1 and E2 are the absorbances at 490 nm for S. aureus cells grown in the absence and presence of naringenin, respectively.

2.4. CLSM and SEM of S. aureus Biofilms

A 3 mL aliquot of inoculum (OD600 nm ≈ 0.1) was transferred into the wells of a 6-well plate containing 13 mm-diameter sterile glass coverslips. After incubation at 25 and 37 °C for 48 h and 12 h respectively, the medium with free-floating S. aureus cells was removed and the coverslips washed thrice in sterile 0.85% saline solution. S. aureus biofilms on glass coverslips were then stained for 20 min in the dark at room temperature with diluted 5(6)-carboxy fluorescein diacetate succinimidyl ester (Aladdin Chemical Co., Shanghai, China). The stained biofilms were adjusted and photographed using a confocal laser scanning microscope (Leica, Wetzlar, Germany). At least ten pictures were taken from different locations for each sample, and the image data were then processed and analyzed.
S. aureus biofilms were prepared for SEM analysis as previously described, with minor modifications [18]. Glutaraldehyde (2.5% in 0.01 M phosphate buffer, pH 7.2) was added to the samples and incubated overnight at 4 °C and then dehydrated using a series of ethanol solutions (20 min each time) of increasing concentration (30~100%). The dehydrated biofilms were then incubated in tertiary butanol twice for 20 min each, followed by air-drying overnight. After gold-coating by ion sputtering (Jeol JFC-1100, Tokyo, Japan), S. aureus biofilms were photographed by scanning electron microscopy (SEM, Zeiss EVO18, Germany) with operation at 10.0 kV.

2.5. RNA Extraction and Real-Time Quantitative PCR (RT-qPCR) Analysis

TRIzol reagent (Invitrogen, CA, USA) was used according to the kit instructions to extract the S. aureus RNA. To check the concentration and purity, the RNA was measure at OD260 and OD280 using an 1800 UV spectrophotometer (Shimadzu Corporation, Kyoto, Japan). cDNA was reverse transcribed from 800 ng RNA with 4.0 µL of 5 × reaction buffer, 0.5 µL Thermo Scientific RiboLock RNase Inhibitor (20 U) and 1.0 µL RevertAid Premium Reverse Transcriptase (200 U), following the protocol of RevertAid Premium First Strand cDNA Synthesis Kit (Thermo Scientific™ EP0733, Thermo Fisher Scientific, Waltham, MA, USA).
RT-qPCRs was performed on an Applied Biosystems StepOne Plus™ thermocycler (Life Technologies Inc., Milano, Italy) using the SybrGreen qPCR Master Mix, following the kit instructions. Reactions were carried out in a system which was composed of 10 μL Master Mix, 0.4 μL of 0.25 μM solutions of each primer (Table 1), and 2 μL cDNA, diluted to a final volume of 20 μL using double-distilled water (DNase-free). The following thermal profile was used: a holding step for 3 min at 95 °C, followed by a cycling step consisting of 45 cycles at 95 °C for 7 s (to melt), 57 °C for 10 s (to anneal) and 72 °C for 15 s (to extend). The endogenous reference gene of 16S rRNA was used to evaluate the changes in transcriptional levels of the S. aureus RNA.

2.6. Statistical Analysis

Results are expressed as means ± standard deviation (SD), and data graphics were drawn using OriginPro 7.0 (OriginLab, Northampton, MA, USA). SPSS software (IBM, Armonk, NY, USA) was used to analyze the variance (ANOVA) by Tukey’s test, and p < 0.05 was represented for significant difference.
Table 1. Sequences of the primers used for RT-qPCR.
GenePrimer
cidAForward 5′-AGCGTAATTTCGGAAGCAACATCCA-3′
Reverse 5′-CCCTTAGCCGGCAGTATTGTTGGTC-3′
icaAForward 5′-CTG GCG CAG TCA ATA CTA TTT CGG GTG TCT-3′
Reverse 5′-GAC CTC CCA ATG TTT CTG GAA CCA ACA TCC-3′
dltBForward 5′-GTGGACATCAGATTCACTTCC-3′
Reverse 5′-ATAGAACCATCACGAATTTCC-3′
agrAForward 5′-TGATAATCCTTATGAGGTGCTT-3′
Reverse 5′-CACTGTGACTCGTAACGAAAA-3′
sortaseAForward 5′-AAACCACATATCGATAATTATC-3′
Reverse 5′-TTATTTGACTTCTGTAGCTACAA-3′
sarAForward 5′-CAAACAACCACAAGTTGTTAAAGC-3′
Reverse 5′-TGTTTGCTTCAGTGATTCGTTT-3′
sigBForward 5′-AAGTGATTCGTAAGGACGTCT-3′
Reverse 5′-TCGATAACTATAACCAAAGCCT-3′
16S rRNAForward 5′-CGGTGAATACGTTCYCGG-3′
Reverse 5′-GGWTACCTTGTTACGACTT-3′

3. Results

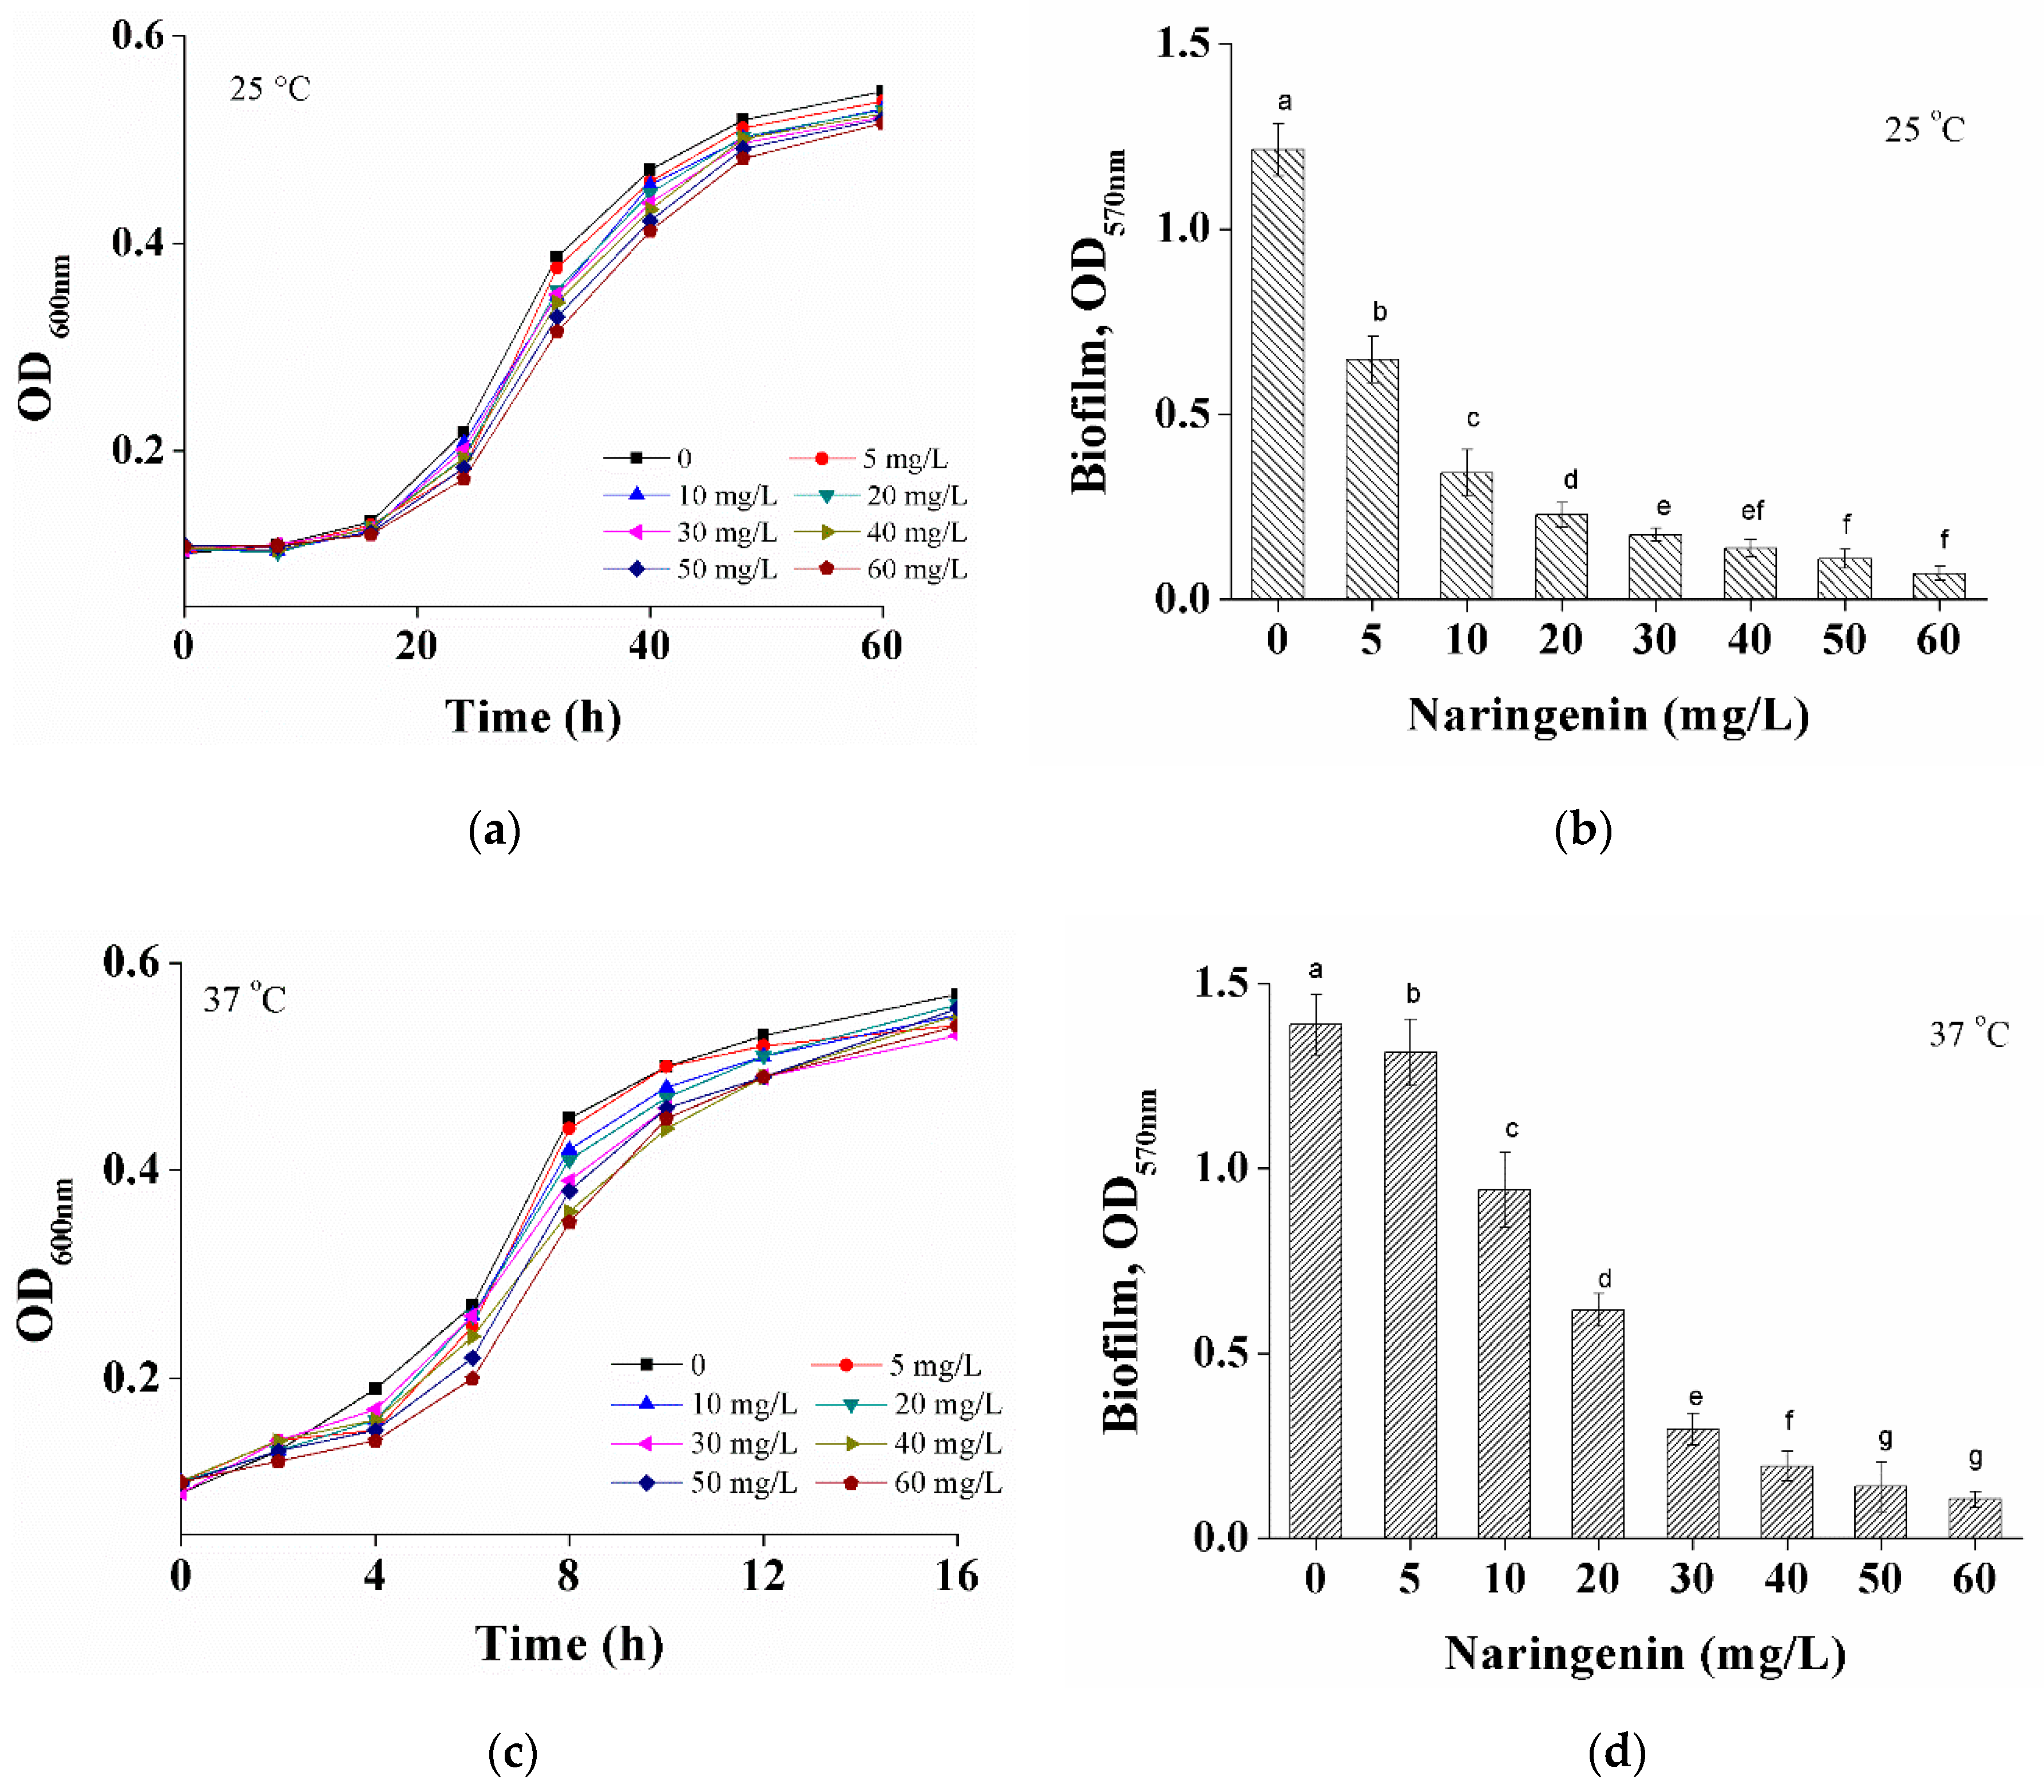
3.1. Effects of Naringenin on S. aureus at Different Growth Temperatures

Figure 1 shows the effect of naringenin on cell growth profiles of S. aureus at different temperatures as reflected by the optical density (OD) at 600 nm. Subminimum inhibitory concentrations (MIC for 0.5 g/L) [22] values in the range of (5~60 mg/L) did not decrease the cell density of S. aureus at 25 °C (Figure 1a) and 37 °C (Figure 1c). However, the time taken to reach the stationary phase for S. aureus was significantly affected by temperatures. S. aureus cultured at 37 °C takes 12 h to reach the stationary phase, as compared to 48 h for S. aureus grown at 25 °C.
The effect of naringenin on the biofilms formed at different temperatures was measured by crystal violet staining, expressed as OD570 nm. Due to different growth rates, S. aureus at 25 and 37 °C were incubated for 48 and 12 h, respectively. S. aureus biofilm formation (measured at OD570 nm) decreased with increasing concentrations of naringenin. For example, the OD570 nm of S. aureus grown at 37 °C was reduced by 0.94 (32.3%) with 10 mg/mL and 0.61 (56.1%) with 20 mg/mL naringenin (p < 0.05). A further decrease was observed after the addition of 30 mg/mL or higher naringenin concentrations (Figure 1d). By contrast, S. aureus cultivated at 25 °C showed a larger decrease (p < 0.05) in biofilm formation (as measured by OD570 nm) in the presence of naringenin. For example, OD570 nm decreased from 1.21 to 0.22 (81.8%) after exposure to naringenin at a concentration of 20 mg/L (Figure 1b).

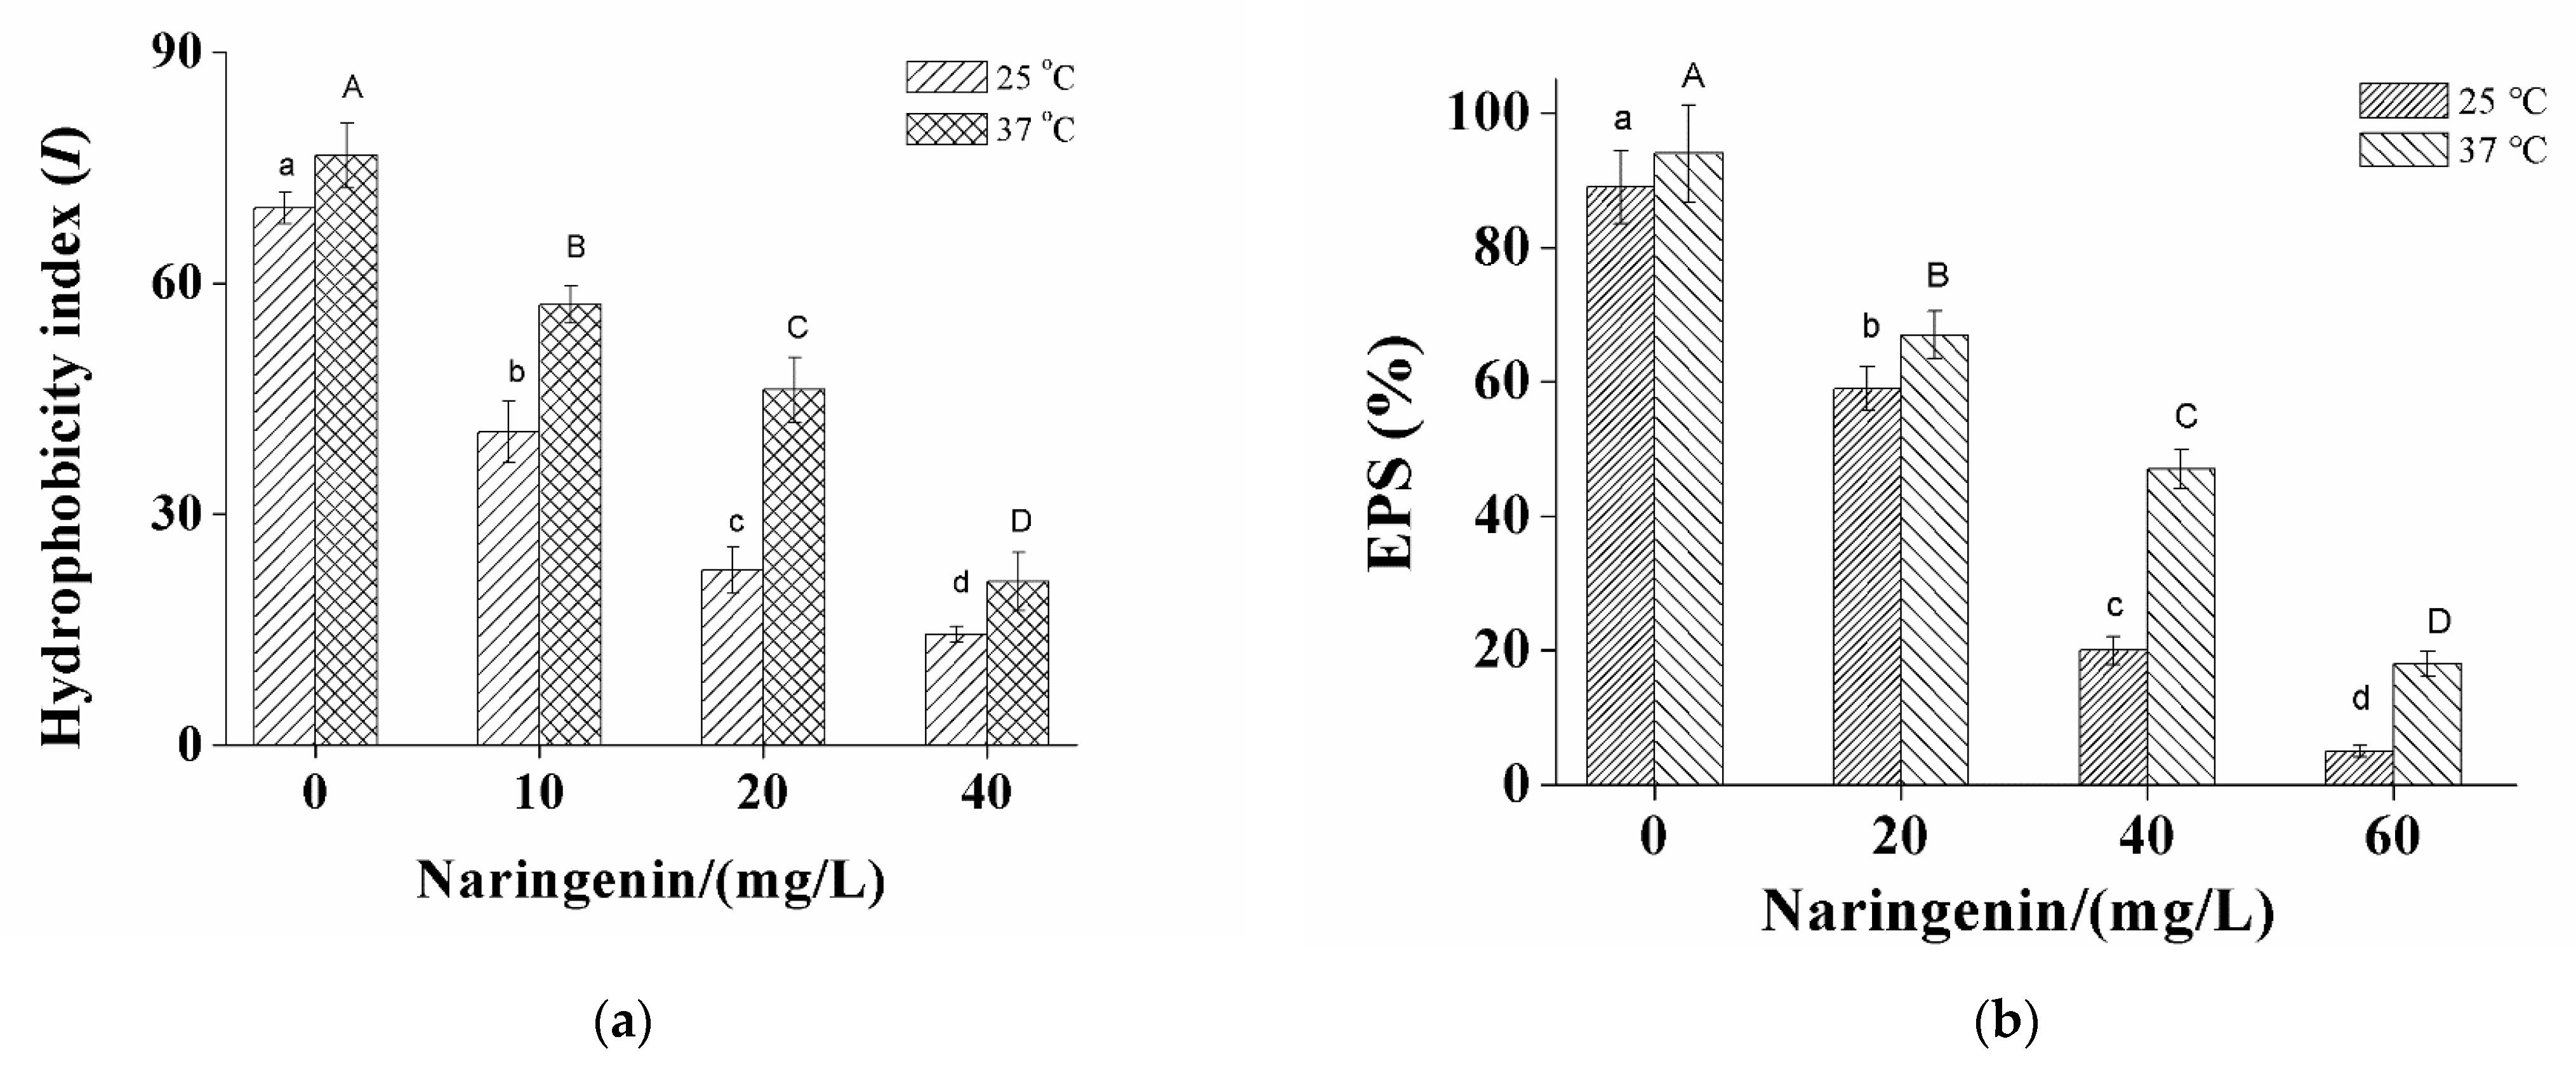
3.2. Changes in Cell Surface Hydrophobicity and EPS Production of S. aureus

Surface hydrophobicity of S. aureus cells was determined and expressed as hydrophobicity index (I). Figure 2a shows the significant dose-related reduction (p < 0.05) in cell hydrophobicity of S. aureus with increasing naringenin concentration at both 25 and 37 °C. Naringenin at a concentration of 10 mg/L dramatically reduced the surface hydrophobicity of S. aureus cells grown at 25 and 37 °C by 40.6% and 57.2% (p < 0.05), respectively. The respective values further decreased to 14.4% and 21.2% (p < 0.05) when the concentration of naringenin was increased to 40 mg/L.
The effect of naringenin on the EPS production of S. aureus was also investigated. The results reveal that S. aureus treated with various concentrations of naringenin (20, 40, and 60 mg/L) show a significant reduction (p < 0.05) in EPS compared to that of the control (Figure 2b). For S. aureus grown at 25°C, naringenin at 20 and 60 mg/mL reduced EPS by 59% and 5%, respectively. At 37 °C, the same concentrations of naringenin reduced EPS by 67% and 18%, respectively.

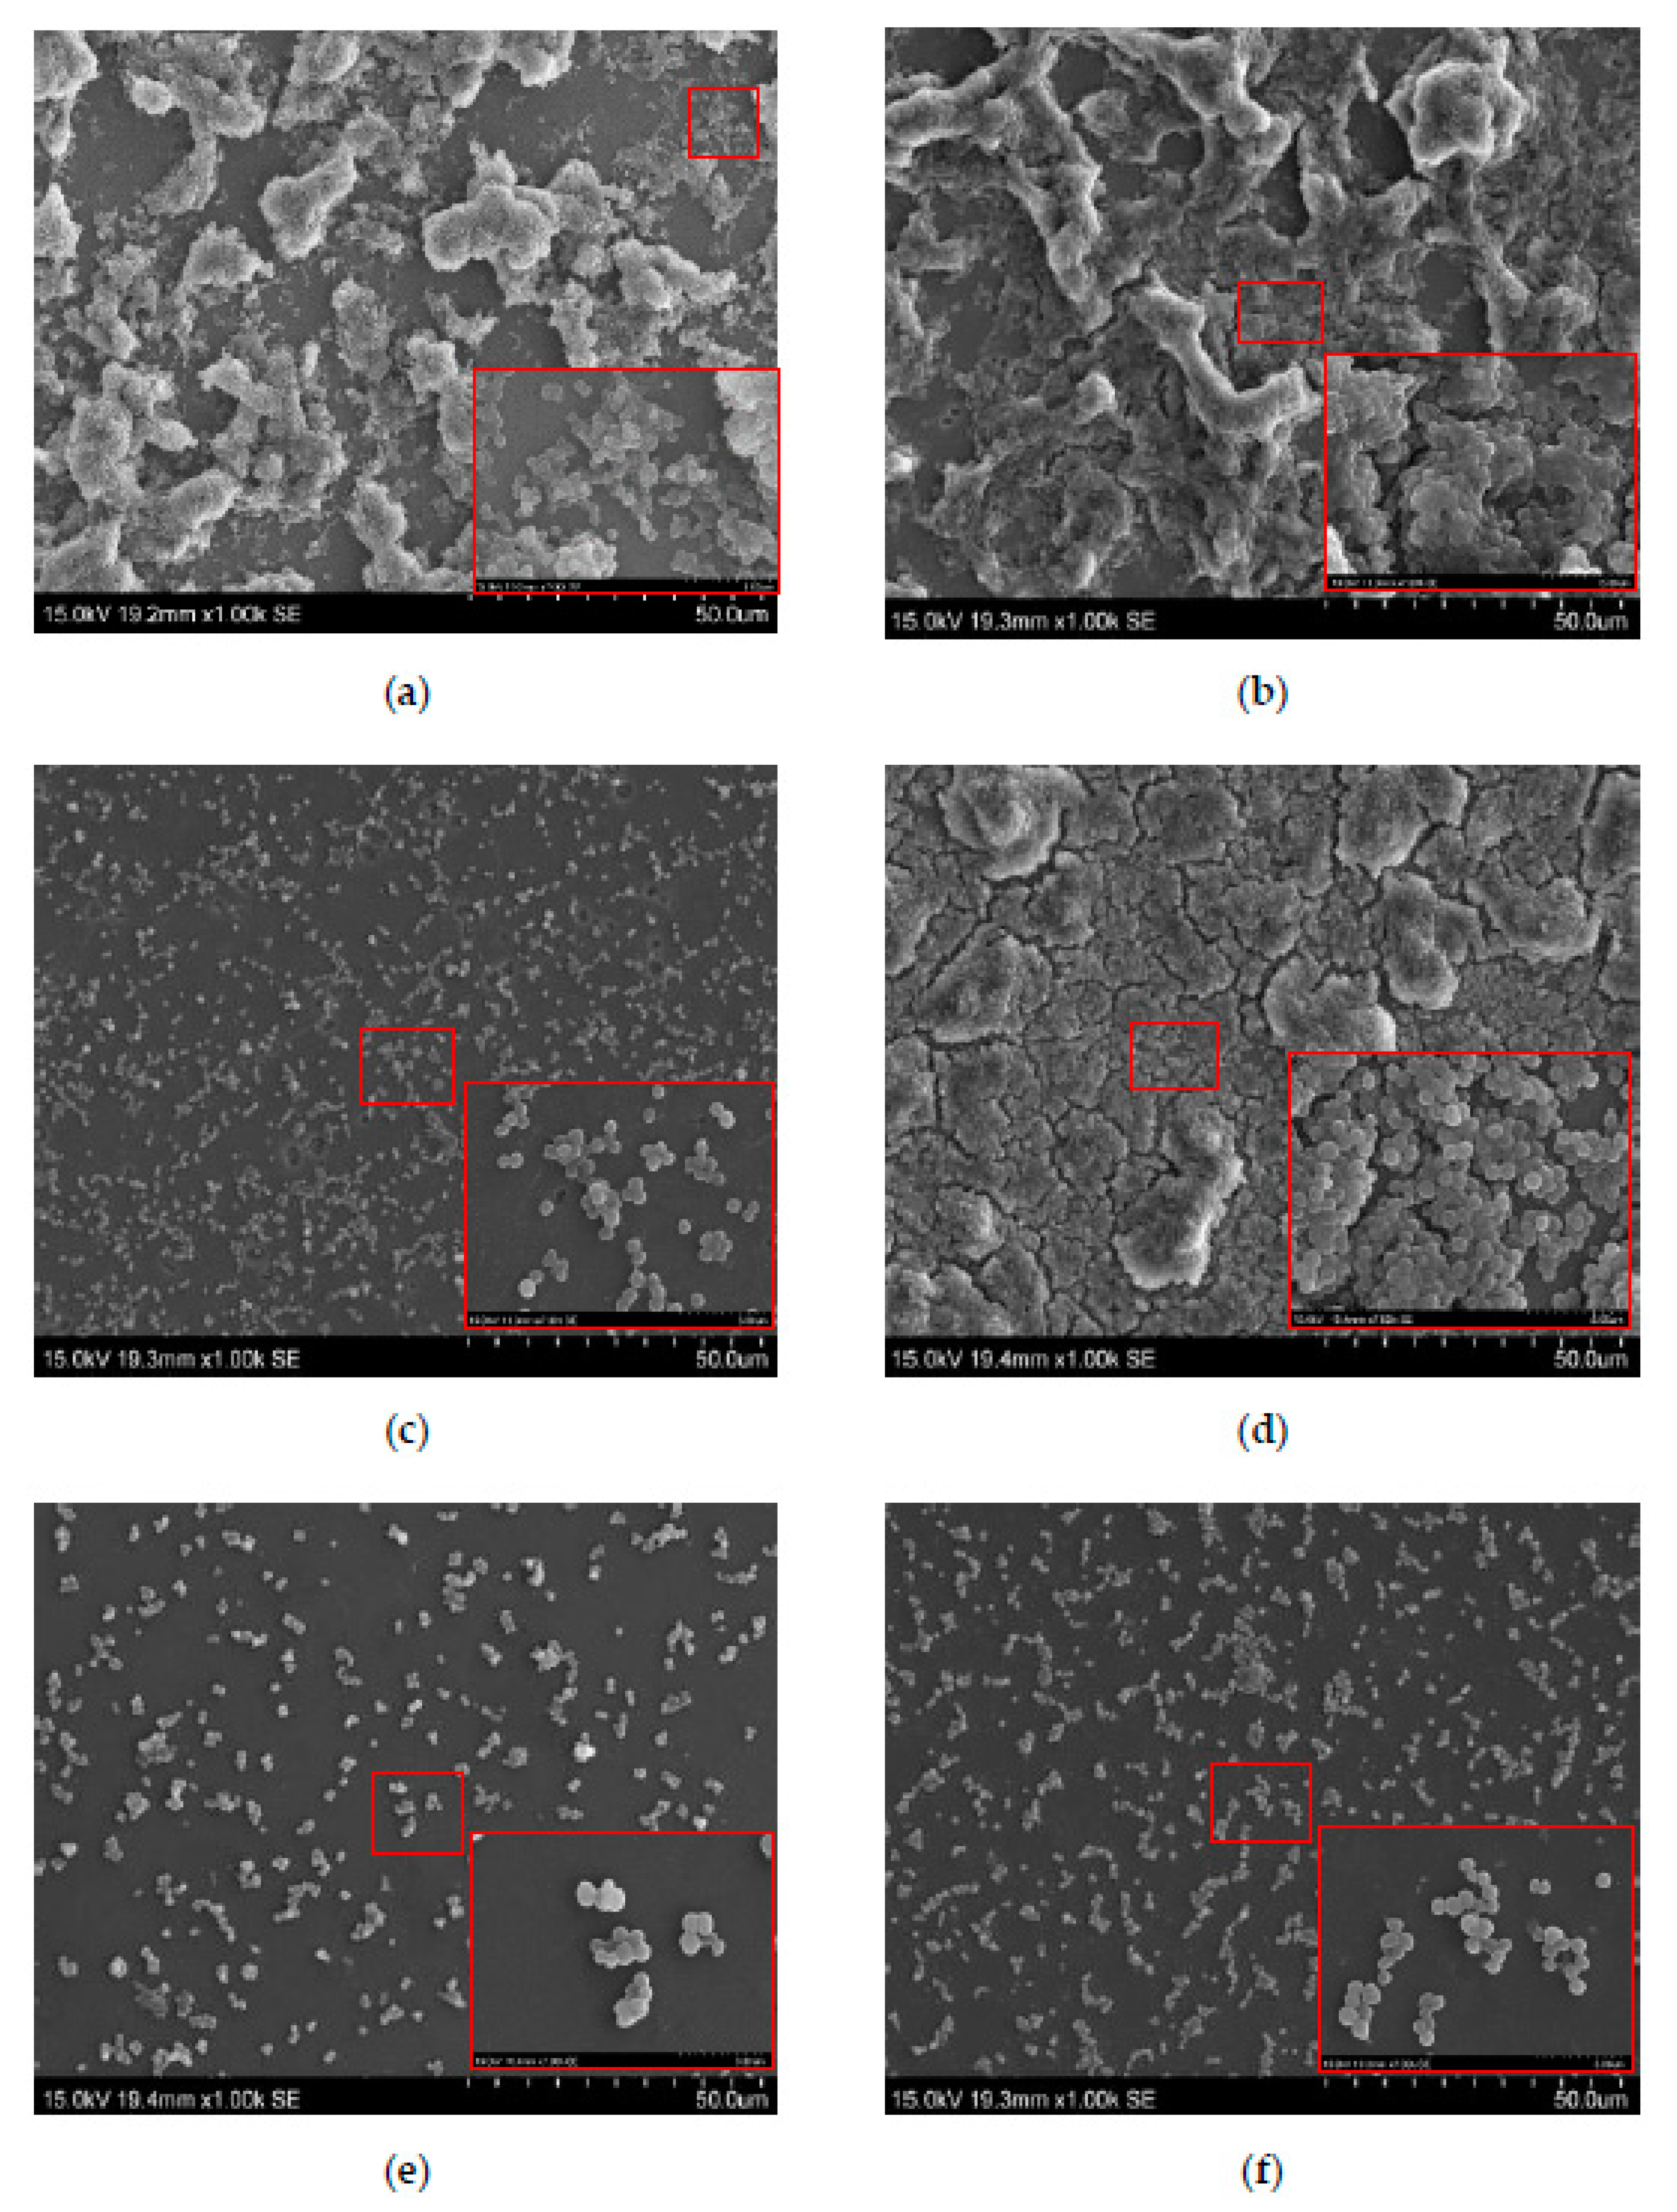
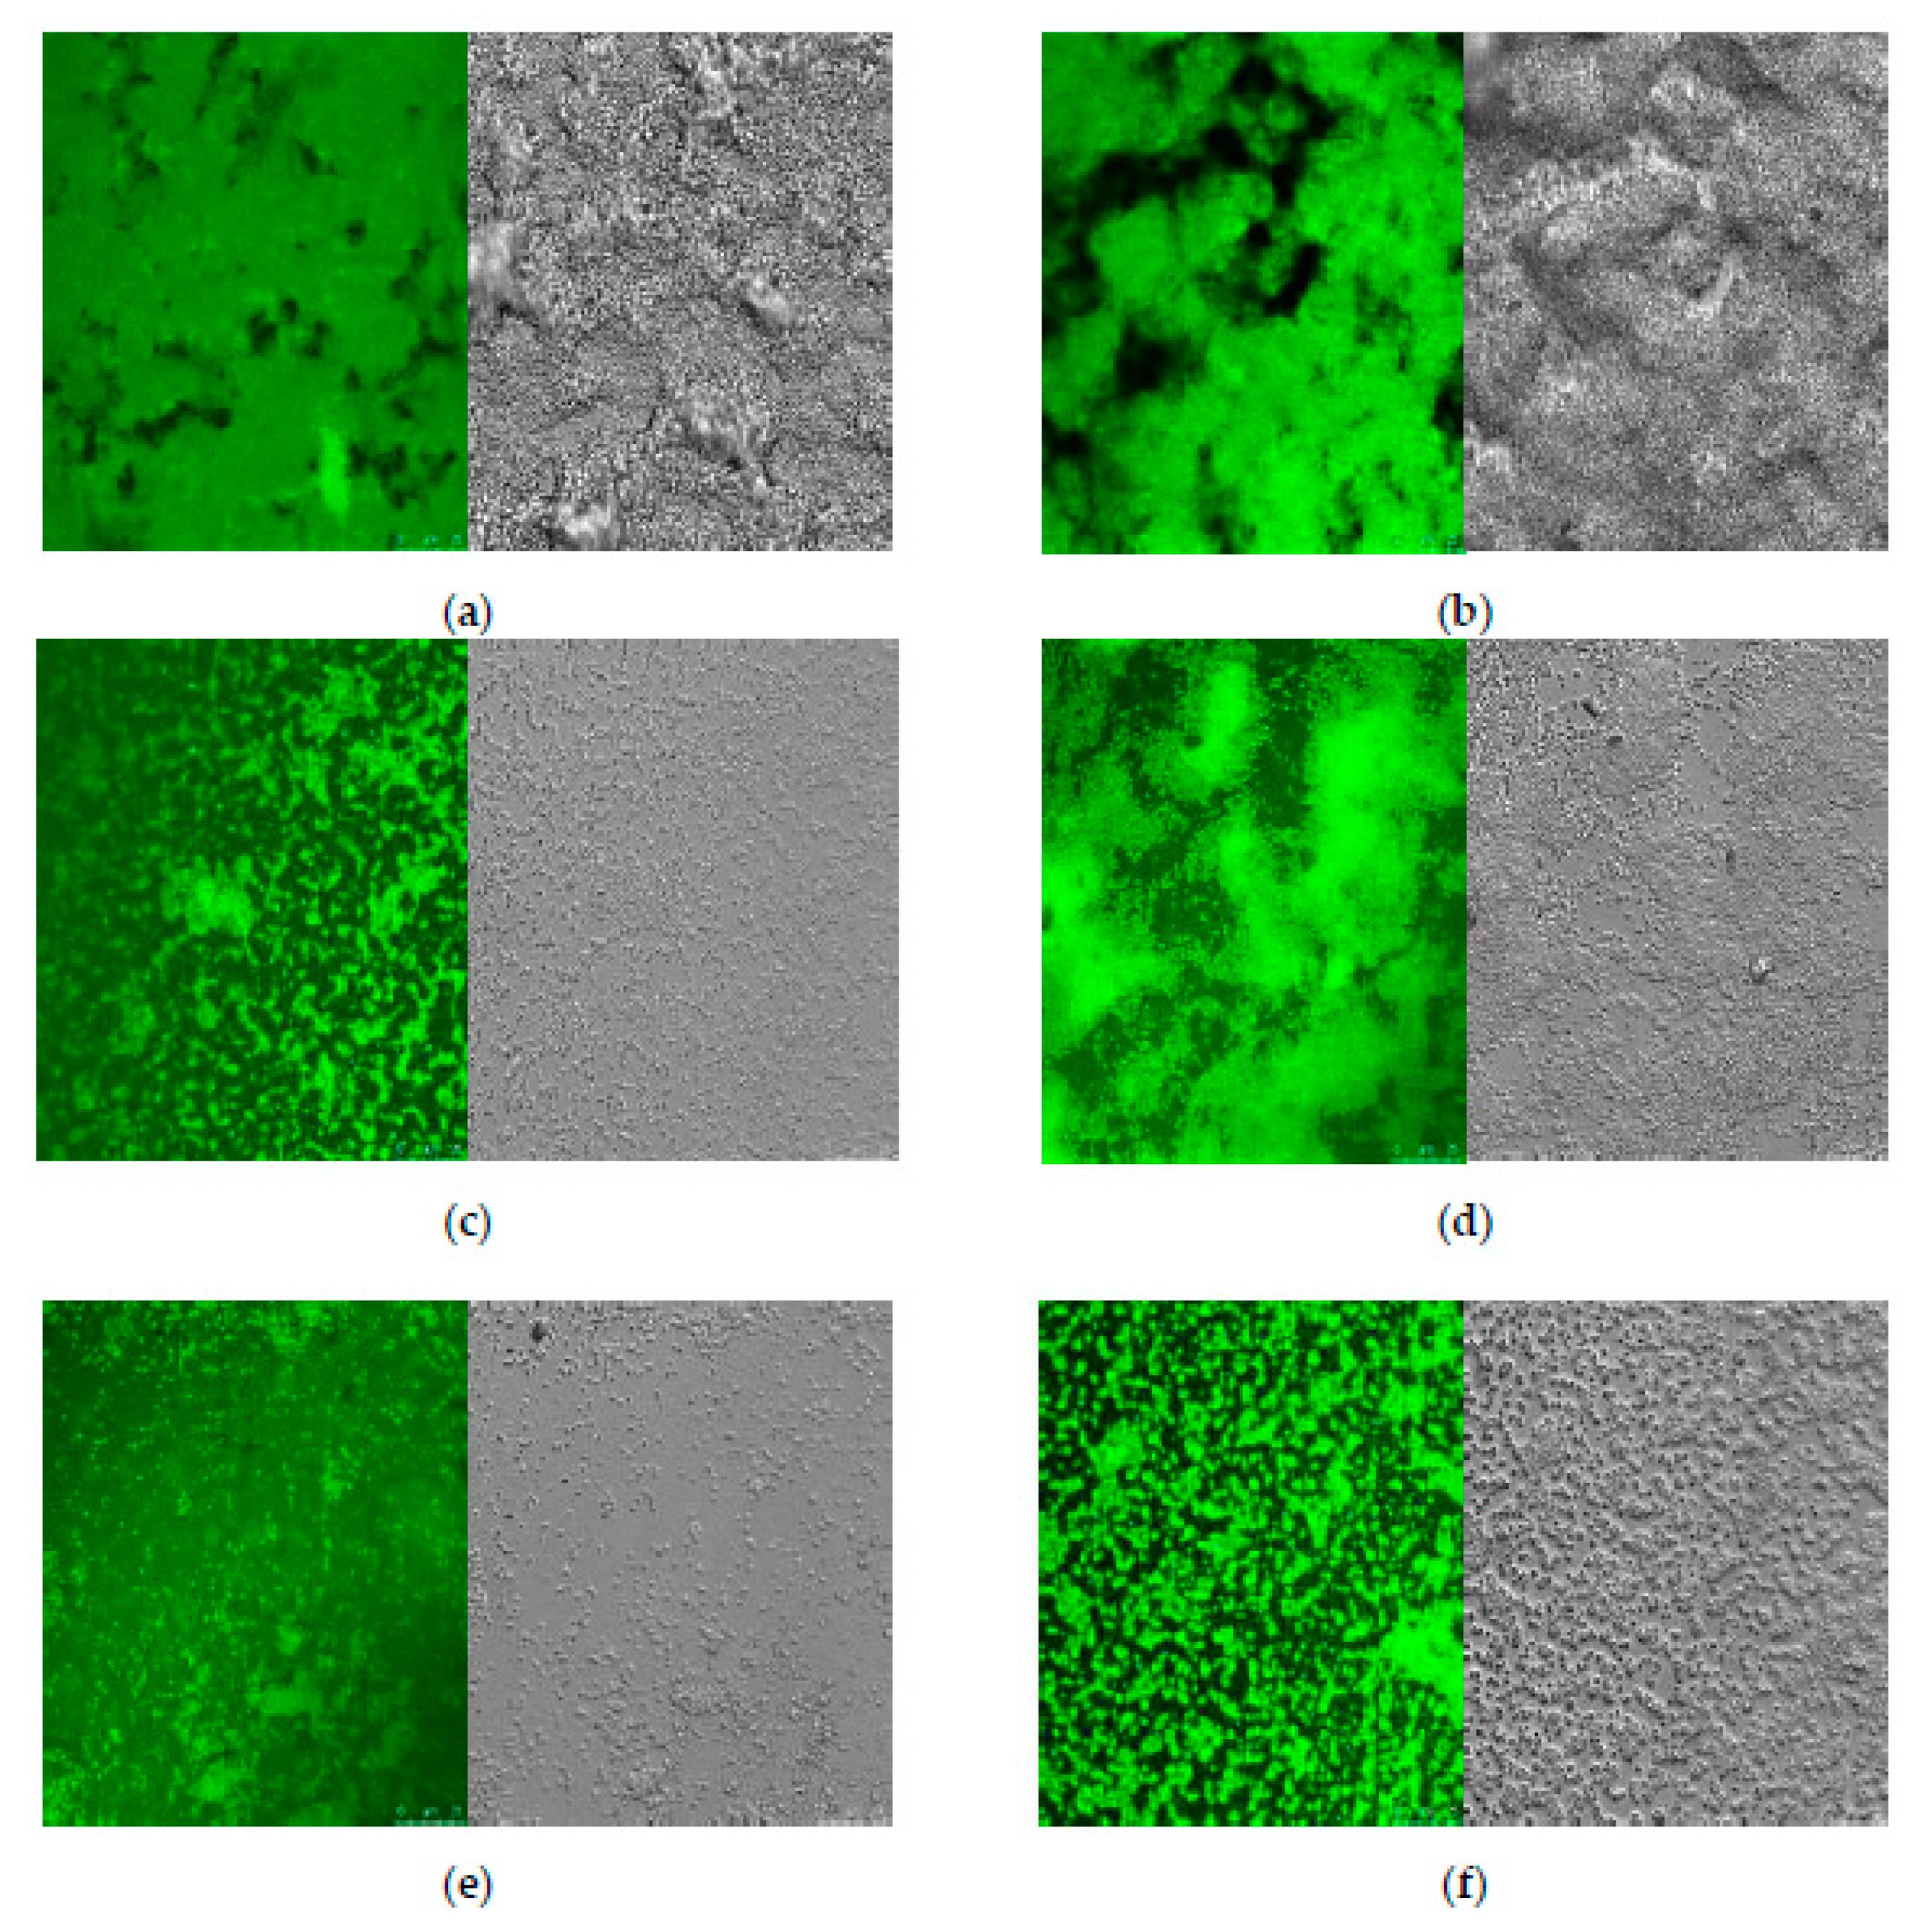
3.3. Microscopic Observations of S. aureus Biofilm

Direct visual information, including the surface coverage and thickness of S. aureus biofilms, were obtained by CLSM analyses. As shown in Figure 3a,b, S. aureus formed thick and compact biofilms covering the surface of glass coverslips at 25 and 37 °C when grown in the absence of naringenin. The confocal stack images show that the thick coating of S. aureus biofilms represented by cell aggregations became thinner and looser on the surfaces in the presence of 20 mg/L naringenin (Figure 3d). At 40 mg/L of naringenin, there was a visible reduction in the numbers of microcolonies for S. aureus cells grown at 37 °C (Figure 3f). Compared to 37 °C, the cells grown at 25 °C had a more obvious decrease associated with naringenin exposure, and the bacterial density was significantly decreased (Figure 3c,e). These results were further confirmed by SEM images.
The SEM images show that naringenin inhibited the bacterial growth of S. aureus at subminimum inhibitory concentrations (sub-MICs) values of 0, 20 and 40 mg/L. As the concentration of naringenin increases, the total number of bacteria obviously decreased, especially at high concentrations (Figure 4e,f) [17]. Compared to the incubation temperature of 37 °C (Figure 4b,d,f), the total number of S. aureus cultivated at 25 °C (Figure 4a,c,e) showed a greater decrease, demonstrating that naringenin has a significant effect in suppressing the biofilm formation of bacteria.

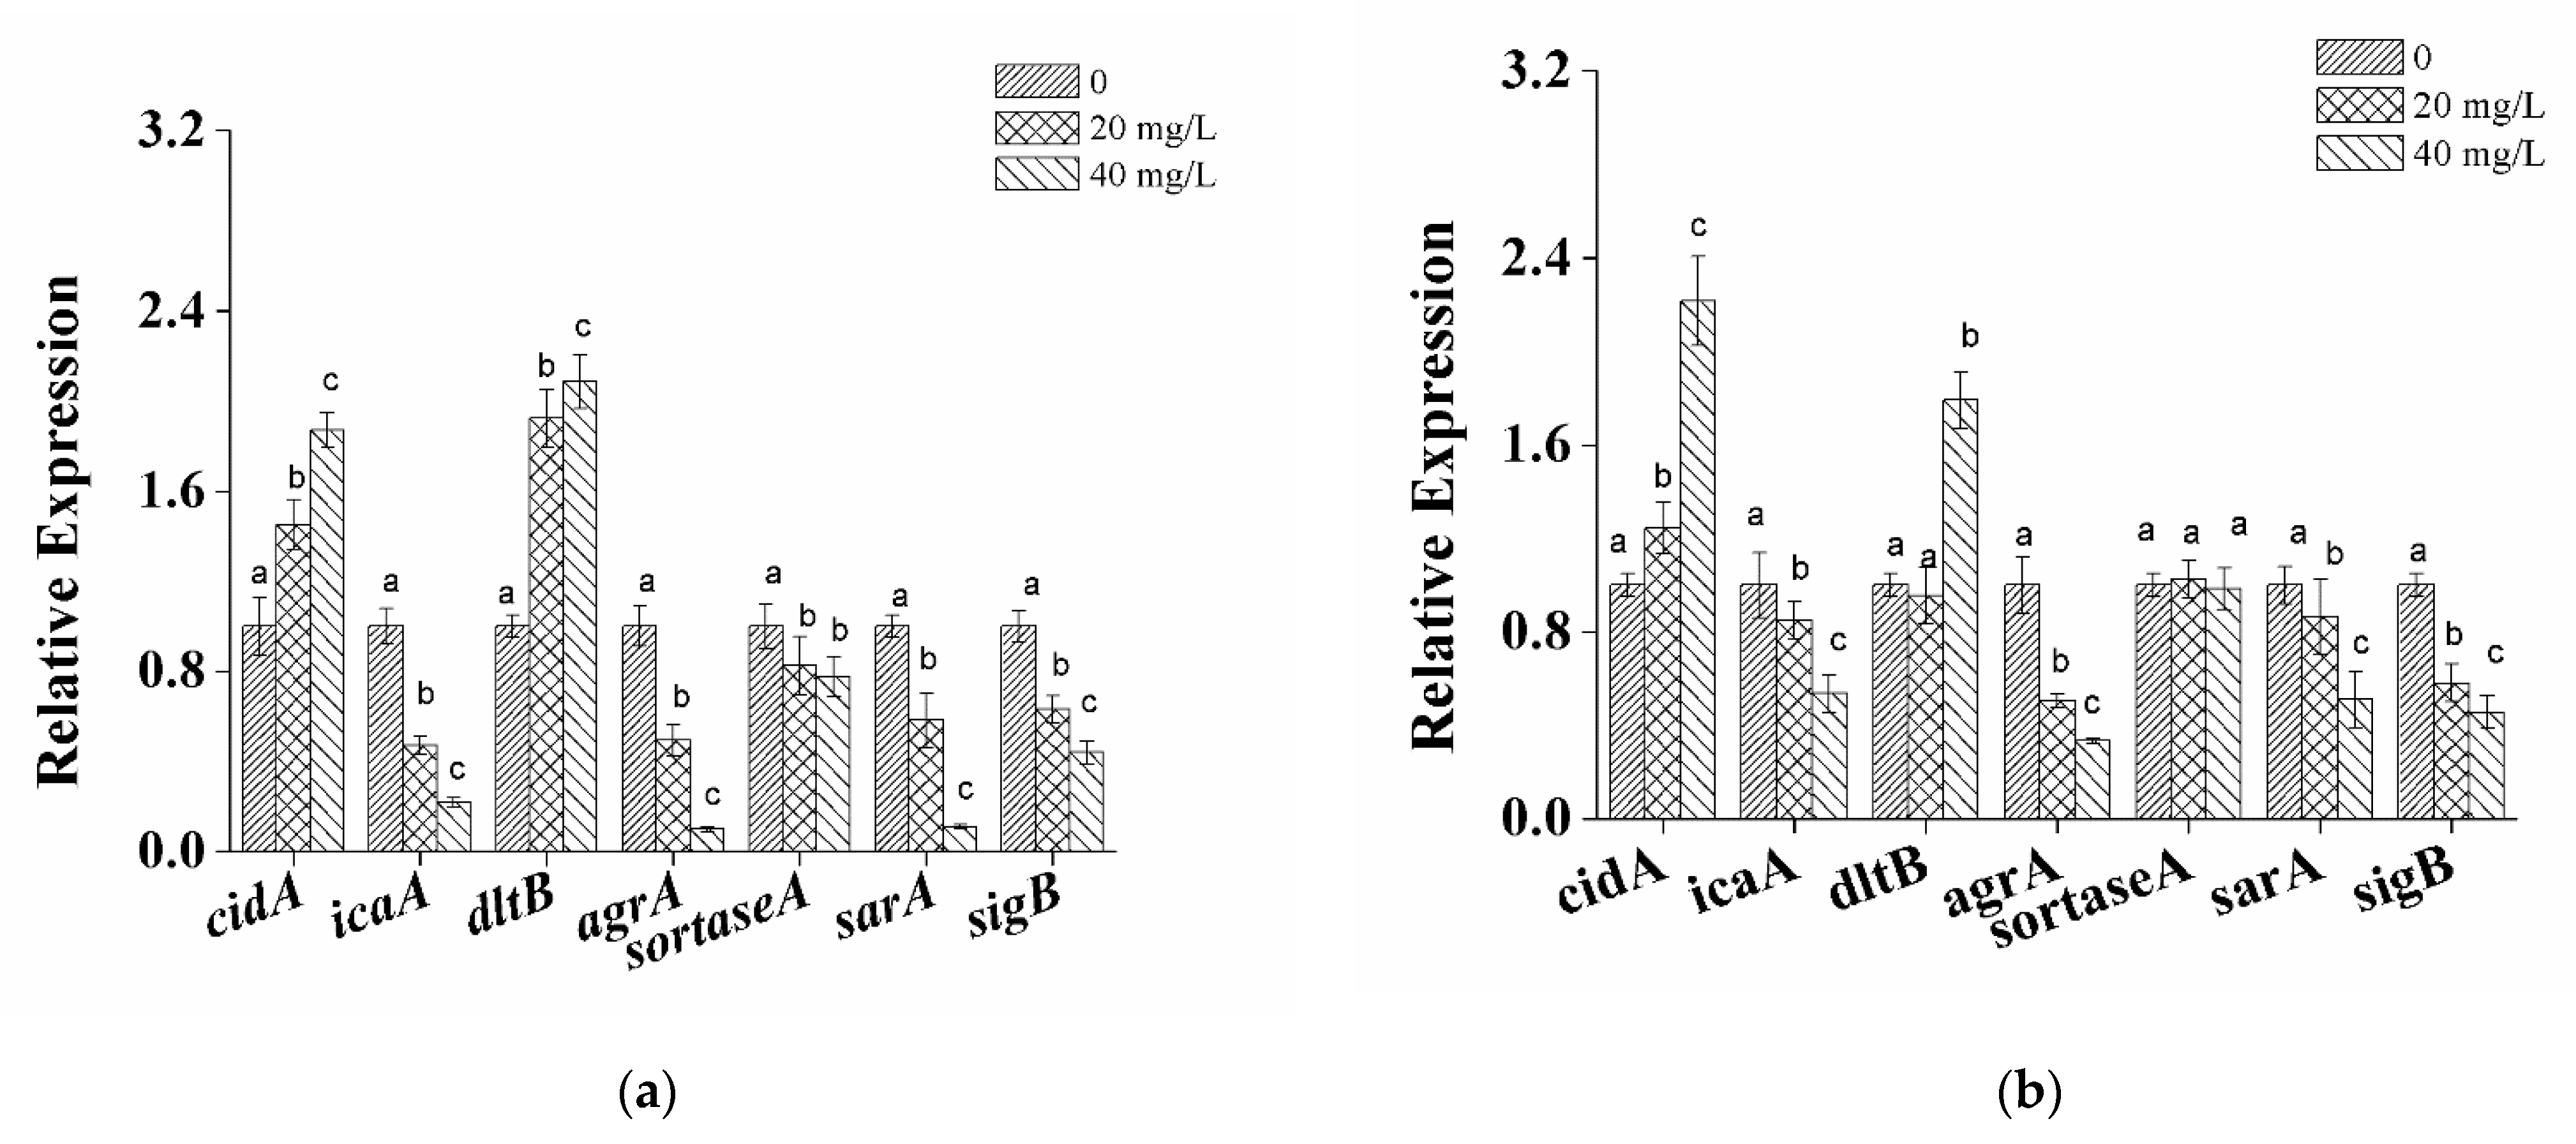
3.4. Transcriptional Analysis of Biofilm-Related Genes in S. aureus Cells

The effect of naringenin on the level of expression of biofilm-related genes, including cidA, icaA, dltB, agrA, sortaseA, sarA and sigma factor sigB in S. aureus cells, were studied by RT-qPCR. Among the seven tested genes, icaA, agrA, sarA and sigB demonstrated significantly down-regulated (p < 0.05) gene expression when treated with naringenin, while cidA and dltB were up-regulated. Specifically, icaA, agrA, sarA and sigB were significantly down-regulated (p < 0.05) by 0.47-, 0.49, 0.58- and 0.63-fold for S. aureus grown at 25 °C in a culture medium with 20 mg/L naringenin (Figure 5a), and further decreased by 0.22-, 0.10-, 0.11- and 0.44-fold after the concentration of naringenin was increased to 40 mg/L, respectively. Under the same conditions, the expression of cidA and dltB were mildly up-regulated by 1.29- and 2.08-fold when S. aureus cells were exposed to naringenin at 40 mg/L. The expression of genes, including cidA, dltB, icaA, agrA, sarA and sigB, exhibited a similar trend for S. aureus cells cultivated at 37 °C (Figure 5b).
By contrast, the levels of sortaseA expression in S. aureus cells grown at 25 °C were down-regulated in the presence of naringenin at concentrations of 20 and 40 mg/L, exhibiting 0.82- and 0.78-fold decreases (p < 0.05), respectively. At 37 °C, naringenin had no obvious effect on the transcription level of the studied sortaseA genes.

4. Discussion

In this work, no significant inhibitory effect of naringenin on S. aureus biofilm formation at 25 and 37 °C was found. However, the growth rate of S. aureus at 25 °C was significantly lower than that at 37 °C, without the final biomass being affected. Thus, different incubation times, i.e., 48 and 12 h, were used for 25 and 37 °C, respectively, to compensate for variations in the time required to reach the stationary phase. At subminimum inhibitory concentrations (sub-MICs) values ranging from 5 to 60 mg/L, naringenin dramatically inhibited S. aureus biofilm formation, with the biofilm formation further decreasing as the concentrations of naringenin with increased. Compared to an incubation temperature of 37 °C, the presence of naringenin resulted in a more significant effect on S. aureus biofilm formation for cultivation at 25 °C. There are various incubation temperatures that affect the growth of S. aureus and a series of changes caused by differences in subsequent growth.
Cell surface hydrophobicity is an important physical-chemical property of bacteria that facilitates their attachment to surfaces. Previously, it was reported that bacterial adherence of oral streptococci to the tooth surface was significantly suppressed by the reduction in cell surface hydrophobicity after treatment with constituents in cranberry juice and tea extract polyphenols [23,24]. Our results indicated that the cell surface hydrophobicity of S. aureus is reduced by treatment with naringenin (Figure 2a).
EPS is also important for biofilm production, forming multiple layers that help pathogens to adhere to surfaces and maintain biofilm architecture and acting as a protective barrier to prevent the entry of antibacterial agents into bacterial cells [25,26]. Therefore, the substantial decrease in EPS production by S. aureus after treatment with naringenin (Figure 2b) is consistent with this scenario. Since EPS production and surface hydrophobicity are important factors for biofilm formation, the decreases in these two properties following treatment with naringenin are the likely reasons that naringenin decreases biofilm formation in S. aureus cells.
Naringenin is not an antibiotic and, thus, the results obtained from CLSM and SEM are inconsistent with some previous studies that have reported that low concentrations of β-lactam and aminoglycoside antibiotics often facilitate biofilm formation by bacteria [27,28]. However, the inhibition of biofilm formation by naringenin is in agreement with the behavior of other flavonoids, including morin, rutin, quercetin and phloretin [25,29,30,31]. Notably, naringenin has a better effect on inhibiting the formation biofilms of S. aureus at the incubation temperature at 25 than at 37 °C.
To elucidate the underlying molecular mechanism for the inhibition of S. aureus biofilm by naringenin, we investigated the expression of some biofilm-related genes using RT-qPCR, including dltB, sarA, sortaseA, agrA, icaA, cidA and sigB. The dltB gene is responsible for D-alanylation of teichoic acids and the translocation of D-alanine through the cell membrane. It has been previously reported that dltB deficiency results in a higher negative net charge on the bacterial cell surface and defects in the initial binding of bacteria to a surface in the process of biofilm formation [32]. The expression of cidA was reported to be associated with extracellular DNA release, which is essential in the formation of S. aureus biofilm [33]. Our results revealed that the dltB and cidA genes are mildly up-regulated in S. aureus cells exposed to naringenin at 25 and 37 °C. Thus, it can be inferred that the suppression of biofilm formation by naringenin is probably not through dltB and cidA in S. aureus.
By contrast, the icaA, agrA and sarA genes are down-regulated in the presence of naringenin. The ica operons encode enzymes involved in the biosynthesis of polysaccharide intercellular adhesion [34]. Since it is well-known that the ability of S. aureus to form biofilm is dependent on polysaccharide intercellular adhesion, down-regulation of icaA likely decreases the production of polysaccharide intercellular adhesion, leading to reduction of biofilm formation. Thus, the decreased expression of icaA by naringenin might lead to a reduction in the biosynthesis of polysaccharide intercellular adhesion, which hinders the attachment of S. aureus cells to solid surfaces and subsequent biofilm formation. Both the agr (accessory gene regulator) and sar (staphylococcal accessory regulator) operons are two regulatory elements that control the production of virulence factors, as well mediate S. aureus biofilm formation by regulating the quorum sensing and polysaccharide intercellular adhesion production [35]. Thus, it can also be inferred that the down-regulated gene expression of agrA and sarA negatively affects biofilm formation by S. aureus. These data are in agreement with previous studies showing that agr down regulation has a negative impact on biofilm development by S. aureus [33,36].
Additionally, the expression levels of sigB were reduced for S. aureus cells exposed to naringenin. sigB is an alternative sigma factor modulating various stress responses in several Gram-positive bacteria, including S. aureus via a large regulon [37]. Overexpression of these genes can confer more resistance to heat, oxidative and antibiotic stresses. In summary, down-regulating the above genes may be the mechanism of action by which naringenin inhibits biofilm formation.
In some Gram-positive bacteria, including staphylococci, enterococci and streptococci, the sortaseA gene is responsible for coding a membrane enzyme that plays an important role in grappling some surface-exposed proteins to the cell wall envelope [38]. Recent reports have shown that sortaseA upregulation significantly increases the levels of biofilm formation in staphylococcal strains [39]. Our results show a mild down-regulation of sortaseA in the presence of naringenin for S. aureus grown at 25 °C. By contrast, at 37 °C no obvious change in the transcription level of sortaseA was observed. Since adhesion to the surface is an essential step for biofilm formation, the larger decrease in biofilm formation observed in S. aureus cultivated at 25 °C may be attributed to the down-regulated expression of sortaseA in S. aureus cells exposed to naringenin.

5. Conclusions

The data from our investigation indicates the potential of naringenin as a natural agent to prevent biofilm formation of S. aureus and possibly reduce health risks related to biofilm-formation in the food industry. However, more studies are necessary to gain a better understanding whether of there is any anti-biofilm activity toward other food-borne pathogens in food industry, and the efficiency when considering stainless steel and plastic surface.

Author Contributions

Conceptualization and methodology, Q.-H.W. and R.W.; software, data curation and formal analysis, Q.-H.W. and S.-Q.Z.; writing—original draft preparation, Q.-H.W. and R.W.; writing—review and editing, S.-Q.Z.; visualization, B.-R.C.; supervision, X.-A.Z.; funding acquisition, X.-A.Z. All authors have read and agreed to the published version of the manuscript.

Funding

This work was supported by the S&T projects of Guangdong Province (2019B020212004) and the 111 Project (B17018).

Institutional Review Board Statement

Not applicable.

Informed Consent Statement

Not applicable.

Data Availability Statement

Not applicable.

Conflicts of Interest

The authors declare no conflict of interest.

References

  1. Normanno, G.; La, S.G.; Dambrosio, A.; Quaglia, N.C.; Corrente, M.; Parisi, A.; Santagada, G.; Firinu, A.; Crisetti, E.; Celano, G.V. Occurrence, characterization and antimicrobial resistance of enterotoxigenic Staphylococcus aureus isolated from meat and dairy products. Int. J. Food Microbiol. 2007, 115, 290–296. [Google Scholar] [CrossRef]
  2. Tango, C.N.; Akkermans, S.; Hussain, M.S.; Khan, I.; Van Impe, J.; Jin, Y.-G.; Oh, D.H. Modeling the effect of pH, water activity, and ethanol concentration on biofilm formation of Staphylococcus aureus. Food Microbiol. 2018, 76, 287–295. [Google Scholar] [CrossRef] [PubMed]
  3. Lauková, A.; Pogány Simonová, M.; Focková, V.; Kološta, M.; Tomáška, M.; Dvorožňáková, E. Susceptibility to Bacteriocins in Biofilm-Forming, Variable Staphylococci Isolated from Local Slovak Ewes’ Milk Lump Cheeses. Foods 2020, 9, 1335. [Google Scholar] [CrossRef]
  4. Vasudevan, P.; Nair, M.; Annamalai, T.; Venkitanarayanan, K.S. Phenotypic and genotypic characterization of bovine mastitis isolates of Staphylococcus aureus for biofilm formation. Vet. Microbiol. 2003, 92, 179–185. [Google Scholar] [CrossRef]
  5. Kroning, I.S.; Iglesias, M.A.; Sehn, C.P.; Gandra, T.K.V.; Mata, M.M.; da Silva, W.P. Staphylococcus aureus isolated from handmade sweets: Biofilm formation, enterotoxigenicity and antimicrobial resistance. Food Microbiol. 2016, 58, 105–111. [Google Scholar] [CrossRef]
  6. Kruk, M.; Trząskowska, M. Analysis of Biofilm Formation on the Surface of Organic Mung Bean Seeds, Sprouts and in the Germination Environment. Foods 2021, 10, 542. [Google Scholar] [CrossRef] [PubMed]
  7. Ciccio, P.D.; Vergara, A.; Festino, A.R.; Paludi, D.; Zanardi, E.; Ghidini, S.; Ianieri, A. Biofilm formation by Staphylococcus aureus on food contact surfaces: Relationship with temperature and cell surface hydrophobicity. Food Control 2015, 50, 930–936. [Google Scholar] [CrossRef]
  8. Abdallah, M.; Chataigne, G.; Ferreira-Theret, P.; Benoliel, C.; Drider, D.; Dhulster, P.; Chihib, N.E. Effect of growth temperature, surface type and incubation time on the resistance of Staphylococcus aureus biofilms to disinfectants. Appl. Microbiol. Biotechnol. 2014, 98, 2597–2607. [Google Scholar] [CrossRef] [PubMed]
  9. Mandalari, G.; Bennett, R.; Bisignano, G.; Trombetta, D.; Saija, A.; Faulds, C.; Gasson, M.; Narbad, A. Antimicrobial activity of flavonoids extracted from bergamot (Citrus bergamia Risso) peel, a byproduct of the essential oil industry. J. Appl. Microbiol. 2007, 103, 2056–2064. [Google Scholar] [CrossRef]
  10. Wen, Q.-H.; Wang, L.-H.; Zeng, X.-A.; Niu, D.-B.; Wang, M.-S. Hydroxyl-related differences for three dietary flavonoids as inhibitors of human purine nucleoside phosphorylase. Int. J. Biol. Macromol. 2018, 118, 588–598. [Google Scholar] [CrossRef]
  11. Erlund, I.; Meririnne, E.; Alfthan, G.; Aro, A. Plasma kinetics and urinary excretion of the flavanones naringenin and hesperetin in humans after ingestion of orange juice and grapefruit juice. J. Nutr. 2001, 131, 235–241. [Google Scholar] [CrossRef]
  12. Hashimoto, T.; Ide, T. Activity and mRNA Levels of Enzymes Involved in Hepatic Fatty Acid Synthesis in Rats Fed Naringenin. J. Agric. Food Chem. 2015, 63, 9536–9542. [Google Scholar] [CrossRef]
  13. Kanaze, F.I.; Kokkalou, E.; Georgarakis, M.; Niopas, I. A validated solid-phase extraction HPLC method for the simultaneous determination of the citrus flavanone aglycones hesperetin and naringenin in urine. J. Pharm. Biomed. Anal. 2004, 36, 175–181. [Google Scholar] [CrossRef]
  14. Denny, S.; West, P.W.J.; Mathew, T.C. Antagonistic interactions between the flavonoids hesperetin and naringenin and β-lactam antibiotics against Staphylococcus aureus. Br. J. Biomed. Sci. 2008, 65, 145–147. [Google Scholar] [CrossRef]
  15. Lee, K.-A.; Moon, S.H.; Kim, K.-T.; Mendonca, A.F.; Paik, H.-D. Antimicrobial effects of various flavonoids on Escherichia coli O157: H7 cell growth and lipopolysaccharide production. Food Sci. Biotechnol. 2010, 19, 257–261. [Google Scholar] [CrossRef]
  16. Vikram, A.; Jayaprakasha, G.K.; Jesudhasan, P.; Pillai, S.; Patil, B. Suppression of bacterial cell–cell signalling, biofilm formation and type III secretion system by citrus flavonoids. J. Appl. Microbiol. 2010, 109, 515–527. [Google Scholar] [CrossRef] [PubMed]
  17. Yue, J.; Yang, H.; Liu, S.; Song, F.; Guo, J.; Huang, C. Influence of naringenin on the biofilm formation of Streptococcus mutans. J. Dent. 2018, 76, 24–31. [Google Scholar] [CrossRef] [PubMed]
  18. Wang, L.H.; Wang, M.S.; Zeng, X.A.; Xu, X.M.; Brennan, C.S. Membrane and genomic DNA dual-targeting of citrus flavonoid naringenin against Staphylococcus aureus. Integr. Biol. 2017, 9, 820–829. [Google Scholar] [CrossRef]
  19. Lee, J.H.; Kim, Y.G.; Lee, K.; Kim, S.C.; Lee, J. Temperature-dependent control of Staphylococcus aureus biofilms and virulence by thermoresponsive oligo (N-vinylcaprolactam). Biotechnol. Bioeng. 2015, 112, 716–724. [Google Scholar] [CrossRef]
  20. Hsu, L.C.; Fang, J.; Borcatasciuc, D.A.; Worobo, R.W.; Moraru, C.I. Effect of Micro- and Nanoscale Topography on the Adhesion of Bacterial Cells to Solid Surfaces. Appl. Environ. Microbiol. 2013, 79, 2703–2712. [Google Scholar] [CrossRef] [Green Version]
  21. Dubois, M.; Gilles, K.A.; Hamilton, J.K.; Rebers, P.A.; Smith, F. Colorimetric Method for Determination of Sugars and Related Substances. Anal. Chem. 1956, 28, 350–356. [Google Scholar] [CrossRef]
  22. Wang, L.H.; Zeng, X.A.; Wang, M.S.; Brennan, C.S.; Gong, D. Modification of membrane properties and fatty acids biosynthesis-related genes in Escherichia coli and Staphylococcus aureus: Implications for the antibacterial mechanism of naringenin. Biochim. Et Biophys. Acta (BBA)-Biomembr. 2018, 1860, 481–490. [Google Scholar] [CrossRef] [PubMed]
  23. Matsumoto, M.; Minami, T.; Sasaki, H.; Sobue, S.; Hamada, S.; Ooshima, T. Inhibitory effects of oolong tea extract on caries–inducing properties of Mutans streptococci. Caries Res. 1999, 33, 441–445. [Google Scholar] [CrossRef] [PubMed]
  24. Yamanaka, A.; Kimizuka, R.; Kato, T.; Okuda, K. Inhibitory effects of cranberry juice on attachment of oral streptococci and biofilm formation. Oral Microbiol. Immunol. 2004, 19, 150–154. [Google Scholar] [CrossRef]
  25. Al-Shabib, N.A.; Husain, F.M.; Ahmad, I.; Khan, M.S.; Khan, R.A.; Khan, J.M. Rutin inhibits mono and multi-species biofilm formation by foodborne drug resistant Escherichia coli and Staphylococcus aureus. Food Control 2017, 79, 325–332. [Google Scholar] [CrossRef]
  26. Xiang, H.; Cao, F.; Ming, D.; Zheng, Y.; Dong, X.; Zhong, X.; Mu, D.; Li, B.; Zhong, L.; Cao, J. Aloe-emodin inhibits Staphylococcus aureus biofilms and extracellular protein production at the initial adhesion stage of biofilm development. Appl. Microbiol. Biotechnol. 2017, 101, 6671–6681. [Google Scholar] [CrossRef]
  27. Hoffman, L.R.; D’Argenio, D.A.; MacCoss, M.J.; Zhang, Z.; Jones, R.A.; Miller, S.I. Aminoglycoside antibiotics induce bacterial biofilm formation. Nature 2005, 436, 1171–1175. [Google Scholar] [CrossRef]
  28. Kaplan, J.B.; Izano, E.A.; Gopal, P.; Karwacki, M.T.; Kim, S.; Bose, J.L.; Bayles, K.W.; Horswill, A.R. Low Levels of β-Lactam Antibiotics Induce Extracellular DNA Release and Biofilm Formation in Staphylococcus aureus. Mbio 2012, 3, e00198-12. [Google Scholar] [CrossRef] [PubMed] [Green Version]
  29. Lee, J.H.; Regmi, S.C.; Kim, J.A.; Cho, M.H.; Yun, H.; Lee, C.S.; Lee, J. Apple Flavonoid Phloretin Inhibits Escherichia coli O157:H7 Biofilm Formation and Ameliorates Colon Inflammation in Rats. Infect. Immun. 2011, 79, 4819–4827. [Google Scholar] [CrossRef] [Green Version]
  30. Gopu, V.; Meena, C.K.; Shetty, P.H. Quercetin influences quorum sensing in food borne bacteria: In-vitro and in-silico evidence. PLoS ONE 2015, 10, e0134684. [Google Scholar] [CrossRef] [Green Version]
  31. Sivaranjani, M.; Gowrishankar, S.; Kamaladevi, A.; Pandian, S.K.; Balamurugan, K.; Ravi, A.V. Morin inhibits biofilm production and reduces the virulence of Listeria monocytogenes—An in vitro and in vivo approach. Int. J. Food Microbiol. 2016, 237, 73–82. [Google Scholar] [CrossRef] [PubMed]
  32. Peschel, A.; Otto, M.; Jack, R.W.; Kalbacher, H.; Jung, G.; Götz, F. Inactivation of the dlt Operon in Staphylococcus aureus Confers Sensitivity to Defensins, Protegrins, and Other Antimicrobial Peptides. J. Biol. Chem. 1999, 274, 8405–8410. [Google Scholar] [CrossRef] [Green Version]
  33. Yan, X.; Gu, S.; Shi, Y.; Cui, X.; Wen, S.; Ge, J. The effect of emodin on Staphylococcus aureus strains in planktonic form and biofilm formation in vitro. Arch. Microbiol. 2017, 199, 1267–1275. [Google Scholar] [CrossRef]
  34. Ma, Y.; Xu, Y.; Yestrepsky, B.D.; Sorenson, R.J.; Chen, M.; Larsen, S.D.; Sun, H. Novel inhibitors of Staphylococcus aureus virulence gene expression and biofilm formation. PLoS ONE 2012, 7, e47255. [Google Scholar] [CrossRef] [Green Version]
  35. Pratten, J.; Foster, S.J.; Chan, P.F.; Wilson, M.; Nair, S.P. Staphylococcus aureus accessory regulators: Expression within biofilms and effect on adhesion. Microbes Infect. 2001, 3, 633–637. [Google Scholar] [CrossRef]
  36. Coelho, L.R.; Souza, R.R.; Ferreira, F.A.; Guimaraes, M.A.; Ferreira-Carvalho, B.T.; Figueiredo, A. agr RNAIII divergently regulates glucose-induced biofilm formation in clinical isolates of Staphylococcus aureus. Microbiology 2008, 154, 3480–3490. [Google Scholar] [CrossRef] [PubMed] [Green Version]
  37. Valle, J.; Toledo-Arana, A.; Berasain, C.; Ghigo, J.M.; Amorena, B.; Penadés, J.R.; Lasa, I. SarA and not σB is essential for biofilm development by Staphylococcus aureus. Mol. Microbiol. 2003, 48, 1075–1087. [Google Scholar] [CrossRef] [PubMed]
  38. Hu, P.; Huang, P.; Chen, M.W. Curcumin reduces Streptococcus mutans biofilm formation by inhibiting sortase A activity. Arch. Oral Biol. 2013, 58, 1343–1348. [Google Scholar] [CrossRef]
  39. Cascioferro, S.; Totsika, M.; Schillaci, D. Sortase A: An ideal target for anti-virulence drug development. Microb. Pathog. 2014, 77, 105–112. [Google Scholar] [CrossRef] [Green Version]
Figure 1. Cell growth of S. aureus in the presence of naringenin (0~60 mg/mL) was measured at OD600 nm in 96-well plates at 25 °C (a) or 37 °C (c). Biofilm formations of S. aureus with naringenin concentration of 0~60 mg/mL at 25 °C (b) or 37 °C (d) for 48 and 12 h in 96-well plates, respectively. Biofilm OD values are processed as mean ± SD and a–g indicate significant differences between different columns (p < 0.05).
Foods 10 02614 g001
Figure 2. Effects of naringenin in the concentrations of 0, 20 and 40 mg/L on cell surface hydrophobicity (a) and EPS production (b) of S. aureus. Values are mean ± SD and there are significant differences between the values of columns marked with different letters (a–d) and (A–D), as indicated (p < 0.05).
Foods 10 02614 g002
Figure 3. Confocal laser scanning microscopy (CLSM) analysis of biofilms formed by S. aureus incubated with different concentrations of naringenin. (a,c,e) for S. aureus cells were grown at 25 °C with naringenin at 0, 20 and 40 mg/L, respectively; (b,d,f) for S. aureus cells were grown at 37 °C with naringenin at 0, 20 and 40 mg/L, respectively.
Foods 10 02614 g003
Figure 4. SEM images showing inhibitory activity of naringenin on biofilm formation of S. aureus cells. (a,c,e) for S. aureus cells grown at 25 °C with naringenin at 0, 20 and 40 mg/L, respectively; (b,d,f) for S. aureus cells grown at 37 °C with naringenin at 0, 20 and 40 mg/L, respectively.
Foods 10 02614 g004
Figure 5. Effect of naringenin on the expression levels of biofilm-related genes in S. aureus at 25 °C (a) and 37 °C (b), where 16S rRNA was used as a reference gene. Data are presented as means ± standard deviations. Relative expression values are processed as mean ± SD and a–c indicate significant differences between different columns (p < 0.05).
Foods 10 02614 g005
Publisher’s Note: MDPI stays neutral with regard to jurisdictional claims in published maps and institutional affiliations.

