
Comparison of the Proximate Composition and Nutritional Profile of Byproducts and Edible Parts of Five Species of Shrimp

 ,
, 
Abstract
:
1. Introduction
2. Materials and Methods
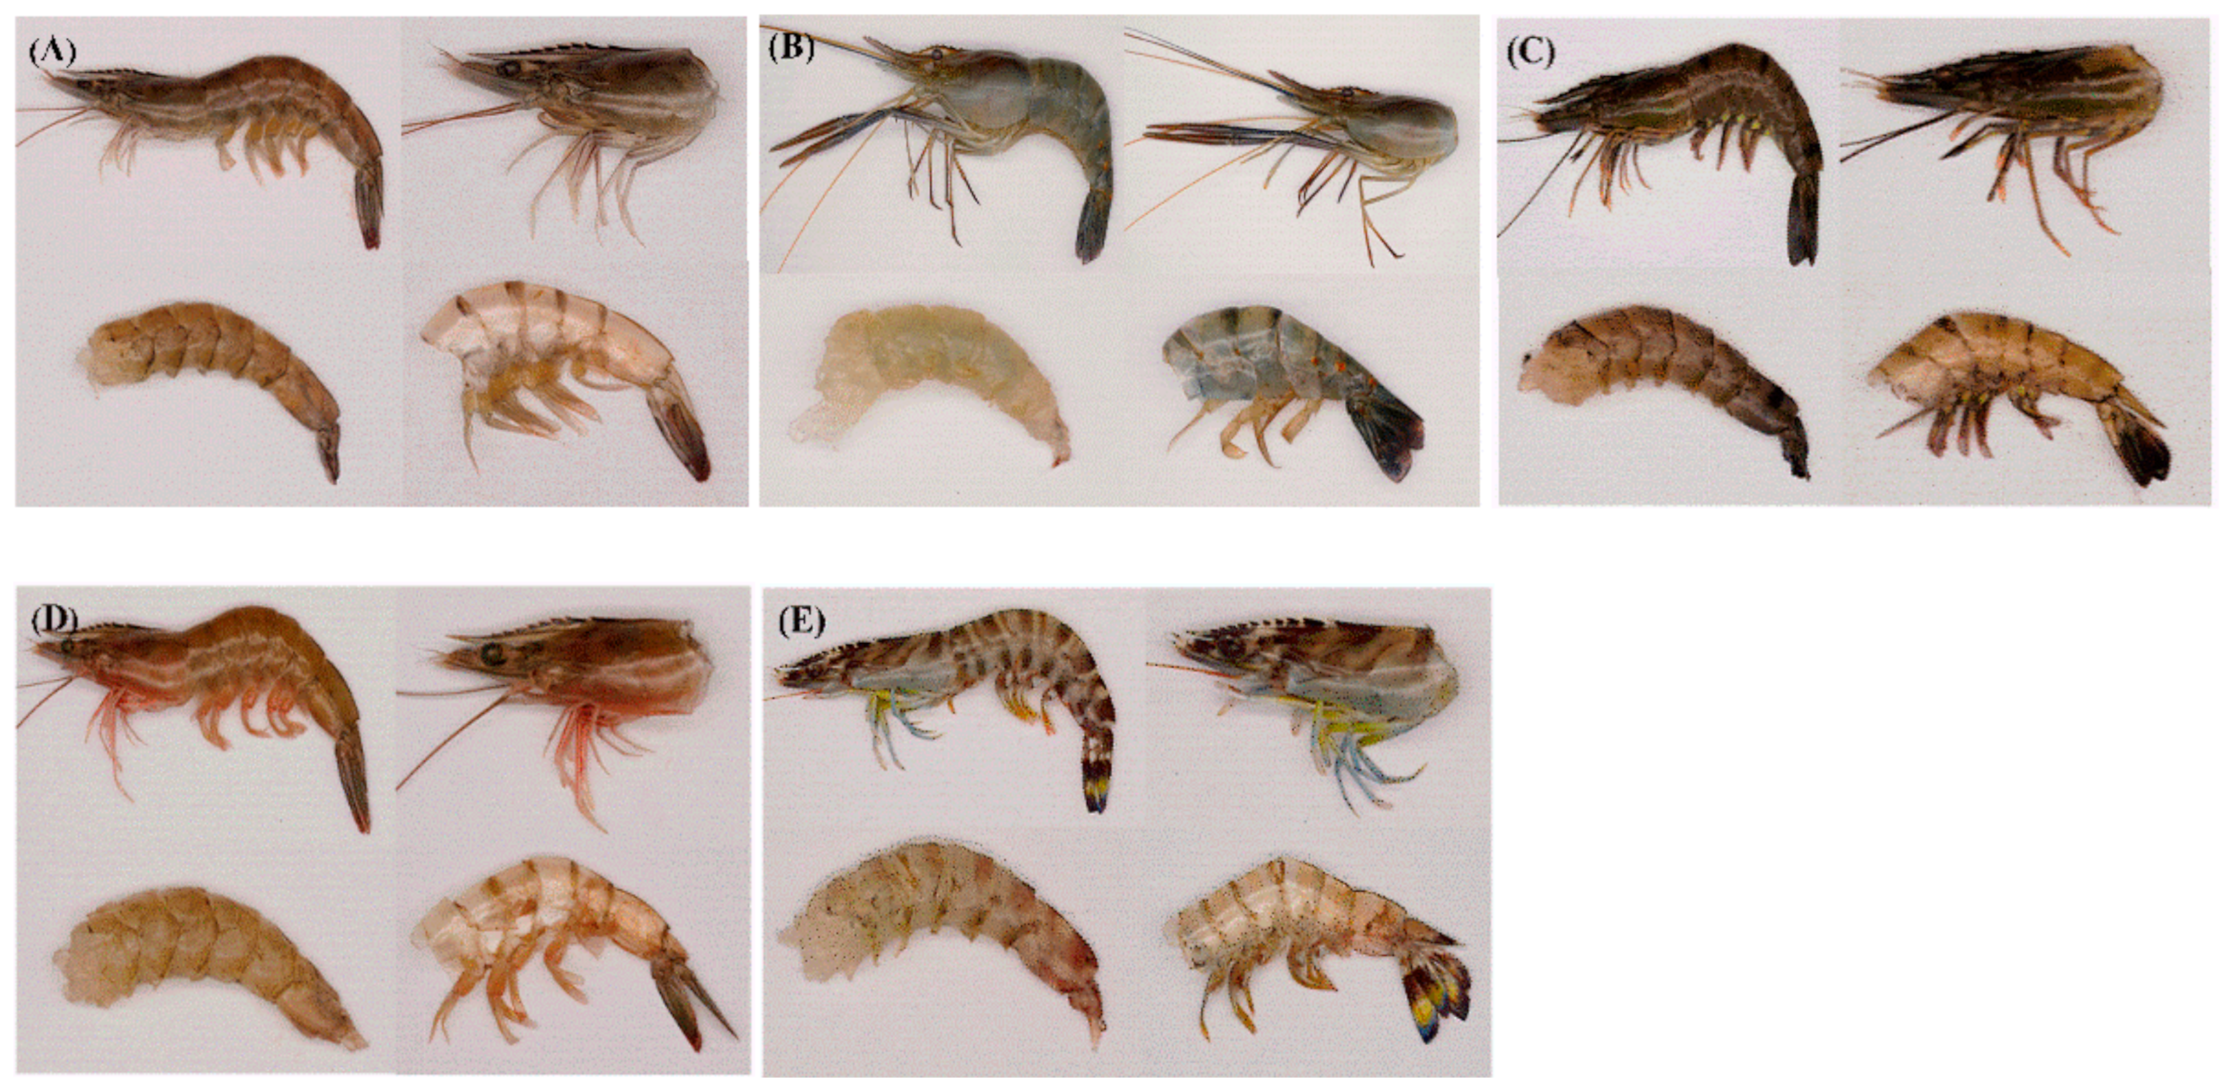
2.1. Materials
2.2. Determination of Proximate Components
2.3. Determination of Amino Acids
2.4. Determination of Fatty Acids
2.5. Determination of Minerals
2.6. Determination of Astaxanthin
2.7. Statistical Analysis
3. Results
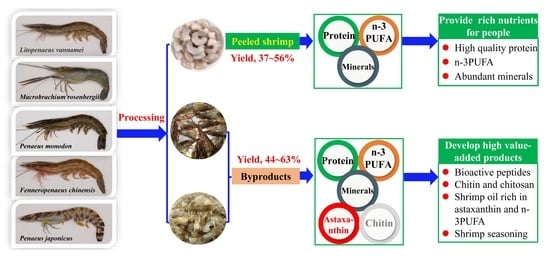
3.1. Yield
3.2. Proximate Components
3.3. Amino Acid Composition
3.4. Fatty Acid Profile
3.5. Minerals
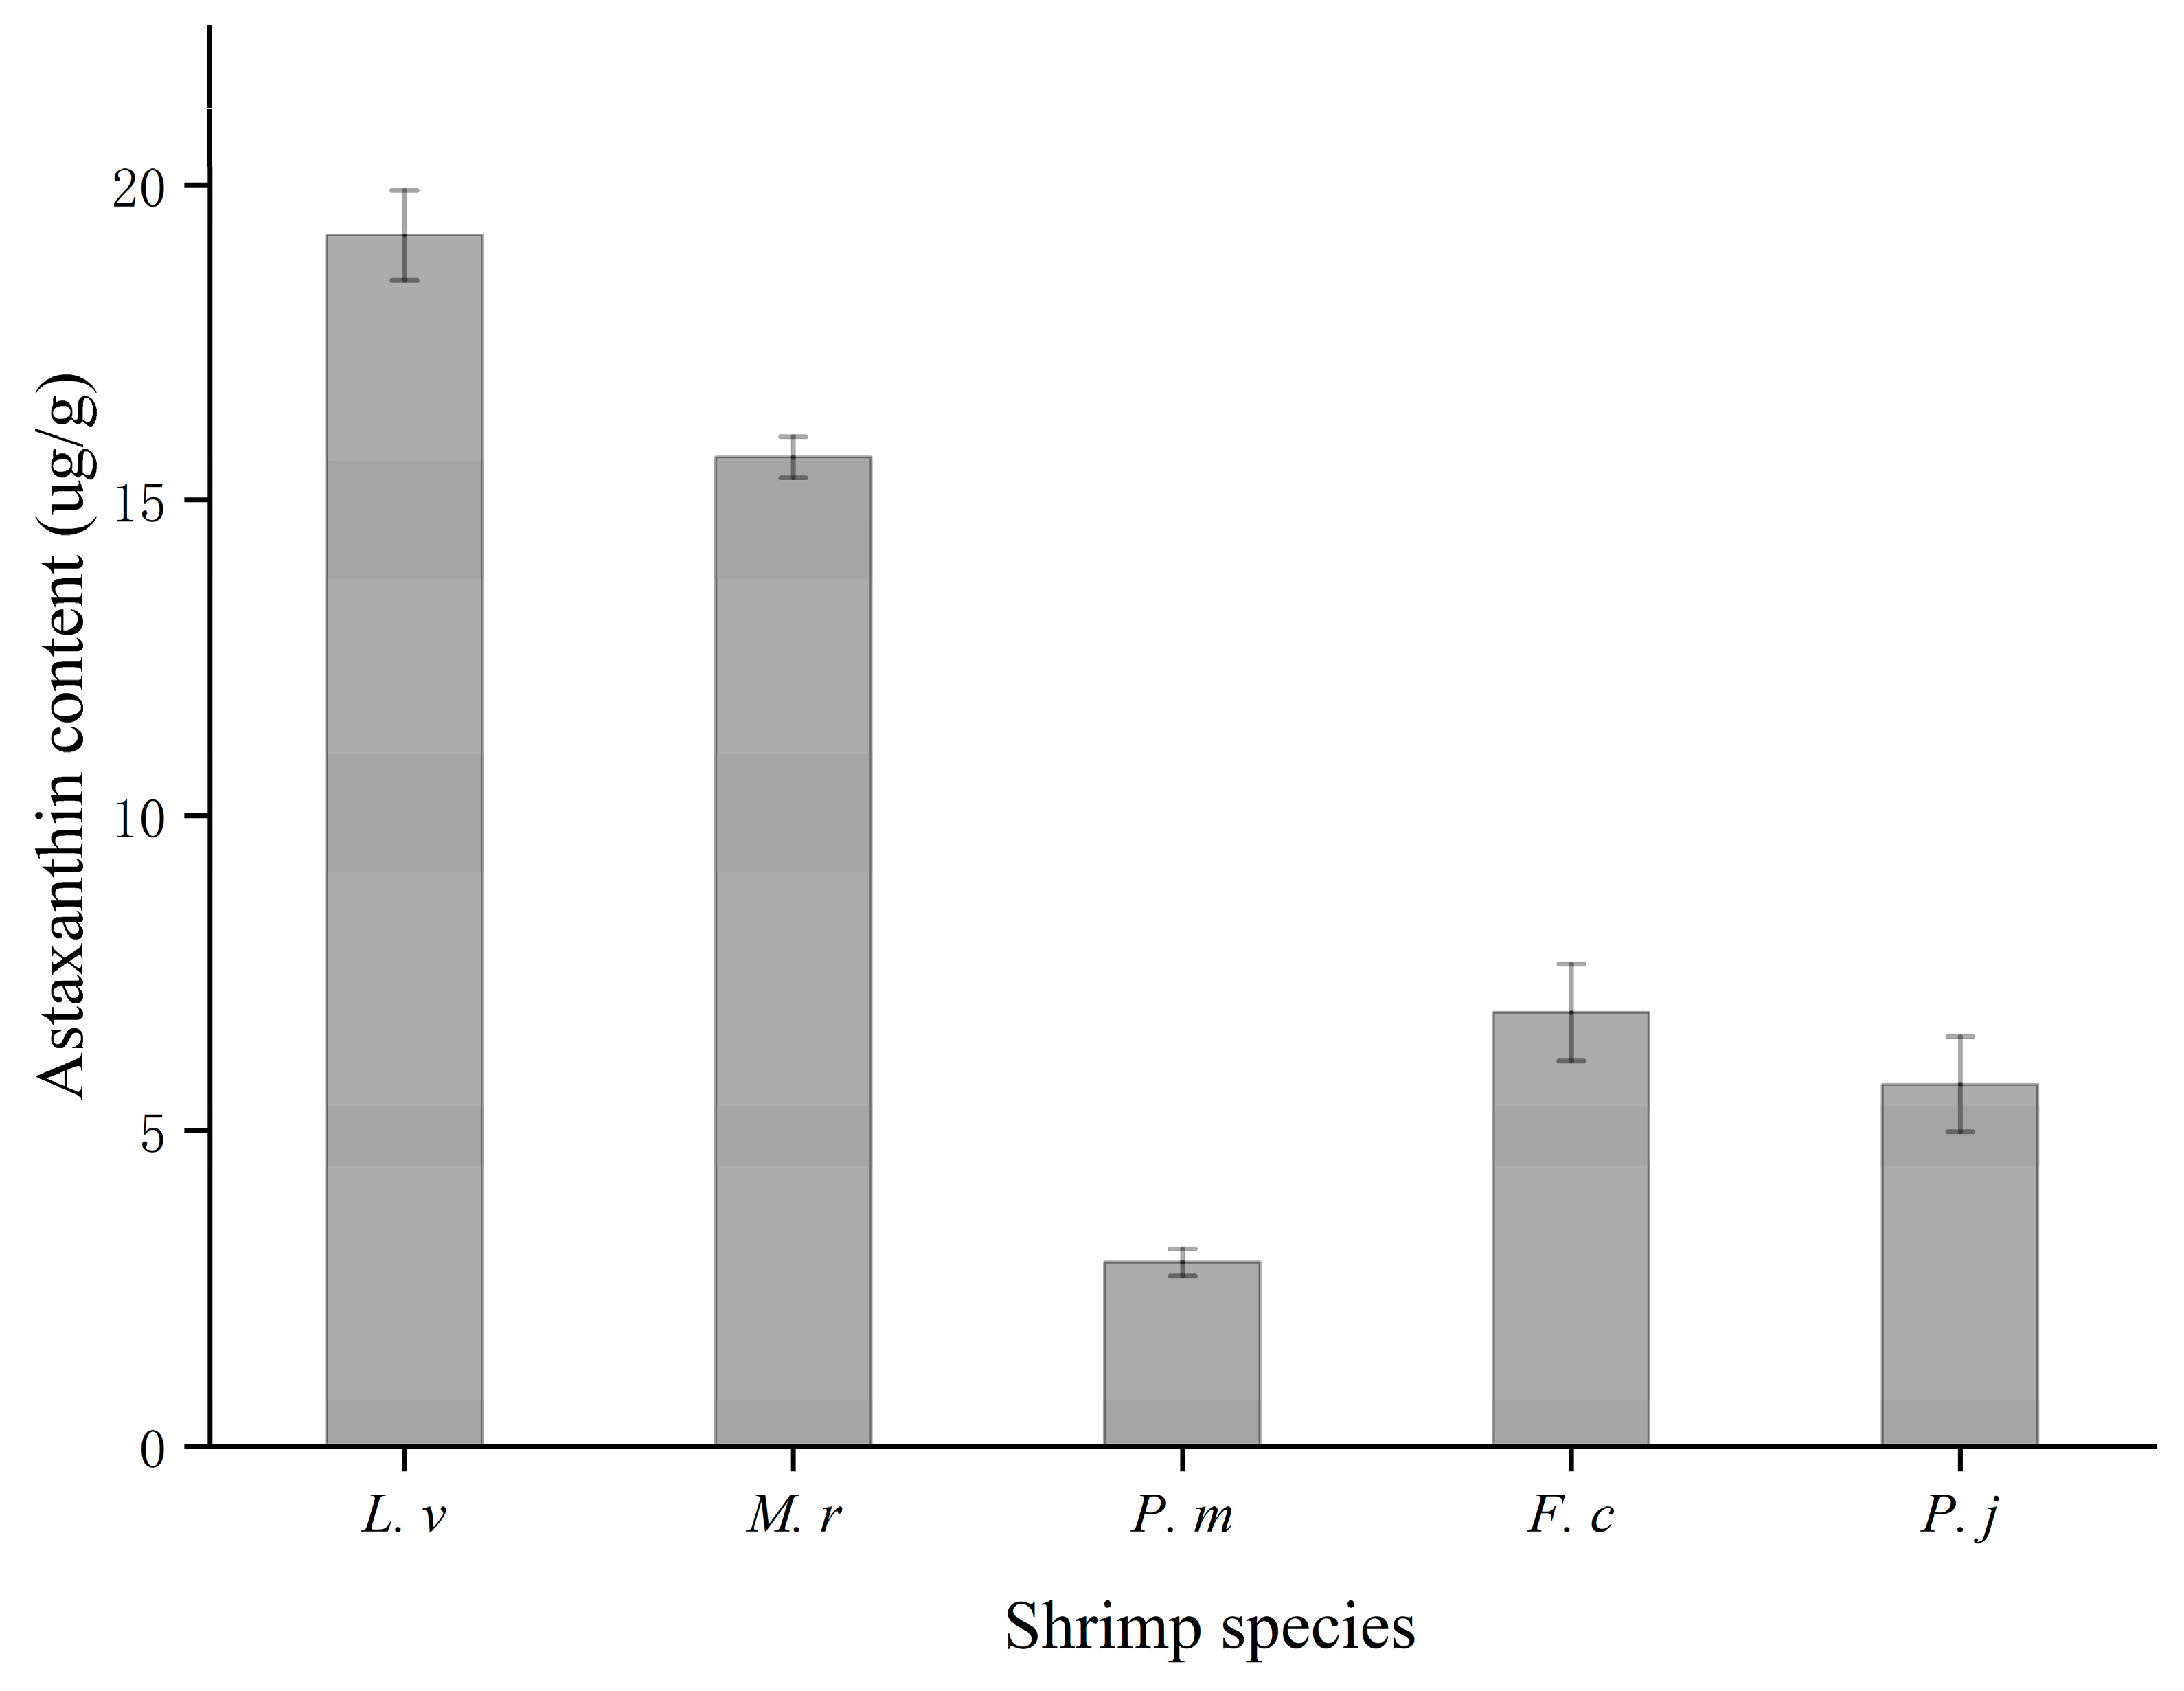
3.6. Astaxanthin
4. Conclusions
Author Contributions
Funding
Data Availability Statement
Conflicts of Interest
References
- Nirmal, N.P.; Santivarangkna, C.; Rajput, M.S.; Benjakul, S. Trends in shrimp processing waste utilization: An industrial prospective. Trends Food Sci. Technol. 2020, 103, 20–35. [Google Scholar] [CrossRef]
- IMARC. Shrimp Market: Global Industry Trends, Share, Size, Growth, Opportunity and Forecast 2020–2025; IMARC Group: Wyoming, WY, USA, 2020. [Google Scholar]
- Mao, X.; Guo, N.; Sun, J.; Xue, C. Comprehensive utilization of shrimp waste based on biotechnological methods: A review. J. Clean. Prod. 2017, 143, 814–823. [Google Scholar] [CrossRef]
- Trang, T.T.C.; Takaomi, K. Chitosan and its biomass composites in application for water treatment. Curr. Opin. Green Sustain. Chem. 2021, 29, 100429. [Google Scholar] [CrossRef]
- Abdollahi, M.; Undeland, I. A novel cold biorefinery approach for isolation of high quality fish oil in parallel with gel-forming proteins. Food Chem. 2020, 332, 127294. [Google Scholar] [CrossRef]
- Saini, R.K.; Song, M.-H.; Rengasamy, K.R.R.; Ko, E.-Y.; Keum, Y.-S. Red Shrimp Are a Rich Source of Nutritionally Vital Lipophilic Compounds: A Comparative Study among Edible Flesh and Processing Waste. Foods 2020, 9, 1179. [Google Scholar] [CrossRef]
- Nikoo, M.; Xu, X.; Regenstein, J.M.; Noori, F. Autolysis of Pacific white shrimp (Litopenaeus vannamei) processing by-products: Enzymatic activities, lipid and protein oxidation, and antioxidant activity of hydrolysates. Food Biosci. 2021, 39, 100844. [Google Scholar] [CrossRef]
- Cao, W.; Tian, S.; Wang, H.; Zhang, C.; Yuan, J. Release principle of peptides and amino acids during the autolysis of shrimp head from Litopenaeus vannamei after UV-C irradiation stress. Food Sci. Nutr. 2019, 8, 170–178. [Google Scholar] [CrossRef] [Green Version]
- Gao, J.; You, J.; Kang, J.; Nie, F.; Ji, H.; Liu, S. Recovery of astaxanthin from shrimp (Penaeus vannamei) waste by ultrasonic-assisted extraction using ionic liquid-in-water microemulsions. Food Chem. 2020, 325, 126850. [Google Scholar] [CrossRef]
- Gulzar, S.; Raju, N.; Nagarajarao, R.C.; Benjakul, S. Oil and pigments from shrimp processing by-products: Extraction, composition, bioactivities and its application—A review. Trends Food Sci. Technol. 2020, 100, 307–319. [Google Scholar] [CrossRef]
- Prameela, K.; Venkatesh, K.; Immandi, S.B.; Kasturi, A.P.K.; Krishna, C.R.; Mohan, C.M. Next generation nutraceutical from shrimp waste: The convergence of applications with extraction methods. Food Chem. 2017, 237, 121–132. [Google Scholar] [CrossRef]
- Horwitz, W.; Latimer, G.W. Association of Official Analytical Chemists International. Official Methods of Analysis of AOAC International; Current Through Revision 1; AOAC International: Gaithersburg, MD, USA, 2006. [Google Scholar]
- Qin, Y.; Li, X.; Li, J.; Zhou, Y.; Xiang, Z.; Ma, H.; Noor, Z.; Mo, R.; Zhang, Y.; Yu, Z. Seasonal variations in biochemical composition and nutritional quality of Crassostrea hongkongensis, in relation to the gametogenic cycle. Food Chem. 2021, 356, 129736. [Google Scholar] [CrossRef] [PubMed]
- Bech-Andersen, S. Determination of Tryptophan with HPLC after Alkaline Hydrolysis in Autoclave using α-methyl-tryptophan as Internal Standard. Acta Agric. Scand. 1991, 41, 305–309. [Google Scholar] [CrossRef]
- Wu, H.; Ge, M.; Chen, H.; Jiang, S.; Lin, L.; Lu, J. Comparison between the nutritional qualities of wild-caught and rice-field male Chinese mitten crabs (Eriocheir sinensis). LWT 2020, 117, 108663. [Google Scholar] [CrossRef]
- Lorenzo, J.M.; Bermúdez, R.; Domínguez, R.; Guiotto, A.; Franco, D.; Purriños, L. Physicochemical and microbial changes during the manufacturing process of dry-cured lacón salted with potassium, calcium and magnesium chloride as a partial replacement for sodium chloride. Food Control. 2015, 50, 763–769. [Google Scholar] [CrossRef]
- Roy, V.C.; Getachew, A.T.; Cho, Y.-J.; Park, J.-S.; Chun, B.-S. Recovery and bio-potentialities of astaxanthin-rich oil from shrimp (Penaeus monodon) waste and mackerel (Scomberomous niphonius) skin using concurrent supercritical CO2 extraction. J. Supercrit. Fluids 2020, 159, 104773. [Google Scholar] [CrossRef]
- Olsen, R.L.; Toppe, J.; Karunasagar, I. Challenges and realistic opportunities in the use of by-products from processing of fish and shellfish. Trends Food Sci. Technol. 2014, 36, 144–151. [Google Scholar] [CrossRef]
- Ali, A.; Wei, S.; Liu, Z.; Fan, X.; Sun, Q.; Xia, Q.; Liu, S.; Hao, J.; Deng, C. Non-thermal processing technologies for the recovery of bioactive compounds from marine by-products. LWT 2021, 147, 111549. [Google Scholar] [CrossRef]
- Chen, M.; Ji, H.; Zhang, Z.; Zeng, X.; Su, W.; Liu, S. A novel calcium-chelating peptide purified from Auxis thazard protien hydrolysate and its binding properties with calcium. J. Funct. Foods 2019, 60, 103447. [Google Scholar] [CrossRef]
- Zhang, Y.; Sun, Q.; Liu, S.; Wei, S.; Xia, Q.; Ji, H.; Deng, C.; Hao, J. Extraction of fish oil from fish heads using ultra-high pressure pre-treatment prior to enzymatic hydrolysis. Innov. Food Sci. Emerg. Technol. 2021, 70, 102670. [Google Scholar] [CrossRef]
- Chang, S.-H.; Wu, C.-H.; Tsai, G.-J. Effects of chitosan molecular weight on its antioxidant and antimutagenic properties. Carbohydr. Polym. 2018, 181, 1026–1032. [Google Scholar] [CrossRef] [PubMed]
- Kontominas, M.; Badeka, A.; Kosma, I.; Nathanailides, C. Recent Developments in Seafood Packaging Technologies. Foods 2021, 10, 940. [Google Scholar] [CrossRef] [PubMed]
- Zhang, D.; Ji, H.; Liu, S.; Gao, J. Similarity of aroma attributes in hot-air-dried shrimp (Penaeus vannamei) and its different parts using sensory analysis and GC–MS. Food Res. Int. 2020, 137, 109517. [Google Scholar] [CrossRef] [PubMed]
- Wu, S.; Zhao, M.; Gao, S.; Xu, Y.; Zhao, X.; Liu, M.; Liu, X. Change Regularity of Taste and the Performance of Endogenous Proteases in Shrimp (Penaens vannamei) Head during Autolysis. Foods 2021, 10, 1020. [Google Scholar] [CrossRef]
- Halim, N.R.; Yusof, H.M.; Sarbon, N.M. Functional and bioactive properties of fish protein hydolysates and peptides: A comprehensive review. Trends Food Sci. Technol. 2016, 51, 24–33. [Google Scholar] [CrossRef]
- Younes, I.; Hajji, S.; Frachet, V.; Rinaudo, M.; Jellouli, K.; Nasri, M. Chitin extraction from shrimp shell using enzymatic treatment. Antitumor, antioxidant and antimicrobial activities of chitosan. Int. J. Biol. Macromol. 2014, 69, 489–498. [Google Scholar] [CrossRef]
- Kritchenkov, A.S.; Kletskov, A.V.; Egorov, A.R.; Tskhovrebov, A.G.; Kurliuk, A.V.; Zhaliazniak, N.V.; Shakola, T.V.; Khrustalev, V.N. New water-soluble chitin derivative with high antibacterial properties for potential application in active food coatings. Food Chem. 2021, 343, 128696. [Google Scholar] [CrossRef]
- Wang, C.-L.; Wang, Z.-Y.; Song, C.-W.; Luo, S.; Yuan, X.-Y.; Huang, Y.-Y.; Desouky, H.E. A comparative study on growth, muscle cellularity and flesh quality of farmed and imitative ecological farming loach, Misgurnus anguillicaudatus. Aquaculture 2021, 543, 736933. [Google Scholar] [CrossRef]
- Anzani, C.; Boukid, F.; Drummond, L.; Mullen, A.M.; Álvarez, C. Optimising the use of proteins from rich meat co-products and non-meat alternatives: Nutritional, technological and allergenicity challenges. Food Res. Int. 2020, 137, 109575. [Google Scholar] [CrossRef]
- Yang, C.L.; Cao, X.J.; Zhang, Y.C.; Liu, S.C.; Ji, H.W. Comparative composition and nutritional evaluation of different head parts of three tuna species. Meat Res. 2019, 33, 8–14. [Google Scholar] [CrossRef]
- Machado, M.; Machado, S.; Pimentel, F.B.; Freitas, V.; Alves, R.C.; Oliveira, M.B.P.P. Amino Acid Profile and Protein Quality Assessment of Macroalgae Produced in an Integrated Multi-Trophic Aquaculture System. Foods 2020, 9, 1382. [Google Scholar] [CrossRef]
- Tsehay, S.; Ortiz, R.; Geleta, M.; Bekele, E.; Tesfaye, K.; Johansson, E. Nutritional Profile of the Ethiopian Oilseed Crop Noug (Guizotia abyssinica Cass.): Opportunities for Its Improvement as a Source for Human Nutrition. Foods 2021, 10, 1778. [Google Scholar] [CrossRef] [PubMed]
- Prato, E.; Biandolino, F.; Parlapiano, I.; Papa, L.; Kelly, M.; Fanelli, G. Bioactive fatty acids of three commercial scallop species. Int. J. Food Prop. 2018, 21, 519–532. [Google Scholar] [CrossRef]
- Shahidi, F.; Ambigaipalan, P. Omega-3 Polyunsaturated Fatty Acids and Their Health Benefits. Annu. Rev. Food Sci. Technol. 2018, 9, 345–381. [Google Scholar] [CrossRef] [PubMed]
- Gupta, S. Sources and Deficiency Diseases of Mineral Nutrients in Human Health and Nutrition: A Review. Pedosphere 2014, 24, 13–38. [Google Scholar] [CrossRef]
- Vilcanqui, Y.; Mamani-Apaza, L.O.; Flores, M.; Ortiz-Viedma, J.; Romero, N.; Mariotti-Celis, M.S.; Huamán-Castilla, N.L. Chemical Characterization of Brown and Red Seaweed from Southern Peru, a Sustainable Source of Bioactive and Nutraceutical Compounds. Agronomy 2021, 11, 1669. [Google Scholar] [CrossRef]
- Heffernan, S.M.; Horner, K.; De Vito, G.; Conway, G.E. The Role of Mineral and Trace Element Supplementation in Exercise and Athletic Performance: A Systematic Review. Nutrients 2019, 11, 696. [Google Scholar] [CrossRef] [Green Version]
- Khandaker, M.; Chijioke, N.; Heffny, N.; Bradley, D.; Alsubaie, A.; Sulieman, A.; Faruque, M.; Sayyed, M.; Al-Mugren, K. Elevated Concentrations of Metal(loids) in Seaweed and the Concomitant Exposure to Humans. Foods 2021, 10, 381. [Google Scholar] [CrossRef]
- Prato, E.; Biandolino, F.; Parlapiano, I.; Giandomenico, S.; Denti, G.; Calò, M.; Spada, L.; Di Leo, A. Proximate, fatty acids and metals in edible marine bivalves from Italian market: Beneficial and risk for consumers health. Sci. Total. Environ. 2019, 648, 153–163. [Google Scholar] [CrossRef]
- FAO; WHO. Evaluation of Certain Food Additives and Contaminants: Eightieth Report of the Joint FAO/WHO Expert Committee on Food Additives; World Health Organization: Geneva, Switzerland, 2016. [Google Scholar]
- Byeon, E.; Kang, H.-M.; Yoon, C.; Lee, J.-S. Toxicity mechanisms of arsenic compounds in aquatic organisms. Aquat. Toxicol. 2021, 237, 105901. [Google Scholar] [CrossRef] [PubMed]
- Pan, L.; Zhang, S.; Gu, K.; Zhang, N. Preparation of astaxanthin-loaded liposomes: Characterization, storage stability and antioxidant activity. CyTA-J. Food 2018, 16, 607–618. [Google Scholar] [CrossRef] [Green Version]
- Chintong, S.; Phatvej, W.; Rerk-Am, U.; Waiprib, Y.; Klaypradit, W. In Vitro Antioxidant, Antityrosinase, and Cytotoxic Activities of Astaxanthin from Shrimp Waste. Antioxidants 2019, 8, 128. [Google Scholar] [CrossRef] [Green Version]
- Raza, S.H.A.; Naqvi, S.R.Z.; Abdelnour, S.A.; Schreurs, N.; Mohammedsaleh, Z.M.; Khan, I.; Shater, A.F.; El-Hack, M.E.A.; Khafaga, A.F.; Quan, G.; et al. Beneficial effects and health benefits of Astaxanthin molecules on animal production: A review. Res. Veter-Sci. 2021, 138, 69–78. [Google Scholar] [CrossRef] [PubMed]
- Fakhri, S.; Abbaszadeh, F.; Dargahi, L.; Jorjani, M. Astaxanthin: A mechanistic review on its biological activities and health benefits. Pharmacol. Res. 2018, 136, 1–20. [Google Scholar] [CrossRef] [PubMed]


| Species | L.v | M.r | P.m | F.c | P.j |
|---|---|---|---|---|---|
| Length/cm | 13.46 ± 0.42 | 13.60 ± 0.57 | 17.44 ± 0.39 | 14.33 ± 0.45 | 13.42 ± 0.54 |
| Mass/g | 16.00 ± 1.46 | 24.52 ± 2.70 | 40.81 ± 3.09 | 21.78 ± 2.54 | 16.98 ± 2.24 |
| Species | Yield (g/100 g) | |||
|---|---|---|---|---|
| Meat | Head | Shell | Tail | |
| L.v | 55.94 ± 2.46 a | 33.63 ± 1.65 d | 7.61 ± 0.89 a | 2.82 ± 0.41 a |
| M.r | 37.47 ± 1.22 d | 53.09 ± 1.42 a | 7.71 ± 0.86 a | 1.73 ± 0.21 c |
| P.m | 47.92 ± 1.68 c | 41.92 ± 2.45 b | 7.44 ± 0.62 a | 2.72 ± 0.32 a |
| F.c | 55.92 ± 0.87 a | 34.26 ± 0.94 d | 7.57 ± 0.50 a | 2.25 ± 0.16 b |
| P.j | 52.14 ± 2.03 b | 37.91 ± 2.04 c | 7.74 ± 0.25 a | 2.21 ± 0.31 b |
| Composition | Species | Head | Shell and Tail | Meat |
|---|---|---|---|---|
| Crude protein | L.v | 6.56 ± 0.01 Bd | 7.98 ± 0.09 Bc | 15.09 ± 0.02 Aa |
| M.r | 8.81 ± 0.04 Bc | 11.30 ± 0.21 Ba | 12.33 ± 0.03 Ad | |
| P.m | 9.14 ± 0.17 Bb | 11.05 ± 0.08 Ba | 13.29 ± 0.18 Ac | |
| F.c | 8.75 ± 0.02 Bc | 10.43 ± 0.17 Bb | 13.18 ± 0.03 Ac | |
| P.j | 9.97 ± 0.10 Ba | 10.60 ± 0.21 Bb | 14.60 ± 0.07 Ab | |
| Crude fat | L.v | 3.78 ± 0.02 Ac | 0.66 ± 0.05 Bb | 0.70 ± 0.02 Ba |
| M.r | 6.88 ± 0.05 Aa | 0.78 ± 0.03 Ba | 0.80 ± 0.03 Ba | |
| P.m | 3.04 ± 0.07 Ad | 0.51 ± 0.02 Bc | 0.48 ± 0.02 Bb | |
| F.c | 3.88 ± 0.03 Ab | 0.52 ± 0.04 Bc | 0.68 ± 0.00 Ba | |
| P.j | 2.17 ± 0.03 Ae | 0.41 ± 0.01 Cd | 0.73 ± 0.01 Ba | |
| Ash | L.v | 4.11 ± 0.14 Bd | 8.57 ± 0.08 Ac | 1.87 ± 0.02 Cb |
| M.r | 6.05 ± 0.15 Bb | 13.31 ± 0.15 Aa | 1.33 ± 0.00 Ce | |
| P.m | 5.58 ± 0.16 Bc | 10.72 ± 0.03 Ab | 1.56 ± 0.02 Cd | |
| F.c | 4.18 ± 0.06 Bd | 8.18 ± 0.08 Ad | 1.74 ± 0.02 Cc | |
| P.j | 7.30 ± 0.07 Ba | 13.45 ± 0.12 Aa | 2.07 ± 0.03 Ca | |
| Crude fiber | L.v | 2.93 ± 0.03 Bc | 7.91 ± 0.09 Ad | 0.38 ± 0.04 Ca |
| M.r | 3.99 ± 0.04 Ba | 10.78 ± 0.01 Aa | 0.29 ± 0.00 Cab | |
| P.m | 3.56 ± 0.06 Bb | 9.74 ± 0.06 Ac | 0.30 ± 0.05 Cab | |
| F.c | 2.38 ± 0.05 Bd | 7.86 ± 0.10 Ad | 0.28 ± 0.03 Cb | |
| P.j | 3.10 ± 0.13 Bc | 10.25 ± 0.03 Ab | 0.35 ± 0.03 Cab | |
| Moisture | L.v | 72.97 ± 0.25 Ab | 66.07 ± 0.42 Bb | 73.76 ± 0.08 Ac |
| M.r | 68.12 ± 0.91 Bd | 58.63 ± 0.47 Cd | 77.57 ± 0.13 Aa | |
| P.m | 72.22 ± 0.51 Bbc | 62.90 ± 0.68 Cc | 75.55 ± 0.23 Ab | |
| F.c | 75.36 ± 0.61 Aa | 68.10 ± 0.68 Ba | 75.70 ± 0.15 Ab | |
| P.j | 70.55 ± 0.32 Bc | 61.28 ± 0.25 Cc | 72.97 ± 0.03 Ad |
| Amino Acids | Head | Shell + Tail | Meat | ||||||||||||
|---|---|---|---|---|---|---|---|---|---|---|---|---|---|---|---|
| L.v | M.r | P.m | F.c | P.j | L.v | M.r | P.m | F.c | P.j | L.v | M.r | P.m | F.c | P.j | |
| Lys | 0.86 ± 0.01 bc | 0.85 ± 0.02 bcd | 0.83 ± 0.04 cd | 0.88 ± 0.00 b | 0.85 ± 0.02 d | 0.74 ± 0.01 e | 0.86 ± 0.00 bc | 0.66 ± 0.03 g | 0.71 ± 0.00 ef | 0.68 ± 0.0 fg | 1.69 ± 0.01 a | 1.71 ± 0.01 a | 1.70 ± 0.01 a | 1.71 ± 0.01 a | 1.71 ± 0.00 a |
| Phe | 0.60 ± 0.01 i | 0.68 ± 0.01 g | 0.60 ± 0.01 i | 0.62 ± 0.00 h | 0.68 ± 0.01 hi | 0.73 ± 0.01 ef | 0.87 ± 0.01 a | 0.69 ± 0.00 g | 0.74 ± 0.01 e | 0.72 ± 0.00 f | 0.80 ± 0.02 d | 0.81 ± 0.00 cd | 0.82 ± 0.01 bcd | 0.82 ± 0.00 bc | 0.83 ± 0.01 b |
| Leu | 0.82 ± 0.00 ef | 0.82 ± 0.02 ef | 0.83 ± 0.03 ef | 0.84 ± 0.00 de | 0.82 ± 0.02 a | 0.76 ± 0.00 g | 0.87 ± 0.00 d | 0.70 ± 0.03 h | 0.74 ± 0.00 gh | 0.73 ± 0.00 gh | 1.49 ± 0.01 c | 1.51 ± 0.01 bc | 1.53 ± 0.01 ab | 1.52 ± 0.00 bc | 1.56 ± 0.01 a |
| IIe | 0.56 ± 0.00 g | 0.61 ± 0.01 ef | 0.58 ± 0.01 g | 0.58 ± 0.01 g | 0.61 ± 0.01 g | 0.61 ± 0.01 ef | 0.76 ± 0.00 d | 0.61 ± 0.01 ef | 0.60 ± 0.00 f | 0.62 ± 0.00 e | 0.82 ± 0.02 c | 0.87 ± 0.01 a | 0.81 ± 0.02 c | 0.82 ± 0.01 c | 0.84 ± 0.01 b |
| Val | 0.61 ± 0.00 g | 0.65 ± 0.01 f | 0.62 ± 0.01 g | 0.63 ± 0.01 f | 0.65 ± 0.01 g | 0.73 ± 0.02 d | 0.83 ± 0.00 b | 0.69 ± 0.01 e | 0.75 ± 0.00 c | 0.72 ± 0.00 d | 0.83 ± 0.00 b | 0.88 ± 0.00 a | 0.84 ± 0.01 b | 0.85 ± 0.00 b | 0.88 ± 0.00 a |
| Thr | 0.54 ± 0.00 gh | 0.55 ± 0.00 gh | 0.52 ± 0.02 i | 0.53 ± 0.00 hi | 0.55 ± 0.00 hi | 0.59 ± 0.01 d | 0.67 ± 0.00 c | 0.55 ± 0.01 fg | 0.57 ± 0.00 ef | 0.58 ± 0.00 de | 0.76 ± 0.00 b | 0.75 ± 0.00 b | 0.76 ± 0.01 b | 0.76 ± 0.00 b | 0.79 ± 0.00 a |
| Met | 0.50 ± 0.00 fg | 0.56 ± 0.02 cde | 0.54 ± 0.01 def | 0.57 ± 0.00 bcde | 0.56 ± 0.02 g | 0.57 ± 0.14 bcd | 0.61 ± 0.00 ab | 0.62 ± 0.02 a | 0.52 ± 0.01 ef | 0.55 ± 0.00 cde | 0.55 ± 0.00 cde | 0.54 ± 0.00 def | 0.57 ± 0.00 bcd | 0.55 ± 0.00 cde | 0.59 ± 0.00 abc |
| Arg | 0.93 ± 0.00 e | 0.77 ± 0.00 g | 0.79 ± 0.03 g | 0.95 ± 0.00 e | 0.77 ± 0.00 g | 0.94 ± 0.00 e | 0.95 ± 0.00 e | 0.83 ± 0.02 f | 0.92 ± 0.01 e | 0.94 ± 0.00 e | 2.01 ± 0.01 b | 1.78 ± 0.01 d | 1.77 ± 0.01 d | 1.89 ± 0.01 c | 2.12 ± 0.01 a |
| His | 0.29 ± 0.00 j | 0.40 ± 0.00 d | 0.30 ± 0.01 ij | 0.31 ± 0.00 hi | 0.40 ± 0.00 fg | 0.32 ± 0.00 gh | 0.45 ± 0.00 b | 0.31 ± 0.00 gh | 0.34 ± 0.00 e | 0.33 ± 0.00 ef | 0.40 ± 0.00 d | 0.47 ± 0.01 a | 0.40 ± 0.00 d | 0.42 ± 0.00 c | 0.45 ± 0.00 b |
| Tyr | 0.48 ± 0.01 hi | 0.55 ± 0.00 f | 0.48 ± 0.00 hi | 0.51 ± 0.01 g | 0.55 ± 0.00 i | 0.53 ± 0.00 g | 0.65 ± 0.00 d | 0.49 ± 0.01 h | 0.57 ± 0.01 e | 0.48 ± 0.00 hi | 0.69 ± 0.00 c | 0.71 ± 0.01 bc | 0.72 ± 0.01 ab | 0.70 ± 0.00 c | 0.72 ± 0.01 a |
| Ala# | 0.83 ± 0.00 j | 0.74 ± 0.00 k | 0.86 ± 0.03 ij | 0.86 ± 0.00 i | 0.74 ± 0.00 k | 1.00 ± 0.02 f | 0.93 ± 0.00 g | 1.05 ± 0.01 e | 1.05 ± 0.00 e | 0.90 ± 0.00 h | 1.14 ± 0.00 cd | 1.12 ± 0.01 d | 1.37 ± 0.01 a | 1.25 ± 0.00 b | 1.17 ± 0.01 c |
| Gly# | 0.99 ± 0.04 e | 0.67 ± 0.01 h | 0.92 ± 0.01 f | 0.98 ± 0.01 e | 0.67 ± 0.01 f | 1.20 ± 0.01 cd | 0.92 ± 0.00 f | 1.16 ± 0.02 d | 1.22 ± 0.00 c | 1.18 ± 0.00 cd | 1.38 ± 0.00 b | 0.86 ± 0.00 g | 1.52 ± 0.01 a | 1.36 ± 0.00 b | 1.56 ± 0.01 a |
| Pro | 0.68 ± 0.00 f | 0.58 ± 0.00 h | 0.63 ± 0.00 g | 0.73 ± 0.00 e | 0.58 ± 0.00 h | 0.80 ± 0.02 d | 0.83 ± 0.01 c | 0.88 ± 0.01 b | 0.97 ± 0.01 a | 0.79 ± 0.00 d | 0.79 ± 0.00 d | 0.65 ± 0.00 g | 0.86 ± 0.01 b | 0.97 ± 0.01 a | 0.81 ± 0.01 d |
| Glu# | 1.73 ± 0.00 ghi | 1.56 ± 0.03 j | 1.74 ± 0.05 fgh | 1.76 ± 0.00 fg | 1.56 ± 0.03 i | 1.74 ± 0.02 fgh | 1.83 ± 0.01 e | 1.69 ± 0.04 hi | 1.79 ± 0.01 ef | 1.69 ± 0.00 hi | 3.11 ± 0.00 c | 3.00 ± 0.01 d | 3.24 ± 0.03ab | 3.19 ± 0.01b | 3.27 ± 0.02a |
| Ser | 0.52 ± 0.01 hi | 0.57 ± 0.01 g | 0.52 ± 0.01 hi | 0.53 ± 0.00 h | 0.57 ± 0.01 i | 0.67 ± 0.00 e | 0.79 ± 0.00 a | 0.65 ± 0.01 f | 0.68 ± 0.00 e | 0.64 ± 0.00 f | 0.74 ± 0.00 cd | 0.76 ± 0.00 bc | 0.73 ± 0.01 d | 0.74 ± 0.00 d | 0.76 ± 0.00 b |
| Asp# | 1.20 ± 0.01 i | 1.27 ± 0.00 f | 1.21 ± 0.03 hi | 1.25 ± 0.00 fg | 1.27 ± 0.00 i | 1.31 ± 0.01 e | 1.46 ± 0.00 c | 1.23 ± 0.03 gh | 1.35 ± 0.01 d | 1.31 ± 0.00 e | 1.98 ± 0.00 b | 2.06 ± 0.00 a | 2.00 ± 0.02 b | 2.00 ± 0.01 b | 2.04 ± 0.01 a |
| TAA | 12.14 | 11.83 | 11.97 | 12.53 | 11.83 | 13.24 | 14.23 | 12.81 | 13.52 | 12.86 | 19.18 | 18.48 | 19.64 | 19.55 | 20.10 |
| EAA | 4.49 | 4.72 | 4.52 | 4.65 | 4.72 | 4.73 | 5.47 | 4.52 | 4.63 | 4.60 | 6.94 | 7.07 | 7.03 | 7.03 | 7.20 |
| NEAA | 7.65 | 7.11 | 7.45 | 7.88 | 7.11 | 8.51 | 8.76 | 8.29 | 8.89 | 8.26 | 12.24 | 11.41 | 12.61 | 12.52 | 12.90 |
| DAA | 4.75 | 4.24 | 4.73 | 4.85 | 4.24 | 5.25 | 5.14 | 5.13 | 5.41 | 5.08 | 7.61 | 7.04 | 8.13 | 7.80 | 8.04 |
| EAA/NEAA | 0.59 | 0.66 | 0.61 | 0.59 | 0.66 | 0.56 | 0.62 | 0.55 | 0.52 | 0.56 | 0.57 | 0.62 | 0.56 | 0.56 | 0.56 |
| EAA/TAA | 0.37 | 0.40 | 0.38 | 0.37 | 0.40 | 0.36 | 0.38 | 0.35 | 0.35 | 0.36 | 0.36 | 0.38 | 0.36 | 0.36 | 0.36 |
| DAA/TAA | 0.39 | 0.36 | 0.40 | 0.39 | 0.36 | 0.40 | 0.36 | 0.40 | 0.40 | 0.40 | 0.40 | 0.38 | 0.41 | 0.40 | 0.40 |
| Part | Species | Amino Acid | Thr | Val | Met | Ile | Leu | Phe + Tyr | Lys | EAAI |
|---|---|---|---|---|---|---|---|---|---|---|
| Head | L.v | AAS | 2.06 | 1.87 | 2.18 | 2.13 | 1.78 | 3.12 | 3.41 | 1.61 |
| CS | 1.83 | 1.47 | 1.29 | 1.71 | 1.41 | 1.73 | 1.96 | |||
| M.r | AAS | 1.56 | 1.49 | 1.82 | 1.73 | 1.32 | 2.64 | 2.51 | 1.27 | |
| CS | 1.39 | 1.12 | 1.08 | 1.38 | 1.10 | 1.47 | 1.44 | |||
| P.m | AAS | 1.42 | 1.37 | 1.69 | 1.59 | 1.29 | 2.24 | 2.36 | 1.17 | |
| CS | 1.26 | 1.03 | 1.00 | 1.27 | 1.07 | 1.24 | 1.36 | |||
| F.c | AAS | 1.51 | 1.45 | 1.86 | 1.66 | 1.36 | 2.45 | 2.62 | 1.26 | |
| CS | 1.35 | 1.09 | 1.10 | 1.33 | 1.13 | 1.36 | 1.50 | |||
| P.j | AAS | 1.33 | 1.23 | 1.62 | 1.43 | 1.14 | 2.03 | 2.12 | 1.56 | |
| CS | 1.23 | 0.99 | 0.96 | 1.22 | 0.97 | 1.28 | 1.27 | |||
| Shell and Tail | L.v | AAS | 1.85 | 1.84 | 2.04 | 1.91 | 1.35 | 2.99 | 2.41 | 1.41 |
| CS | 1.64 | 1.39 | 1.21 | 1.53 | 1.12 | 1.66 | 1.38 | |||
| M.r | AAS | 1.48 | 1.48 | 1.54 | 1.68 | 1.09 | 2.55 | 1.98 | 1.15 | |
| CS | 1.32 | 1.11 | 0.91 | 1.35 | 0.91 | 1.42 | 1.14 | |||
| P.m | AAS | 1.24 | 1.26 | 1.60 | 1.38 | 0.90 | 2.02 | 1.56 | 1.00 | |
| CS | 1.11 | 0.95 | 0.95 | 1.10 | 0.75 | 1.12 | 0.89 | |||
| F.c | AAS | 1.37 | 1.45 | 1.42 | 1.44 | 1.01 | 2.38 | 1.77 | 1.05 | |
| CS | 1.21 | 1.09 | 0.85 | 1.15 | 0.83 | 1.32 | 1.02 | |||
| P.j | AAS | 1.37 | 1.37 | 1.48 | 1.46 | 0.98 | 2.14 | 1.67 | 1.03 | |
| CS | 1.22 | 1.03 | 0.88 | 1.17 | 0.81 | 1.19 | 0.96 | |||
| Meat | L.v | AAS | 1.26 | 1.11 | 1.04 | 1.36 | 1.40 | 1.87 | 2.92 | 1.03 |
| CS | 1.12 | 0.83 | 0.62 | 1.09 | 1.16 | 1.04 | 1.67 | |||
| M.r | AAS | 1.52 | 1.44 | 1.25 | 1.76 | 1.74 | 2.33 | 3.61 | 1.29 | |
| CS | 1.35 | 1.08 | 0.74 | 1.41 | 1.44 | 1.30 | 2.07 | |||
| P.m | AAS | 1.43 | 1.27 | 1.23 | 1.52 | 1.64 | 2.19 | 3.33 | 1.20 | |
| CS | 1.27 | 0.96 | 0.73 | 1.22 | 1.35 | 1.22 | 2.06 | |||
| F.c | AAS | 1.90 | 1.30 | 1.19 | 1.56 | 1.64 | 2.18 | 3.38 | 1.20 | |
| CS | 1.28 | 0.98 | 0.71 | 1.24 | 1.36 | 1.21 | 1.94 | |||
| P.j | AAS | 1.35 | 1.22 | 1.15 | 1.44 | 1.52 | 2.01 | 3.05 | 1.11 | |
| CS | 1.20 | 0.91 | 0.68 | 1.15 | 1.26 | 1.12 | 1.75 |
| Fatty Acid | L.v | M.r | P.m | F.c | P.j |
|---|---|---|---|---|---|
| C12:0 | 0.05 ± 0.00 b | 1.05 ± 0.00 a | 0.12 ± 0.00 b | 0.05 ± 0.00 c | 0.19 ± 0.00 b |
| C13:0 | 0.03 ± 0.00 b | 0.59 ± 0.00 a | 0.04 ± 0.00 b | 0.06 ± 0.00 c | 0.08 ± 0.00 b |
| C14:0 | 3.27 ± 0.00 c | 10.88 ± 0.01 a | 9.28 ± 0.01 a | 4.49 ± 0.00 c | 6.54 ± 0.00 b |
| C15:0 | 1.74 ± 0.00 c | 4.33 ± 0.00 a | 1.77 ± 0.00 c | 2.40 ± 0.00 c | 3.11 ± 0.00 b |
| C16:0 | 32.76 ± 0.01 a | 18.20 ± 0.02 ab | 16.90 ± 0.29 ab | 31.86 ± 0.01 a | 30.04 ± 0.02 a |
| C17:0 | 2.74 ± 0.00 b | 4.94 ± 0.00 a | 2.80 ± 0.00 b | 2.56 ± 0.00 b | 4.48 ± 0.00 a |
| C18:0 | 16.90 ± 0.01 c | 11.50 ± 0.03 d | 25.93 ± 0.02 a | 14.94 ± 0.01 c | 23.53 ± 0.01 b |
| C20:0 | 0.87 ± 0.00 b | 2.36 ± 0.00 a | 0.92 ± 0.00 b | 1.08 ± 0.00 b | 1.02 ± 0.00 b |
| C21:0 | 0.32 ± 0.00 c | 1.13 ± 0.00 a | 0.18 ± 0.00 b | 0.51 ± 0.00 b | 0.20 ± 0.00 b |
| C22:0 | 1.00 ± 0.00 b | 1.99 ± 0.00 a | 0.82 ± 0.00 b | 1.44 ± 0.00 b | 0.59 ± 0.00 b |
| C23:0 | 2.33 ± 0.00 b | 3.22 ± 0.00 a | 2.03 ± 0.00 b | 1.13 ± 0.00 c | 3.10 ± 0.00 a |
| C24:0 | 0.62 ± 0.00 a | 1.35 ± 0.01 a | 0.75 ± 0.00 a | 0.71 ± 0.00 a | 0.23 ± 0.00 b |
| C16:1 | 2.08 ± 0.00 c | 5.38 ± 0.00 a | 3.41 ± 0.00 b | 2.30 ± 0.00 c | 3.63 ± 0.00 b |
| C17:1 | 0.11 ± 0.00 b | 0.58 ± 0.00 a | 0.19 ± 0.00 b | 0.25 ± 0.00 b | 0.51 ± 0.00 b |
| C18:1 | 10.48 ± 0.00 b | 3.17 ± 0.00 d | 3.29 ± 0.00 d | 12.66 ± 0.01 a | 5.71 ± 0.00 c |
| C20:1 | 0.81 ± 0.00 a | 0.25 ± 0.00 b | 0.71 ± 0.01 b | 1.20 ± 0.00 a | 0.61 ± 0.00 a |
| C22:1 | 0.06 ± 0.00 a | 0.11 ± 0.00 a | 0.11 ± 0.00 a | 0.19 ± 0.00 a | 0.04 ± 0.00 a |
| C24:1 | 0.19 ± 0.00 a | 0.14 ± 0.00 a | 0.33 ± 0.00 a | 0.23 ± 0.00 a | 0.06 ± 0.00 a |
| C18:2n-6 | 10.34 ± 0.00 b | 0.01 ± 0.00 d | 11.04 ± 0.00 ab | 10.83 ± 0.00 a | 0.82 ± 0.00 c |
| C18:3n-3 | 0.02 ± 0.00 a | 0.26 ± 0.00 a | 0.04 ± 0.00 a | 0.01 ± 0.00 a | 0.03 ± 0.00 a |
| C18:3n-6 | 0.91 ± 0.00 b | 3.29 ± 0.01 a | 0.74 ± 0.00 b | 0.74 ± 0.00 b | 0.35 ± 0.00 c |
| C20:2n-6 | 0.88 ± 0.00 b | 2.77 ± 0.03 a | 0.65 ± 0.00 b | 0.95 ± 0.00 b | 0.57 ± 0.00 b |
| C20:3n-3 | 0.12 ± 0.00 a | 0.28 ± 0.00 a | 0.12 ± 0.00 a | 0.07 ± 0.00 a | 0.12 ± 0.00 a |
| C20:3n-6 | 0.16 ± 0.00 b | 2.20 ± 0.00 a | 0.12 ± 0.00 b | 0.14 ± 0.00 c | 0.09 ± 0.00 b |
| C20:4n-6 | 0.33 ± 0.00 c | 1.99 ± 0.00 a | 0.13 ± 0.00 c | 0.69 ± 0.00 b | 0.04 ± 0.00 c |
| C20:5n-3(EPA) | 5.15 ± 0.00 c | 10.29 ± 0.00 a | 9.85 ± 0.00 b | 3.08 ± 0.00 d | 7.25 ± 0.00 b |
| C22:2n-6 | 0.09 ± 0.00 a | 0.18 ± 0.00 a | 0.10 ± 0.00 a | 0.05 ± 0.00 a | 0.04 ± 0.00 a |
| C22:4n-6 | 0.80 ± 0.00 c | 1.59 ± 0.00 b | 0.92 ± 0.00 d | 0.23 ± 0.00 e | 1.60 ± 0.00 a |
| C22:5n-3 | 0.11 ± 0.00 b | 0.23 ± 0.00 b | 0.05 ± 0.00 b | 0.04 ± 0.00 b | 0.90 ± 0.00 a |
| C22:5n-6 | 0.12 ± 0.00 a | 0.14 ± 0.00 a | 0.13 ± 0.00 a | 0.07 ± 0.00 a | 0.12 ± 0.00 a |
| C22:6n-3(DHA) | 4.57 ± 0.00 a | 5.47 ± 0.00 a | 6.44 ± 0.06 a | 4.90 ± 0.00 a | 4.33 ± 0.00 a |
| SFAs | 62.65 | 61.54 | 63.63 | 62.35 | 73.16 |
| MUFAs | 13.72 | 9.63 | 6.05 | 15.83 | 10.58 |
| PUFAs | 23.6 | 28.7 | 30.33 | 21.8 | 16.26 |
| PUFAs/SFAs | 0.38 | 0.47 | 0.48 | 0.35 | 0.22 |
| EPA+DHA | 9.72 | 15.76 | 16.29 | 7.98 | 11.58 |
| DHA/EPA | 0.89 | 0.53 | 0.65 | 1.59 | 0.60 |
| n-6/n-3 | 1.36 | 0.75 | 0.83 | 1.68 | 0.37 |
| Parts | Species | K | Na | Ca | Mg | Fe | Zn | P | Cu | Pb | As | Cd | Na: K | Zn: Cu | Zn: Fe |
|---|---|---|---|---|---|---|---|---|---|---|---|---|---|---|---|
| Head | L.v | 2030.0 ± 70.7 e | 2920.0 ± 63.6 cd | 12,350.0 ± 777.8 h | 964.0 ± 65.1 e | 34.4 ± 1.1 b | 11.3 ± 0.2 bc | 344.5 ± 3.5 f | 14.5 ± 0.5 b | 0.2 ± 0.1 | 1.3 ± 0.0 e | ND | 1.4 | 0.9 | 0.3 |
| M.r | 1510.0 ± 42.4 g | 1510.0 ± 7.1 i | 23,050.0 ± 353.6 e | 591.0 ± 2.8 fg | 34.1 ± 1.8 b | 16.3 ± 1.0 a | 351.0 ± 5.7 f | 24.9 ± 1.2 a | ND | 1.2 ± 0.1 fg | 0.8±0.1 a | 1.0 | 0.7 | 0.5 | |
| P.m | 1910.0 ± 14.1 e | 3280.0 ± 63.6 a | 15,600.0 ± 636.4 g | 699.0 ± 25.5 f | 23.1 ± 0.8 c | 12.0 ± 0.6 b | 309.5 ± 10.6 h | 12.8 ± 0.2 c | ND | 0.4 ± 0.1 i | 0.1±0.1 d | 1.7 | 0.9 | 0.5 | |
| F.c | 2060.0 ± 35.4 e | 2860.0 ± 35.4 d | 13,550.0 ± 353.6 h | 1110.0 ± 56.6 d | 22.8 ± 0.2 c | 10.2 ± 0.1 d | 325.0 ± 8.5 g | 24.3 ± 0.1 a | ND | 2.0 ± 0.1 b | 0.2±0.1 c | 1.4 | 0.4 | 0.5 | |
| P.j | 1990.0 ± 21.2 e | 3010.0 ± 14.1 c | 19,350.0 ± 495.0 f | 1180.0 ± 49.5 d | 12.8 ± 0.3 d | 11.1 ± 0.3 c | 393.0 ± 7.1 d | 11.0 ± 0.3 d | ND | 0.9 ± 0.1 h | 0.3±0.1 b | 1.5 | 1.0 | 0.9 | |
| Shell and tail | L.v | 1730.0 ± 99.0 f | 2680.0 ± 56.6 e | 23,300.0 ± 282.8 e | 1440.0 ± 99.0 c | 7.5 ± 0.1 e | 6.5 ± 0.2 gh | 493.0 ± 1.4 a | 4.8 ± 0.1 g | ND | 1.2 ± 0.1 f | ND | 1.6 | 1.4 | 0.9 |
| M.r | 982.0 ± 11.3 h | 1050.0 ± 14.1 j | 43,300.0 ± 1555.6 a | 1210.0 ± 77.8 d | 36.7 ± 2.2 a | 5.4 ± 0.3 ij | 461.5 ± 0.7 b | 10.3 ± 0.3 de | ND | 0.8 ± 0.1 h | ND | 1.1 | 0.5 | 0.2 | |
| P.m | 1018.5 ± 44.6 h | 3130.0 ± 42.4 b | 30,200.0 ± 0.0 c | 1750.0 ± 35.4 b | 7.3 ± 0.1 e | 7.1 ± 0.2 fg | 349.0 ± 5.7 f | 10.0 ± 0.4 e | ND | 0.2 ± 0.1 j | ND | 3.1 | 0.7 | 1.0 | |
| F.c | 1640.0 ± 21.2 fg | 2440.0 ± 106.1 g | 27,750.0 ± 70.7 d | 1810.0 ± 106.1 ab | 8.2 ± 0.4 e | 5.1 ± 0.3 j | 418.5 ± 7.8 c | 8.2 ± 0.4 f | ND | 1.6 ± 0.1 d | ND | 1.5 | 0.6 | 0.6 | |
| P.j | 1550.0 ± 28.3 g | 2570.0 ± 35.4 f | 33,600.0 ± 1979.9 b | 1900.0 ± 106.1 a | 2.7 ± 0.2 h | 6.0 ± 0.1 hi | 484.0 ± 11.3 a | 3.2 ± 0.1 h | ND | 0.4 ± 0.2 i | ND | 1.7 | 1.9 | 2.2 | |
| Meat | L.v | 3730.0 ± 155.6 c | 1710.0 ± 77.8 h | 286.0 ± 4.2 i | 426.5 ± 13.4 h | 3.2 ± 0.2 gh | 8.6 ± 0.3 e | 288.5 ± 2.1 i | 3.7 ± 0.1 h | ND | 1.1 ± 0.1 g | ND | 0.5 | 2.3 | 2.7 |
| M.r | 2810.0 ± 70.7 d | 899.5 ± 29.0 k | 269.0 ± 14.1 i | 257.5 ± 5.0 i | 3.0 ± 0.1 h | 7.5 ± 0.1 f | 252.5 ± 2.1 j | 3.9 ± 0.1 h | ND | 1.1 ± 0.1 g | ND | 0.3 | 1.9 | 2.5 | |
| P.m | 3820.0 ± 148.5 bc | 1690.0 ± 49.5 h | 229.0 ± 2.8 i | 394.5 ± 10.6 h | 5.4 ± 0.2 f | 9.5 ± 0.2 a | 312.5 ± 3.5 gh | 3.4 ± 0.1 h | ND | 1.1 ± 0.1 g | ND | 0.4 | 2.8 | 1.8 | |
| F.c | 3970.0 ± 113.1 ab | 1400.0 ± 42.4 i | 352.0 ± 7.1 i | 507.0 ± 15.6 gh | 4.9 ± 0.1 fg | 7.0 ± 0.3 fg | 313.5 ± 6.4 gh | 2.2 ± 0.1 i | ND | 1.7 ± 0.2 c | ND | 0.4 | 3.2 | 1.4 | |
| P.j | 4030.0 ± 42.4 a | 1 420.0 ± 21.2 i | 227.0 ± 12.7 i | 426.5 ± 29.0 h | 3.4 ± 0.1 gh | 8.5 ± 0.1 e | 378.5 ± 6.4 e | 2.3 ± 0.1 i | ND | 3.8 ± 0.1 a | ND | 0.4 | 3.6 | 2.5 |
Publisher’s Note: MDPI stays neutral with regard to jurisdictional claims in published maps and institutional affiliations. |
© 2021 by the authors. Licensee MDPI, Basel, Switzerland. This article is an open access article distributed under the terms and conditions of the Creative Commons Attribution (CC BY) license (https://creativecommons.org/licenses/by/4.0/).
Share and Cite
Liu, Z.; Liu, Q.; Zhang, D.; Wei, S.; Sun, Q.; Xia, Q.; Shi, W.; Ji, H.; Liu, S. Comparison of the Proximate Composition and Nutritional Profile of Byproducts and Edible Parts of Five Species of Shrimp. Foods 2021, 10, 2603. https://doi.org/10.3390/foods10112603
Liu Z, Liu Q, Zhang D, Wei S, Sun Q, Xia Q, Shi W, Ji H, Liu S. Comparison of the Proximate Composition and Nutritional Profile of Byproducts and Edible Parts of Five Species of Shrimp. Foods. 2021; 10(11):2603. https://doi.org/10.3390/foods10112603
Chicago/Turabian StyleLiu, Zhenyang, Qiumei Liu, Di Zhang, Shuai Wei, Qinxiu Sun, Qiuyu Xia, Wenzheng Shi, Hongwu Ji, and Shucheng Liu. 2021. "Comparison of the Proximate Composition and Nutritional Profile of Byproducts and Edible Parts of Five Species of Shrimp" Foods 10, no. 11: 2603. https://doi.org/10.3390/foods10112603
APA StyleLiu, Z., Liu, Q., Zhang, D., Wei, S., Sun, Q., Xia, Q., Shi, W., Ji, H., & Liu, S. (2021). Comparison of the Proximate Composition and Nutritional Profile of Byproducts and Edible Parts of Five Species of Shrimp. Foods, 10(11), 2603. https://doi.org/10.3390/foods10112603