Article

Interfacial Charge-Transfer Engineering in Rare-Earth-Modified ZnO/Nanoporous Cu Heterostructures for Simulated-Solar-Light Methyl Orange Degradation


1
School of Materials Science and Engineering, Nanjing University of Science and Technology, Nanjing 210094, China
2
School of Mechanical Engineering, Nanjing University of Science and Technology, Nanjing 210094, China
3
Fujian Key Laboratory of Flexible Electronics, Strait Institute of Flexible Electronics (SIFE, Future Technologies), Fujian Normal University, Fuzhou 350117, China
*
Authors to whom correspondence should be addressed.
Inorganics 2026, 14(9), 227; https://doi.org/10.3390/inorganics14090227 (registering DOI)
Submission received: 25 July 2026 / Revised: 17 August 2026 / Accepted: 22 August 2026 / Published: 26 August 2026
(This article belongs to the Section Inorganic Materials)

Abstract

The development of simulated-solar-light photocatalysts for methyl orange (MO) removal is limited by insufficient light utilization, rapid photogenerated charge recombination, and restricted interfacial reaction sites. Here, vertically aligned ZnO nanorods on a conductive nanoporous Cu (NPCu) scaffold were modified with low-abundance RE-containing surface species (RE = Ce, Sm, Er, Tm, and Yb). The notation RE(OH)3@ZnO/NPCu is retained solely as an operational sample identifier and does not constitute a crystallographic or stoichiometric phase assignment. XRD resolves the ZnO/NPCu framework, EDS confirms the local presence of RE, and XPS identifies RE-dependent oxidation state and surface oxygen environments; collectively, these measurements do not uniquely establish RE(OH)3 or distinguish hydroxide from oxide, oxyhydroxide, and other hydroxylated/adsorbed surface configurations. The distinguishing feature is a controlled five-RE comparison on one common ZnO/NPCu architecture, together with separate evaluation of NPCu under H2O2-free and H2O2-assisted conditions. Across three independent H2O2-free runs, the Er-modified sample achieved 96.61 ± 0.30% MO degradation within 9 min with kobs = 0.3930 ± 0.0071 min−1. Dosage screening identified 20 μL of 40 wt% H2O2 in 20 mL MO solution (approximately 13.5 mM) as a practical plateau dosage. Photolysis, dark, NPCu/H2O2, and catalyst-removal controls support an additional solid-catalyst-dependent Cu-associated peroxide contribution while not excluding trace homogeneous reactions. Three independent cycling experiments and post-cycle SEM/XRD/EDS support operational durability, although quantitative metal leaching was not measured. Tauc, Mott–Schottky, EIS, temperature-dependent kinetic, and scavenger results are interpreted as comparative descriptors or indirect evidence rather than direct proof of intrinsic band gaps, atom-specific carrier densities, or a unique microscopic mechanism. The AI-assisted component is restricted to exploratory contextualization because reference-grouped validation shows poor out-of-reference generalization. The conclusions are confined to the tested MO system.

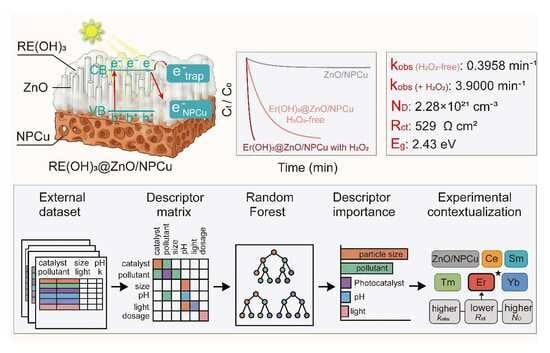
Graphical Abstract

1. Introduction

With the acceleration of industrialization and rapid population growth, global water pollution has become increasingly severe. Refractory organic pollutants discharged from printing and dyeing, pharmaceutical, and chemical industries, such as dyes, antibiotics, and phenolic compounds, persist in aquatic environments and pose serious threats to ecosystems and human health [1,2,3,4,5]. Traditional water treatment technologies, including adsorption, flocculation, and biodegradation, often suffer from secondary pollution, high energy consumption, or incomplete mineralization, making it difficult to meet the requirements of sustainable wastewater remediation [1,2,3,4]. Semiconductor photocatalysis, as a green advanced oxidation technology, can utilize solar energy to generate photogenerated holes (h+) and reactive oxygen species, such as ·OH and ·O2, thereby enabling the oxidative degradation of organic pollutants and their possible further mineralization into CO2 and H2O [5,6,7]. However, the practical efficiency of semiconductor photocatalysis is still largely constrained by insufficient solar light harvesting, rapid photogenerated charge recombination, and limited interfacial reaction sites, which together restrict the overall degradation kinetics of refractory pollutants.
ZnO, a typical n-type wide-bandgap semiconductor with an optical bandgap of approximately 3.37 eV, has been widely investigated as a photocatalyst owing to its low cost, non-toxicity, high electron mobility, and excellent photoelectric properties [6,7,8,9]. However, pristine ZnO suffers from two intrinsic limitations: its wide bandgap restricts light absorption mainly to the ultraviolet (UV) region, which accounts for only a small fraction of the solar spectrum, and the rapid recombination of photogenerated electron–hole pairs leads to poor quantum efficiency and limited photocatalytic activity [6,7,8]. To overcome these drawbacks, extensive efforts have been devoted to engineering ZnO through morphology control, heterojunction construction, coupling with other metal oxides, and bandgap modulation, thereby improving its light-harvesting ability and charge separation efficiency [6,7,8,9]. Among these strategies, constructing vertically aligned ZnO nanorod arrays on conductive supports is particularly attractive because such an architecture can shorten charge transport distances, expose accessible reaction interfaces, and facilitate directional carrier migration. For example, Ag/ZnO nanorod arrays supported on Ni foam and g-C3N4/Fe3O4/ZnO nanorod heterostructures have been reported to achieve efficient degradation of berberine and pantoprazole, respectively, indicating that ZnO nanorod arrays coupled with conductive or heterostructured supports are effective architectures for organic pollutant remediation [10,11]. A recent review likewise identifies compositional tuning and interface engineering as central strategies for improving light utilization and charge separation in ZnO heterostructure photocatalysts while emphasizing stability and practical wastewater operation as continuing challenges [12].
Rare earth (RE) elements have attracted particular attention in photocatalytic modification because of their unique 4f electronic configurations and rich energy levels [13,14,15,16]. RE ion doping or surface loading can introduce localized defect states, promote the formation of oxygen vacancies, act as electron or hole trapping centers, and, in some cases, provide upconversion luminescence, thereby extending the light response of ZnO, suppressing carrier recombination, and facilitating active-species generation [13,14,15,16]. Recent reviews and experimental studies have demonstrated that RE-modified ZnO, including single- and dual-RE systems, exhibits improved photocatalytic degradation performance toward dyes and other organic pollutants under visible or simulated solar light compared with unmodified ZnO [13,14,15,16,17,18,19,20,21]. For example, green-synthesized Ce-doped ZnO nanopetals and Al/Ce co-doped ZnO nanocomposites show enhanced light-driven activity for dye degradation [17,18], while dual-doped Gd3+/Sm3+-ZnO nanoparticles exhibit improved photocatalytic and nonlinear optical properties, indicating the strong influence of RE 4f states on charge dynamics [19]. Electronic structure analyses and recent rare-earth photocatalysis studies further support the role of RE species in regulating ZnO surface/defect states and pollutant degradation behavior [20,21]. Nevertheless, many RE-modified ZnO studies focus on lattice doping or high-temperature oxide formation, where the actual RE location, oxidation state, and interfacial role can be difficult to decouple. In contrast, mild surface treatment can preserve the ZnO/NPCu architecture while introducing low-abundance RE-containing surface species associated with an altered hydroxylated/adsorbate-rich surface oxygen environment. Because the available XRD, XPS, and EDS measurements do not uniquely establish the composition, stoichiometry, or phase identity of these low-abundance deposits, the notation RE(OH)3@ZnO/NPCu is used only as an operational sample identifier. The deposited modifiers are therefore discussed more cautiously as RE-containing surface species rather than as a uniquely identified RE(OH)3 phase.
In addition to modifying ZnO itself, constructing conductive porous scaffolds is an effective strategy to promote carrier transport and suppress photogenerated charge recombination. Nanoporous copper (NPCu), typically prepared by dealloying, possesses interconnected ligaments, open mass-transfer channels, and good electrical conductivity, making it a promising support for semiconductor photocatalysts and Cu-related redox reactions [22,23,24,25,26,27,28]. Recent studies on dealloyed nanoporous Cu and nanoporous Cu-based metamaterials have demonstrated their high activity in Fenton-like degradation of organic pollutants, suggesting that NPCu can provide not only a conductive framework but also accessible Cu-related redox sites for peroxide activation [26,28]. Very recent nanoscale Cu studies provide complementary evidence that Cu electronic state and nanoscale configuration can strongly govern oxidant activation: cysteine-capped Cu nanoclusters promote H2O2-mediated dye degradation through Cu-centered redox chemistry and reactive oxygen species generation, surface-anchored Cu0 nanoparticles enhance H2O2 adsorption and activation through interfacial electron transfer, and Cu sub-nanoclusters can facilitate high-valent Cu intermediates in related peroxymonosulfate-based Fenton-like systems [29,30,31]. Although these nanoscale systems are chemically distinct from NPCu, they underscore the sensitivity of Cu-mediated oxidation chemistry to oxidation state, interfacial electron transfer, and nanoscale structure. In ZnO/NPCu architectures, NPCu can serve not only as a conductive scaffold for electron extraction/transport but also as a Cu-based platform that may participate in H2O2-assisted peroxide activation. To further improve light utilization and mass transfer, ZnO has also been integrated with various three-dimensional conductive skeletons. Hierarchical ZnO nanorod arrays grown on conductive supports can provide a porous and mechanically stable framework with shortened charge transport pathways and enlarged reaction interfaces [32]. Similar design concepts have also been extended to ZnO nanostructures anchored on carbon cloth for photoelectrochemical applications and to three-dimensional printed pyrolytic carbon for solar-light-driven pollutant degradation, highlighting the general benefit of conductive 3D supports in promoting interfacial charge transport and surface reaction processes [33,34]. Meanwhile, hydrothermally tailored ZnO nanomaterials with diverse morphologies have been systematically reviewed, emphasizing that morphology engineering is key to improving charge separation and surface reaction kinetics in photocatalytic processes [35].
Recent studies on copper-based photocatalytic/redox platforms, dealloyed nanoporous Cu for Fenton-like pollutant degradation, ZnO nanorod photocatalysts, rare-earth-regulated ZnO and ZnO-based S-scheme heterojunctions further indicate that efficient multicomponent photocatalysts should be designed by coupling conductive scaffolds, controllable semiconductor morphology, interfacial charge-transfer pathways and surface electronic regulation [10,11,20,21,28,36,37,38]. In a broader context, reviews on semiconductor photocatalysis and heterojunction photocatalysts also emphasize the need to simultaneously optimize light absorption, interfacial charge separation, and surface reaction sites [39,40]. Despite these advances, ternary systems that integrate low-abundance RE-containing surface species, ZnO nanorod arrays, and nanoporous Cu scaffolds into one continuous photocatalytic platform remain scarcely reported. More importantly, the element-specific roles of different RE-containing surface modifiers in regulating apparent electronic descriptors, interfacial charge-transfer resistance, optical absorption, and apparent reaction barriers in ZnO/porous metal heterostructures remain insufficiently clarified. Another unresolved issue is how the same NPCu scaffold can be used beyond electron extraction/transport. When H2O2 is introduced as a controllable peroxide oxidant rather than as a directly added reactive oxygen species (ROS), NPCu may additionally activate H2O2 through Cu-related redox cycling, thereby enabling H2O2-assisted photodegradation enhancement. This dual-function coupling between RE-mediated surface-state regulation and NPCu-associated peroxide activation remains insufficiently examined.
In this work, we constructed ZnO nanorod arrays modified with low-abundance RE-containing surface species on a continuous NPCu scaffold by sequential dealloying, ZnO electrodeposition, and mild postdeposition surface treatment. The distinguishing contribution is the controlled side-by-side comparison of Ce, Sm, Er, Tm, and Yb modifiers on the same ZnO nanorod/NPCu architecture, which permits element-dependent optical, electrochemical, kinetic, and reactive-species descriptors to be compared without simultaneously changing the semiconductor morphology or conductive support. The study also separates the condition-dependent functions of NPCu: under H2O2-free conditions, NPCu is treated primarily as a conductive scaffold and interfacial transport platform, whereas H2O2-assisted controls support an additional solid-catalyst-dependent Cu-associated peroxide-activation contribution. The mild surface treatment, internally controlled five-RE comparison, and dual-regime evaluation constitute the principal advances over conventional RE-doped ZnO powders and standalone nanoporous Cu Fenton-like systems. RE(OH)3@ZnO/NPCu is used only as an operational sample notation, and the AI-assisted analysis is retained solely for exploratory descriptor-level contextualization rather than as the primary novelty or mechanistic proof.

2. Results and Discussion

2.1. Preparation and Characterization of RE-Modified ZnO/NPCu

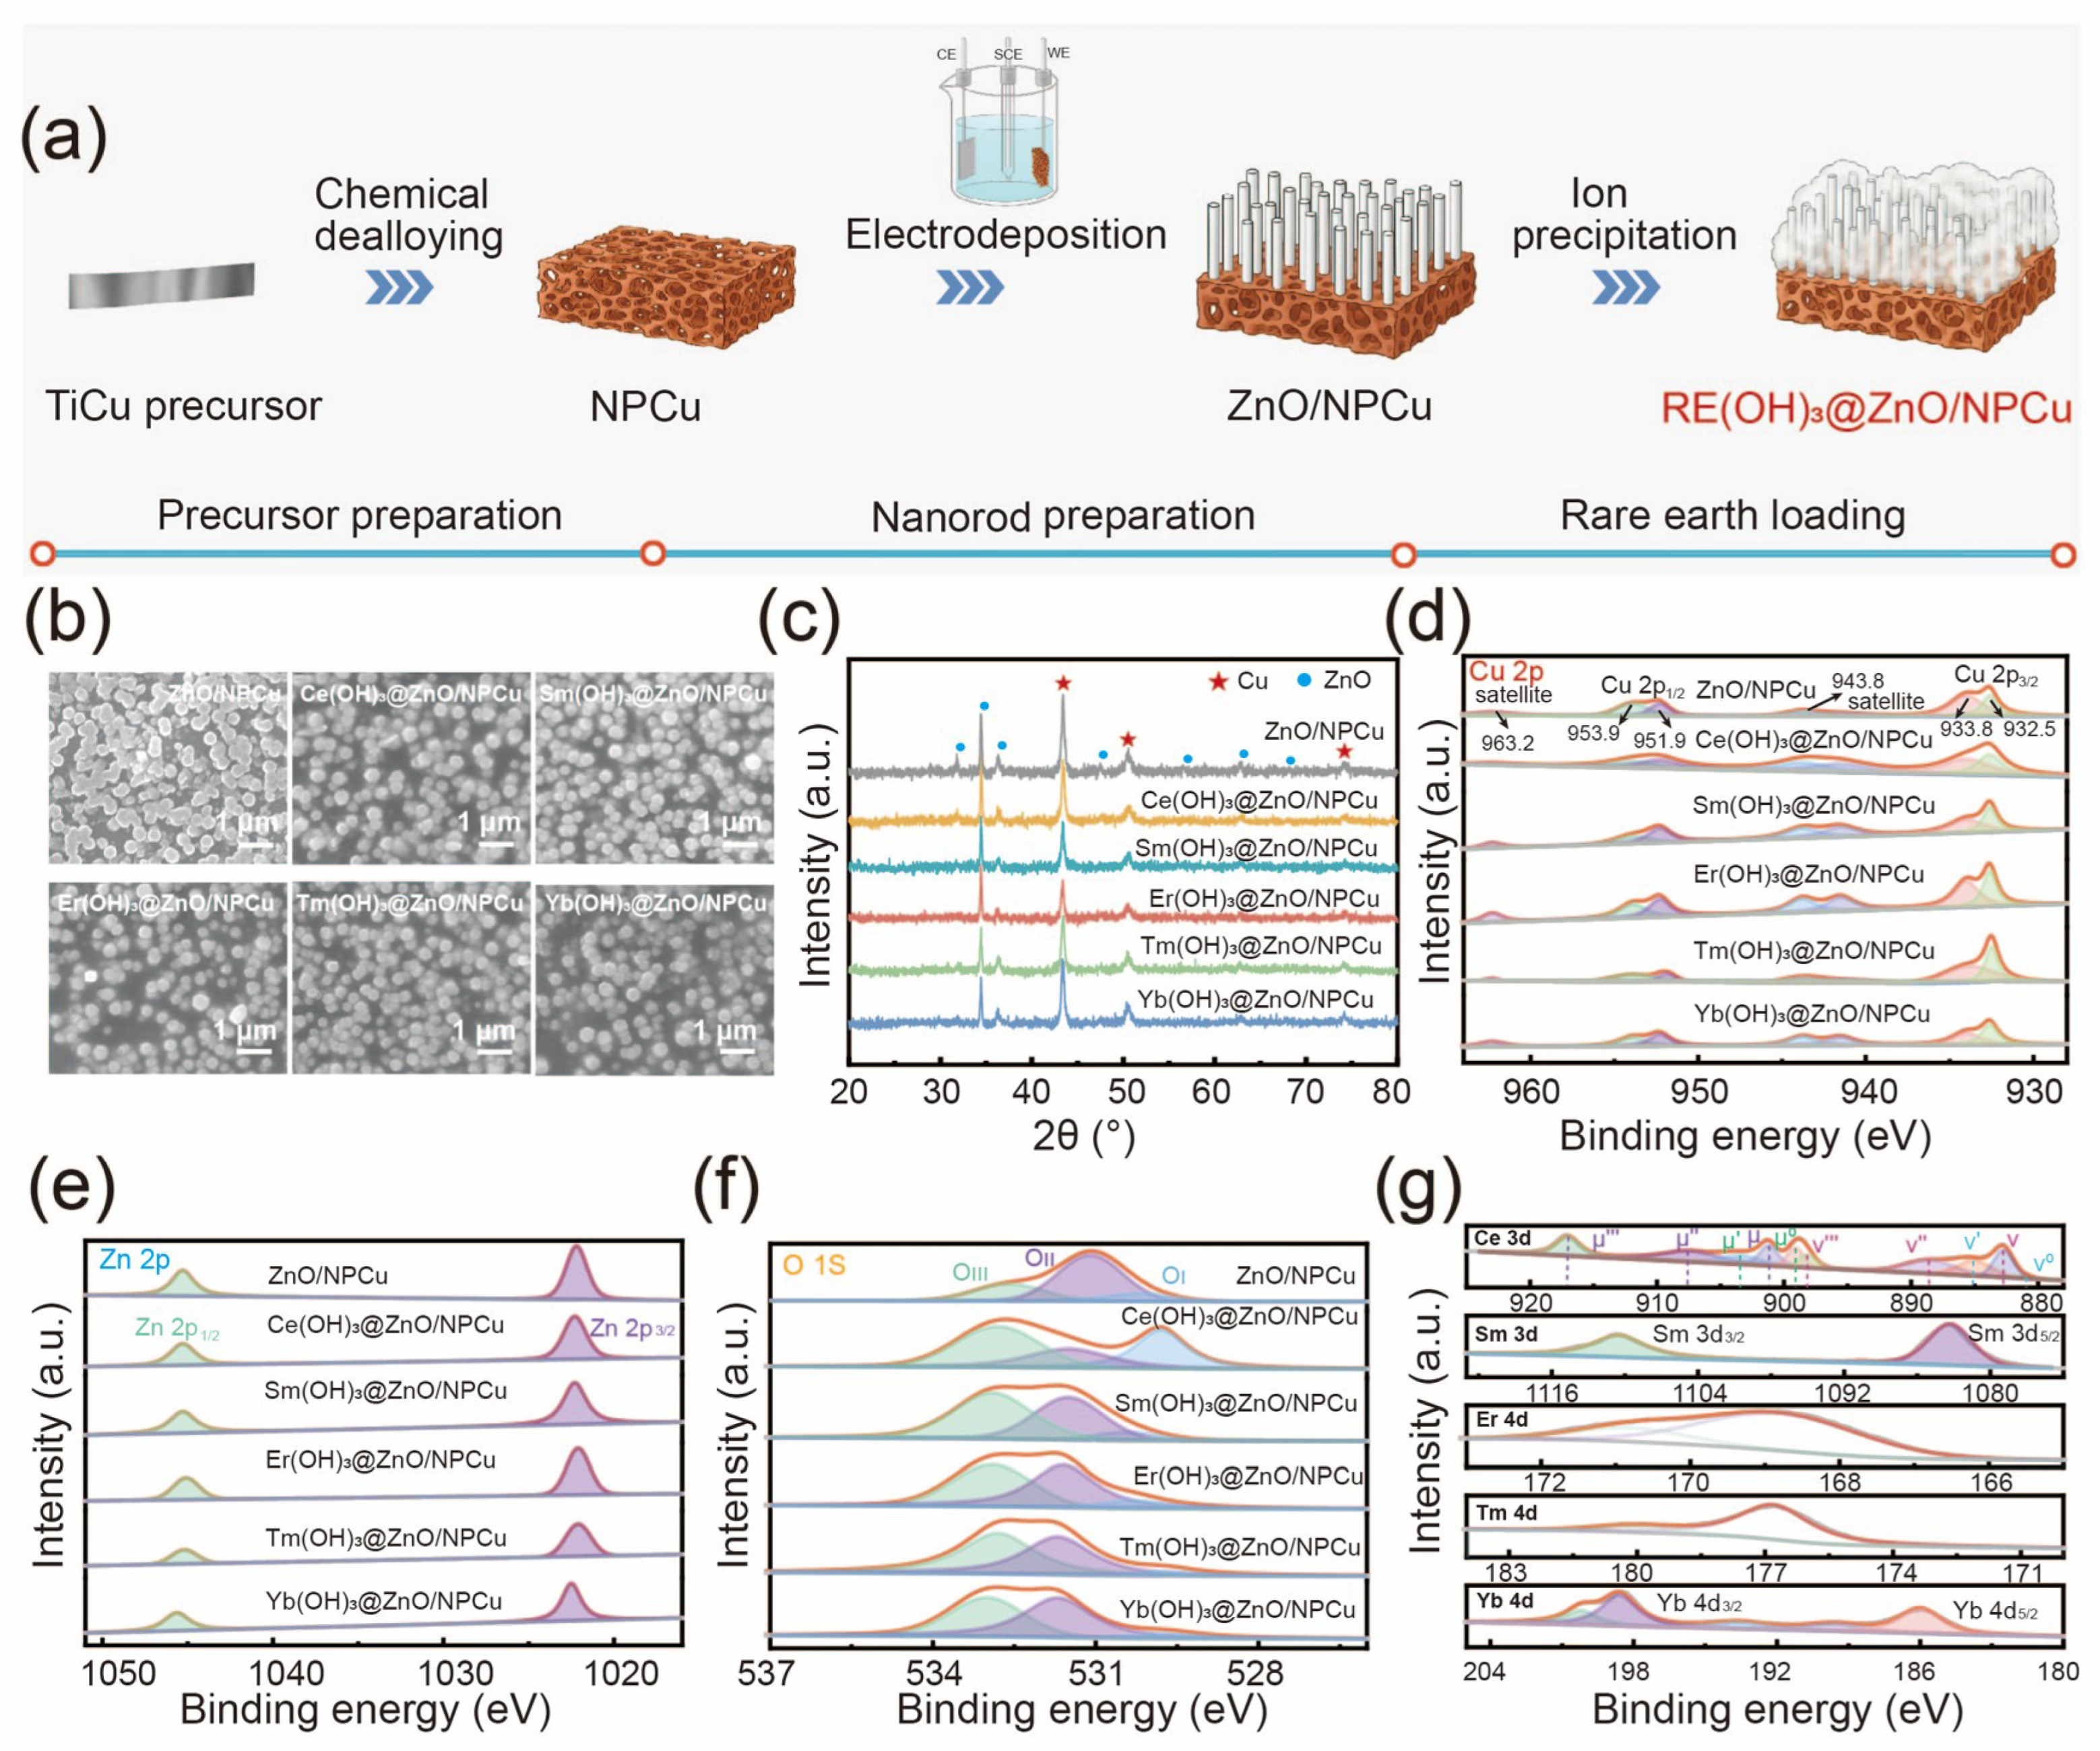
As illustrated in Figure 1a, the heterostructures combine dealloyed NPCu, electrodeposited ZnO nanorod arrays, and a mild RE-containing surface modification treatment. NPCu provides a conductive open scaffold, ZnO nanorods form the primary photoactive array, and the low-abundance RE-containing species provide a surface regulation layer. SEM images in Figure 1b show that the nanorod array framework is retained after RE treatment, while nanoscale surface deposits become more evident.
The local semiquantitative EDS composition of ZnO/NPCu is 26.3 at% Zn, 44.0 at% O, and 29.6 at% Cu (Table S1). The RE-treated samples contain 21.3–29.2 at% Zn, 43.0–53.1 at% O, 16.5–33.7 at% Cu, and 1.2–1.8 at% RE. These results confirm the local presence of the corresponding RE elements in the examined regions but do not establish hydrogen content, chemical bonding, stoichiometry, or phase identity. The corresponding elemental mapping images of the Ce-modified sample are provided in Figure S1. In Figure 1c, the detected diffraction reflections are assigned to hexagonal wurtzite ZnO (P63mc) and face-centered-cubic Cu (Fm−3m). No separate crystalline RE-containing phase is resolved. Given the low RE abundance and the possible presence of highly dispersed, nanocrystalline, or X-ray amorphous deposits, the absence of additional reflections neither establishes nor excludes an RE hydroxide, oxide, or oxyhydroxide configuration. The combined XRD and EDS results therefore support retention of the ZnO/NPCu framework and the presence of low-abundance RE-containing modification, but they do not establish substitutional RE incorporation or a unique RE-containing phase. Consequently, no atomistic RE coordination or crystal lattice model is assigned.
XPS analysis was further performed to extract the surface chemical state and oxidation state information available from the existing spectra. The survey spectra in Figure S2 confirm the presence of Zn, O, Cu, and the corresponding RE elements in the modified samples, consistent with the SEM/EDS results. In the Cu 2p region (Figure 1d), the lower-binding-energy components at approximately 932.5 eV (Cu 2p3/2) and 951.9 eV (Cu 2p1/2) are consistent with reduced Cu0/Cu+-type species, whereas the higher-binding-energy components at approximately 933.8 and 953.9 eV together with the pronounced shake-up satellites at approximately 943.8 and 963.2 eV support Cu2+-containing surface species [22,26,28,29,30,36]. The NPCu surface therefore contains both reduced and oxidized Cu contributions. Because Cu0 and Cu+ have closely overlapping Cu 2p binding energies, the present Cu 2p spectra cannot uniquely separate these two reduced states or establish their quantitative ratio. Accordingly, the XPS data support a redox-active mixed Cu surface environment but are not presented as direct proof of an operando Cu+/Cu2+ catalytic cycle.
The Zn 2p spectra in Figure 1e retain the characteristic Zn2+ response of the ZnO framework after RE treatment. The O 1s spectra in Figure 1f and Table S2 provide comparative information on the surface oxygen environment. OI is assigned mainly to lattice oxygen, whereas OII is treated cautiously as a defect/low-coordination-oxygen-related contribution. OIII is assigned to a combined high-binding-energy contribution arising mainly from surface hydroxyl, adsorbed oxygen, and other adsorbed oxygen-containing species. The relative OIII contribution increases from 24.9% for ZnO/NPCu to 41.4–52.2% for the RE-treated samples, indicating that the surface treatment produces a more hydroxylated/adsorbate-rich oxygen environment. However, this component does not demonstrate that the corresponding oxygen or hydroxyl species are bonded specifically to RE, nor does it establish RE(OH)3 stoichiometry. Similarly, changes in OII are used only as comparative indicators of altered defective or low-coordination surface oxygen chemistry and not as quantitative measurements of oxygen vacancy concentration. Combined with the RE-specific XPS signals and EDS results, these observations support RE-containing surface modification associated with an altered surface oxygen environment, without uniquely distinguishing hydroxide, oxide, oxyhydroxide, or other surface configurations.
The RE-specific high-resolution spectra in Figure 1g further clarify the dominant surface oxidation states. The Ce 3d multiplet contains features associated with both Ce3+ and Ce4+, indicating a mixed-valence Ce surface environment [17,21]. Such coexistence provides a plausible basis for reversible Ce-centered electron exchange, although it does not directly demonstrate photoinduced charge transfer during catalysis. The Sm 3d doublet is consistent with predominantly Sm3+, while the Er 4d, Tm 4d, and Yb 4d spectral envelopes are likewise consistent with predominantly trivalent Er3+, Tm3+, and Yb3+ states, respectively, in agreement with the expected lanthanide chemical states reported for related ZnO/rare-earth systems [13,14,15,16,19,21,41]. These oxidation state assignments do not determine the identities of the coordinating oxygen species. In particular, the mixed Ce3+/Ce4+ envelope argues against assigning the Ce-containing deposit uniquely as phase-pure Ce(OH)3, while the predominantly trivalent Sm, Er, Tm, and Yb signals cannot distinguish the corresponding hydroxides from trivalent oxides, oxyhydroxides, or other oxygen-coordinated surface species. Because the RE signals are low in abundance and exhibit intrinsic multiplet broadening, minor alternative oxidation state contributions cannot be quantified or completely excluded from the present spectra.
Taken together, the XPS data define a surface chemical/electronic state landscape comprising a Zn2+–O framework, mixed reduced/oxidized Cu surface species, mixed Ce3+/Ce4+, predominantly trivalent Sm/Er/Tm/Yb species, and RE-dependent defect/hydroxylated oxygen environments. These chemically resolved differences provide a more rigorous basis for discussing composition-dependent interfacial electronic regulation across the RE series. At the same time, XPS is a ground-state, ensemble-averaged probe and does not directly measure element-specific 4f excitation energies, spatial photogenerated charge localization, or a unique microscopic charge-transfer pathway. RE-related trapping or charge redistribution is therefore retained as a literature-consistent interpretation that is cross-compared with the optical and electrochemical descriptors rather than as an atom-resolved observation.

2.2. Simulated-Solar-Light Photodegradation Performance

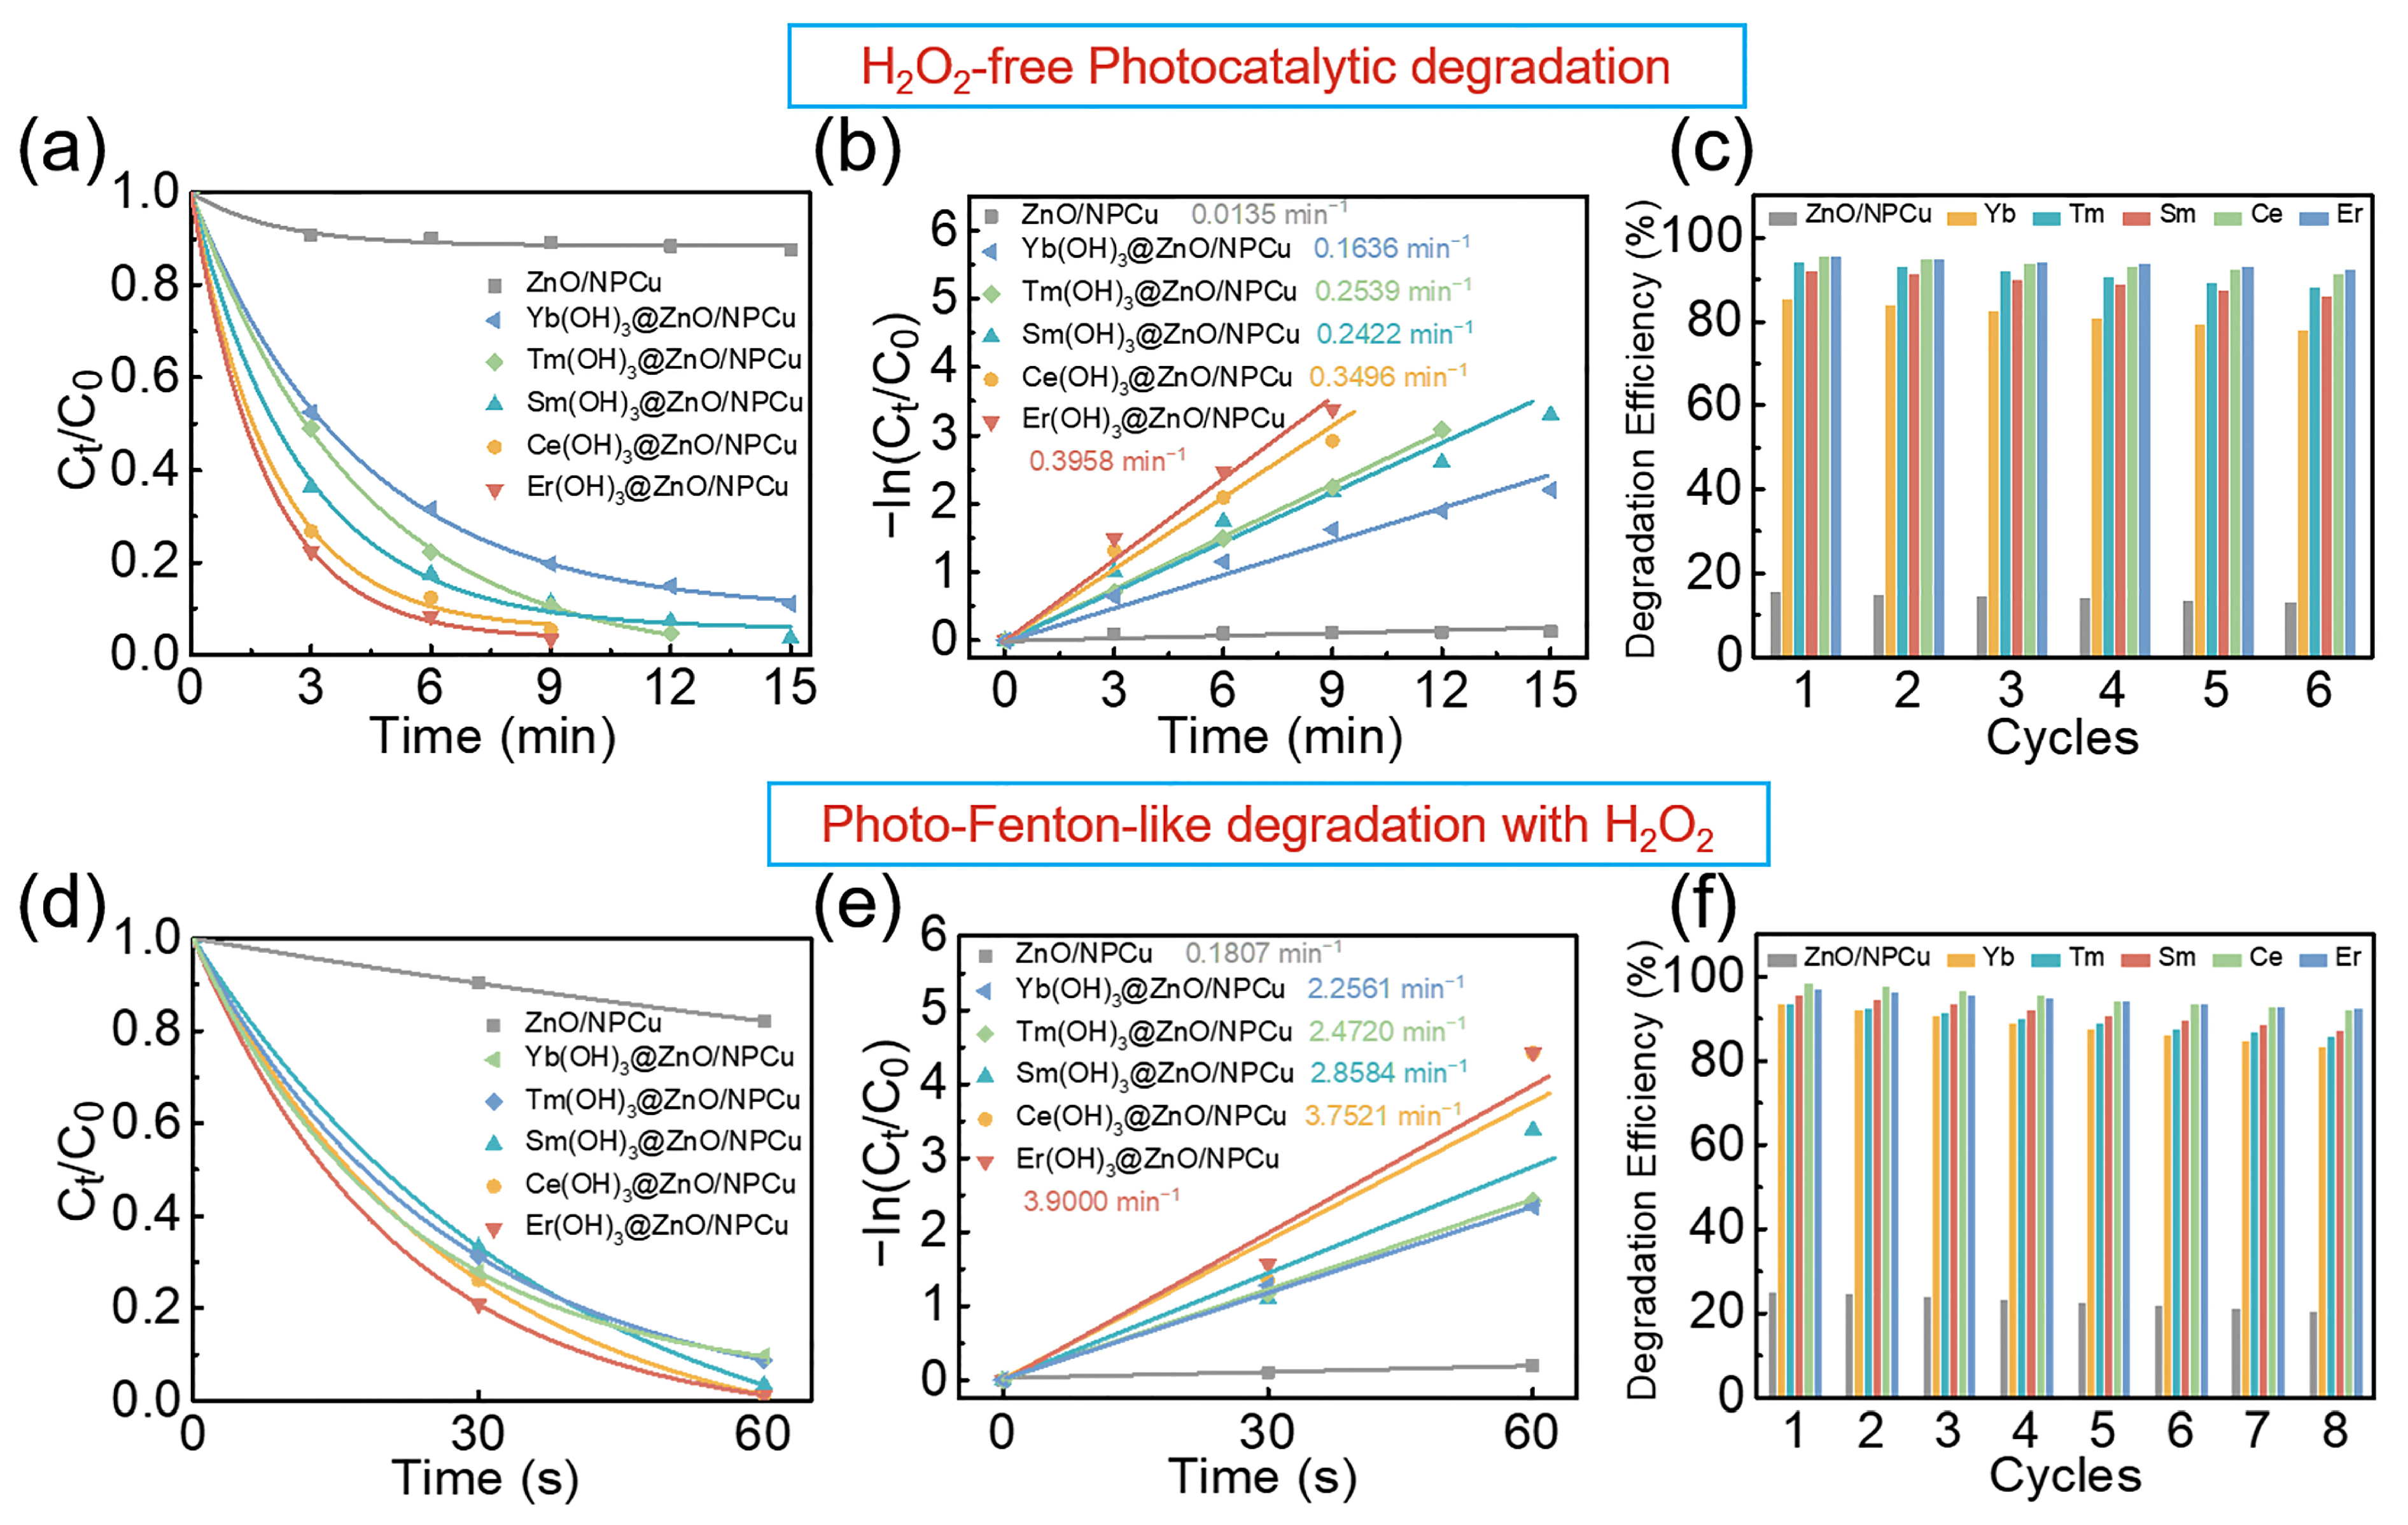
The simulated-solar-light photodegradation performance of ZnO/NPCu and the RE-modified series was evaluated using MO as the model pollutant. The time-dependent UV–vis absorption spectra obtained during the H2O2-free experiments are provided in Figure S3. Figure 2a,b present representative Run 1 H2O2-free data, while independent measurements and statistics are provided in Figure S4 and Tables S3–S5. Across three runs, the activity ranking remained Er > Ce > Tm > Sm > Yb > ZnO/NPCu. The Er-modified sample achieved 96.61 ± 0.30% degradation within 9 min and kobs = 0.3930 ± 0.0071 min−1 (n = 3). Relative to the ZnO/NPCu three-run mean of 0.0120 ± 0.0013 min−1, this is an approximately 33-fold enhancement; the 29.3-fold value applies only to representative Run 1 (0.3958/0.0135). Figure 2a,b use minutes, whereas Figure 2d,e use seconds: the 60 s endpoint in the H2O2-assisted panels is 1 min, not 60 min.
NPOC analysis (Figure S5) showed a decrease from 9.412 to 1.276 mg L−1 in the supernatant after H2O2-free treatment over Er-modified ZnO/NPCu, corresponding to an 86.4% aqueous-phase NPOC decrease. This result provides independent evidence for substantial removal of organic carbon from the aqueous supernatant, while it is not interpreted as conclusive proof of complete mineralization because adsorption or retention of organic species on the catalyst may also contribute to the supernatant decrease. The H2O2-free cycling data in Figure 2c are retained as the representative cycling dataset for the catalyst series.
After the H2O2-free evaluation, H2O2 was introduced as a controllable peroxide oxidant to examine whether the NPCu-containing heterostructures provide an additional peroxide-assisted pathway. Dosage screening for Er-modified ZnO/NPCu (Figure S6 and Tables S6–S8) showed that increasing the amount from 10 to 20 μL of 40 wt% H2O2 in 20 mL of MO solution strongly increased the degradation rate, whereas further increases to 30–60 μL produced only marginal additional improvement. Therefore, 20 μL (approximately 13.5 mM H2O2) was selected as the practical dosage for subsequent tests. Figure 2d,e retain the representative H2O2-assisted comparison, in which Er-modified ZnO/NPCu and Ce-modified ZnO/NPCu show kobs values of 3.9000 and 3.7521 min−1, respectively. For the representative Er-modified sample, kobs increased from 0.3958 min−1 without H2O2 to 3.9000 min−1 with H2O2, an approximately 9.85-fold increase; the corresponding endpoints were 96.6% at 9 min and 97.80% at 60 s (1 min), respectively.
Control experiments (Figure S7 and Tables S9 and S10) clarify the contributions of photolysis, H2O2, and NPCu. After 60 s, MO + light, MO + H2O2 + light, and NPCu + MO + light showed only 1.90%, 5.40%, and 6.60% degradation, respectively, whereas NPCu + MO + H2O2 + light reached 45.20%. The complete Er-modified ZnO/NPCu + H2O2 + light system reached 97.80%, while the corresponding dark system reached 26.90%. These controls show that H2O2 photolysis alone cannot account for the rapid degradation and that the presence of NPCu markedly enhances the H2O2-containing system. In the catalyst-removal experiment (Table S11), removal of the solid Er-modified ZnO/NPCu catalyst after 30 s strongly suppressed subsequent degradation: the catalyst-removal system increased only from 85.90% at 30 s to 89.30% at 120 s, whereas the complete system reached 97.80% by 60 s. This result argues against a dominant homogeneous contribution to the rapid reaction, although trace dissolved metal contributions cannot be excluded without quantitative solution-phase elemental analysis. An unsupported ZnO-only catalyst, a separately quantified dark adsorption curve, and a colorless probe pollutant were not available. The conclusions are therefore confined to RE effects within the supported ZnO/NPCu architecture and to MO, and a dye sensitization contribution is not experimentally excluded.
Independent H2O2-assisted ZnO/NPCu measurements (Table S12) gave a 60 s degradation efficiency of 17.13 ± 1.60% (n = 3), confirming the comparatively low activity of the unmodified parent under the same peroxide-assisted condition. For Er-modified ZnO/NPCu, three independent eight-cycle experiments (Figure S8 and Table S13) yielded 97.30 ± 0.80% degradation in cycle 1 and 92.37 ± 0.51% in cycle 8. Post-cycle SEM (Figure S9) shows that the overall surface morphology is largely retained, while XRD (Figure S10) preserves the principal crystalline features without an obvious new crystalline phase. EDS still detects Cu, Zn, Er, and O after eight cycles (Table S14), although the local semiquantitative surface composition changes. These post-cycle data support retention of the principal catalyst architecture during repeated H2O2-assisted operation without being interpreted as quantitative evidence of zero metal leaching. Here, stability denotes activity retention and preservation of principal morphology/crystalline features during repeated operation; formation energies, interfacial binding energies, and other atomistic thermodynamic stability quantities were not determined.
To provide a broader and more recent benchmark, Table 1 compares the present Er-modified ZnO/NPCu system with 14 representative ZnO-based photocatalysts reported mainly during 2022–2026. The selected studies span noble-metal-modified ZnO, rare-earth-modified ZnO, ZnO heterojunctions, and conductive/multicomponent architectures. Removal efficiency and apparent kinetic constants are listed separately to distinguish endpoint performance from reaction kinetics. Under H2O2-free conditions, the present Er-modified supported array exhibits a comparatively high apparent rate constant of 0.3930 ± 0.0071 min−1 together with 96.61 ± 0.30% MO degradation within 9 min. H2O2 addition further increases the representative apparent rate constant to 3.9000 min−1, but this oxidant-assisted result is considered separately from conventional photocatalytic systems. Because pollutant identity and concentration, catalyst loading and form, irradiation spectrum and intensity, reactor geometry, adsorption protocols, and auxiliary oxidants vary substantially among studies, Table 1 is intended as descriptive benchmarking rather than a normalized ranking of intrinsic photocatalytic activity.

2.3. Optical Properties, Interfacial Charge Behavior and Kinetic Analysis

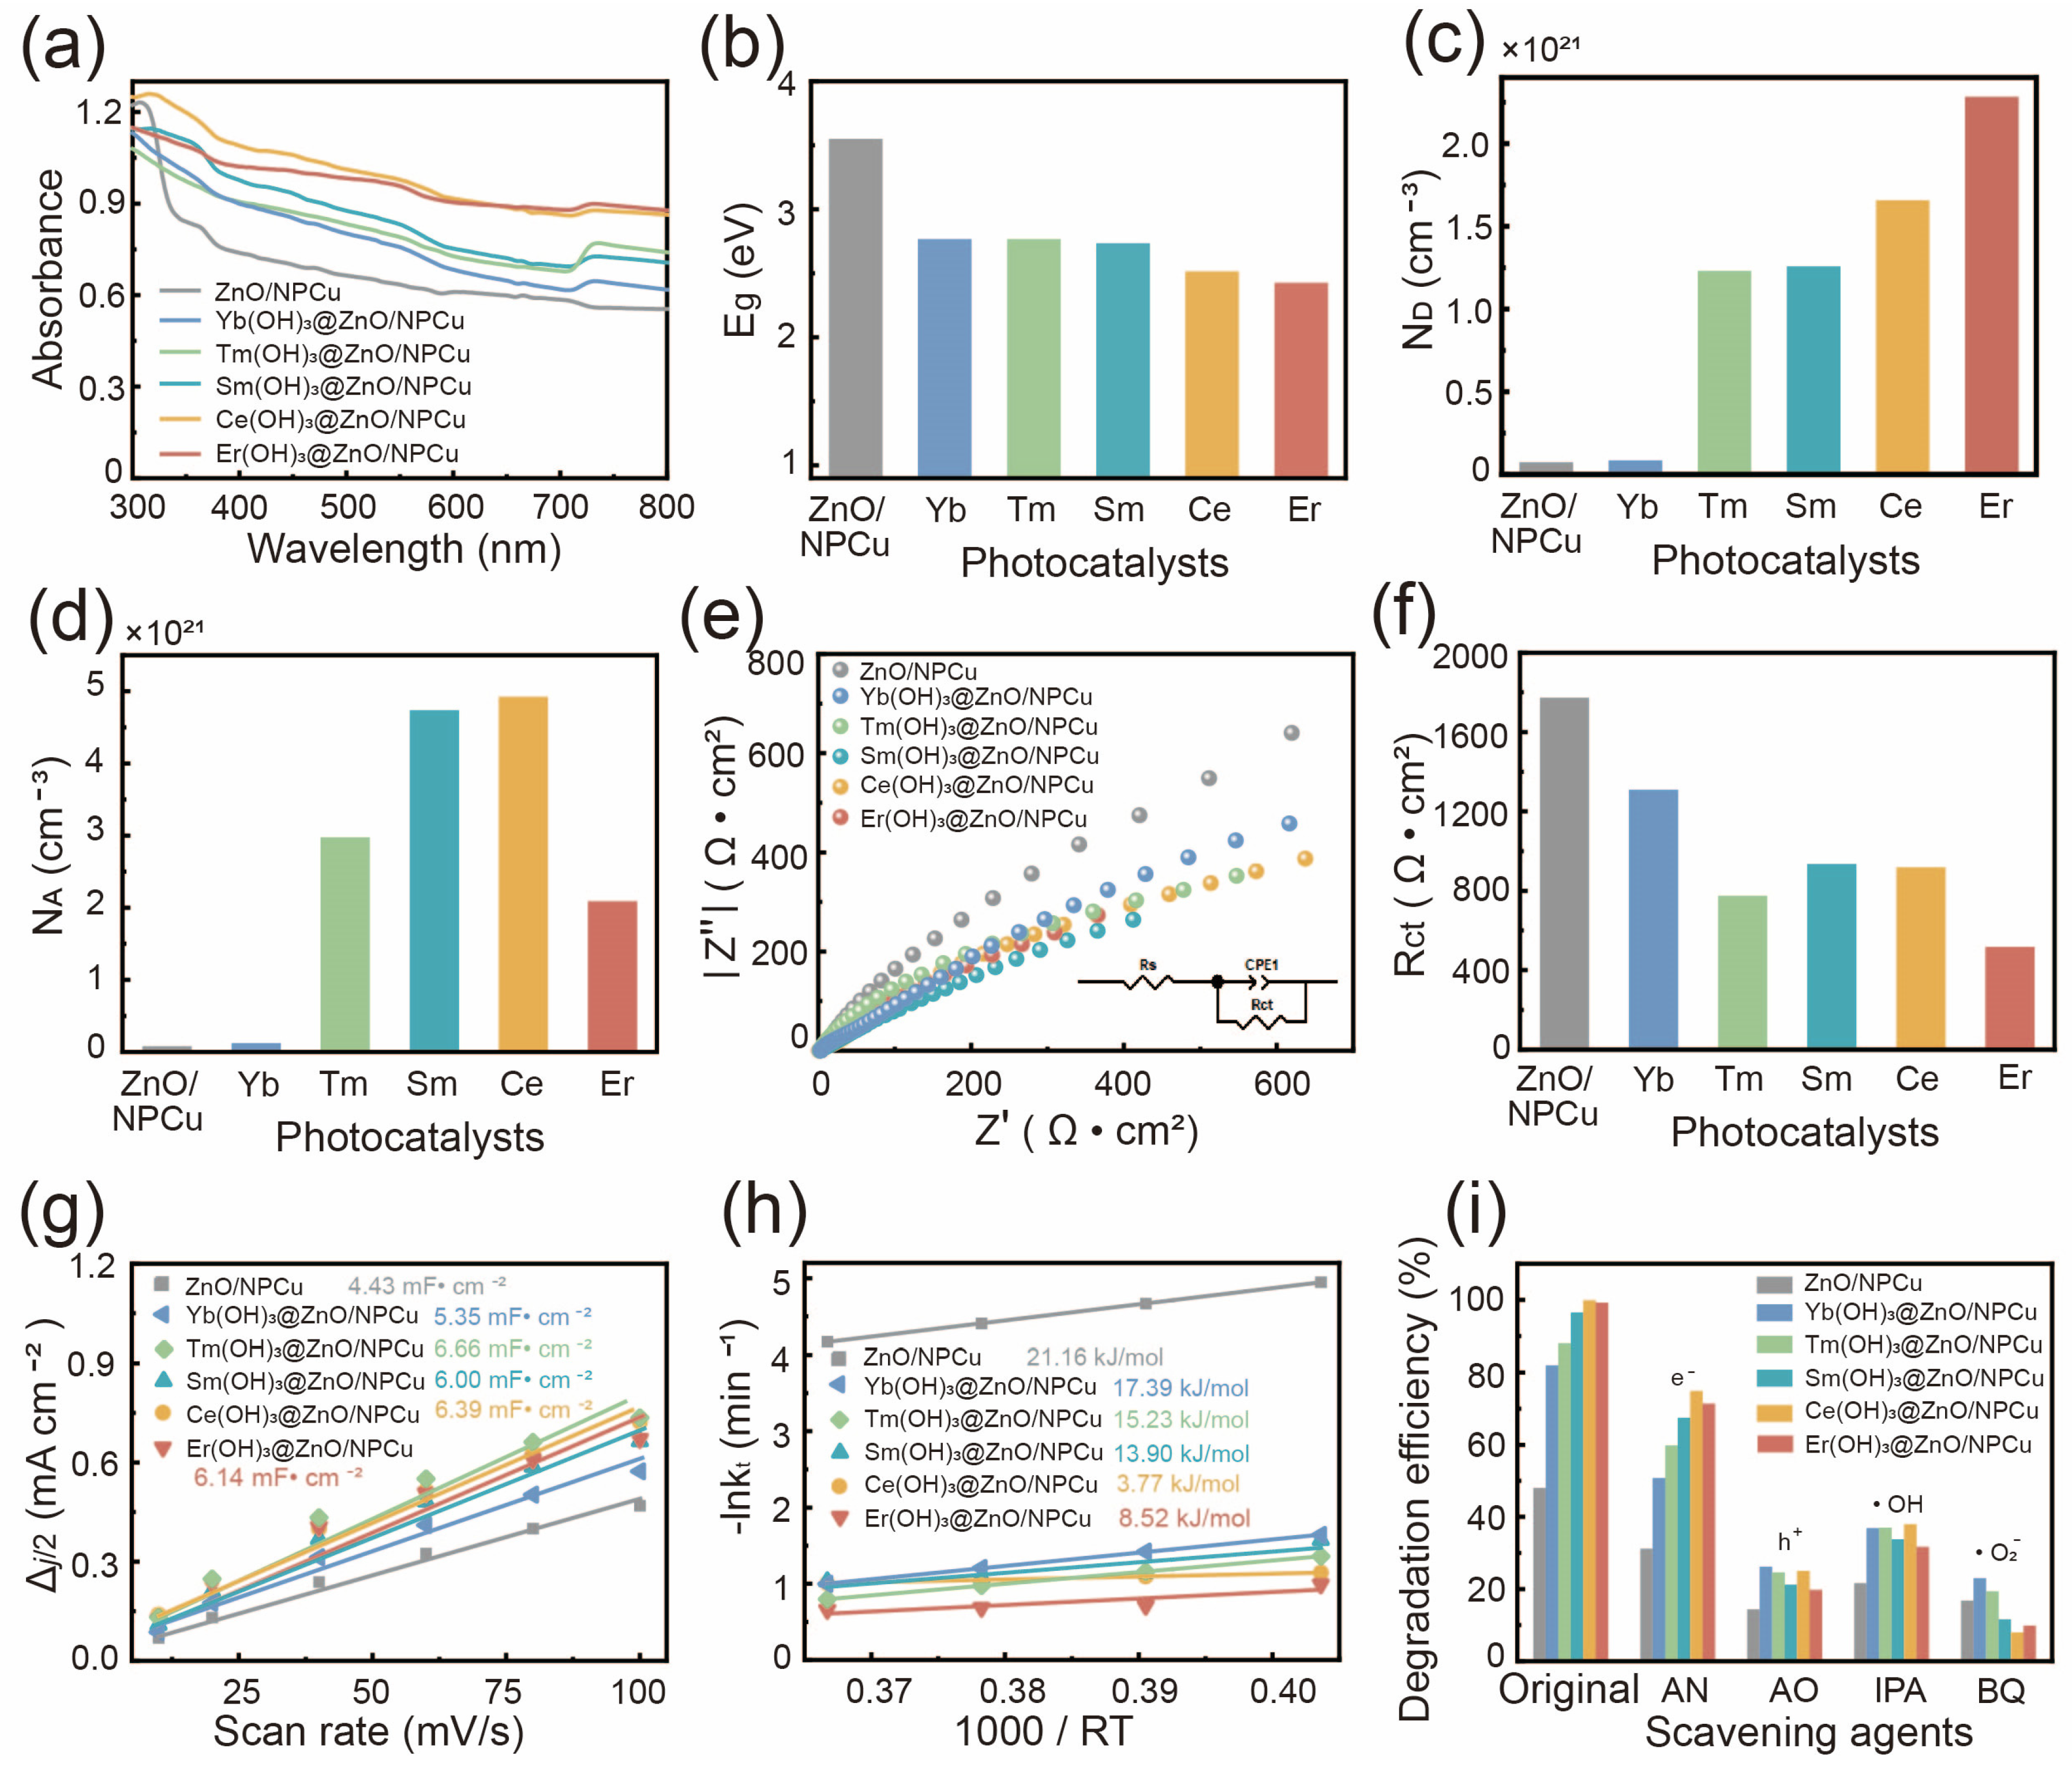
UV–vis DRS and Tauc extrapolations were used to compare heterostructure-level optical responses (Figure 3a,b and Figure S11) [53]. ZnO/NPCu gives an apparent Eg of 3.549 eV, while the RE-modified electrodes give apparent Eg values of 2.427–2.767 eV. These values indicate altered apparent absorption edges after surface treatment. They are not intrinsic ZnO band gaps: metallic NPCu absorption, interfacial and RE-related surface states, diffuse scattering, and hierarchical light harvesting can all contribute. The selected Tauc extrapolations are shown in Figure S11, but numerical fitting-window metadata were not retained; the values are therefore used only as approximate comparative optical edge descriptors [13,14,15,16,20,21,37,46].
The strongly nonlinear Mott–Schottky plots contain selected local positive- and negative-slope segments (Figure S12). For these porous, multicomponent, metal-supported electrodes, slope sign alone does not establish coexisting intrinsic n-type and p-type semiconductor phases. The local segments are therefore used only to derive within-series ND and NA descriptors (Figure 3c,d). They cannot be assigned uniquely to individual RE atoms or specific MO adsorption sites and may combine space-charge, surface-state, interfacial, double-layer, frequency dispersion, and NPCu contributions. Because the retained data do not include frequency-series validation, numerical fitting-window metadata, or independent repeats, these descriptors are not used as standalone proof of carrier type or density.
The apparent ND values are 7.34 × 10¹⁹, 8.40 × 10¹⁹, 1.23 × 10²¹, 1.26 × 10²¹, 1.66 × 10²¹, and 2.28 × 1021 cm−3 for ZnO/NPCu, Yb-modified ZnO/NPCu, Tm-modified ZnO/NPCu, Sm-modified ZnO/NPCu, Ce-modified ZnO/NPCu, and Er-modified ZnO/NPCu, respectively; the corresponding apparent NA values are 5.71 × 10¹⁹, 9.81 × 10¹⁹, 3.00 × 10²¹, 4.77 × 10²¹, 4.95 × 10²¹, and 2.12 × 1021 cm−3. These values are retained as comparative descriptors of the electrochemical response and are not used as standalone proof of a unique carrier-type mechanism. XPS provides qualitative context for changes in defective oxygen and hydroxylated surface environments but does not identify atom-resolved donor, acceptor, or adsorption sites.
Electrochemical impedance spectroscopy (EIS) was used to compare interfacial charge-transfer behavior. The representative Nyquist plots and fitted Rct values are shown in Figure 3e,f. The fitted Rct values are 1784, 1320, 786, 946, 929, and 529 Ω·cm2 for ZnO/NPCu, Yb-modified ZnO/NPCu, Tm-modified ZnO/NPCu, Sm-modified ZnO/NPCu, Ce-modified ZnO/NPCu, and Er-modified ZnO/NPCu, respectively. Repeated fitting of the same experimental impedance datasets using different reasonable initial guesses produced CV values of 0.87–1.23% (Table S15), indicating numerically stable parameter extraction. These repeated fits assess fitting robustness and are not presented as independent electrochemical replicate measurements. Accordingly, the lower fitted Rct of the Er-modified electrode is interpreted as being consistent with more favorable interfacial charge-transfer characteristics relative to ZnO/NPCu, rather than as direct proof of a specific microscopic transfer pathway.
The double-layer capacitance analysis in Figure 3g provides an additional electrochemical descriptor of the accessible interface. The corresponding CV curves are shown in Figure S13. The Cdl values are 4.43, 5.35, 6.66, 6.00, 6.39, and 6.14 mF cm−2 for ZnO/NPCu, Yb-modified ZnO/NPCu, Tm-modified ZnO/NPCu, Sm-modified ZnO/NPCu, Ce-modified ZnO/NPCu, and Er-modified ZnO/NPCu, respectively. Because the largest Cdl does not coincide with the highest photocatalytic activity, Cdl is treated only as an electrochemical accessibility/charge accumulation descriptor rather than as a direct predictor of catalytic performance.
Temperature-dependent kinetic analysis was conducted without H2O2 using the same simulated solar reactor geometry (Figure 3h and Figure S14). The derived apparent activation energies therefore describe the temperature dependence of the H2O2-free MO degradation process. Ce-modified ZnO/NPCu gives the lowest apparent activation energy of 3.77 kJ mol−1, whereas Er-modified ZnO/NPCu retains a relatively low value of 8.52 kJ mol−1 while showing the highest overall degradation activity. The comparison is interpreted descriptively, reinforcing that no single kinetic or electrochemical descriptor alone determines the activity ranking. These values are apparent overall kinetic barriers under continuous irradiation; they do not yield ΔH°, ΔG°, or Keq and do not prove a substitutional RE-doped structure or specific RE coordination complex.
The scavenger trapping experiments in Figure 3i were conducted under H2O2-free conditions using 1 mM scavengers and therefore reflect the active species involved in the ordinary photocatalytic pathway rather than the H2O2-assisted process. The inhibition caused by AN, AO, IPA and BQ supports the participation of electrons, holes, ·OH and ·O2, respectively, consistent with typical active-species trapping analysis in semiconductor photocatalysis [39,40]. For the representative high-performance Er-modified ZnO/NPCu sample, the degradation efficiency decreases from 99.2% without scavengers to 71.4%, 19.8%, 31.7% and 9.9% after adding AN, AO, IPA and BQ, respectively. The strongest inhibition by BQ and AO is consistent with comparatively important ·O2- and h+-associated contributions in the photocatalytic pathway, while the marked suppression by IPA supports an important contribution of ·OH. The relatively weaker inhibition by AN suggests that photogenerated electrons may participate indirectly by driving O2 reduction and subsequent active-species generation rather than acting as the final oxidizing species. The moderate differences among RE-modified samples indicate that RE-containing surface regulation does not fundamentally alter the main reactive-species pathway but is associated with altered charge-transfer, oxygen activation, and active-species generation behavior. Because EPR, transient photocurrent, and photoluminescence measurements were not performed, these assignments remain indirect and non-unique.
Taken together, the within-series results associate the strong performance of the Er-modified sample with a favorable combination of apparent Eg = 2.427 eV, the highest apparent ND (2.28 × 1021 cm−3), and the lowest fitted Rct (529 Ω cm2). The Ce-modified sample shows the highest apparent NA (4.95 × 1021 cm−3) and the lowest apparent Ea,app, yet it does not exceed Er in overall kinetics. The absence of a single monotonic trend across Ce, Sm, Er, Tm, and Yb indicates that the observed RE dependence is consistent with coupled contributions from RE-related surface states, defect/hydroxylated surface chemistry, interfacial transport, and active-species generation rather than being determined by atomic number or any one measured descriptor. Element-specific excitation and spatial charge localization were not measured.

2.4. AI-Assisted Contextual Descriptor Analysis

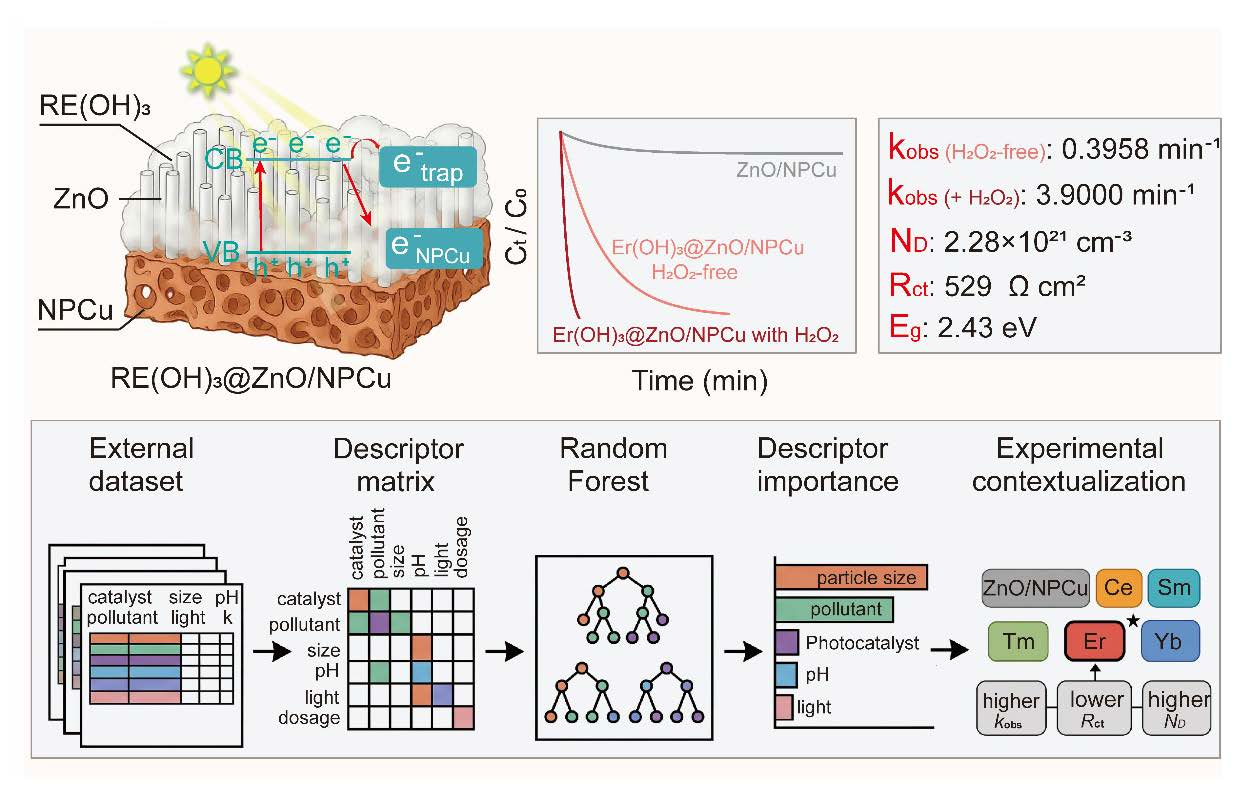
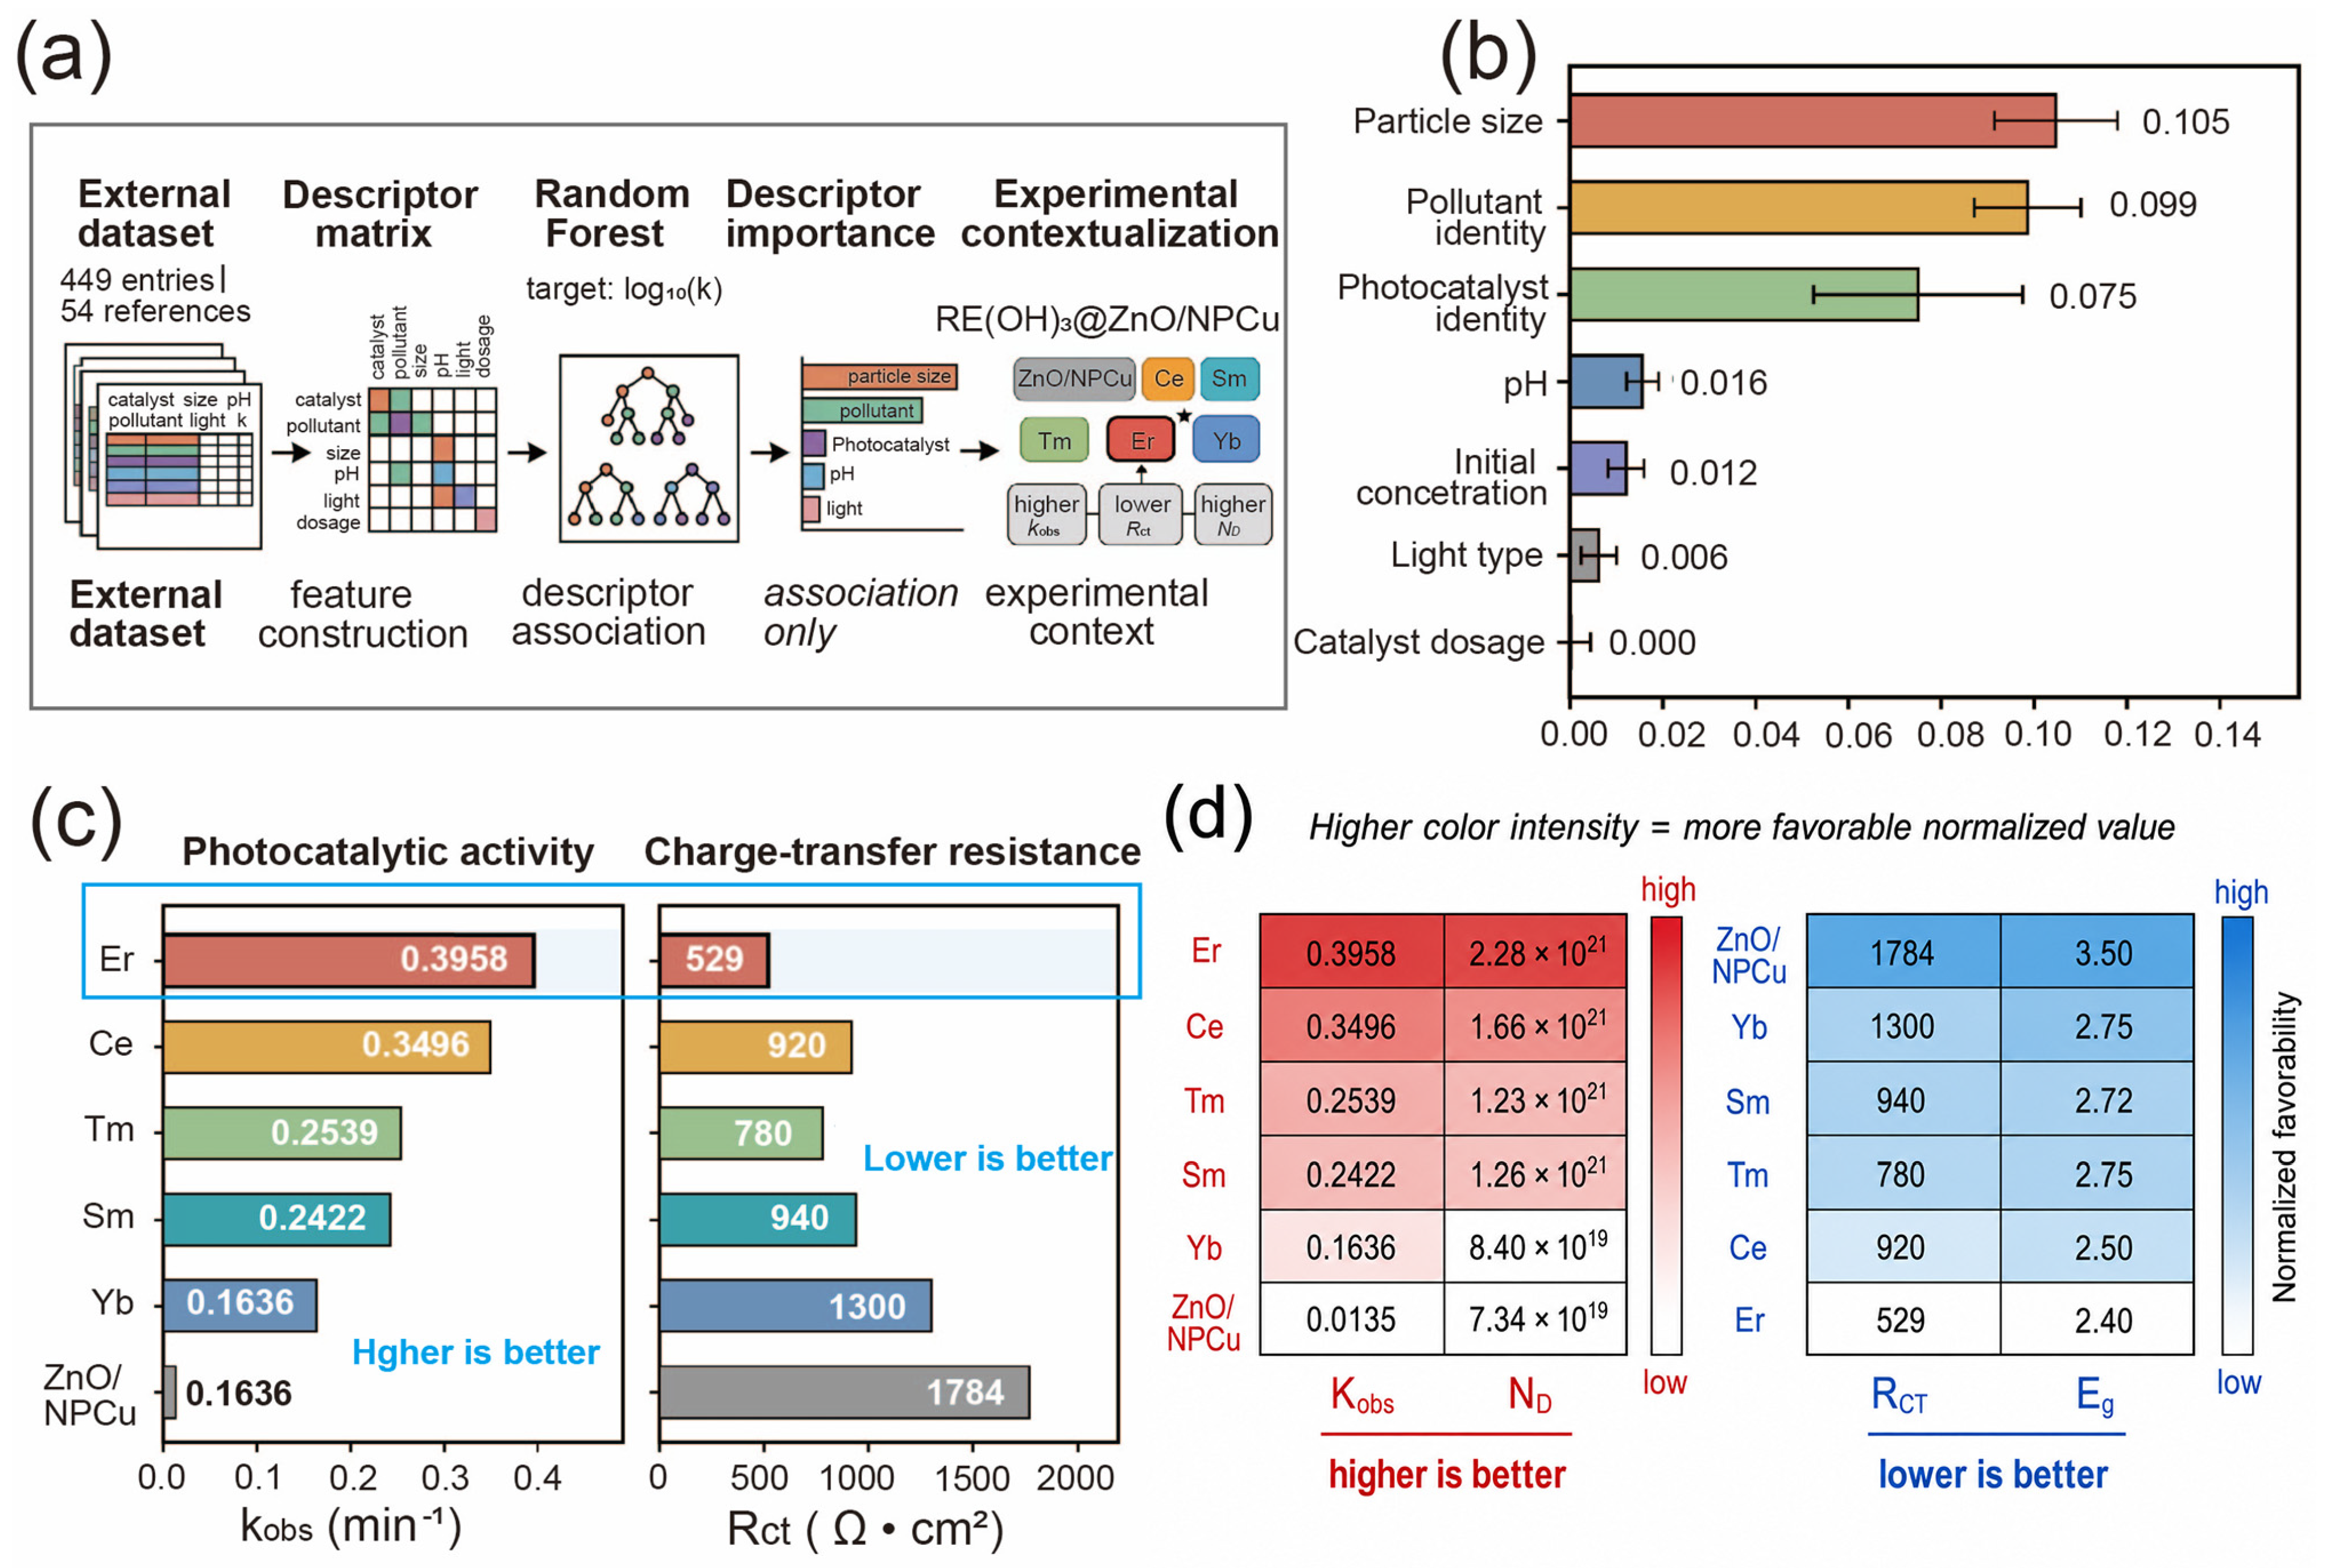
The AI-assisted component is retained only as a shortened exploratory context. For the external dataset (449 entries; 54 references), Random Forest gave R2 = 0.608 under a random 80/20 split, whereas reference-grouped five-fold validation gave R2 = −0.692 ± 1.760, RMSE = 0.523 ± 0.076, and MAE = 0.426 ± 0.059 (Tables S16 and S17). The negative grouped R2 shows poor out-of-reference generalization and substantial source dependence. Random Forest, Extra Trees, and Gradient Boosting performed similarly under the random split (R2 = 0.608, 0.606, and 0.594; Table S19); Random Forest is not claimed to be statistically or uniquely superior.
Permutation importance (Figure 4b; Table S18) is interpreted only as within-dataset association. The six internally prepared electrodes were not used to train the external model and are insufficient for standalone machine learning. Their kobs, Rct, ND, and Eg values are shown only as a descriptive multidescriptor comparison. Accordingly, the AI analysis neither predicts the present catalysts nor supports Figure 5, and it is not a primary innovation of this work.

2.5. Proposed Photodegradation Mechanism

Figure 5 presents an experimentally anchored but non-unique mechanistic hypothesis and is not AI-derived; it was not generated, selected, or mechanistically determined by the AI analysis. The H2O2-free branch is based on structural/XPS, optical, comparative electrochemical, kinetic, and scavenger results. ZnO is the primary light absorber and source of electron–hole pairs. Low-abundance RE-containing surface species may modify surface-state trapping/redistribution, while NPCu is interpreted primarily as a conductive support and electron extraction/transport pathway that can facilitate electron transfer toward adsorbed O2. These assignments are consistent with the combined descriptors and scavenger inhibition but are not direct observations of atom-specific excitation, charge localization, or an elementary transfer sequence [13,14,15,16,20,21,22,26,28,36,39,40].
When H2O2 is added, the support/transport role of NPCu remains and a Cu-associated peroxide activation contribution is additionally proposed from the controls. H2O2 photolysis was weak; NPCu + H2O2 + light was markedly more active than NPCu + light; the complete catalyst/H2O2/light system was faster still; and rapid degradation was not sustained after solid-catalyst removal (Figure S7; Tables S9–S11). These observations support an important solid-catalyst-dependent contribution and argue against a dominant homogeneous pathway, but they do not resolve a specific Cu+/Cu2+ cycle or exclude trace dissolved metal reactions without quantitative solution-phase elemental analysis. Very recent Cu nanocluster, Cu0 nanoparticle, and Cu sub-nanocluster studies independently demonstrate that nanoscale Cu electronic/oxidation states and interfacial electron transfer can strongly regulate H2O2 or related oxidant activation [29,30,31]. These reports provide current mechanistic context for a Cu-associated peroxide contribution, but they are not used to assert that the same elementary Cu redox sequence occurs in the present NPCu system.
Accordingly, Figure 5 distinguishes H2O2-free photochemistry from the additional H2O2-assisted branch. The preexisting schematic uses H2O and CO2 as simplified terminal mineralization products; this graphical endpoint is not interpreted as experimental proof of complete mineralization because the single NPOC measurement cannot establish complete conversion to CO2. EPR, operando Cu spectroscopy, transient photocurrent, and photoluminescence were not performed; the detailed radical and charge-transfer sequence therefore remains a qualified hypothesis.

3. Materials and Methods

3.1. Materials

Ti40Cu60 amorphous ribbons were used as the precursor for the fabrication of nanoporous Cu (NPCu) substrates. The zinc salt precursor, supporting electrolyte, sodium hydroxide (NaOH), hydrofluoric acid (HF), cerium nitrate hexahydrate (Ce(NO3)3·6H2O), samarium nitrate hexahydrate (Sm(NO3)3·6H2O), erbium nitrate hexahydrate (Er(NO3)3·6H2O), thulium nitrate hexahydrate (Tm(NO3)3·6H2O), and ytterbium chloride hexahydrate (YbCl3·6H2O) were purchased from Sigma-Aldrich, USA. Methyl orange (MO), used as the model organic pollutant in the photocatalytic degradation experiments, was obtained from Shanghai Chemical Reagent Company, China. Hydrogen peroxide (H2O2), used in the H2O2-assisted photodegradation experiments, was purchased from Macklin, China. Deionized water was used throughout the study for solution preparation, washing, and rinsing. All chemicals were of analytical grade and used as received without further purification.

3.2. Preparation of the Nanoporous Cu Substrate

The nanoporous Cu substrate was prepared by chemical dealloying of TiCu amorphous ribbons. Briefly, the TiCu ribbons were immersed in an appropriate dealloying solution (0.02 M HF) under controlled conditions for 90 min to selectively remove the less noble component, thereby generating a three-dimensional bicontinuous nanoporous Cu framework. After dealloying, the obtained NPCu substrate was thoroughly washed with deionized water and dried prior to subsequent ZnO deposition.

3.3. Electrodeposition of ZnO Nanorod Arrays on NPCu

ZnO nanorod arrays were grown on the NPCu substrate by electrodeposition. The electrolyte contained zinc nitrate, ammonium acetate, and hexamethylenetetramine (HMTA). NPCu served as the working electrode, and a saturated calomel electrode (SCE) was used as the reference electrode. Electrodeposition was conducted at −1 V versus SCE and 70 °C for 5 min, leading to the formation of vertically aligned ZnO nanorods on the NPCu ligaments. The as-prepared ZnO/NPCu samples were rinsed with deionized water and dried for subsequent surface modification. The reagent concentrations and counter-electrode identity are not reported because they were not available in the retained record.

3.4. Surface Modification with RE-Containing Species

The RE-modified ZnO/NPCu samples were prepared through a rapid surface treatment procedure. ZnO/NPCu was first immersed in 0.01 M NaOH solution to establish a locally alkaline surface environment and was then immersed for 90 s in a 0.01 M aqueous solution containing Ce3+, Sm3+, Er3+, Tm3+, or Yb3+. After treatment, the samples were thoroughly washed and dried. For continuity with the original experimental records, figures, and datasets, the samples are operationally coded as Ce(OH)3@ZnO/NPCu, Sm(OH)3@ZnO/NPCu, Er(OH)3@ZnO/NPCu, Tm(OH)3@ZnO/NPCu, and Yb(OH)3@ZnO/NPCu. These codes identify the corresponding RE treatment conditions and are not assignments of composition, stoichiometry, crystallinity, or phase. Accordingly, the deposited modifiers are described throughout the manuscript as RE-containing surface species. The available XRD, XPS, and EDS results do not uniquely establish an RE(OH)3 phase or exclude oxide, oxyhydroxide, and other hydroxylated/adsorbed surface configurations.

3.5. Material Characterization

Crystal-phase information was examined by X-ray diffraction (XRD, Cu Kα, Bruker-AXS D8, Karlsruhe, Germany). Surface morphology and elemental distributions were examined by field emission scanning electron microscopy (SEM, Quanta FEG 250, Thermo Fisher Scientific, Hillsboro, OR, USA) with energy-dispersive spectroscopy (EDS). Surface composition, oxidation states, and local chemical environments were analyzed by X-ray photoelectron spectroscopy (XPS, Thermo ESCALAB 250XI, Thermo Fisher Scientific, Waltham, MA, USA) using monochromatized Al Kα radiation. UV–visible diffuse reflectance spectroscopy (UV–vis DRS, Shimadzu UV-3600i Plus, Kyoto, Japan) was used to evaluate the optical response; Kubelka–Munk-transformed Tauc extrapolations were treated as apparent heterostructure-level optical edge descriptors. Electrochemical measurements were acquired using a Wuhan Kest CS350H workstation. The plotted Mott–Schottky responses use an Ag/AgCl reference scale (Figure S12), whereas the non-Faradaic CV responses use an Hg/HgO reference scale (Figure S13). The EIS spectra were fitted using an Rs–(CPE∥Rct) equivalent-circuit model. CV measurements were performed at scan rates of 10–100 mV s−1, and Cdl was obtained from the slope of Δj/2 versus scan rate. Repeated fitting of each retained EIS dataset with different reasonable initial guesses assessed numerical fitting robustness only (Table S15). The retained electrochemical metadata do not specify the electrolyte composition, counter-electrode identity, Mott–Schottky frequency, EIS perturbation/frequency range, or exact exposed-area normalization; these values are not reconstructed, and the electrochemical results are consequently used only as comparative descriptors.

3.6. Evaluation of Photocatalytic Performance

The photocatalytic degradation experiments were performed by immersing a strip-shaped catalyst sample (0.8 × 0.3 cm) in 20 mL of MO aqueous solution (20 mg L−1) using a BL-GHX-V photocatalytic reaction system (Shanghai Bilang Instrument Manufacturing Co., Ltd., Shanghai, China) equipped with a xenon lamp with a nominal power rating of 1000 W as the simulated solar irradiation source. The lamp-to-sample distance was approximately 5 cm, and the effective illuminated area was approximately 19 cm2. All comparative tests used the same lamp geometry and operating conditions. Because a calibrated irradiance measurement at the sample position was not available, the nominal lamp power and fixed reactor geometry are reported rather than an estimated irradiance. Before irradiation, the catalyst/MO system was magnetically stirred in the dark for 10 min to establish adsorption–desorption equilibrium.
For H2O2-assisted photodegradation, 20 μL of 40 wt% H2O2 was introduced into 20 mL of MO solution, corresponding to an approximate final H2O2 concentration of 13.5 mM, followed by the same 10 min dark equilibration procedure [54,55,56,57]. A dosage screening experiment using 10–60 μL of 40 wt% H2O2 was performed for Er-modified ZnO/NPCu under otherwise identical conditions. Additional controls included MO + light, MO + H2O2 + light, NPCu + MO + light, NPCu + MO + H2O2 + light, and Er-modified ZnO/NPCu + MO + H2O2 in the dark. A catalyst-removal experiment was also performed in which Er-modified ZnO/NPCu was removed immediately after the 30 s measurement and the remaining solution was irradiated further.
At predetermined intervals, aliquots were collected and centrifuged, and the absorbance of MO was measured using a UV-vis spectrometer (T6, Beijing General Instruments Co., Ltd., Beijing, China). Degradation efficiency (η) was calculated as η = (A0 − At)/A0 × 100% = (C0 − Ct)/C0 × 100%. Three independent H2O2-free degradation experiments were performed for each photocatalyst composition. Independent H2O2-assisted repeat measurements were additionally obtained for ZnO/NPCu, and three independent eight-cycle tests were performed for Er-modified ZnO/NPCu under the selected H2O2-assisted condition. The main-text performance plots are retained as representative datasets, while individual replicate values, means, SDs, and error bar summaries are provided in the Supporting Information. For kinetic analysis, A0 and C0 are the absorbance and concentration measured immediately after dark equilibration and before irradiation; the reported irradiation-stage Ct/C0 values therefore exclude removal that occurred during the preceding equilibration period.
To evaluate aqueous-phase organic carbon removal after H2O2-free degradation over Er-modified ZnO/NPCu, the NPOC concentrations of the initial MO solution and the post-reaction supernatant were measured using a Shimadzu TOC-L CPH analyzer. Because supernatant NPOC can also be affected by adsorption or retention of organic species on the catalyst, the NPOC decrease is interpreted as aqueous-phase organic carbon removal rather than as a standalone proof of complete mineralization. Radical scavenging experiments were conducted under H2O2-free conditions using 1 mM AgNO3 (AN), ammonium oxalate (AO), isopropyl alcohol (IPA), and benzoquinone (BQ) as probes for electron-, hole-, OH−, and ·O2-associated pathways, respectively. Temperature-dependent photocatalytic degradation experiments were performed at recorded setpoints of 298, 308, 318, and 328 K without H2O2 addition using the same xenon lamp reactor geometry. The retained record does not specify the temperature-control hardware; these results are interpreted only as apparent temperature-dependent kinetics.

3.7. Data Processing and Calculation Methods

The photocatalytic degradation kinetics were analyzed using the pseudo-first-order kinetic model [58]:
C t = C 0 e x p k o b s t , ( R 2 > 0.95 )
where t is irradiation time, Ct is the MO concentration at time t, C0 is the concentration measured immediately after dark equilibration and before irradiation, and kobs is the apparent degradation rate constant. Independent photocatalytic replicates are reported as mean ± sample standard deviation (SD).
An apparent Tauc edge energy (Eg) was estimated from the Kubelka–Munk function, α , using the direct-allowed-transition convention commonly applied to ZnO-based systems [53]:
( α h ν ) 2 = A ( h ν E g )
where α is the Kubelka–Munk function, hν is photon energy, A is an energy-independent constant, and Eg is an apparent optical edge descriptor of the complete supported heterostructure. Metallic Cu absorption, interfacial/surface states, and diffuse scattering can influence this value; it is not interpreted as the intrinsic ZnO lattice band gap.
Apparent positive-slope and negative-slope Mott–Schottky descriptors were estimated from selected local quasilinear regions using the conventional relationship [59,60]:
C 2 = 2 ε ε 0 e N A 2 ( E E f b k T e )
where C is measured capacitance, ε is the assumed semiconductor dielectric constant, ε0 is vacuum permittivity, e is the elementary charge, N is the slope-derived apparent descriptor, A is the effective electrode area, E is the applied potential, Efb is the flat-band potential, k is the Boltzmann constant, and T is the absolute temperature. Values from selected positive- and negative-slope segments are denoted ND and NA, respectively. For these porous, multicomponent, metal-supported electrodes, the capacitance can include ZnO space charge response, RE/defect/surface-state charging, interfacial/double-layer capacitance, frequency dispersion, and NPCu coupling. ND and NA are therefore comparative within-series descriptors, not intrinsic carrier densities or concentrations of particular RE atoms, oxygen vacancies, hydroxyl groups, or MO adsorption sites.
The temperature dependence of the H2O2-free apparent rate constant was summarized using the Arrhenius relationship [61]:
l n k T = E a , a p p / R T + l n A
where kT is the apparent degradation rate constant at temperature T, A is the pre-exponential factor, R is the gas constant (8.314 J mol−1 K−1), and Ea,app is the apparent overall activation energy. Ea,app was obtained from the slope of −ln kT versus 1000/(RT). Because the measurements describe a continuously irradiated, irreversible degradation process rather than a reversible equilibrium, they do not yield standard reaction enthalpy, Gibbs free energy, or equilibrium constants and are not used to establish a substitutional RE-doped complex.

3.8. AI-Assisted Data Processing and Machine-Learning

A literature-derived dataset containing 449 photocatalytic experiments from 54 references was used only for exploratory contextual analysis [62]. Photocatalyst identity, pollutant identity, dosage, particle-size-related information, initial concentration, pH, and light type were used as descriptors, with y = log10(k) as the target. The six internally prepared catalysts were excluded from external model training because this internal series is too small for independent machine learning construction or validation.
Categorical variables were encoded and missing numerical values were median-imputed. Random Forest modeling followed standard tree ensemble practice and was implemented within the scikit-learn workflow [63,64,65]. Random 80/20 splitting was used to describe within-dataset fit, while reference-grouped five-fold validation kept entries from one literature source in the same fold to test out-of-reference generalization. For y = log10(k), R2 = 1 − Σ(yi − ŷi)2/Σ(yi − ȳ)2, RMSE = [n−1Σ(yi − ŷi)2]1/2, and MAE = n−1Σ|yi − ŷi|. R2 is a predictive goodness-of-fit statistic relative to a mean prediction baseline; it is not a descriptor correlation coefficient and does not imply causality.
Permutation importance was interpreted only as an association measure. Dataset/model details, validation metrics, descriptor importance, and alternative tree ensemble comparisons are provided in Tables S16–S19. Because the stricter grouped validation is negative, neither the external model nor the internal multidescriptor heatmap is used for universal prediction, mechanistic assignment, or autonomous catalyst discovery.

4. Conclusions

ZnO nanorod arrays supported on NPCu were modified with low-abundance RE-containing surface species. The notation RE(OH)3@ZnO/NPCu is retained solely as an operational sample identifier and not as a phase assignment. XRD confirms preservation of the ZnO/NPCu crystalline framework, EDS confirms the local presence of RE, and XPS identifies a Zn2+–O framework, mixed reduced/oxidized Cu surface contributions, mixed Ce3+/Ce4+, predominantly trivalent Sm/Er/Tm/Yb, and composition-dependent surface oxygen environments. However, these results do not establish RE(OH)3 stoichiometry or uniquely distinguish hydroxide, oxide, oxyhydroxide, and other hydroxylated/adsorbed surface configurations. The controlled five-RE comparison identified Er as the strongest modifier in the tested MO system, giving 96.61 ± 0.30% degradation at 9 min and kobs = 0.3930 ± 0.0071 min−1 across three H2O2-free runs. A practical H2O2 dosage of approximately 13.5 mM enabled rapid H2O2-assisted degradation; controls support an additional solid-catalyst-dependent Cu-associated peroxide activation contribution without excluding trace homogeneous reactions. Three independent H2O2-assisted cycling tests retained 92.37 ± 0.51% degradation in cycle 8; post-cycle SEM/XRD/EDS support preservation of the principal architecture but do not quantify leaching. The NPOC decrease is evidence of aqueous-phase organic carbon removal, not standalone proof of complete mineralization. Eg, ND/NA, EIS, Cdl, Ea,app, and scavenger responses are complementary comparative descriptors, not direct proof of intrinsic phase constants or a unique mechanism. The shortened AI analysis is exploratory because grouped validation is negative. Overall, the results support a condition-dependent relationship among RE-containing surface regulation, ZnO photochemistry, NPCu interfacial transport, and additional Cu-associated peroxide activation; the conclusions are confined to MO under the reported reactor conditions.

Supplementary Materials

The following supporting information can be downloaded at: https://www.mdpi.com/article/10.3390/inorganics14090227/s1, Table S1. Local semiquantitative elemental compositions of ZnO/NPCu and RE-modified ZnO/NPCu samples determined by EDS, Figure S1. Elemental mapping images of the Ce-modified ZnO/NPCu sample: (a) electron image and elemental distribution maps of (b) Cu, (c) Zn, (d) Ce and (e) O, Figure S2. XPS survey spectra of ZnO/NPCu and RE-modified ZnO/NPCu samples (RE = Ce, Sm, Er, Tm and Yb), Table S2. Relative O 1s component percentages obtained from XPS fitting, Figure S3. UV–vis absorption spectra of MO during H2O2-free photocatalytic degradation over (a) ZnO/NPCu, (b) Yb-modified ZnO/NPCu, (c) Tm-modified ZnO/NPCu, (d) Sm-modified ZnO/NPCu, (e) Ce-modified ZnO/NPCu and (f) Er-modified ZnO/NPCu under different irradiation times using the xenon-lamp simulated solar source, Figure S4. Reproducibility of the apparent pseudo-first-order rate constants for H2O2-free MO photodegradation over ZnO/NPCu and RE-modified ZnO/NPCu samples. Bars show mean values and error bars show SD from three independent experiments (n = 3), Table S3. Normalized MO concentrations obtained from three independent H2O2-free photocatalytic degradation experiments over ZnO/NPCu and RE-modified ZnO/NPCu samples. Data are presented as individual measurements and mean ± SD (n = 3), Table S4. Final MO degradation efficiencies obtained from three independent H2O2-free photocatalytic degradation experiments, Table S5. Apparent pseudo-first-order rate constants obtained from three independent H2O2-free photocatalytic degradation experiments, Figure S5. NPOC concentrations of the initial MO solution and the supernatant collected after H2O2-free simulated-solar-light photocatalytic degradation over Er-modified ZnO/NPCu, Figure S6. Effect of H2O2 dosage on MO photodegradation over Er-modified ZnO/NPCu. The screening used 10–60 μL of 40 wt% H2O2 in 20 mL of MO solution under otherwise identical conditions, Table S6. H2O2 dosage and corresponding approximate final H2O2 concentrations used in the Er-modified ZnO/NPCu dosage-screening experiments, Table S7. Normalized MO concentrations during H2O2-assisted photodegradation over Er-modified ZnO/NPCu at different H2O2 dosages, Table S8. Kinetic parameters and 60 s degradation efficiencies for H2O2-assisted MO degradation over Er-modified ZnO/NPCu at different H2O2 dosages, Figure S7. H2O2/Cu control experiments for MO degradation. H2O2-containing groups used 20 μL of 40 wt% H2O2 in 20 mL of MO solution (approximately 13.5 mM H2O2), Table S9. Normalized MO concentrations for the H2O2/Cu control experiments, Table S10. Apparent pseudo-first-order kinetic parameters and 60 s degradation efficiencies for the H2O2/Cu control experiments, Table S11. Catalyst-removal test for the H2O2-assisted photodegradation system. The Er-modified ZnO/NPCu catalyst was removed immediately after the 30 s measurement, Table S12. Independent H2O2-assisted photodegradation measurements for ZnO/NPCu, Figure S8. Cycling reproducibility of Er-modified ZnO/NPCu under H2O2-assisted photodegradation conditions. Bars show mean degradation efficiency and error bars show SD from three independent cycling experiments (n = 3), Table S13. Cycling reproducibility of Er-modified ZnO/NPCu under H2O2-assisted photodegradation conditions, Figure S9. SEM images of (a) fresh Er-modified ZnO/NPCu and (b) Er-modified ZnO/NPCu after eight H2O2-assisted photodegradation cycles, Figure S10. XRD patterns of fresh Er-modified ZnO/NPCu and the catalyst after eight H2O2-assisted photodegradation cycles, Table S14. Surface elemental compositions of fresh Er-modified ZnO/NPCu and Er-modified ZnO/NPCu after eight H2O2-assisted cycles determined by EDS, Figure S11. Tauc plots used to estimate the apparent optical band gaps of (a) ZnO/NPCu, (b) Yb-modified ZnO/NPCu, (c) Tm-modified ZnO/NPCu, (d) Sm-modified ZnO/NPCu, (e) Ce-modified ZnO/NPCu and (f) Er-modified ZnO/NPCu, Figure S12. Mott–Schottky plots of (a) ZnO/NPCu, (b) Yb-modified ZnO/NPCu, (c) Tm-modified ZnO/NPCu, (d) Sm-modified ZnO/NPCu, (e) Ce-modified ZnO/NPCu and (f) Er-modified ZnO/NPCu, Figure S13. Cyclic voltammetry curves recorded in the non-Faradaic region at different scan rates for (a) ZnO/NPCu, (b) Yb-modified ZnO/NPCu, (c) Tm-modified ZnO/NPCu, (d) Sm-modified ZnO/NPCu, (e) Ce-modified ZnO/NPCu and (f) Er-modified ZnO/NPCu, Table S15. Repeated equivalent-circuit fitting of the same EIS datasets for ZnO/NPCu and RE-modified ZnO/NPCu electrodes, Figure S14. Temperature-dependent H2O2-free photocatalytic degradation curves of MO over (a) ZnO/NPCu, (b) Yb-modified ZnO/NPCu, (c) Tm-modified ZnO/NPCu, (d) Sm-modified ZnO/NPCu, (e) Ce-modified ZnO/NPCu and (f) Er-modified ZnO/NPCu under the same xenon-lamp simulated solar irradiation conditions as the main photocatalytic tests, Table S16. Dataset and model summary for AI-assisted contextual descriptor analysis, Table S17. Machine-learning model validation metrics, Table S18. Permutation-based descriptor-importance ranking for the Random Forest model, Table S19. Comparison of regression models under random 80/20 train–test splitting.

Author Contributions

H.W.: conceptualization, methodology, investigation, data curation, formal analysis, and writing—original draft. R.B.H.: conceptualization, methodology, formal analysis, and writing—original draft. Y.Y.: conceptualization, methodology, formal analysis, and writing—review and editing. F.Q.: conceptualization, supervision, writing—review and editing, and funding acquisition. All authors have read and agreed to the published version of the manuscript.

Funding

This research was funded by the National Natural Science Foundation of China, grant numbers 52371157 and 51671106, and the Natural Science Foundation of Fujian Province, grant number 2025J08161.

Data Availability Statement

Experimental data are provided in this article and its Supplementary Materials or are available from the corresponding authors upon reasonable request. The external photocatalysis dataset used for exploratory contextualization is publicly available in the Supplementary Materials of Jiang et al. [62]. No standalone processed dataset or analysis-code repository accompanies this article.

Conflicts of Interest

The authors declare no conflicts of interest.

References

  1. Sadiq, F.K.; Sadiq, A.A.; Matsika, T.A.; Momoh, B.A. Sustainable remediation of persistent organic pollutants: A review on recent innovative technologies. Curr. Res. Biotechnol. 2025, 9, 100293. [Google Scholar] [CrossRef] [Scilit]
  2. Aziz, K.H.H.; Mustafa, F.S.; Karim, M.A.H.; Hama, S. Pharmaceutical pollution in the aquatic environment: Advanced oxidation processes as efficient treatment approaches: A review. Mater. Adv. 2025, 6, 3433–3454. [Google Scholar] [CrossRef] [Scilit]
  3. Silva, J.A. Advanced oxidation process in the sustainable treatment of refractory wastewater: A systematic literature review. Sustainability 2025, 17, 3439. [Google Scholar] [CrossRef] [Scilit]
  4. Hübner, U.; Spahr, S.; Lutze, H.; Wieland, A.; Rüting, S.; Gernjak, W.; Wenk, J. Advanced oxidation processes for water and wastewater treatment—Guidance for systematic future research. Heliyon 2024, 10, e30402. [Google Scholar] [CrossRef] [Scilit]
  5. Gaur, N.; Dutta, D.; Singh, A.; Dubey, R.; Kamboj, D.V. Recent advances in the elimination of persistent organic pollutants by photocatalysis. Front. Environ. Sci. 2022, 10, 872514. [Google Scholar] [CrossRef] [Scilit]
  6. Al Miad, A.; Saikat, S.P.; Alam, M.K.; Hossain, M.S.; Bahadur, N.M.; Ahmed, S. Metal oxide-based photocatalysts for the efficient degradation of organic pollutants for a sustainable environment: A review. Nanoscale Adv. 2024, 6, 4781–4803. [Google Scholar] [CrossRef] [Scilit]
  7. Ghamarpoor, R.; Fallah, A.; Jamshidi, M. A review of synthesis methods, modifications, and mechanisms of ZnO/TiO2-based photocatalysts for photodegradation of contaminants. ACS Omega 2024, 9, 25457–25492. [Google Scholar] [CrossRef] [Scilit]
  8. Aina, A.R.N.; Patel, H.; Aich, S.; Roy, B.; Samanta, N.S.; Pal, B. Recent advances in ZnO based photocatalysts for industrial dye degradation. Discov. Appl. Sci. 2025, 7, 977. [Google Scholar] [CrossRef] [Scilit]
  9. Baig, A.; Siddique, M.; Panchal, S. A review of visible-light-active zinc oxide photocatalysts for environmental application. Catalysts 2025, 15, 100. [Google Scholar] [CrossRef] [Scilit]
  10. Zhang, Y.; Liu, L.; Van der Bruggen, B.; Leung, M.K.H.; Yang, F. A free-standing 3D nano-composite photo-electrode—Ag/ZnO nanorods arrays on Ni foam effectively degrade berberine. Chem. Eng. J. 2019, 373, 179–191. [Google Scholar] [CrossRef] [Scilit]
  11. Raha, S.; Ahmaruzzaman, M. Facile fabrication of g-C3N4 supported Fe3O4 nanoparticles/ZnO nanorods: A superlative visible light responsive architecture for express degradation of pantoprazole. Chem. Eng. J. 2020, 387, 123766. [Google Scholar] [CrossRef] [Scilit]
  12. Haider, Z.; Ju, H. Strategies to boost photocatalytic degradation of emerging contaminants using ZnO heterostructure photocatalysts. Appl. Sci. 2026, 16, 5279. [Google Scholar] [CrossRef] [Scilit]
  13. Hasanah, A.U.; Ikbal, M.S.; Tahir, D. Advances in rare earth-doped ZnO photocatalysts: Enhancing photogenerated electron-hole pairs for radical atom generation. ChemBioEng Rev. 2024, 11, 595–612. [Google Scholar] [CrossRef] [Scilit]
  14. Kumar, R.; Dosanjh, H.S. A mini-review on rare earth metal doped ZnO nanomaterials for photocatalytic remediation of waste water. J. Phys. Conf. Ser. 2022, 2267, 012139. [Google Scholar] [CrossRef] [Scilit]
  15. Sood, S.; Kumar, P.; Raina, I.; Misra, M.; Kaushal, S.; Gaur, J.; Kumar, S.; Singh, G. Enhancing optoelectronic performance through rare-earth-doped ZnO: Insights and applications. Photonics 2025, 12, 454. [Google Scholar] [CrossRef] [Scilit]
  16. Dhiman, P.; Rana, G.; Kumar, A.; Dawi, E.A.; Sharma, G. Rare earth doped ZnO nanoparticles as spintronics and photo catalyst for degradation of pollutants. Molecules 2023, 28, 2838. [Google Scholar] [CrossRef] [Scilit]
  17. Hassan, A.; Jalil, A.; Ilyas, S.Z.; Iqbal, M.F.; Shah, S.Z.A.; Baqir, Y. Green-route synthesis and ab-initio studies of a highly efficient nano photocatalyst: Ce/zinc-oxide nanopetals. Heliyon 2024, 10, e25581. [Google Scholar] [CrossRef] [Scilit]
  18. Ameen, S.; Fatima, R.; Kadhem, A.A.; Abbas, T.; Khan, M.A.; Abbas, A.; Hussain, I.; Bano, N.; Rad, Z.F.; Bilal, A.S.S. Enhanced photocatalytic degradation of methylene blue using aluminum and cerium co-doped ZnO nanocomposite. Int. J. Environ. Sci. Technol. 2025, 22, 16549–16558. [Google Scholar] [CrossRef] [Scilit]
  19. Umadevi, P.; Naveenkumar, N.; Chidambaram, S.G.; Vadivel, R. Enhanced photocatalytic and non-linear optical properties of dual-doped rare earth ions (Gd3+ and Sm3+) in ZnO nanostructured materials. ACS Appl. Nano Mater. 2025, 8, 17012–17030. [Google Scholar] [CrossRef] [Scilit]
  20. Rahman, M.H.; Rahaman, M.Z.; Chowdhury, E.H.; Motalab, M.; Hossain, A.K.M.A.; Roknuzzaman, M. Understanding the role of rare-earth metal doping on the electronic structure and optical characteristics of ZnO. Mol. Syst. Des. Eng. 2022, 7, 1516–1528. [Google Scholar] [CrossRef] [Scilit]
  21. Zheng, A.L.T.; Sinin, A.E.; Jin, W.T.; Feng, K.L.; Boonyuen, S.; Chung, E.L.T.; Lease, J.; Andou, Y. Rare earth elements for enhancing photocatalysis in pollutant degradation and water treatment. Int. J. Environ. Sci. Technol. 2025, 22, 7247–7270. [Google Scholar] [CrossRef] [Scilit]
  22. Zahra, T.; Abbas, S.; Ou, J.; Lim, T.M.; Abbas, A. Microstructure engineered nanoporous copper for enhanced catalytic degradation of organic pollutants in wastewater. Materials 2025, 18, 2929. [Google Scholar] [CrossRef] [Scilit]
  23. Mohd Shumiri, M.A.I.; Mohd Najib, A.S.; Putra, A.E.E.; Fadil, N.A. Electrochemical and chemical dealloying of nanoporous anode materials for energy storage applications. Sci. Technol. Adv. Mater. 2025, 26, 2451017. [Google Scholar] [CrossRef] [Scilit]
  24. Li, M.; Liu, J.; Wang, C.; Liu, Y.; Sun, Y.; Qin, C.; Wang, Z.; Li, Y.; Liu, L.; Liu, S. Controllable nanoporous copper synthesized by dealloying metallic glasses: New insights into the tuning pore structure and applications. Chem. Eng. J. 2022, 427, 130861. [Google Scholar] [CrossRef] [Scilit]
  25. Li, J.; Yu, B.; Ran, Y.; Liu, Y.; Fei, X.; Sun, J.; Tan, F.; Cheng, G.; Zhang, Y.; Qin, J.; et al. Synthesis and structural modulation of nanoporous copper films by magnetron sputtering and one-step dealloying. Materials 2024, 17, 5705. [Google Scholar] [CrossRef] [Scilit]
  26. Gao, Y.; Zhu, Q.; Huang, Z.; Zhang, S.; Wang, Y.; Lv, G.; Li, H.; Zhang, X.; Hou, Z.; Zhang, H. Nanoporous Cu-based metamaterial for Fenton-like catalysis. Chem. Eng. J. 2023, 477, 146902. [Google Scholar] [CrossRef] [Scilit]
  27. Qian, H.; Mu, X.; Li, K.; Xie, S.; Xiong, X.; Zeng, X. Nanoporous copper sonocatalysts prepared by dealloying Cu–Al–Ti amorphous ribbons. Mater. Sci. Technol. 2020, 36, 1083–1091. [Google Scholar] [CrossRef] [Scilit]
  28. Niu, X.; Yang, Q.; Wang, Z.; Zhu, Y.; Zhang, C.; Liang, P.; Zhang, Z. Dealloyed nanoporous copper as a highly active catalyst in Fenton-like reaction for degradation of organic pollutants. Chem. Eng. J. 2022, 431, 133834. [Google Scholar] [CrossRef] [Scilit]
  29. Aarya, K.P.; Sathyan, A.; Sen Mojumdar, S. Copper nanocluster-mediated degradation of toxic organic dyes: A sustainable approach to water remediation. RSC Adv. 2026, 16, 464–473. [Google Scholar] [CrossRef] [Scilit]
  30. Bai, Y.; Tao, Q.; Wang, L.; Lu, S.; Zhang, A.; Li, K.; Hu, N. Anchoring of Cu0 nanoparticles on the surface of magnetic separable high-entropy oxides for ultrafast catalytic degradation of sulfadiazine. Sep. Purif. Technol. 2025, 367, 132804. [Google Scholar] [CrossRef] [Scilit]
  31. Liu, Z.; Zhao, Y.; Cao, X.; Tan, C.; Wang, S.; Song, C.; Lai, J.; Wang, Z.; Song, M. High metal-loaded sub-nanocluster catalyst enhanced Fenton-like reaction activity for emerging contaminants degradation by generating high-valent copper. Sep. Purif. Technol. 2025, 356, 129794. [Google Scholar] [CrossRef] [Scilit]
  32. Yang, W.; Yang, W.; Dong, L.; Shao, G.; Wang, G.; Peng, X. Hierarchical ZnO nanorod arrays grown on copper foam as an advanced three-dimensional skeleton for dendrite-free sodium metal anodes. Nano Energy 2021, 80, 105563. [Google Scholar] [CrossRef] [Scilit]
  33. Seetoh, I.P.; Ramesh, A.K.; Tan, W.X.; Lai, C.Q. Enhanced photoelectrochemical water splitting using carbon cloth functionalized with ZnO nanostructures via polydopamine assisted electroless deposition. Nanoscale 2024, 16, 8401–8416. [Google Scholar] [CrossRef] [Scilit]
  34. Verma, G.; Islam, M.; Gupta, A. ZnO nanowire-decorated 3D printed pyrolytic carbon for solar light-driven photocatalytic degradation of wastewater contaminants. Adv. Compos. Hybrid. Mater. 2025, 8, 109. [Google Scholar] [CrossRef] [Scilit]
  35. Hossain, M.Z.; Nayem, S.M.A.; Alam, M.S.; Islam, M.I.; Seong, G.; Chowdhury, A.-N. Hydrothermal ZnO nanomaterials: Tailored properties and infinite possibilities. Nanomaterials 2025, 15, 609. [Google Scholar] [CrossRef] [Scilit]
  36. Chen, P.; Zhang, P.; Cui, Y.; Fu, X.; Wang, Y. Recent progress in copper-based inorganic nanostructure photocatalysts: Properties, synthesis and photocatalysis applications. Mater. Today Sustain. 2023, 21, 100276. [Google Scholar] [CrossRef] [Scilit]
  37. Yavuz, D.K.; El Accen, M.; Bedir, M. Unlocking the potential of ZnO nanorods: Structural insights for enhanced photocatalytic activity. J. Phys. Chem. Solids 2024, 193, 112120. [Google Scholar] [CrossRef] [Scilit]
  38. Zhang, Y.; Qiu, J.; Zhu, B.; Fedin, M.V.; Cheng, B.; Yu, J.; Zhang, L. ZnO/COF S-scheme heterojunction for improved photocatalytic H2O2 production performance. Chem. Eng. J. 2022, 444, 136584. [Google Scholar] [CrossRef] [Scilit]
  39. Schneider, J.; Matsuoka, M.; Takeuchi, M.; Zhang, J.; Horiuchi, Y.; Anpo, M.; Bahnemann, D.W. Understanding TiO2 photocatalysis: Mechanisms and materials. Chem. Rev. 2014, 114, 9919–9986. [Google Scholar] [CrossRef] [Scilit]
  40. Low, J.; Yu, J.; Jaroniec, M.; Wageh, S.; Al-Ghamdi, A.A. Heterojunction photocatalysts. Adv. Mater. 2017, 29, 1601694. [Google Scholar] [CrossRef] [Scilit]
  41. Campos, S.A.; Calzadilla, W.; Venegas-Yazigi, D.; León-Carvajal, J.; Fuentes, S.; Salazar-González, R. Effluent reclamation through photocatalysis using Yb- and Er-doped zinc oxide nanomaterials. ACS ES&T Water 2025, 5, 3100–3110. [Google Scholar] [CrossRef] [Scilit]
  42. Wannakan, K.; Khansamrit, K.; Senasu, T.; Chankhanittha, T.; Nanan, S. Ag-modified ZnO for degradation of oxytetracycline antibiotic and reactive red azo dye. Antibiotics 2022, 11, 1590. [Google Scholar] [CrossRef] [Scilit]
  43. Wannakan, K.; Khansamrit, K.; Senasu, T.; Nanan, S. Ultrasound-assisted synthesis of a ZnO/BiVO4 S-scheme heterojunction photocatalyst for degradation of the reactive Red 141 dye and oxytetracycline antibiotic. ACS Omega 2023, 8, 4835–4852. [Google Scholar] [CrossRef] [Scilit]
  44. Sahu, P.; Das, D. ZnO-nanorod/Ag2O-nanoparticle/rGO-nanosheet heterostructures as photocatalysts for enhanced degradation of harmful aqueous phase contaminants under extended visible light exposure. ACS Appl. Nano Mater. 2023, 6, 22730–22744. [Google Scholar] [CrossRef] [Scilit]
  45. Kumaravel, S.; Kim, H. Development and characterization of solar active Ag-ZnO/g-C3N4 as a highly efficient photocatalyst for the detoxification of organic pollutant. Colloids Surf. A 2023, 679, 132644. [Google Scholar] [CrossRef] [Scilit]
  46. Tian, M.; Zhang, G.; Zhao, X.; Yan, Y.; Zhao, J.; Bai, H.; Jiang, J. Construction of rare-metal neodymium-doped ZnO and g-C3N4 Z-type heterostructures enhance the photocatalytic efficiency of methylene blue removal. Diam. Relat. Mater. 2023, 140, 110493. [Google Scholar] [CrossRef] [Scilit]
  47. Pascariu, P.; Cojocaru, C.; Samoila, P.; Romanitan, C. Nd-doped ZnO nanostructures with enhanced photocatalytic performance for environmental protection. Int. J. Mol. Sci. 2023, 24, 6436. [Google Scholar] [CrossRef] [Scilit]
  48. Luo, J.; Wu, Y.; Jiang, M.; Zhang, A.; Chen, X.; Zeng, Y.; Wang, Y.; Zhao, Y.; Wang, G. Novel ZnFe2O4/BC/ZnO photocatalyst for high-efficiency degradation of tetracycline under visible light irradiation. Chemosphere 2023, 311, 137041. [Google Scholar] [CrossRef] [Scilit]
  49. Li, S.; Li, Y.; Yuan, Z.; Li, J.; Butenko, D.; Ji, Y.; Shanenkov, I.; Li, G.; Han, W. A novel MXene-bridged Z-scheme ZnO@Nb2CTx MXene@carbon nitride nanosheets photocatalyst for efficient enrofloxacin degradation. Chem. Eng. J. 2024, 489, 151505. [Google Scholar] [CrossRef] [Scilit]
  50. Fathy, N.; Fathy, S.; Ali, F.; Mousa, S. Effective sunlight photodegradation of methylene blue dye using zinc oxide doped with mono- and bi-metals of Ag and Ce, Desalin. Water Treat. 2024, 320, 100595. [Google Scholar] [CrossRef] [Scilit]
  51. Li, H.; Wu, R.; Ji, J.; Liu, Y.; Zhao, J.; Sahar, S.; Zeb, A. Efficient CeO2/ZnO heterojunction for enhanced heterogeneous photocatalytic application. Inorg. Chem. Commun. 2025, 171, 113553. [Google Scholar] [CrossRef] [Scilit]
  52. Malebadi, K.A.; Sawunyama, L.; Seheri, N.H.; Amairia, C.; Onwudiwe, D.C. Photocatalytic degradation of methyl orange using biogenic Ag–ZnO nanostructures derived from Searsia lancea. Appl. Phys. A 2026, 132, 170. [Google Scholar] [CrossRef] [Scilit]
  53. Makuła, P.; Pacia, M.; Macyk, W. How to correctly determine the band gap energy of modified semiconductor photocatalysts based on UV–vis spectra. J. Phys. Chem. Lett. 2018, 9, 6814–6817. [Google Scholar] [CrossRef] [Scilit]
  54. Wu, Y.; Che, H.; Liu, B.; Ao, Y. Promising materials for photocatalysis-self-Fenton system: Properties, modifications, and applications. Small Struct. 2023, 4, 2200371. [Google Scholar] [CrossRef] [Scilit]
  55. Wang, S.; An, W.; Lu, J.; Liu, L.; Hu, J.; Liang, Y.; Cui, W. A Cu/CuFe2O4-OVs two-electron centre-based synergistic photocatalysis-Fenton system for efficient degradation of organic pollutants. Chem. Eng. J. 2022, 441, 135944. [Google Scholar] [CrossRef] [Scilit]
  56. Sun, T.; Jin, Z.Y.; Deng, B.; He, G.; Wang, Q.Y.; Hu, M.; Han, Z.; Zheng, Z.; Zhao, J.; Yun, J.; et al. Visible-light-driven photo-Fenton oxidation enhanced by Fe/Bi-nanocrystal phase transformation as a universal way for various organic pollutants mineralization. Chem. Eng. J. 2024, 481, 148732. [Google Scholar] [CrossRef] [Scilit]
  57. Le, T.T.; Ahn, Y.Y.; Kim, K.; Kim, S.H.; Moon, G. Photo-Fenton mineralization of aquatic organic pollutants in visible-light-driven photocatalysis: Revisiting Fe3+ reduction and noble metal necessity. J. Hazard. Mater. 2025, 497, 139589. [Google Scholar] [CrossRef] [Scilit]
  58. Tran, H.D.; Nguyen, D.Q.; Do, P.T.; Tran, U.N.P. Kinetics of photocatalytic degradation of organic compounds: A mini-review and new approach. RSC Adv. 2023, 13, 16915–16925. [Google Scholar] [CrossRef] [Scilit] [PubMed]
  59. Sivula, K. Mott–Schottky analysis of photoelectrodes: Sanity checks are needed. ACS Energy Lett. 2021, 6, 2549–2551. [Google Scholar] [CrossRef] [Scilit]
  60. Xue, J.; Bao, J. Interfacial charge transfer of heterojunction photocatalysts: Characterization and calculation. Surf. Interfaces 2021, 25, 101265. [Google Scholar] [CrossRef] [Scilit]
  61. Cho, Y.; Yanagiyama, K.; Mukherjee, P.; Phulkerd, P.; Sathiyan, K.; Sawade, E.; Wada, T.; Taniike, T. Identifying rate-limiting steps in photocatalysis: A temperature- and light intensity-dependent diagnostic of charge supply vs. charge transfer. J. Mater. Chem. A 2025, 13, 16204–16211. [Google Scholar] [CrossRef] [Scilit]
  62. Jiang, Z.; Hu, J.; Tong, M.; Samia, A.C.S.; Zhang, H.; Yu, X. A novel machine learning model to predict the photo-degradation performance of different photocatalysts on a variety of water contaminants. Catalysts 2021, 11, 1107. [Google Scholar] [CrossRef] [Scilit]
  63. Biau, G.; Scornet, E. A random forest guided tour. TEST 2016, 25, 197–227. [Google Scholar] [CrossRef] [Scilit]
  64. Probst, P.; Wright, M.N.; Boulesteix, A.-L. Hyperparameters and tuning strategies for random forest. Wiley Interdiscip. Rev. Data Min. Knowl. Discov. 2019, 9, e1301. [Google Scholar] [CrossRef] [Scilit]
  65. Pedregosa, F.; Varoquaux, G.; Gramfort, A.; Michel, V.; Thirion, B.; Grisel, O.; Blondel, M.; Prettenhofer, P.; Weiss, R.; Dubourg, V.; et al. Scikit-learn: Machine learning in Python. J. Mach. Learn. Res. 2011, 12, 2825–2830. [Google Scholar]
Figure 1. Preparation and characterization of RE-modified ZnO/NPCu heterostructures. (a) Schematic illustration of the three-step fabrication process, including chemical dealloying, ZnO electrodeposition, and mild RE-containing surface modification. (b) SEM images of ZnO/NPCu and RE-modified ZnO/NPCu samples. (c) XRD patterns of ZnO/NPCu and RE-modified ZnO/NPCu samples. (d) Cu 2p, (e) Zn 2p, (f) O 1s and (g) RE-related high-resolution XPS spectra of the prepared samples. Formula-style labels of the form RE(OH)3@ZnO/NPCu shown in the panels are retained solely as operational sample identifiers and do not constitute crystallographic, stoichiometric, or chemical phase assignments.
Inorganics 14 00227 g001
Figure 2. Simulated-solar-light photodegradation performances of ZnO/NPCu and RE-modified ZnO/NPCu samples toward MO under xenon lamp irradiation. (ac) H2O2-free photocatalytic degradation: (a) degradation curves, (b) pseudo-first-order kinetic fitting plots and (c) cycling stability over six runs. (df) H2O2-assisted photodegradation performance: (d) degradation curves, (e) pseudo-first-order kinetic fitting plots and (f) cycling stability over eight runs. Formula-style identifiers retained in the plotted legends are operational sample labels only.
Inorganics 14 00227 g002
Figure 3. Optical, interfacial charge-transfer, kinetic and reactive-species analyses of ZnO/NPCu and RE-modified ZnO/NPCu samples. (a) UV–vis DRS spectra, (b) apparent optical band gaps (Eg), (c) Mott–Schottky-derived apparent donor-density descriptor (ND), (d) Mott–Schottky-derived apparent acceptor-density descriptor (NA), (e) EIS Nyquist plots, (f) charge-transfer resistance (Rct), (g) double-layer capacitance (Cdl) fitting plots, (h) Arrhenius plots and apparent activation energies derived from H2O2-free temperature-dependent photocatalytic degradation, and (i) effects of scavengers on MO degradation under H2O2-free photocatalytic conditions. Formula-style identifiers retained in the plotted legends are operational sample labels only.
Inorganics 14 00227 g003
Figure 4. AI-assisted contextual descriptor analysis of photocatalytic degradation kinetics. (a) Workflow of the AI-assisted contextual analysis using an external photocatalysis dataset, Random Forest modeling, descriptor importance analysis and separate contextualization of the RE-modified ZnO/NPCu samples. (b) Permutation-based descriptor importance for predicting log10(k). (c) Paired comparison of experimental kobs and Rct values for ZnO/NPCu and RE-modified ZnO/NPCu samples. (d) Normalized favorability heatmap integrating kobs, Rct, ND and Eg for mechanistic contextualization. The AI analysis is interpreted as descriptor association rather than direct causal proof. Formula-style identifiers retained in the plotted panels are operational sample labels only.
Inorganics 14 00227 g004
Figure 5. Proposed photodegradation mechanism over RE-modified ZnO/NPCu. Low-abundance RE-containing surface species are represented schematically without assigning a unique hydroxide, oxide, or oxyhydroxide configuration. The schematic summarizes plausible xenon lamp-induced charge generation, RE-related surface-state trapping/redistribution, NPCu-mediated interfacial transport, O2 reduction, and an H2O2-assisted Cu-associated peroxide activation pathway. The scavenger evidence corresponds to the H2O2-free pathway. The H2O2-assisted branch is a mechanistic hypothesis supported by the accelerated degradation, H2O2/Cu control experiments, and catalyst-removal test rather than by direct radical spectroscopy.
Inorganics 14 00227 g005
Table 1. Comparison of the photocatalytic degradation performance of representative recent ZnO-based photocatalysts.
PhotocatalystPollutantIrradiation/Auxiliary OxidantTime (min)Removal (%)Reported kobs/kapp (min−1)Ref.
5Ag–ZnOOxytetracyclineNatural sunlight; no external H2O2240990.0545[42]
ZnO/BiVO4 S-schemeOxytetracyclineNatural sunlight; no external H2O280≈950.0479[43]
ZnO/Ag2O/rGO (ZAGO0.5)Methyl orangeExtended visible light; no external H2O235≈99.68≈0.2600[44]
1%Ag–ZnO/6%g-C3N4Methylene blueDirect sunlight; no external H2O250≈1000.1266[45]
Nd–ZnO/g-C3N4 (NZCN)Methylene blue500 W Xe lamp; no external H2O210594.880.02637[46]
0.1% Nd–ZnOCiprofloxacinVisible light; no external H2O212099.860.05291[47]
ZnFe2O4/BC/ZnO (0.6-ZBO)TetracyclineVisible light; no external H2O29085.60.02336[48]
ZnO@Nb2CTx@CNNS (ZNC)EnrofloxacinVisible light; no external H2O24098.20.0961[49]
2%Ag–4%Ce/ZnOMethylene blueDirect sunlight; no external H2O2601000.09667[50]
CeO2/ZnO heterojunction (Zn/Ce = 0.2)Methylene blueVisible light; no external H2O26099.28NR[51]
Al/Ce co-doped ZnO (ACZn)Methylene blue, 10 mg L−180 W Xe simulated solar light; no H2O215093NR[18]
Gd3+/Sm3+–ZnO (0.002 wt%)Reactive Black 5UV light; no external H2O27094.56NR[19]
ZnO/Yb (5 mol%)Sulfamethoxazole (real wastewater)UV irradiation; no external H2O212086NR[41]
10% Ag/ZnOMethyl orangeVisible light; no external H2O212099.350.03336[52]
Er-modified ZnO/NPCuMethyl orange, 20 mg L−1Nominal 1000 W Xe; fixed geometry; H2O2-free996.61 ± 0.300.3930 ± 0.0071This work
Er-modified ZnO/NPCuMethyl orange, 20 mg L−1Same Xe geometry; 13.51 mM H2O21 (60 s)97.803.9000This work
Note: NR, not reported. Reported kinetic constants are reproduced from the cited studies and were not recalculated from endpoint removal efficiencies. Cross-study values are intended for descriptive benchmarking rather than direct normalized ranking because pollutant identity/concentration, catalyst form/loading, irradiation spectrum/intensity, reactor geometry, adsorption protocol, and auxiliary oxidant conditions differ among studies.
Disclaimer/Publisher’s Note: The statements, opinions and data contained in all publications are solely those of the individual author(s) and contributor(s) and not of MDPI and/or the editor(s). MDPI and/or the editor(s) disclaim responsibility for any injury to people or property resulting from any ideas, methods, instructions or products referred to in the content.