Article

Enhanced Thermoelectric Performance of CuInTe2 via SnTe Incorporation and Microwave Synthesis

1
School of Materials Science and Engineering, University of Jinan, Jinan 250022, China
2
Binzhou Special Equipment Inspection and Research Institute, Binzhou 256600, China
3
Shandong Huanbang Electronic Technology Co., Ltd., Linyi 276200, China
*
Author to whom correspondence should be addressed.
Inorganics 2026, 14(7), 194; https://doi.org/10.3390/inorganics14070194
Submission received: 19 May 2026 / Revised: 8 July 2026 / Accepted: 20 July 2026 / Published: 21 July 2026
(This article belongs to the Special Issue Inorganic Thermoelectric Materials: Advances and Applications)

Abstract

Incorporating a secondary phase represents a promising strategy for enhancing the thermoelectric performance of materials. In this study, CuInTe2 was modified with SnTe powders at various weight fractions (0, 0.5, 1, 2, 4 wt%) and subsequently synthesized via rapid microwave melting. The phase composition and microstructure of the resulting materials were systematically characterized. Structural analyses revealed that the introduction of SnTe induced the incorporation of Sn and Te into the CuInTe2 lattice, accompanied by a progressive contraction in lattice parameters. Owing to the spontaneous formation of intrinsic Sn vacancies in SnTe and the regulation of carrier concentration, electrical conductivity of up to 2.7 × 10⁴ Sm−1 was achieved, representing a 1.7-fold increase over pristine CuInTe2. Coupled with a notable reduction in lattice thermal conductivity (0.9 Wm−1K−1 at 700 K), a maximum figure of merit of 0.44 was obtained for the CuInTe2-2 wt% SnTe sample. While the absolute zT value is moderate compared to state-of-the-art CuInTe2-based materials, this work establishes the feasibility of microwave melting combined with second-phase incorporation as a rapid and energy-efficient synthesis pathway for CuInTe2 modification. These results demonstrate that the introduction of SnTe is a viable strategy for enhancing the thermoelectric performance of CuInTe2.

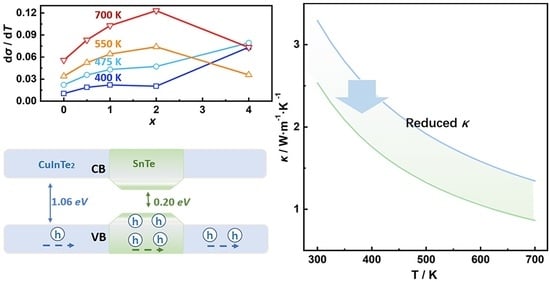
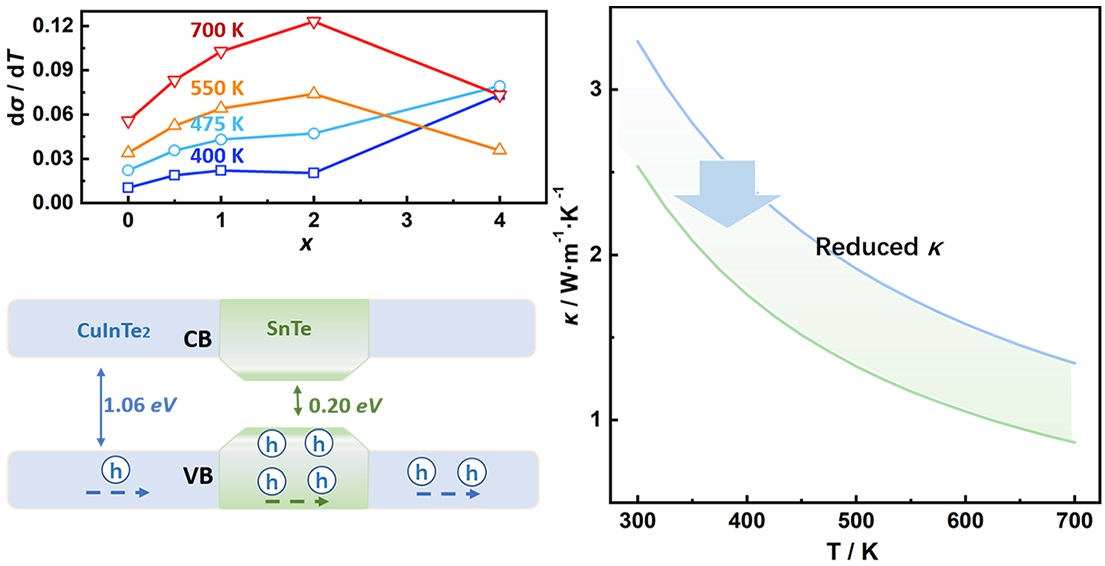
Graphical Abstract

1. Introduction

Thermoelectric (TE) technology is considered a compelling pathway for harvesting renewable energy, offering a viable means for waste heat recovery and refrigeration [1,2,3]. The conversion efficiency of a thermoelectric device is predominantly determined by the dimensionless figure of merit z T = ( α 2 σ )   T / κ , where α, σ, α2σ, κ, and T are the Seebeck coefficient, electrical conductivity, power factor, thermal conductivity, and absolute temperature, respectively [4,5]. Approaches to enhancing zT can be categorized into α 2 σ (power factor) boosting by optimizing the n (carrier concentration) [6,7], or κL (lattice thermal conductivity) reducing by defect engineering [8,9]. Although electrical conductivity modulation by carrier concentration tuning has been widely attempted, the thermal conductivity is invariably compromised due to inherent coupling between electrical conductivity and carrier thermal conductivity. From this perspective, strategies such as carrier pocket engineering [10,11,12], interfacial effects [13,14], and entropy engineering [15,16], as well as energy-filtering effects [17,18] have garnered significant interest for their capacity to concurrently modulate the intrinsic carrier concentration and enhance phonon scattering. Consequently, the primary focus in thermoelectric research is the discovery and development of materials that achieve substantially higher zT values.
Among the TE materials, the ternary Cu-based p-type semiconductor, CuInTe2, characterized by a comparatively narrow bandgap, has been extensively investigated [19,20]. A preferred approach to improving thermoelectric properties is introducing alien atoms into the matrix to optimize carrier concentration [21]. In addition, adjusting the stoichiometry in CuInTe2 will generate stress fields and defects, which are recognized to contribute to significant lattice thermal conductivity reduction. For instance, the use of non-stoichiometric CuInTe2, synthesized by Kim et al., effectively improved the power factor by ~16.1 μW cm−1K2 at 723 K [22]. Through a systematic variation in Cu content in CuInTe2, Li et al. achieved controlled modulation of Cu vacancies, thereby establishing vacancy engineering as a viable route to improved thermoelectric performance [23]. Luo et al. demonstrated that the heterogeneous matrix/precipitate interfaces, through an in situ oxidation, effectively enhanced the power factor and enhanced phonon scattering, resulting in the improvement in zT [24]. This approach has motivated the present study on CuInTe2 modified via SnTe incorporation. These innovative strategies have provided renewed momentum for tailoring both the chemical composition and microstructure of thermoelectric materials to achieve enhanced zT values.
In this study, we specifically explore the role of SnTe incorporation in altering the charge and heat-carrier transport within CuInTe2. Phonons with varied frequencies were expected to be further scattered by multiscale defects—such as point defects, precipitates, and grain boundaries induced by SnTe incorporation—leading to enhanced thermoelectric properties. In parallel with material composition optimization, the synthesis methodology itself represents a critical, but often overlooked, dimension of thermoelectric materials research. Conventional preparation methods for CuInTe2 and related compounds typically involve long-duration melting (several hours) followed by slow cooling or hot-pressing. In recent years, rapid synthesis techniques—including microwave-assisted methods, levitation melting combined with spark plasma sintering, and hydrothermal approaches—have emerged as alternatives that significantly reduce processing time from hours to minutes while maintaining or even improving material quality. Meanwhile, microwave heating (MH) offers distinct advantages over conventional synthesis methods, including higher energy conversion efficiency and lower processing cost. Although this technique has been successfully employed in the preparation of thermoelectric materials such as BiCuSeO-Cu2Se and Cu2Se [25,26], its application to CuInTe2 remains largely unexplored.
This work aims to address these gaps by establishing microwave melting combined with SnTe incorporation as a rapid and energy-efficient synthesis pathway for CuInTe2 modification. While our primary objective is not to achieve the highest possible zT value but rather to demonstrate the feasibility of this innovative synthesis approach, our findings reveal a 1.7-fold enhancement in electrical conductivity relative to pristine CuInTe2, coupled with significant reduction in lattice thermal conductivity due to multiscale defect scattering. We acknowledge that the current peak zT of 0.44 at 675 K is lower than state-of-the-art CuInTe2-based materials reported in the literature; however, this study provides critical foundational insights for further optimization of carrier concentration and SnTe doping amounts. Our results establish a viable pathway for CuInTe2 modification via rapid microwave melting, with systematic optimization expected to yield significantly improved zT values in forthcoming studies. These findings may serve as a valuable reference for guiding the continued development and optimization of CuInTe2 thermoelectric systems, particularly emphasizing the balance between performance and energy-efficient synthesis.

2. Results and Discussion

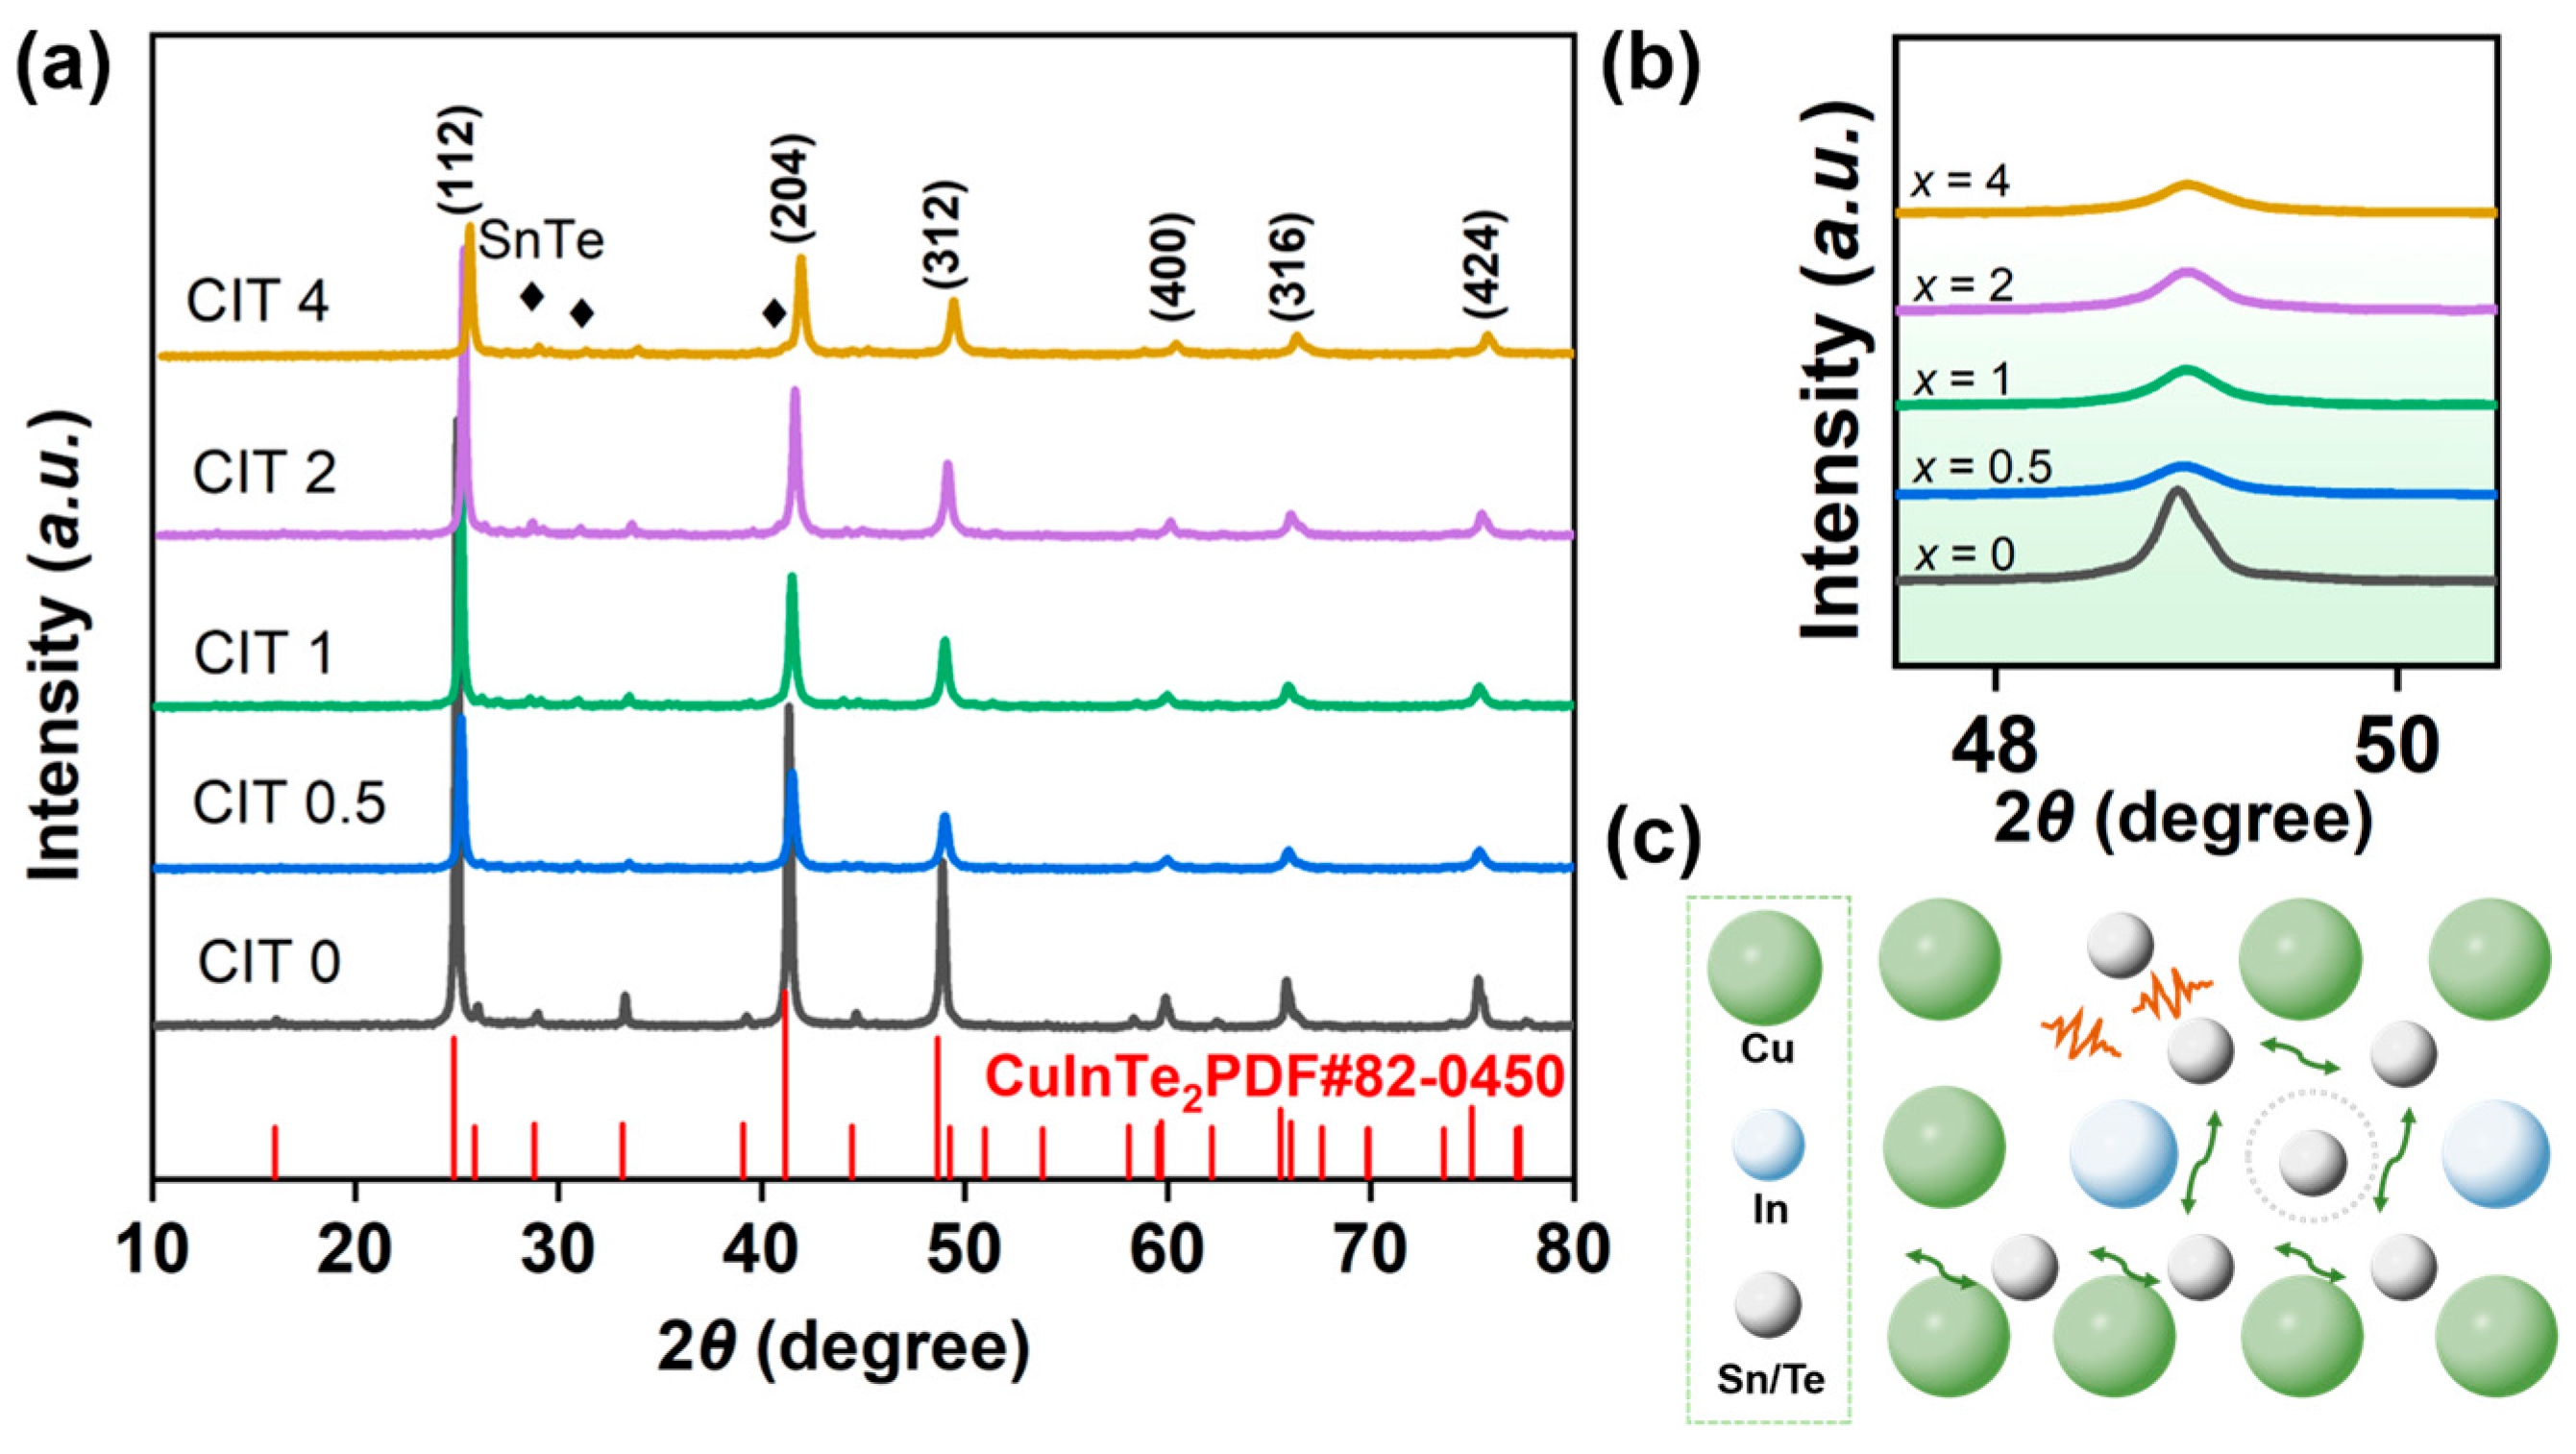
The powder XRD patterns of the prepared CIT samples have been depicted based on the tetragonal CuInTe2 (space group, I-42d, a = b = 6.18 Å, c = 12.39 Å), as shown in Figure 1. Additionally, weak diffraction peaks corresponding to the cubic SnTe phase (space group, Fm-3m, a = b = c = 5.99 Å) are detected within the resolution limit of XRD. The coexistence of CuInTe2 and residual SnTe-derived features may contribute to the reduction in lattice thermal conductivity through enhanced phonon scattering at lattice distortions and local strain fields. An enlarged view of the diffraction patterns between 47° and 51° is plotted in Figure 1b. A systematic shift in the diffraction peaks toward higher 2θ values is observed with increasing SnTe content, which is primarily attributed to the partial substitution of indium (1.56 Å) by tin (1.45 Å), as the smaller ionic radius of Sn leads to a decrease in interplanar spacing. This shift corresponds to a progressive contraction in the lattice parameters, which has also been reported in the Cu2Se and Cu3SbSe4 systems [27,28]. Combined with the lattice distortion schematic (Figure 1c) and XRD patterns, it can be inferred that various structural features present within the material may collectively act as potential phonon-scattering centers. Further analysis of the role played by these effects in modulating the electrical and thermal transport properties of CuInTe2 will be discussed in a later section.
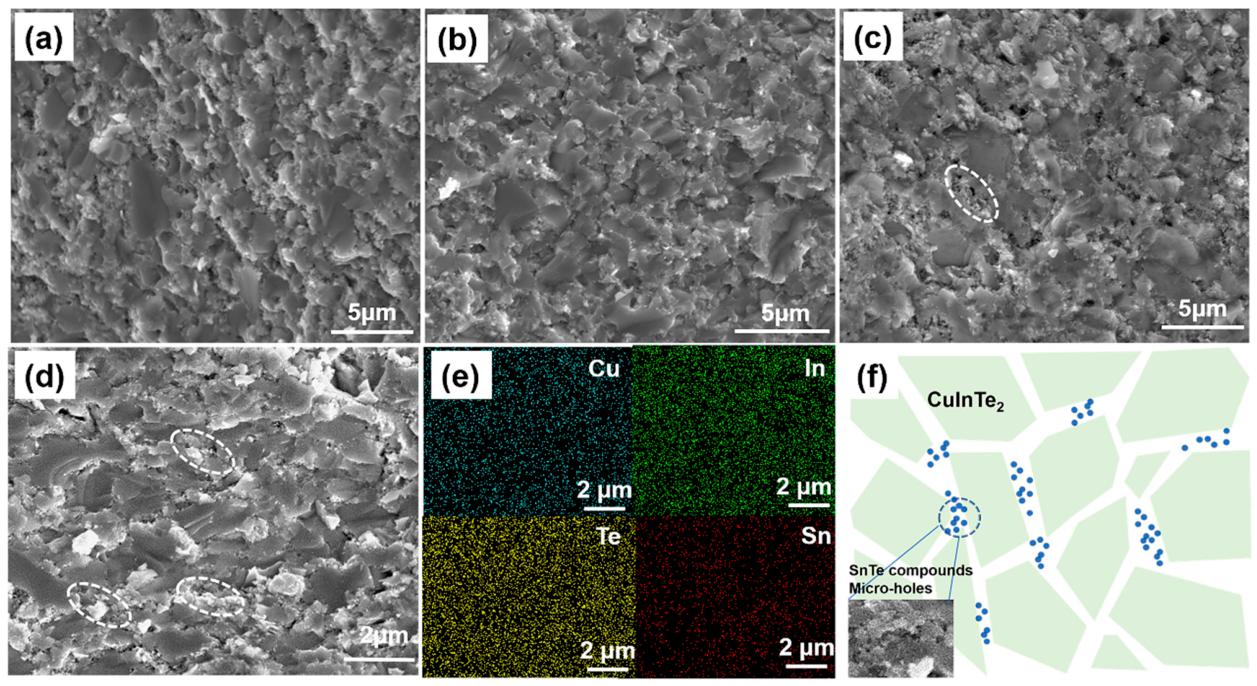
To further investigate the fractured surface of CIT samples, SEM analysis was conducted. Densely packed grains were observed, indicating good sinterability and low porosity in the prepared CuInTe2. However, a limited number of micro-holes and precipitates, ranging in size from hundreds of nanometers to several microns, were also observed embedded along the grain boundaries of the CuInTe2-2 wt% SnTe sample, as marked by the cyan circle in Figure 2. The porosity of the CIT samples was increased upon SnTe incorporation, which is considered beneficial for enhancing phonon scattering and suppressing lattice thermal conductivity. In addition, to further determine the distribution of each constituent element, the CuInTe2-4 wt% SnTe sample was analyzed by elemental mapping. A homogeneous distribution of Sn was confirmed by the EDS analysis presented in Figure 2e, suggesting that Sn derived from SnTe was incorporated into the CuInTe2 matrix. This can be intuitively interpreted from Figure 2f, where numerous interfaces were provided by residual secondary phases, and pores in this system could lead to significant modifications in the electrical and thermal transport properties. It is well-established that microstructural features such as the size, number, and distribution of pores directly affect the relative density. The density and relative density of the CIT samples fabricated via the microwave method are presented in Table 1. The relative density of all samples exceeded 95%, and the theoretical density was calculated based on the nominal composition of CuInTe2 with varying SnTe additions. It can be inferred from Table 1 that the relative density of SnTe-modified samples was lower than the pristine phase.
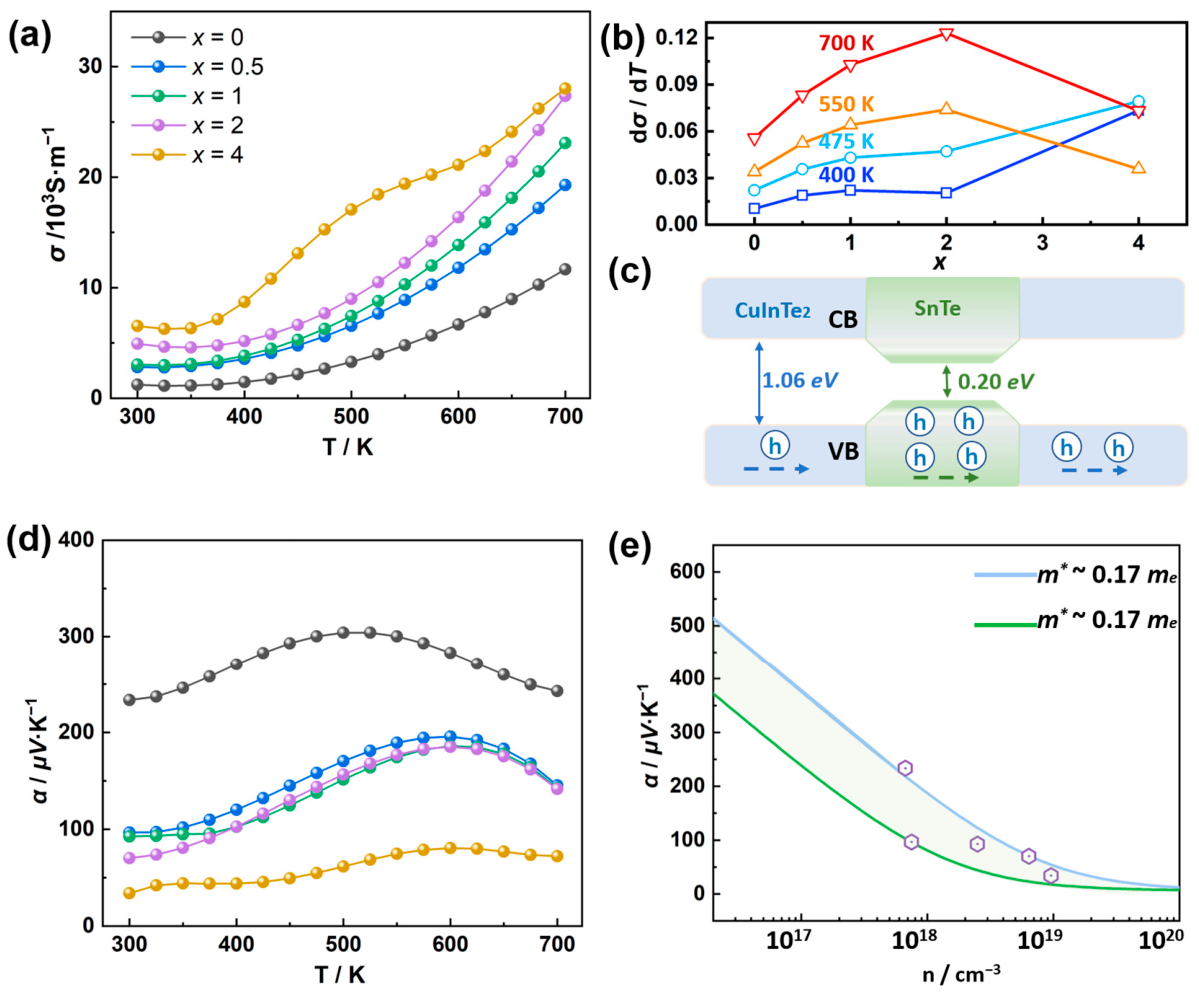
The electrical properties of CIT samples obtained by the microwave method are shown in Figure 3. The electrical conductivity (σ) and electrical conductivity gradient (k) of CIT samples are displayed in Figure 3a,b, respectively. It can be seen that the electrical conductivity for all samples exhibited a monotonic increase as the temperature was elevated. For a given temperature region, the σave of samples increased substantially with SnTe content, rising from 7 × 10³ Sm−1 to 2.7 × 10⁴ Sm−1, representing a 170% enhancement over that of pristine CuInTe2. It can be observed that the σ of the CuInTe2-2 wt% SnTe sample and the CuInTe2-4 wt% SnTe sample remained nearly constant at 750 K, and was 142% higher than that of the pristine phase. In order to quantify the manipulation of electric performance in CuInTe2 after SnTe addition, the relationship between the slope of σ and the added amount of SnTe at different temperatures were summarized, as shown Figure 3b. For the x ≤ 2 composites, the value of k increased with the SnTe addition, which was attributed to the high n ~1020 cm−3 (Table 1) owing to the spontaneous formation of intrinsic Sn vacancies. For the x = 4 sample, the increasing trend of k was slowed down after 475 K. This observation suggests that the interaction between the Cu and SnTe might potentially contribute to the variation in electrical conductivity, although the exact mechanism remains to be further investigated. It is speculated that an ionic exchange process could possibly influence the overall carrier contribution to electrical properties within the temperature range [29,30], but definitive confirmation requires additional characterization such as XPS analysis. Consequently, with increasing x, a diminution trend of the k for CuInTe2 is observed. Figure 3c depicts the energy-band model of the SnTe-modified CuInTe2 system [31]. The significant enhancement in electrical conductivity can be primarily attributed to the substantial increase in hole carrier concentration (from 6.7 × 1017 cm−3 for CIT 0 to 9.6 × 1018 cm−3 for CIT 4, as listed in Table 1), which arises from the spontaneous formation of intrinsic Sn vacancies (VSn) within the incorporated SnTe. As illustrated in Figure 3c, the introduction of SnTe establishes a type-I (straddling) band alignment at the SnTe/CuInTe2 hetero-interfaces due to the narrower band gap (0.20 eV) and higher-lying valence band maximum (VBM) of SnTe compared to CuInTe2 (1.06 eV), driving hole injection from SnTe into the CuInTe2 matrix and elevating the overall carrier concentration while creating potential barriers at the interfaces. These potential barriers simultaneously enable the energy-filtering effect that preferentially scatters low-energy carriers while allowing high-energy carriers to pass through, enhancing the Seebeck coefficient without significantly compromising electrical conductivity. Furthermore, Sn incorporation and the resulting lattice contraction alter the band curvature near the Fermi level, with calculations based on the single parabolic band (SPB) model indicating an increase in the density-of-states effective mass (me) from 0.04 me (CIT 0) to 0.08 me (CIT 2). Therefore, the superior electrical transport properties result from a synergistic effect combining enhanced carrier concentration from Sn vacancies, carrier energy filtering at hetero-interfaces, and moderately increased density-of-states effective mass due to band structure modulation, which decouples the traditional inverse relationship between electrical conductivity and the Seebeck coefficient and enables the observed significant improvement in the power factor. The carrier concentration values were extracted from Hall effect measurements using the van der Pauw method. The Hall coefficient RH was measured, and the carrier concentration n was calculated using the relation n = 1 / e R H , where e represents the elementary charge. The temperature-dependent Seebeck coefficient for the CIT samples is plotted in Figure 3d. The positive values of the Seebeck coefficient indicated that holes were the dominant charge carriers across all compositions. Moreover, the Seebeck coefficient decreases with increasing SnTe content, which is attributed to the enhanced carrier concentration. Additionally, the effective mass was calculated to be 0.04 me and 0.08 me for CIT0.5 and CIT2, where me represents the free electron mass. These observed variations suggest that SnTe incorporation influences both the carrier concentration and the effective mass, as summarized in Figure 3e. Within the framework of a single parabolic band (SPB) model, assuming acoustic phonon scattering, the effective mass of charge carriers (m*) was derived using the following expressions:
m * = 1 2 k B T ( 3 4 π F 1 2 ( η ) ) 2 3
where the kB, , η, and e are the Boltzmann constant, reduced Planck constant, reduced Fermi energy, and elementary charge, respectively.
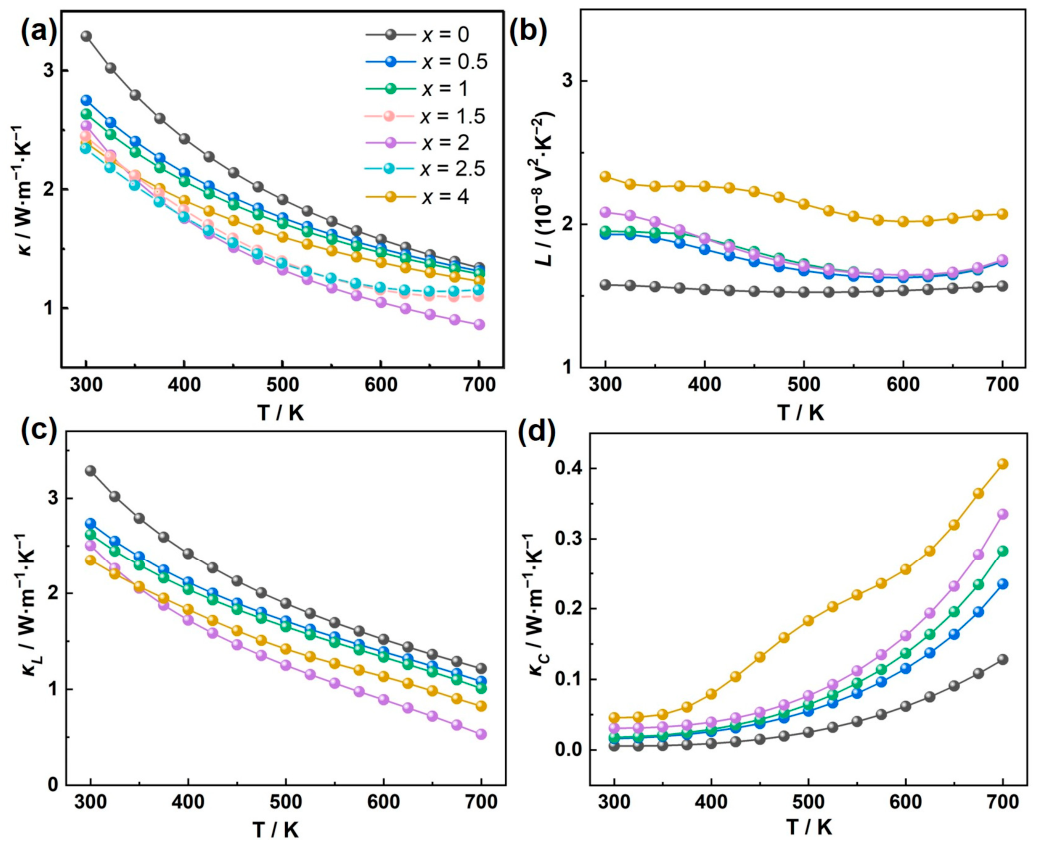
The total thermal conductivity (κtot) of CIT samples is shown in Figure 4a. Owing to strong phonon–phonon interactions, which are typical for crystalline materials, the κtot was observed to decreased rapidly with the increasing temperature [32]. Additionally, the total thermal conductivity measured for the x = 2 sample was found to be substantially lower than that of the pristine composition. To further elucidate the composition dependence of thermal conductivity, we extended our measurements to include additional samples with 1.5% and 2.5% SnTe inclusion. As clearly demonstrated in Figure 4a, the thermal conductivity exhibits a non-monotonic variation with respect to SnTe content. The lattice conductivity decreases progressively from the pristine sample to the x = 1.5% sample, reaches a minimum at x = 2 wt%, and then shows a noticeable increase for both the x = 2.5% and x = 4% samples. This non-monotonic behavior can be rationalized by considering the competing mechanisms governing phonon scattering in the SnTe-modified CuInTe2 system. The electronic thermal conductivity (Figure 4d) was calculated using κ c = L σ T . To avoid underestimation of the lattice thermal conductivity contribution, the Lorentz constant (L) obtained from the single parabolic band (SPB) model was adopted, as shown in Figure 4b. It can be seen that the trend of electronic thermal conductivity of CIT samples was consistent with the electrical conductivity. With increasing SnTe content, the κL of CIT samples decreased and reached 2.3 Wm−1K−1 at 300 K in the CuInTe2-4 wt% SnTe sample (Figure 4c), which can be partly attributed to enhanced phonon scattering at lattice distortions and local strain fields induced by SnTe incorporation.
It is speculated that the presence of Sn-related defects and residual structural features enhanced phonon scattering across the entire measured temperature range. To further elucidate the origin of low thermal conductivity, the structural defect parameters u (anion positional parameter) and η (tetragonal distortion parameter) of samples were calculated. These parameters are derived from the Abrahams and Bernstein formulas and characterize the degree of structural distortion in the chalcopyrite crystal lattice:
μ = 1 2 1 4 2 c 2 a 2 2 1 2
η = c 2 a
The tetragonal distortion parameter η (Equation (1)) quantifies the elongation or compression of the anion tetrahedron along the c-axis relative to the a-axis for an ideal zinc-blend derivative structure with a perfectly cubic unit cell, η = 1. Deviation from unity indicates tetragonal distortion of the lattice. The anion positional parameter u (Equation (2)) defines the position of the chalcogen atom (Te) along the body diagonal of the tetrahedron. In an ideal chalcopyrite structure, the theoretical value is u = 0.25. Deviations from this ideal value (|Δu| = |u − 0.25|) reflect anion displacement due to differences in cation–anion bond strengths and local strain fields. The lattice constants, which are critical for structural defect characterization, are listed in Table 2. The crystal structure and lattice parameters were determined by X-ray diffraction (XRD) analysis. The lattice constants were calculated using Bragg’s law (nλ = 2d sin θ), where λ is the X-ray wavelength (Cu Kα, λ = 1.5406 Å), θ is the diffraction angle, and d is the interplanar spacing. For the cubic crystal structure, the lattice constant (a) was calculated using the relationship a = λ√(h2 + k2 + l2)/(2sin θ), where (h, k, and l) are the Miller indices of the diffraction peaks. The lattice constant values reported in Table 2 were obtained by averaging calculations from multiple diffraction peaks to ensure accuracy. To estimate the experimental uncertainty, each sample was measured three times. The relative standard deviation was approximately ±2%. As presented in Table 2, the lattice constants of the CIT samples decreased progressively with SnTe incorporation, indicating lattice contraction induced by the substitution of Sn ions into the CuInTe2 crystal structure. The value of |u| was increased from 0.0008 to 0.0052, indicating that the lattice distortion was significantly altered by the introduction of SnTe. It was proposed that the slight lattice parameter variation originated from internal lattice mismatch within the CIT samples, which was, in turn, expected to play a role in determining the thermal transport properties of the SnTe-modified CuInTe2 system [33]. At lower SnTe concentrations (≤2 wt%), the primary scattering mechanism is point-defect scattering induced by the substitutional incorporation of Sn ions into the CuInTe2 lattice. This results in significant lattice distortion, as evidenced by the increased anion positional parameter deviation |Δu| (from 0.0008 in pristine to 0.0052 at x = 2), which strongly suppresses phonon propagation. However, as the SnTe concentration exceeds 2 wt%, additional microstructural features emerge that may alter the thermal transport landscape.
It should be noted that the reduction in thermal conductivity may result from multiple mechanisms, including porosity, SnTe inclusions, grain boundaries, and Sn incorporation into the CuInTe2 lattice. The present observations suggest that there exists an optimal SnTe concentration (−2 wt%) at which the phonon-scattering efficiency is maximized, balancing between sufficient point-defect density and minimal adverse effects from secondary phase formation. This optimal composition represents a trade-off between the beneficial effect of enhancing point-defect scattering and the potential detrimental impact of excess SnTe on the overall microstructure and thermal conductivity. However, the relative contribution of each factor requires quantitative analysis that is beyond the scope of this study. We plan to conduct systematic investigations in our future work to characterize the microstructure and quantitatively evaluate the contribution of each scattering mechanism to the overall thermal conductivity.
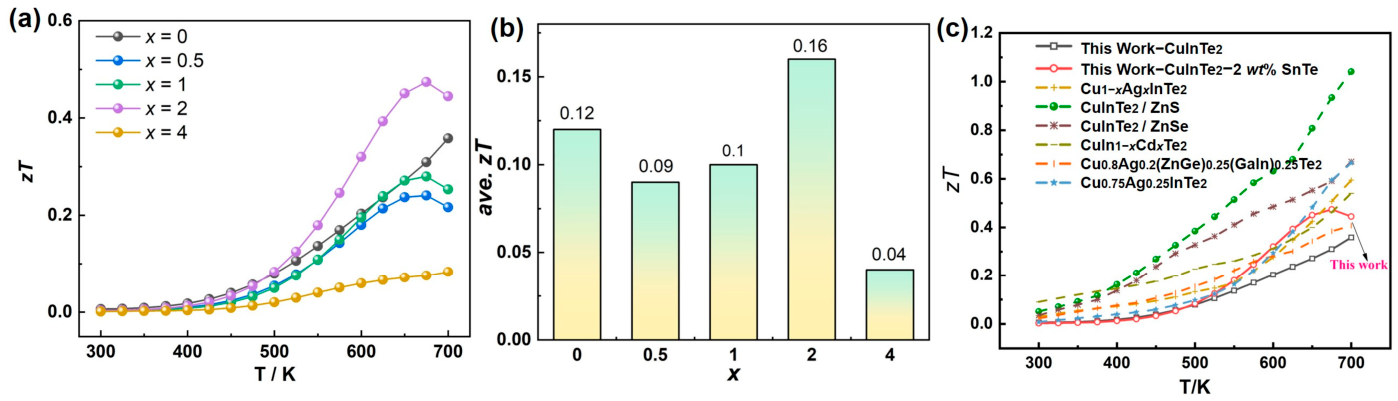
The thermoelectric performance of the CIT samples was evaluated by the dimensionless figure of merit, zT, with its temperature-dependent values shown in Figure 5a. The zT of CIT samples was observed to increase with the temperature. Benefiting from the combination of enhanced electrical performance and reduced lattice thermal conductivity, a peak zT value of 0.44 at 675 K was achieved for the CuInTe2-2 wt% SnTe sample, representing a 1.4-fold enhancement compared to the pristine matrix. The average zT values of CIT samples are shown in Figure 5b. The average zT was calculated by integrating the temperature-dependent zT curve over the measured temperature range and dividing by the temperature interval. The average zT value for CuInTe2-2 wt% SnTe sample was higher than that of the pure CuInTe2. Furthermore, a comparison of the temperature-dependent zT values for several reported p-type CuInTe2 materials with excellent thermoelectric performance is summarized in Figure 5c [28,34,35,36,37]. In addition, pure CuInTe2 can achieve zT values of up to 1.18 at 850 K through specific preparation techniques involving Cu-vacancy engineering [38]. More recent studies have reported even higher zT values: Cu0.992InTe2 achieved zT ≈ 0.9 at 873 K with precision copper vacancy regulation, and CuInTe2-based alloys with chemical composition modulation achieved zT = 1.51 at 838 K [23,39]. Our work adopted a rapid microwave melting method combined with SnTe inclusion, which represents an initial exploratory. Nevertheless, we recognize that the current zT value of 0.44 at 675 K is lower than state-of-the-art CuInTe2-based materials reported in the literature. Future work will focus on further optimizing the Cu-deficiency level, carrier concentration, and SnTe doping amount to enhance the thermoelectric performance.

3. Materials and Methods

The stoichiometric CuInTe2 and SnTe compounds were fabricated via a cold pressing–microwave melting method. High-purity copper, indium, and tellurium powders (Aladdin, ≥99.99%) were first homogenized by ball milling, and then the mixture was pressed into bulk precursors. The pressed CuInTe2 was placed into a carbon crucible and encapsulated in an evacuated silica ampoule. Microwave heating of the encapsulated sample was conducted for 10 min, after which the ampoule was slowly cooled. Following the same procedure, crystalline SnTe ingots of high quality were synthesized from appropriately proportioned mixtures of Sn (99.99%) and Te (99.999%) powders. The CuInTe2 and SnTe powders were mixed according to the desired SnTe weight fractions (x = 0, 0.5, 1, 2, 4 wt%), and then ball milled for 12 h at a rotational speed of 300 rpm using a planetary ball mill. Isopropanol was used as the milling medium to prevent oxidation, and the slurry was dried at 80 °C under vacuum for 24 h after milling. The resulting composite powders were then densified by rapid hot pressing (RHP) at 673 K for 30 min under an axial compressive stress of 60 MPa, yielding disc-shaped specimens with dimensions of φ12 × 1.5 mm. Ultimately, the high-density bulk CuInTe2-x wt% SnTe (x = 0, 0.5, 1, 2, 4) sample thermoelectric materials were obtained, denoted as CIT 0, CIT 0.5, CIT 1, CIT 2, and CIT 4, respectively.
The relative density (d) of the CIT specimens was determined using the Archimedes method. Phase identification was conducted by X-ray diffraction (XRD) with Cu Kα radiation, over a 2θ range of 10–80° at a scanning rate of 4°/min. Under a low-pressure (−102 Pa) helium atmosphere, electrical performance testing of the samples was conducted using a Seebeck coefficient/resistance determination system (LSR-3, Linseis, Selb, Germany) from 300 to 750 K to determine the electrical conductivity and Seebeck coefficient. All the block samples used for testing were ground and polished into disc-shaped samples with a diameter of −12.7 mm and a thickness of −1.3 mm. Moreover, the thermal conductivity of the disc-shaped samples was determined using a flash laser thermal conductivity meter (LFA1000, Linseis, Germany) in a flowing argon atmosphere within a temperature range consistent with the electrical properties. The thermal conductivity was derived using the standard formula κ = λρCp, where λ, ρ, and Cp are the thermal diffusivity, density, and specific heat, respectively. Thermal diffusivity data were collected employing a laser flash diffusivity instrument. The inherent error associated with this ultrasonic method was quantified as 1%, arising predominantly from the measurement accuracy of sample thickness. At ambient temperature, the electrical transport performance parameters. including hole carrier concentration and carrier mobility, were measured using the temperature-variable hall effect testing system (CH-100, Beijing, China) in a reversible magnetic field of 0.5 T.

4. Conclusions

An effective strategy for improving the electrical properties of p-type CuInTe2 is proposed, wherein SnTe incorporation is employed to achieve enhanced thermoelectric performance. Electrical conductivity of up to 7000 Sm−1 at room temperature was achieved due to the increased carrier concentration upon 4 wt% SnTe addition. The introduction of lattice distortion and micro-holes into CuInTe2 efficiently enhanced phonon scattering across a wide spectrum of mean free paths. The κL of the CIT sample decreased from 3.4 Wm−1K−1 to 2.3 Wm−1K−1 at room temperature, while the electrical properties remained undegraded. As a result, an average zT of 0.16 was attained in p-type CuInTe2-based compounds. This work demonstrates an alternative strategy for simultaneously optimizing carrier concentration and thermal conductivity, providing a novel route to enhancing the thermoelectric performance of copper-based ternary compounds.

Author Contributions

Conceptualization, L.B., Y.W., W.W. and L.S.; validation, L.B., W.Z., X.L. and D.Z.; formal analysis, L.B. and D.Z.; data curation, L.B.; writing—original draft preparation, L.B. and D.Z.; writing—review and editing, L.B. and D.Z.; funding acquisition, L.B., W.Z., X.L. and D.Z. All authors have read and agreed to the published version of the manuscript.

Funding

This study was supported by Financial supports from the Key R&D Program of Shandong Province, China (2025CXGC020107), the Opening Project of State Key Laboratory of Crystal Materials (KF2609), the Innovation Capacity Improvement Project for Technology-Based Small and Medium Enterprises in Shandong Province (grant no. 2024TSGC0788), the Taishan Scholar Program of Shandong Province (grant no. tsqn202306225), the Shandong Postdoctoral Science Foundation (grant no. SDBX2023025), the Natural Science Foundation of Shandong Province (grant no. ZR2024QE044), the Modern Industrial Leading Talents program of Dezhou (grant no. 2022017), the Leader of Scientific Research Studio Program of Jinan (grant no. 2021GXRC082), University of Jinan Disciplinary Cross-Convergence Construction Projects 2023 (grant nos. XKJC-202301 and XKJC-202311), and the Jinan City-School Integration Development Strategy Project (grant nos. JNSX2023015 and JNSX2023018).

Institutional Review Board Statement

Not applicable.

Informed Consent Statement

Not applicable.

Data Availability Statement

The original contributions presented in this study are included in the article. Further inquiries can be directed to the corresponding author.

Conflicts of Interest

The author Yongpeng Wang was employed by Binzhou Special Equipment Inspection and Research Institute company (Binzhou, China). The author Shilai Zeng was employed by Shandong Huanbang Electronic Technology Co., Ltd. Company (Linyi, China). The remaining authors declare that the research was conducted in the absence of any commercial or financial relationships that could be construed as a potential conflict of interest.

References

  1. Zhao, P.; Xue, W.; Zhang, Y.; Zhi, S.; Ma, X.; Qiu, J.; Zhang, T.; Ye, S.; Mu, H.; Cheng, J.; et al. Plasticity in single-crystalline Mg3Bi2 thermoelectric material. Nature 2024, 631, 777–782. [Google Scholar] [CrossRef] [PubMed]
  2. Yu, J.; Liu, X.; Hu, H.; Jiang, Y.; Zhuang, H.-L.; Li, H.; Su, B.; Li, J.-W.; Han, Z.; Wang, Z.; et al. Ultralow thermal conductivity and high zT of Cu2Se-based thermoelectric materials mediated by TiO2 nanoclusters. Joule 2024, 8, 2652–2666. [Google Scholar] [CrossRef]
  3. Zhang, Z.; Ming, C.; Song, Q.; Wang, L.; Chen, H.; Liao, J.; Wang, C.; Chen, L.; Bai, S. Grain boundary modulation improved thermal stability of high thermoelectric performance Mg3(Sb,Bi)2-based compounds. Acta Mater. 2025, 287, 120806. [Google Scholar] [CrossRef]
  4. Yu, J.; Hu, H.; Jiang, Y.; Zhuang, H.-L.; Thong, H.-C.; Su, B.; Li, J.-W.; Han, Z.; Li, H.; Pei, J.; et al. Interface-enhanced high-temperature thermoelectricity in Cu1.99Se/B4C composites with synergistically improved mechanical strength. Adv. Energy Mater. 2024, 14, 2303942. [Google Scholar] [CrossRef]
  5. Zhang, C.; Jin, K.; Dong, H.; Xu, W.; Xu, P.; Yan, Z.; Zhao, W.; Xu, B.; Fu, L. Synergistic enhancement of thermoelectric performance of n-type PbTe by resonant level and single-atom-layer vacancies. Nano Energy 2024, 126, 109615. [Google Scholar] [CrossRef]
  6. Xiong, Q.; Han, G.; Wang, G.; Lu, X.; Zhou, X. The doping strategies for modulation of transport properties in thermoelectric materials. Adv. Funct. Mater. 2024, 34, 2411304. [Google Scholar] [CrossRef]
  7. Wei, S.; Ji, Z.; Li, W.; Zheng, S.; Wang, Q.; Li, Z.; Yu, L.; Luo, S.; Song, W. Enhanced thermoelectric properties of Cu3SbSe4-based materials by synergistic modulation of carrier concentration and phonon scattering. J. Mater. 2024, 10, 339–347. [Google Scholar] [CrossRef]
  8. Wang, D.; Liu, W.; Mao, Y.; Li, S.; Yin, L.; Wu, H.; Li, M.; Wang, Y.; Shi, X.; Yang, X.; et al. Decoupling carrier-phonon scattering boosts the thermoelectric performance of n-Type GeTe-based materials. J. Am. Chem. Soc. 2024, 146, 1681–1689. [Google Scholar] [CrossRef] [PubMed]
  9. Li, L.; Zhai, W.; Wang, C.; Chen, Y.; Li, S.; Fan, P.; Cheng, Z.; Yang, G.; Wang, J.; Mao, Y. Maximizing phonon scattering efficiency by Cu2Se alloying in AgCuTe thermoelectric materials. J. Mater. Chem. A 2022, 10, 6701–6712. [Google Scholar] [CrossRef]
  10. Chang, C.; Wu, M.; He, D.; Pei, Y.; Wu, C.-F.; Wu, X.; Yu, H.; Zhu, F.; Wang, K.; Chen, Y. 3D charge and 2D Phonon Transports Leading to High Out-of-plane zT in n-Type SnSe Crystals. Science 2018, 360, 778–783. [Google Scholar] [CrossRef] [PubMed]
  11. Ozen, M.; Yahyaoglu, M.; Candolfi, C.; Veremchuk, I.; Kaiser, F.; Burkhardt, U.; Snyder, G.J.; Grin, Y.; Aydemir, U. Enhanced thermoelectric performance in Mg3+xSb1.5Bi0.49Te0.01 via engineering microstructure through melt-centrifugation. J. Mater. Chem. A 2021, 9, 1733–1742. [Google Scholar] [CrossRef]
  12. Park, J.; Xia, Y.; Ozoliņš, V.; Jain, A. Optimal band structure for thermoelectrics with realistic scattering and bands. npj Comput. Mater. 2021, 7, 43. [Google Scholar] [CrossRef]
  13. Li, P.; Shi, J.; Wu, X.; Li, J.; Hu, L.; Liu, F.; Li, Y.; Ao, W.; Zhang, C. Interfacial engineering of solution-processed Bi2Te3-based thermoelectric nanocomposites via graphene addition and liquid-phase-sintering process. Chem. Eng. J. 2022, 440, 135882. [Google Scholar] [CrossRef]
  14. Ahmad, M.; Agarwal, K.; Munoz, S.G.; Ghosh, A.; Kodan, N.; Kolosov, O.V.; Mehta, B.R. Engineering interfacial effects in electron and phonon transport of Sb2Te3/MoS2 multilayer for thermoelectric zT above 2.0. Adv. Funct. Mater. 2022, 32, 2206384. [Google Scholar] [CrossRef]
  15. Deng, Q.; Wen, J.; An, X.; Xie, Y.; Luo, J.; Zhao, Z.; Sa, B.; Dong, H.; Ang, R. Thermoelectric cooling and low-temperature power generation in n-type PbTe enabled by band flattening and entropy engineering. Chem. Eng. J. 2025, 506, 160319. [Google Scholar] [CrossRef]
  16. Ma, Z.; Xu, T.; Li, W.; Cheng, Y.; Li, J.; Zhang, D.; Jiang, Q.; Luo, Y.; Yang, J. High entropy semiconductor AgMnGeSbTe4 with desirable thermoelectric performance. Adv. Funct. Mater. 2021, 31, 2103197. [Google Scholar] [CrossRef]
  17. Pakdel, A.; Guo, Q.; Nicolosi, V.; Mori, T. Enhanced thermoelectric performance of Bi–Sb–Te/Sb2O3 nanocomposites by energy filtering effect. J. Mater. Chem. A 2018, 6, 21341–21349. [Google Scholar] [CrossRef]
  18. Zhou, Z.; Yang, J.; Jiang, Q.; Zhang, D.; Xin, J.; Li, X.; Ren, Y.; He, X. Thermoelectric performance of SnTe with ZnO carrier compensation, energy filtering, and multiscale phonon scattering. J. Am. Ceram. Soc. 2017, 100, 5723–5730. [Google Scholar] [CrossRef]
  19. Wei, J.; Yu, W.; Li, Z.; Hu, J.; Wang, T.; Yu, Y.; Guo, X. Pressure-mediated band engineering and cation ordering for enhanced thermoelectric performance in CuInTe2 chalcopyrites. Chem. Eng. J. 2025, 521, 166531. [Google Scholar] [CrossRef]
  20. Zhang, T.; Ning, S.; Zhang, T.; Qi, N.; Su, X.; Tang, X.; Chen, Z. Stepwise vacancy manipulation for optimized carrier concentration and blocked phonon transport realizing record high figure of merit zT in CuInTe2. Adv. Funct. Mater. 2025, 35, 2419984. [Google Scholar] [CrossRef]
  21. Meschke, V.; Pak, A.; Adamczyk, J.M.; Gomes, L.C.; Baumann, S.; Rome, G.; Porter, C.; Ciesielski, K.; Ertekin, E.; Toberer, E. Amphoteric doping and thermoelectric transport in the CuInTe2–ZnTe solid solution. J. Mater. Chem. C 2025, 13, 8792–8801. [Google Scholar] [CrossRef]
  22. Kim, H.; Kihoi, S.K.; Lee, H.S. Point defects control in non-stoichiometric CuInTe2 compounds and its corresponding effects on the microstructure and thermoelectric properties. J. Alloys Compd. 2021, 869, 159381. [Google Scholar] [CrossRef]
  23. Li, S.; Xie, C.; Liu, K.; Liu, J.; Mei, J.; Ding, G.; Cui, J.; Xu, W.; Cao, C.; Zhang, Q.; et al. Precision engineering of copper vacancies in CuInTe2 for synergistically enhanced thermoelectric performance. J. Mater. Chem. A 2025, 13, 27691–27700. [Google Scholar] [CrossRef]
  24. Luo, Y.; Yang, J.; Jiang, Q.; Li, W.; Zhang, D.; Zhou, Z.; Cheng, Y.; Ren, Y.; He, X. Progressive regulation of electrical and thermal transport properties to high-performance CuInTe2 thermoelectric materials. Adv. Energy Mater. 2016, 6, 1600007. [Google Scholar] [CrossRef]
  25. Lei, Y.; Yong, C.; Qiu, J.; Li, Y.; Xu, L.; Ye, F.; Zhang, S.; Wang, D.; Ni, G. Optimization of thermoelectric performance in BiCuSeO-based materials by constructing Cu2Se composite interface. Ceram. Int. 2025, 51, 11331–11337. [Google Scholar] [CrossRef]
  26. Bo, L.; Zhang, R.; Zhao, H.; Hou, Y.; Wang, X.; Zhu, J.; Zhao, L.; Zuo, M.; Zhao, D. Achieving high thermoelectric properties of Cu2Se via lattice softening and phonon scattering mechanism. ACS Appl. Energy Mater. 2022, 5, 6453–6461. [Google Scholar] [CrossRef]
  27. Zhao, K.; Guan, M.; Qiu, P.; Blichfeld, A.B.; Eikeland, E.; Zhu, C.; Ren, D.; Xu, F.; Iversen, B.B.; Shi, X. Thermoelectric Properties of Cu2Se1−xTex Solid Solutions. J. Mater. Chem. A 2018, 6, 6977–6986. [Google Scholar] [CrossRef]
  28. Wang, C.; Ma, Q.; Xue, H.; Wang, Q.; Luo, P.; Yang, J.; Zhang, W.; Luo, J. Tetrahedral distortion and thermoelectric performance of the Ag-substituted CuInTe2 chalcopyrite compound. ACS Appl. Energy Mater. 2020, 3, 11015–11023. [Google Scholar] [CrossRef]
  29. Olvera, A.; Moroz, N.; Sahoo, P.; Ren, P.; Bailey, T.; Page, A.; Uher, C.; Poudeu, P. Partial indium solubility induces chemical stability and colossal thermoelectric figure of merit in Cu2Se. Energy Environ. Sci. 2017, 10, 1668–1676. [Google Scholar] [CrossRef]
  30. Hwang, J.; Lee, M.; Yu, B.-K.; Han, M.-K.; Kim, W.; Kim, J.; Al Orabi, R.A.R.; Wang, H.; Acharya, S.; Kim, J. Enhancement of thermoelectric performance in a non-toxic CuInTe2/SnTe coated grain nanocomposite. J. Mater. Chem. A 2021, 9, 14851–14858. [Google Scholar] [CrossRef]
  31. Tan, G.; Zhao, L.-D.; Shi, F.; Doak, J.W.; Lo, S.-H.; Sun, H.; Wolverton, C.; Dravid, V.P.; Uher, C.; Kanatzidis, M.G. High thermoelectric performance of p-type SnTe via a synergistic band engineering and nanostructuring approach. J. Am. Chem. Soc. 2014, 136, 7006–7017. [Google Scholar] [CrossRef] [PubMed]
  32. Li, X.; Li, D.; Xin, H.; Zhang, J.; Song, C.; Qin, X. Effects of bismuth doping on the thermoelectric properties of Cu3SbSe4 at moderate temperatures. J. Alloys Compd. 2013, 561, 105–108. [Google Scholar] [CrossRef]
  33. Zhang, D.; Wang, J.; Zhang, L.; Lei, J.; Ma, Z.; Wang, C.; Guan, W.; Cheng, Z.; Wang, Y. High thermoelectric performance of Bi0.46Sb1.54Te3-SnTe: Synergistic modulation of electrical and thermal transport by the introduction of thermoelectric hetero nano region. ACS Appl. Mater. Interfaces 2019, 11, 36658–36665. [Google Scholar] [CrossRef] [PubMed]
  34. Xia, Z.; Wang, G.; Zhou, X.; Wen, W. Substitution defect enhancing thermoelectric properties in CuInTe2. Mater. Res. Bull. 2018, 101, 184–189. [Google Scholar] [CrossRef]
  35. Luo, Y.; Jiang, Q.; Yang, J.; Li, W.; Zhang, D.; Zhou, Z.; Cheng, Y.; Ren, Y.; He, X.; Li, X. Simultaneous regulation of electrical and thermal transport properties in CuInTe2 by directly incorporating excess ZnX (X = S, Se). Nano Energy 2017, 32, 80–87. [Google Scholar] [CrossRef]
  36. Cheng, N.; Liu, R.; Bai, S.; Shi, X.; Chen, L. Enhanced thermoelectric performance in Cd doped CuInTe2 compounds. J. Appl. Phys. 2014, 115, 163705. [Google Scholar] [CrossRef]
  37. Cai, J.; Yang, J.; Liu, G.; Wang, H.; Shi, F.; Tan, X.; Ge, Z.; Jiang, J. Ultralow thermal conductivity and improved zT of CuInTe2 by high-entropy structure design. Mater. Today Phys. 2021, 18, 100394. [Google Scholar] [CrossRef]
  38. Janicek, P.; Kucek, V.; Kasparova, J.; Plechacek, T.; Cernoskova, E.; Benes, L.; Munzar, M.; Drasar, C. Study of Indium Non-stoichiometry in CuInTe2 and Its Effects on the Thermoelectric Properties. J. Electron. Mater. 2019, 48, 2112–2119. [Google Scholar] [CrossRef]
  39. Qu, L.; Luo, Y.; Li, C.; Du, Z.; Li, X.; Cui, J. Chemical Composition Modulation Realizing Remarkable Improvement of Thermoelectric Performance in CuInTe2-Based Alloy. ACS Appl. Mater. Interfaces 2024, 16, 23596–23605. [Google Scholar] [PubMed]
Figure 1. (a) XRD patterns of CIT samples, the black square is labeled as the SnTe phase; (b) the enlarged diffraction peaks of CIT samples; (c) schematic diagram of lattice distortion, schematic diagram of lattice distortion.
Inorganics 14 00194 g001
Figure 2. Cross-sectional SEM images of CIT samples. (a) CuInTe2-0.5 wt% SnTe sample; (b) CuInTe2-1 wt% SnTe sample; (c) CuInTe2-2 wt% SnTe sample; (d) CuInTe2-4 wt% SnTe sample, the white dotted circles clearly show the presence of micrometer-sized holes; (e) EDS elemental mapping for the CuInTe2-4 wt% SnTe sample; (f) schematic of the phase interface, the blue bullets represent SnTe phase inclusions and micropores.
Inorganics 14 00194 g002
Figure 3. (a) Electrical conductivity of CIT samples; (b) electrical conductivity gradient; (c) schematic diagram of the energy band of SnTe/CuInTe2 composite material, where h represents the hole; (d) Seebeck coefficient; (e) carrier-concentration-dependent Seebeck coefficient.
Inorganics 14 00194 g003
Figure 4. Thermal performance of CIT samples. (a) Thermal conductivity. (b) Lorentz constant; (c) lattice thermal conductivity; (d) carrier thermal conductivity.
Inorganics 14 00194 g004
Figure 5. (a) zT of CIT samples as a function of temperature. (b) The average zT of CIT samples. (c) The comparison of reported zT for CuInTe2 compound (continuous thin line).
Inorganics 14 00194 g005
Table 1. The density, relative density, and carrier concentration of CIT samples.
CompositionDensity
(g/cm3)
Theoretical Density
(g/cm3)
Relative Density
(%)
n
(cm−3)
CIT 05.9706.09298.06.7 × 1017
SnTe6.3226.46497.81.4 × 1020
CIT 0.55.9196.07697.47.5 × 1017
CIT 15.8806.07796.72.5 × 1018
CIT 25.8786.08196.66.4 × 1018
CIT 45.8676.08896.49.6 × 1018
Table 2. The structural defect parameters of CIT samples.
Compositionα/Åc/Åu|∆u|
=|u − 0.25|
η|∆η|
=|η − 1|
CIT 06.185212.39100.24920.00081.00170.0017
SnTe5.995.99
CIT 0.56.150112.39920.24600.00401.00800.0080
CIT 16.133412.39100.24500.00501.01010.0101
CIT 26.132312.39290.24480.00521.01050.0105
CIT 46.185212.39100.24920.00081.00170.0017
Disclaimer/Publisher’s Note: The statements, opinions and data contained in all publications are solely those of the individual author(s) and contributor(s) and not of MDPI and/or the editor(s). MDPI and/or the editor(s) disclaim responsibility for any injury to people or property resulting from any ideas, methods, instructions or products referred to in the content.