Article

Electrochemistry of Nickel Complexes with Phosphorylated Dithiocarbamate in Aqueous Media

by
Nikita S. Aksenin
1,
Yury I. Kuzin
1,
Mikhail S. Bukharov
1,
Alexander A. Rodionov
2,
Valery G. Shtyrlin
1 and
Nikita Yu. Serov
1,3,*
1
Alexander Butlerov Institute of Chemistry, Kazan Federal University, Kazan 420008, Russia
2
Institute of Physics, Kazan Federal University, Kazan 420008, Russia
3
Federal Research Center “Kazan Scientific Center of the Russian Academy of Sciences”, Kazan 420111, Russia
*
Author to whom correspondence should be addressed.
Inorganics 2026, 14(6), 168; https://doi.org/10.3390/inorganics14060168
Submission received: 26 May 2026 / Revised: 16 June 2026 / Accepted: 17 June 2026 / Published: 20 June 2026
(This article belongs to the Section Coordination Chemistry)

Abstract

The redox behavior of nickel complexes with sulfur-containing ligands remains of considerable interest due to their significant value in coordination chemistry, catalysis, and bioorganic modeling. In this context, it is important to investigate how aqueous media and acid–base equilibria influence the stability and transformation pathways of such complexes. In this work, the electrochemical behavior of nickel complexes with phosphorylated dithiocarbamate was studied using cyclic voltammetry at various scan rates and pH values. Compared to similar systems in organic solvents, the complexes exhibited additional oxidation and reduction signals, indicating coupled chemical steps. The pH dependence of these peaks confirmed the role of hydroxo groups in the oxidation processes. Varying the scan rate revealed competition between ligand exchange pathways. At low and moderate scan rates, tris-dithiocarbamate nickel(III/IV) complexes are formed, whereas at higher scan rates, hydroxo-containing compounds make a greater contribution. Based on the experimental results and standard redox potentials derived from quantum chemical calculation data, a general scheme for the resulting electrochemical processes was proposed. The results demonstrate the key role of aqueous media and pH in regulating the redox process of nickel complexes with phosphorylated dithiocarbamate.

1. Introduction

Dithiocarbamates (dtcs) are among the most widely studied sulfur-containing ligands in transition metal chemistry due to their high chelating ability, effective delocalization of electron density in complexes and significant therapeutic potential [1,2,3]. Due to their combination of structural, electrochemical and biological properties, nickel(II) complexes with dithiocarbamates are of wide interest for researchers in various fields [4,5,6,7,8].
One of the most important aspects of this interest is associated with the possible biological activity of nickel(II) dithiocarbamate complexes. The synergy between the soft thiophilic metal center and the lipophilic organic ligand results in high permeability through cell membranes and an enhanced ability to interact with key biological targets [9,10,11,12]. Homo- and heteroligand nickel complexes with dithiocarbamates have exhibited a wide range of biological activity, including antimicrobial, antifungal, antioxidant, and antitumor effects [12,13].
In addition to their biological actions, such complexes are attractive precursors for functional inorganic materials. Dithiocarbamate complexes are known as single-source precursors for the preparation of nanoparticles of metal oxides and sulfides [7,14,15]. It has been shown that the ligand structure, solvent, and decomposition conditions determine the phase, size, shape, and functional properties of the resulting nanoparticles. Nickel oxide and sulfide nanoparticles obtained from dithiocarbamate complexes have exhibited promising semiconductor, electrochemical and photocatalytic properties [8,16,17,18].
The application-oriented properties of nickel dithiocarbamate complexes are largely governed by their structure and redox behavior, which determine the stability, chemical reactivity, and possible transformation pathways of these complexes. A unique feature of nickel dithiocarbamates is their ability to participate in multielectron redox processes, stabilizing formal oxidation states of nickel from I to IV [2,19,20]. The electrochemical oxidation of nickel(II) complexes with dithiocarbamates is an irreversible process complicated by coupled chemical steps. This process has been extensively studied using cyclic voltammetry and coulometry in organic media [19,20,21].
In weakly coordinating solvents, the oxidation of Ni(II) to Ni(IV) occurs as an apparent two-electron process [22]. This behavior arises from potential inversion caused by the structural rearrangement of the Ni(III) complex species [19,20]. After the one-electron oxidation of [NiII(dtc)2] (electrochemical stage), the intermediate [NiIII(dtc)2]+ abstracts a dithiocarbamate ligand from another [NiII(dtc)2] molecule to form [NiIII(dtc)3] (chemical stage). This species is then immediately oxidized to [NiIV(dtc)3]+ at the applied potential (electrochemical stage). Thus, the oxidation of [NiII(dtc)2] is an example of the ECE mechanism [23]. A pseudo-first-order rate constant of 34 s−1 was determined for this chemical step in a 1 mM complex solution in acetonitrile [24]. The reverse reduction, however, is divided into two successive one-electron steps: [NiIV(dtc)3]+ → [NiIII(dtc)3] → [NiII(dtc)2], separated by hundreds of millivolts.
Recent studies by Farnum’s group have shown that the ratio of one- and two-electron pathways can be controlled through various additives or the solvent itself, both of which affect the nickel(III) species. For example, in the presence of pyridine, the intermediate [NiIII(dtc)2]+ is stabilized as [NiIII(dtc)2(py)2]+. This species is stable at high potential scan rates but converts to the more thermodynamically stable [NiIV(dtc)3]+ form at low rates via parallel pathways involving mono- and bipyridine complexes [21,24]. Extension of this approach to a series of substituted pyridines showed that ligand dissociation rate constants increase with the increasing electron-withdrawing properties of the substituent, suggesting that pyridine dissociation is the rate-determining step [24]. On the cathodic branch, the addition of catalytic amounts of Zn2+ was found to merge separate one-electron reduction waves into a single two-electron process [25].
By analogy with pyridine additives, the solvate environment of Ni(III) complexes plays a significant role in the kinetics and reversibility of redox processes. In weakly coordinating solvents (acetonitrile and acetone), the oxidation of [NiII(dtc)2] is a single-wave, two-electron process. Conversely, in methanol, dimethylformamide, and dimethyl sulfoxide, a separate one-electron oxidation wave appears due to the formation of solvated [NiIII(dtc)2(sol)x]+ complexes [22]. The oxidation peak shifts toward more negative potentials as the coordinating ability of the solvent increases, and the reversibility of the one-electron wave is enhanced. In the non-coordinating solvent dichloromethane, a more distinct behavior is observed: two irreversible oxidation waves occur via an EEC mechanism instead of ECE [22]. Temperature-dependent studies of the apparent activation parameters ΔHapp and ΔSapp revealed two pathways for the formation of the tris-dithiocarbamate complex through dimeric Ni(III) species.
Unlike organic solvents, studies of nickel dithiocarbamate complexes in aqueous media are rare. This is largely due to the low water solubility of complexes with most synthesized dithiocarbamate derivatives. However, aqueous media mimic physiological conditions, which is undoubtedly important for studying the mechanisms of action of potential therapeutic agents. On the other hand, an aqueous environment imposes certain limitations: uncoordinated dithiocarbamate undergoes irreversible hydrolysis to carbon disulfide and the corresponding amine, and this process accelerates with decreasing pH [26,27]. As demonstrated for alkyl and aryl substituents, introducing hydrophilic functional groups into a dithiocarbamate can not only enhance the aqueous solubility of the resulting complexes but also alter their redox potentials, electron transfer kinetics, and hydrolytic stability [2,26,28,29,30]. Furthermore, the coordination of water molecules or hydroxide ions can substantially influence the mechanisms of multielectron transformations, opening new opportunities to control the selectivity of redox processes and stabilize high-valent intermediates.
This work is primarily devoted to the electrochemical investigation of water-soluble nickel complexes with a new type of dithiocarbamate bearing a phosphonate group as one of the substituents. Quantum chemical calculations were performed as an additional approach to establish the mechanism of the redox transformations of these complexes. This method proved its relevance, as was previously demonstrated for copper complexes with phosphorylated dithiocarbamates [27].

2. Results and Discussion

2.1. Complexation of NiII(PDTC)22−

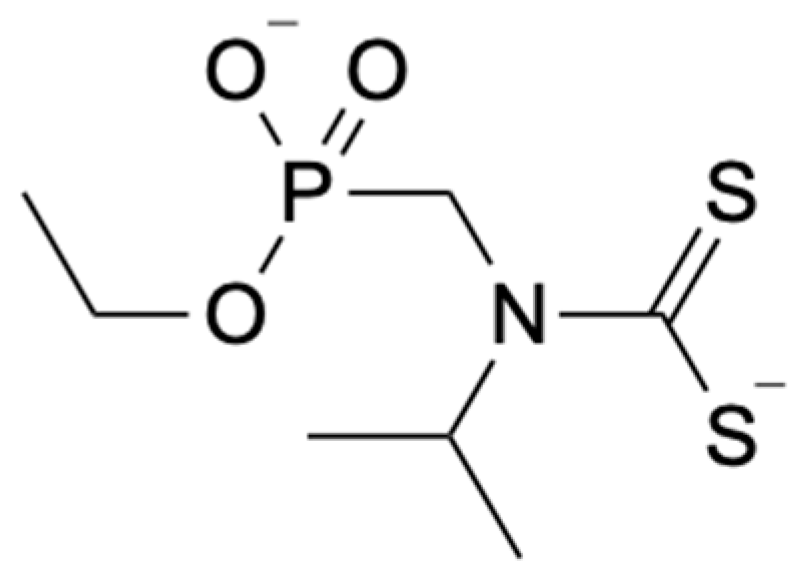
The structure of the phosphorylated dithiocarbamate used in this study is given in Scheme 1. In the text and Supplementary Materials, this ligand is designated as PDTC.
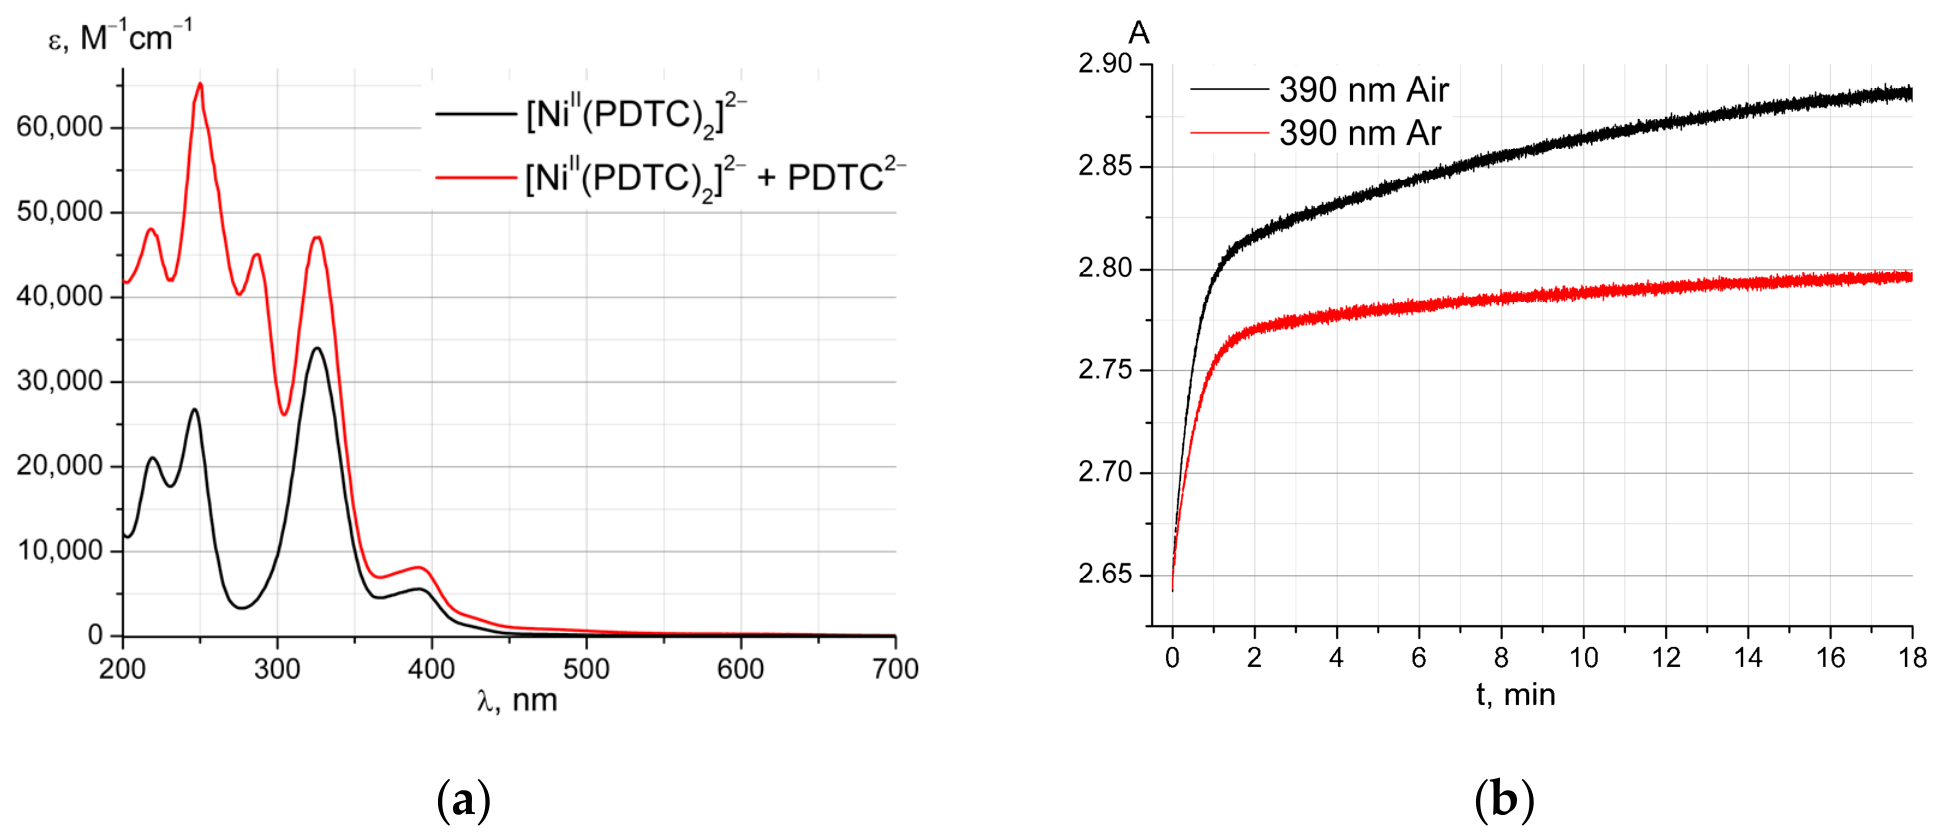
During substitution titrations of a [NiII(PDTC)2]2− complex solution with ethylenediamine, an unusual coloration was observed. This color was similar to that of the complex solution after exposure to oxidizing agents, as well as to the color observed in the near-electrode region upon applying an anodic potential during cyclic voltammetry. Solutions of nickel(II) with phosphorylated dithiocarbamate were prepared in ratios of 1:2 and 1:20 and kept for one hour without inert gas bubbling; their absorption spectra were recorded (Figure 1a). The figure shows a difference in the absorption spectra of the solutions in the visible region of the spectrum, where phosphorylated dithiocarbamate does not absorb, indicating the formation of a new complex form.
To confirm the occurrence of nonequilibrium processes with nickel(II) bis-dithiocarbamate in the presence of excess ligand, the mixing of the complex with excess ligand after bubbling the solutions with argon and without it was studied using the stopped-flow method (Figure 1b).
As shown in Figure 1b, the absorbance of the solution changes after mixing regardless of the presence of dissolved oxygen. However, it is worth noting that the change in absorbance after argon bubbling is approximately half that observed in the solution containing dissolved oxygen. The effect of inert gas bubbling on these results indicates the redox nature of the processes. Oxidation presumably occurs due to the formation of an intermediate tris-dithiocarbamate nickel(II) complex in the presence of excess ligand. The oxidation potential of this intermediate may be significantly lower than that of the bis-dithiocarbamate complex. A similar phenomenon, as noted earlier, is known for the bis- and tris-dithiocarbamate complex of nickel(III), which will be discussed in further detail in Section 2.2.2.
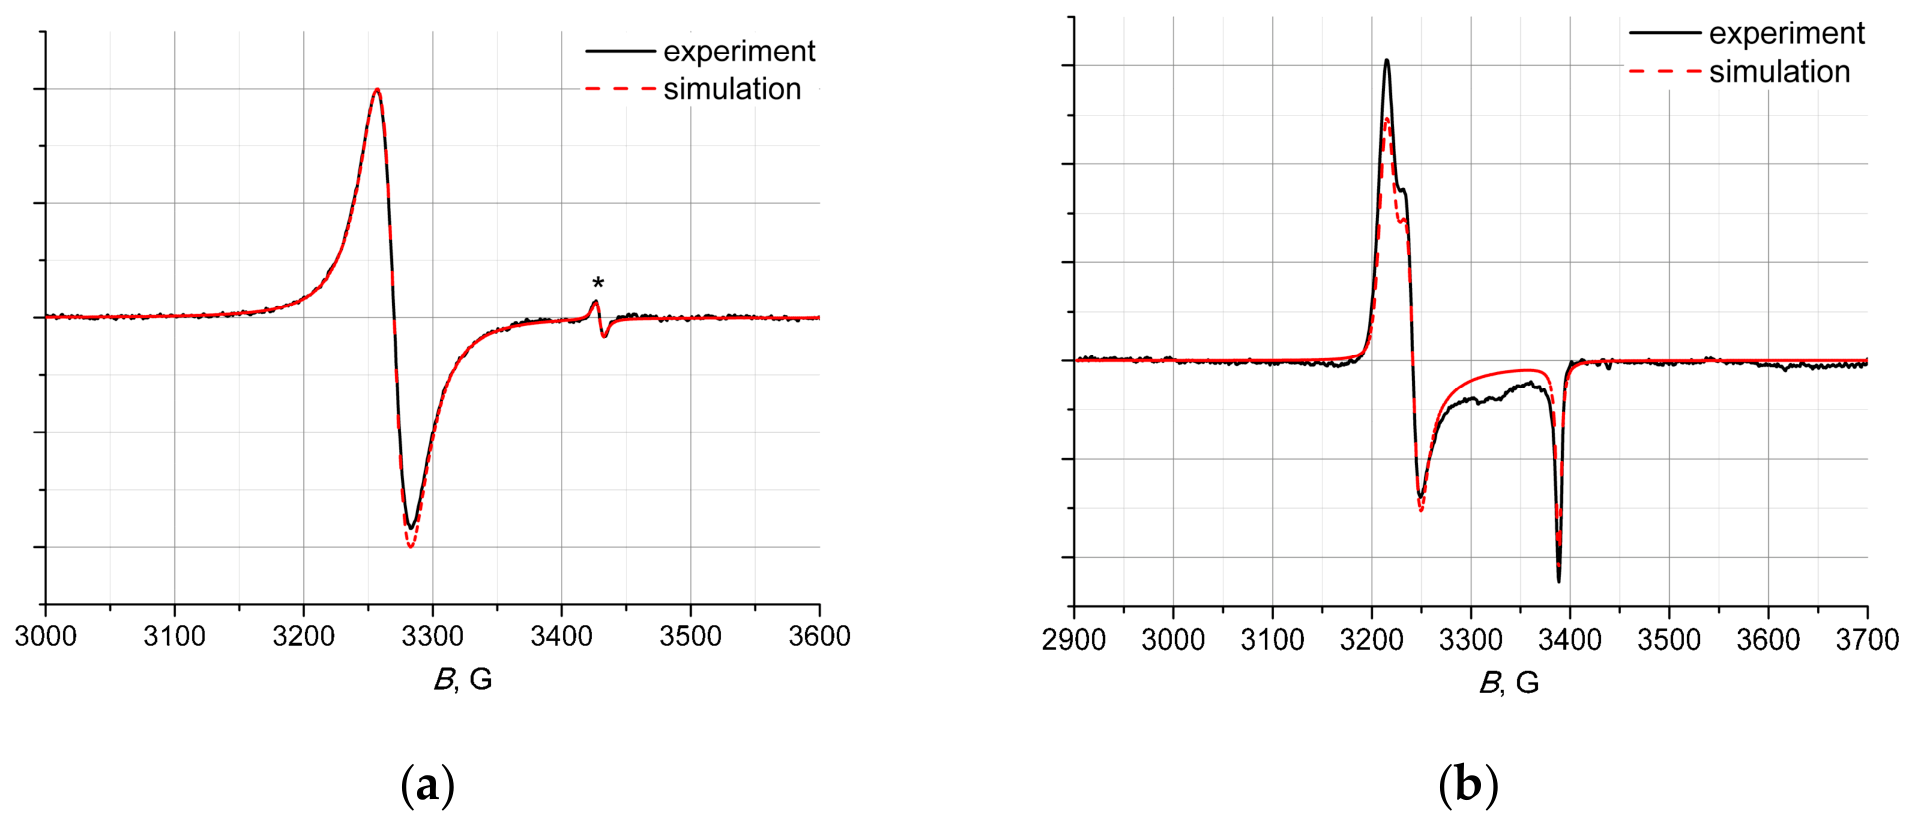
Recorded EPR spectra of the nickel(II) solution with an excess of PDTC (Figure 2) confirm the formation of the [NiIII(PDTC)3]3− complex. The room-temperature spectrum consists of one isotropic signal with g0 = 2.1005. The EPR spectrum at 105 K displays a characteristic orthorhombic frozen-solution pattern with clearly resolved gx, gy, and gz regions. The spin Hamiltonian parameters are gx = 2.137, gy = 2.119, and gz = 2.027.
The observed effects indicate limitations in studying the stability of the Ni(II) complex with phosphorylated dithiocarbamate in aqueous media. Therefore, its redox behavior was further investigated using electrochemical methods.
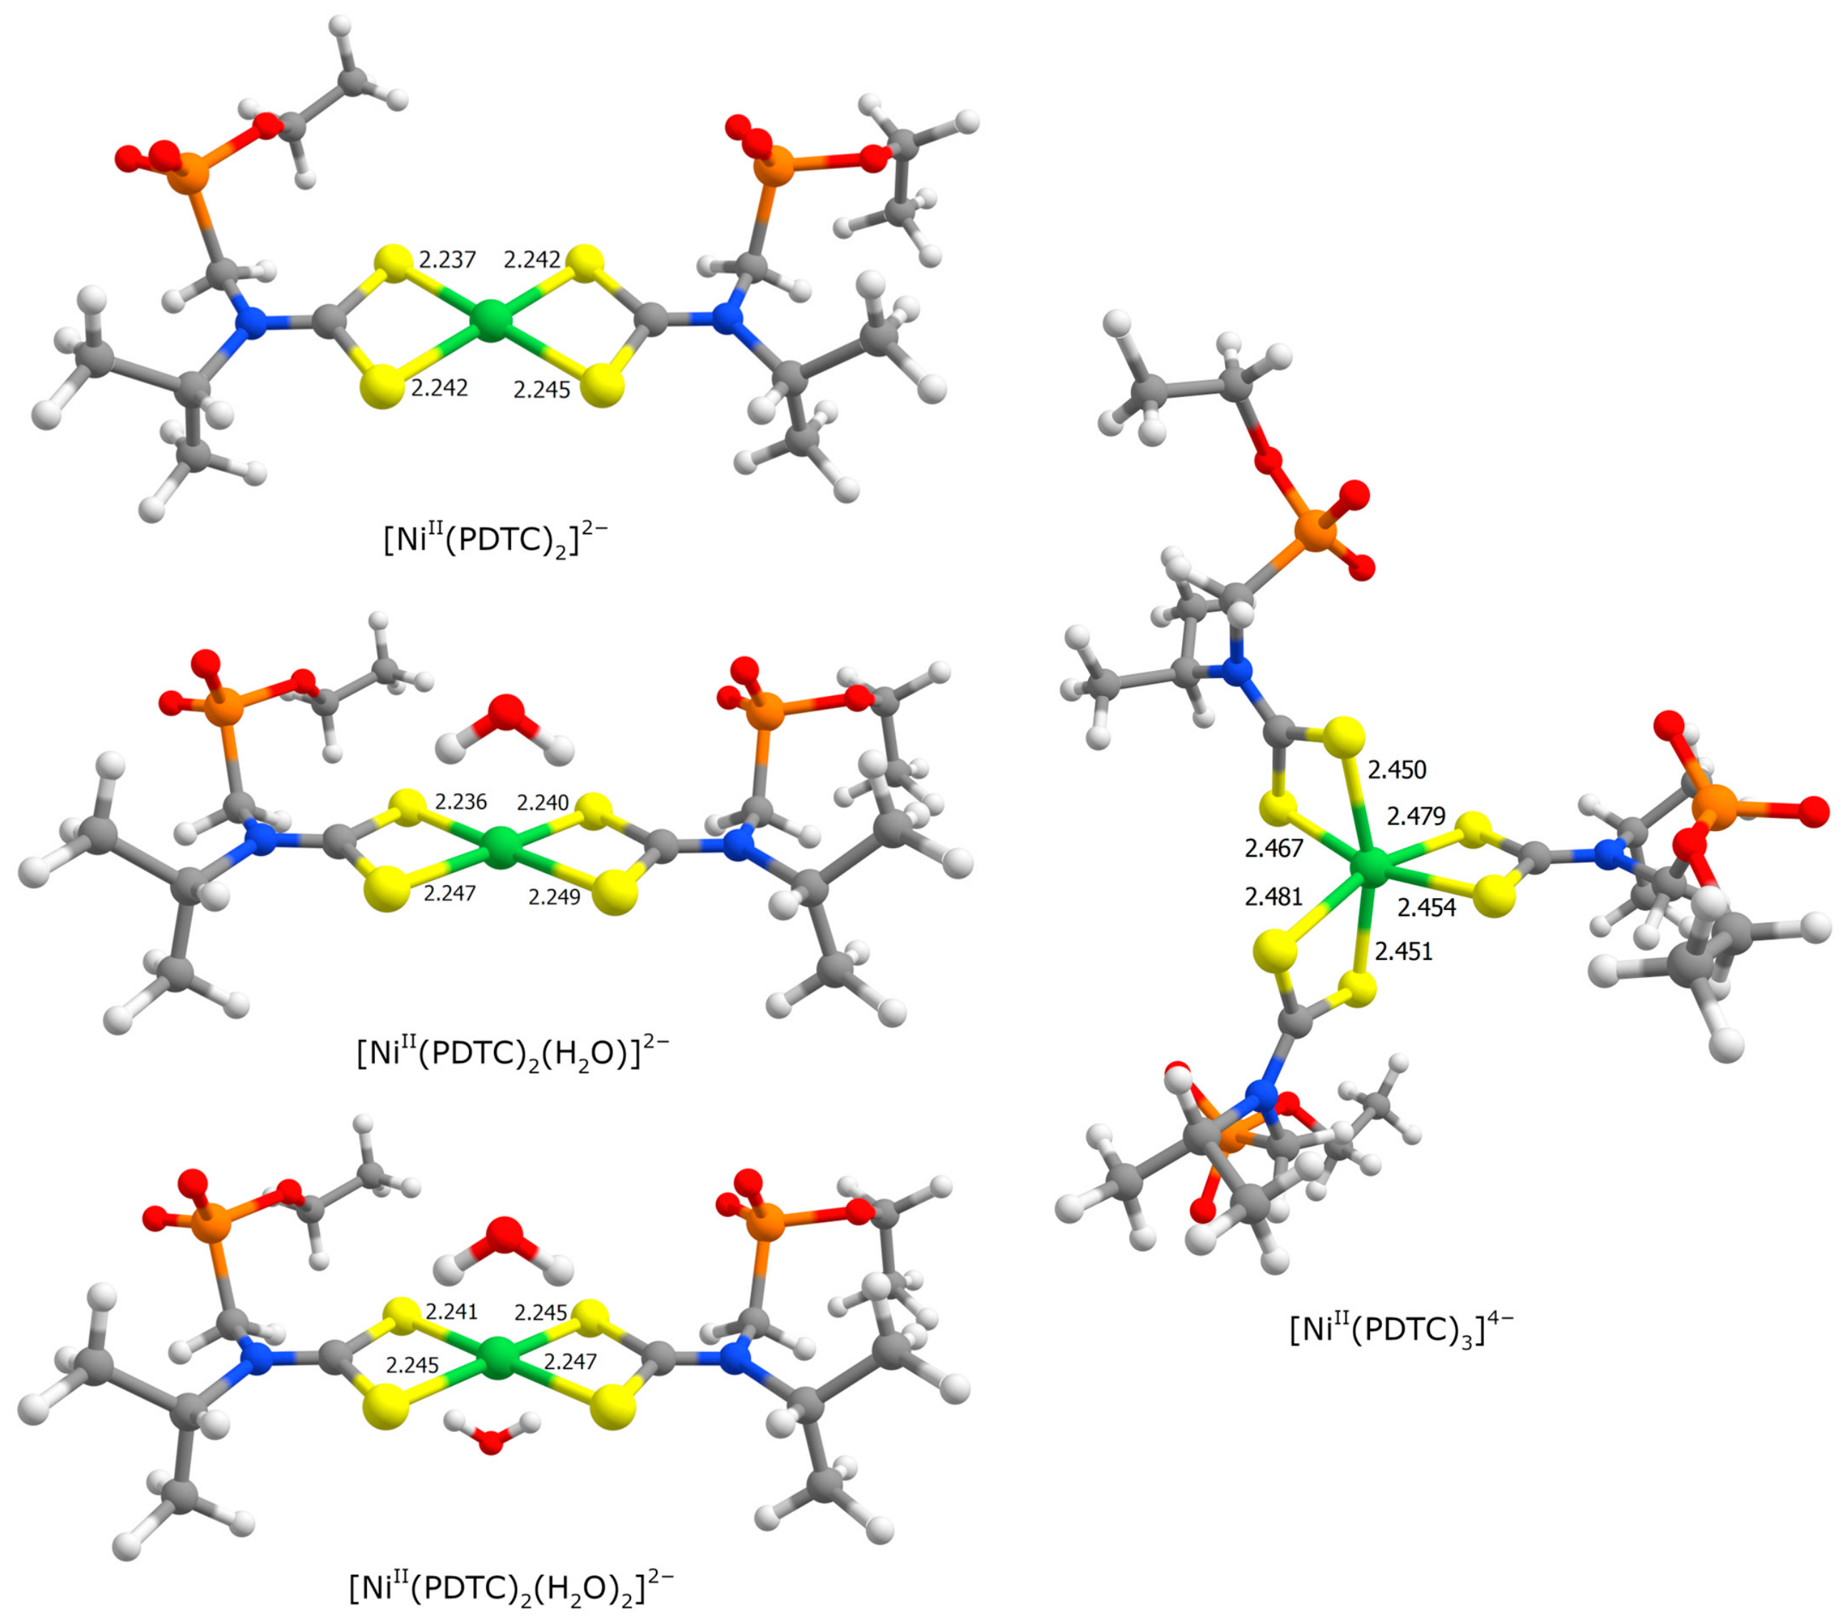
Optimized structures of the nickel(II) bis-complexes with phosphorylated dithiocarbamate are provided in Figure 3 (detailed information, including calculations with the SMD model, is available in Figures S1–S6 and Tables S1–S6 in the ESI). Notably, even with the addition of water molecules, the nickel(II) coordination arrangement remains square-planar; water molecules leave the first coordination sphere during optimization (see the final structures with one and two water molecules in Figure 3). This situation is very similar to that previously described for copper(II) complexes with phosphorylated dithiocarbamates [27].
The structure of the aforementioned nickel(II) tris-complex is also shown in Figure 3. All six nickel–sulfur coordination bond lengths are close to each other (2.45–2.48 Å), forming an octahedral coordination arrangement (which is distorted due to the impossibility of right octahedral angles resulting from the formation of three four-membered chelate rings). Coordination bonds in the tris-complex are significantly longer than those in the bis-complex (see Figure 3).

2.2. Electrochemical Study

Background curves were recorded in the absence of complexes to ensure that the electrode surface was clean and that no additional redox signals were present. For this purpose, a prepared glassy carbon electrode (GCE) was immersed in a buffer solution with the chosen pH value, and cyclic voltammograms (CVs) were recorded at a scan rate of 0.1 V/s. A certain aliquot of the nickel(II) dithiocarbamate complex was then added to the working solution to reach a final concentration of 2 mM.
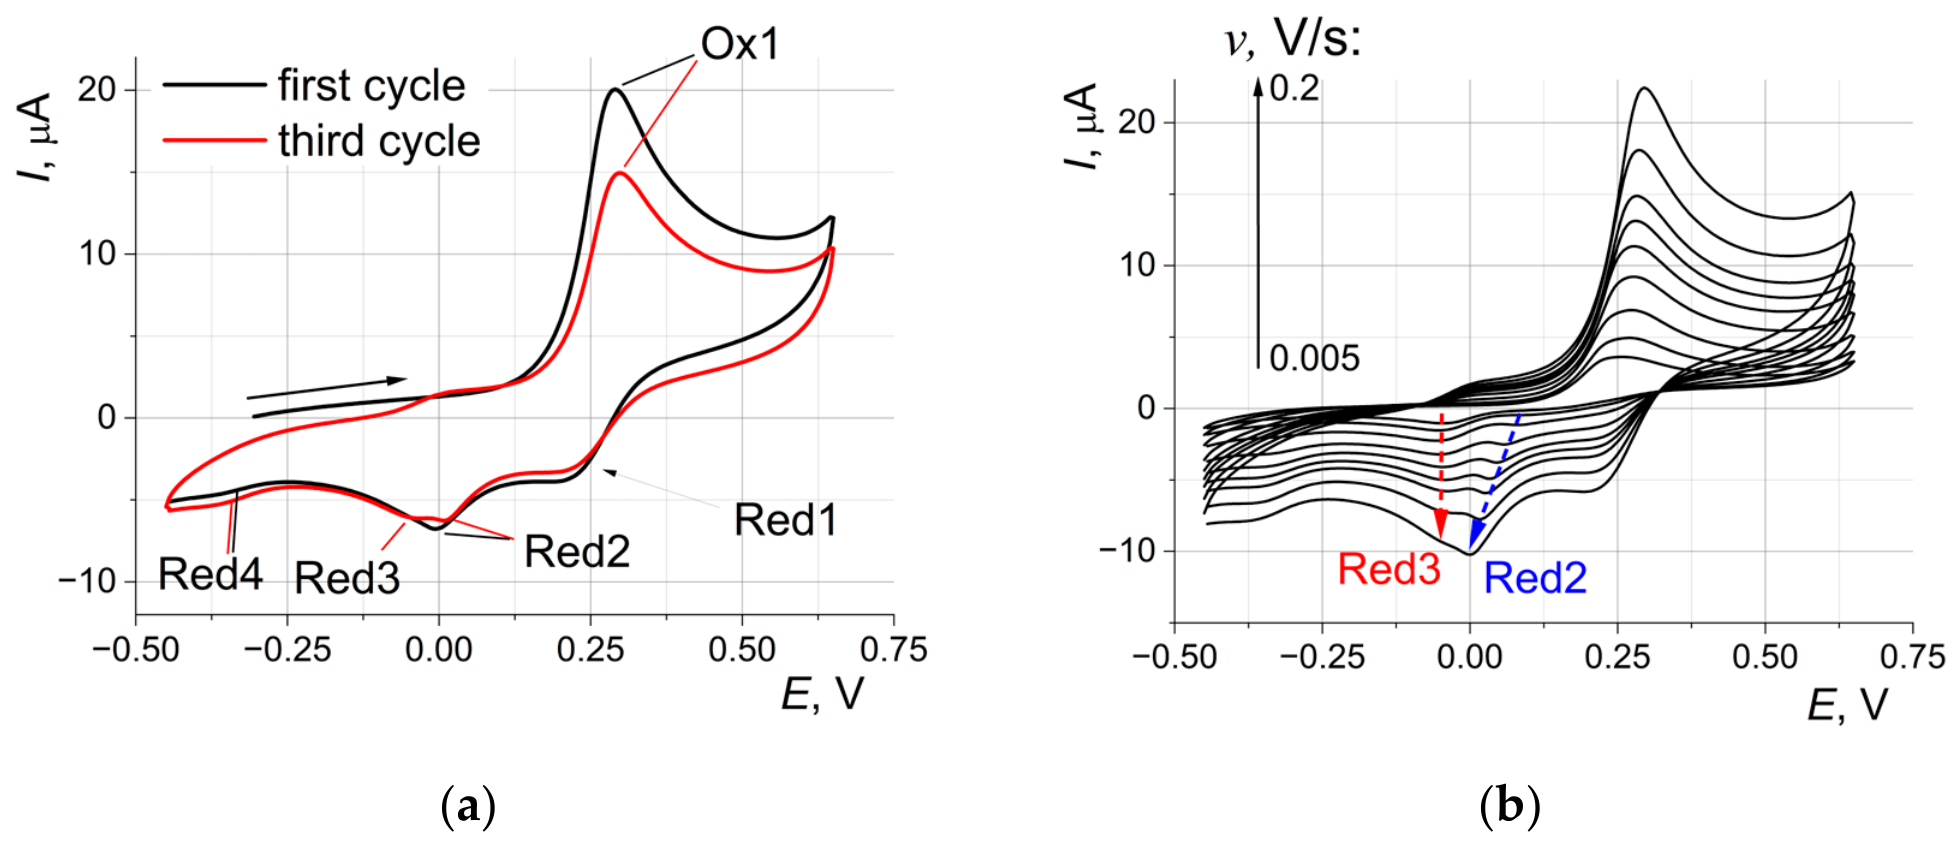
Cyclic voltammograms of the nickel(II) complexes are shown in Figure 4a. At pH = 9 and a scan rate of 0.1 V/s, the studied complex produced one oxidation peak (~0.295 V) and three reduction peaks (0.015 V, −0.040 V, and −0.320 V). The symbol “Red1” denotes the possible reverse process for the Ox1 peak: [NiIII(PDTC)2]/[NiII(PDTC)2]2−. The third reduction peak (Red3) became more pronounced during the third potential cycle, while all other signals stabilized. According to the aforementioned literature data, the oxidation peak (Ox1) corresponds to the Ni(II) → Ni(IV) transition [20]. The electroreduction signal in the region of −0.320 V (Red4) can be tentatively attributed to the [NiIII(PDTC)3]3− → [NiII(PDTC)3]4− transition [19,20].
Experiments with varying scan rates were performed to determine the nature of the other reduction signals (0.015 V and −0.040 V) (Figure 4b). Increasing v from 0.005 V/s to 0.2 V/s led to an increase in the Red2 reduction peak and its merging with the Red3 signal, which is predominant at low scan rates. The presence of a “shoulder” on the ascending part of Ox1 for low v values should also be noted. It is quite obvious that an additional oxidation process occurs, leading to the formation of a compound capable of electroreduction on the reverse branch of the voltammogram. Increasing the scan rate resulted in an increase in Red1. The same behavior was previously reported in the literature, emphasizing the complex mechanism of nickel(II) dithiocarbamate electrooxidation [21]. At higher scan rates, less time is available for chemical steps to occur after nickel(II) oxidation. The observed behavior of the Red2 and Red3 signals can be explained by two competitive chemical steps occurring after the oxidation of [NiII(PDTC)2]2−. Since the Red3 peak predominates at low rates, it can be assumed that the species reduced in this region is more stable than the species responsible for the Red2 peak. However, because the formation of the former (Red3) requires more time, the contribution of Red2 to the recorded current begins to predominate as the scan rate increases.
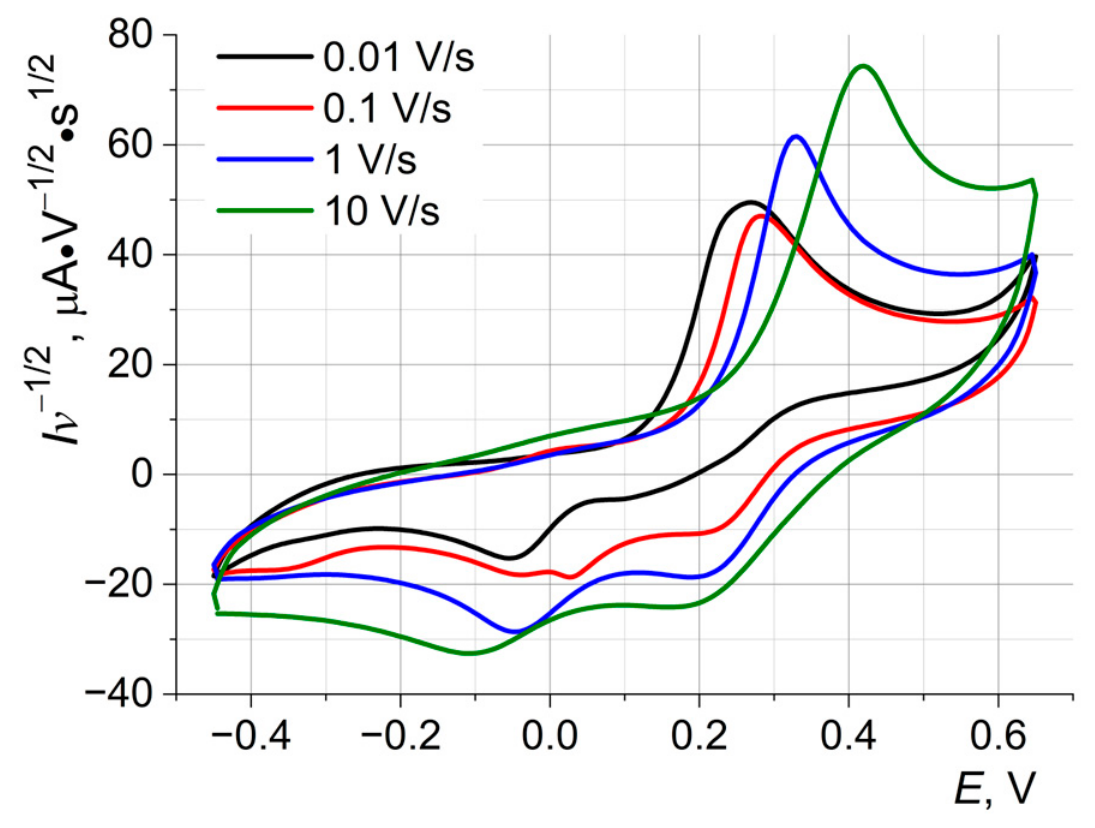
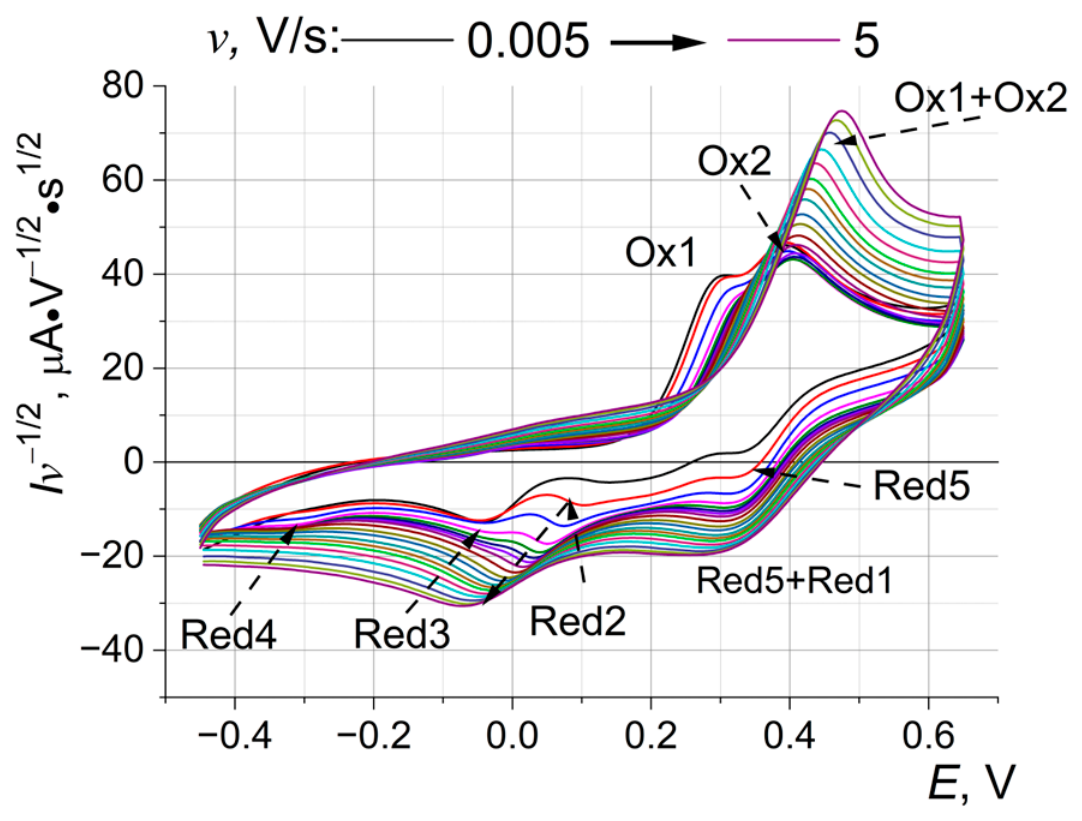
The calculation of the kinetic parameters for the processes responsible for Red2 and Red3 is not entirely correct due to signal merging. Consequently, plotting their potentials as functions of the scan rate is complicated. After full merging of Red2 and Red3, a subsequent shift of the merged peak toward more negative potentials occurs in CVs at different v values (Figure 5). A similar behavior was observed for the Ox1 signal, which shifted toward more positive potentials. The shift in peak potential with increasing scan rate indicates the quasi-reversible or irreversible character of these electrochemical processes, a phenomenon commonly observed in electrode reaction studies [31,32]. The absence of the Red4 signal at a scan rate of 0.01 V/s can be explained by a competing chemical step that decreases the concentration of [NiIII(PDTC)3]3−. Such behavior was previously confirmed via controlled potential electrolysis [20]. The authors suggested an intramolecular oxidation reaction according to Equation (1).
[NiIII(dtc)3] = [NiII(dtc)2] + dtc
A mechanism for nickel(III) complex disproportionation was also proposed (Equation (2)):
[NiIII(dtc)3] + [NiIII(dtc)2]+ = [NiIV(dtc)3]+ + [NiII(dtc)2]
Additionally, it can be assumed that the behavior of nickel complexes in aqueous media differs from that observed in organic solvents, and Red4 may arise from a process other than the reduction of the tris-dithiocarbamate complex of nickel(III). One can also observe the disappearance of this signal at higher scan rates (Figure 5). Possible reasons include a shift of Red4 toward more negative potentials due to weak electron transfer kinetics or the presence of intermediate chemical steps that decrease the concentration of the species responsible for the signal.
The process most likely to influence the electrochemistry of the studied complex is the coordination of a hydroxo group/water molecule following the one-electron oxidation of the complex. It is known from the literature that nickel ions in different oxidation states exhibit different coordination numbers and geometries of the formed complexes [19,21]. Accordingly, these species possess different standard redox potentials for different coordination arrangements. It should also be noted that chemical steps may have different kinetics; thus, changes in v can lead to the predominance of one step over another, as was shown above for the Red2 and Red3 peaks.

2.2.1. pH Influence

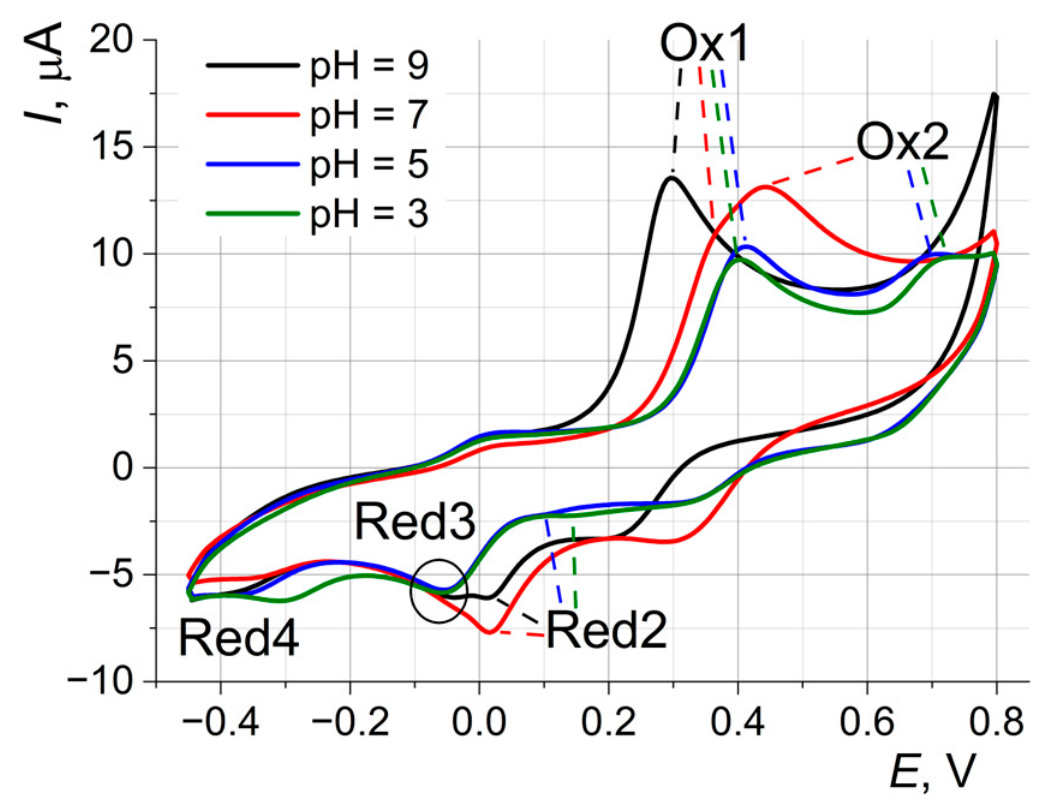
To vary the concentration of the possible additional ligand (OH), further experiments were performed in solutions with different pH values. CVs of the [NiII(PDTC)2]2− complex for solutions with pH = 3, 5, 7, and 9 are shown in Figure 6. The shape of the CVs changes significantly with decreasing pH compared to those recorded at pH = 9. Two oxidation processes can be observed for the solution at pH = 7, where a “shoulder” appears on the rising part of the Ox1 peak. This merged peak is observable at a scan rate of 0.1 V/s, in contrast to the solution at pH = 9. A further decrease in pH led to the separation of these two oxidation processes (Ox1 and Ox2) along the potential scale. The increase in anodic current in the range of 0.7–0.8 V for alkaline media is most likely associated with the oxidation of the coordinated ligand. The most significant result of this experiment is the obvious influence of pH on the oxidation potential of the complex. The first oxidation peak potentials for different pH values were 0.403 V, 0.412 V, 0.443 V and 0.297 V for pH = 3, 5, 7 and 9, respectively.
According to the given values and Figure 6, the oxidation potential of [NiII(PDTC)2]2− remains almost unchanged from pH = 3 to pH = 5. However, for the solution at pH = 7, the rising part of this peak is in the region of lower potentials. This suggests that the first electron transfer process corresponds to the aforementioned shoulder and that the Ox1 peak potential at pH 7 is lower than the recorded maximum, which more likely corresponds to the Ox2 peak (0.443 V). The potentials of the second oxidation peak undergo a significant shift upon changing the pH from 7 to more acidic solutions, 0.71 V (pH = 5) and 0.74 V (pH = 3), indicating that this process is also pH-dependent.
Conversely, the Red3 signal retained its approximate position for all studied pH values, changing by only 0.02 V (−0.04 V for pH = 9 and −0.06 V for pH = 5). The relative stability of this signal results from the absence of pH dependence and any proton-coupled reactions, unlike the Ox1 and Ox2 signals. Fast kinetics for the process responsible for the Red3 signal were also mentioned in the literature [21]. Moreover, the authors obtained the decrease in oxidation peak potential with increasing concentration of an additional ligand (pyridine). Similar behavior can be observed in Figure 6 with increasing OH ion concentration (increasing pH). Another feature revealed by decreasing pH is significantly lower Red2 current values in acidic media. This can be explained by the smaller number of hydroxo-complexes formed and a shift in equilibrium toward more stable tris-dithiocarbamate complexes, as well as the formation of different hydroxo-complexes (e.g., mono- and bis-derivatives) at different pH values. Such complexes should have different reduction potentials because the electron density on nickel will differ.

2.2.2. Scan Rate Influence and Probable Mechanism

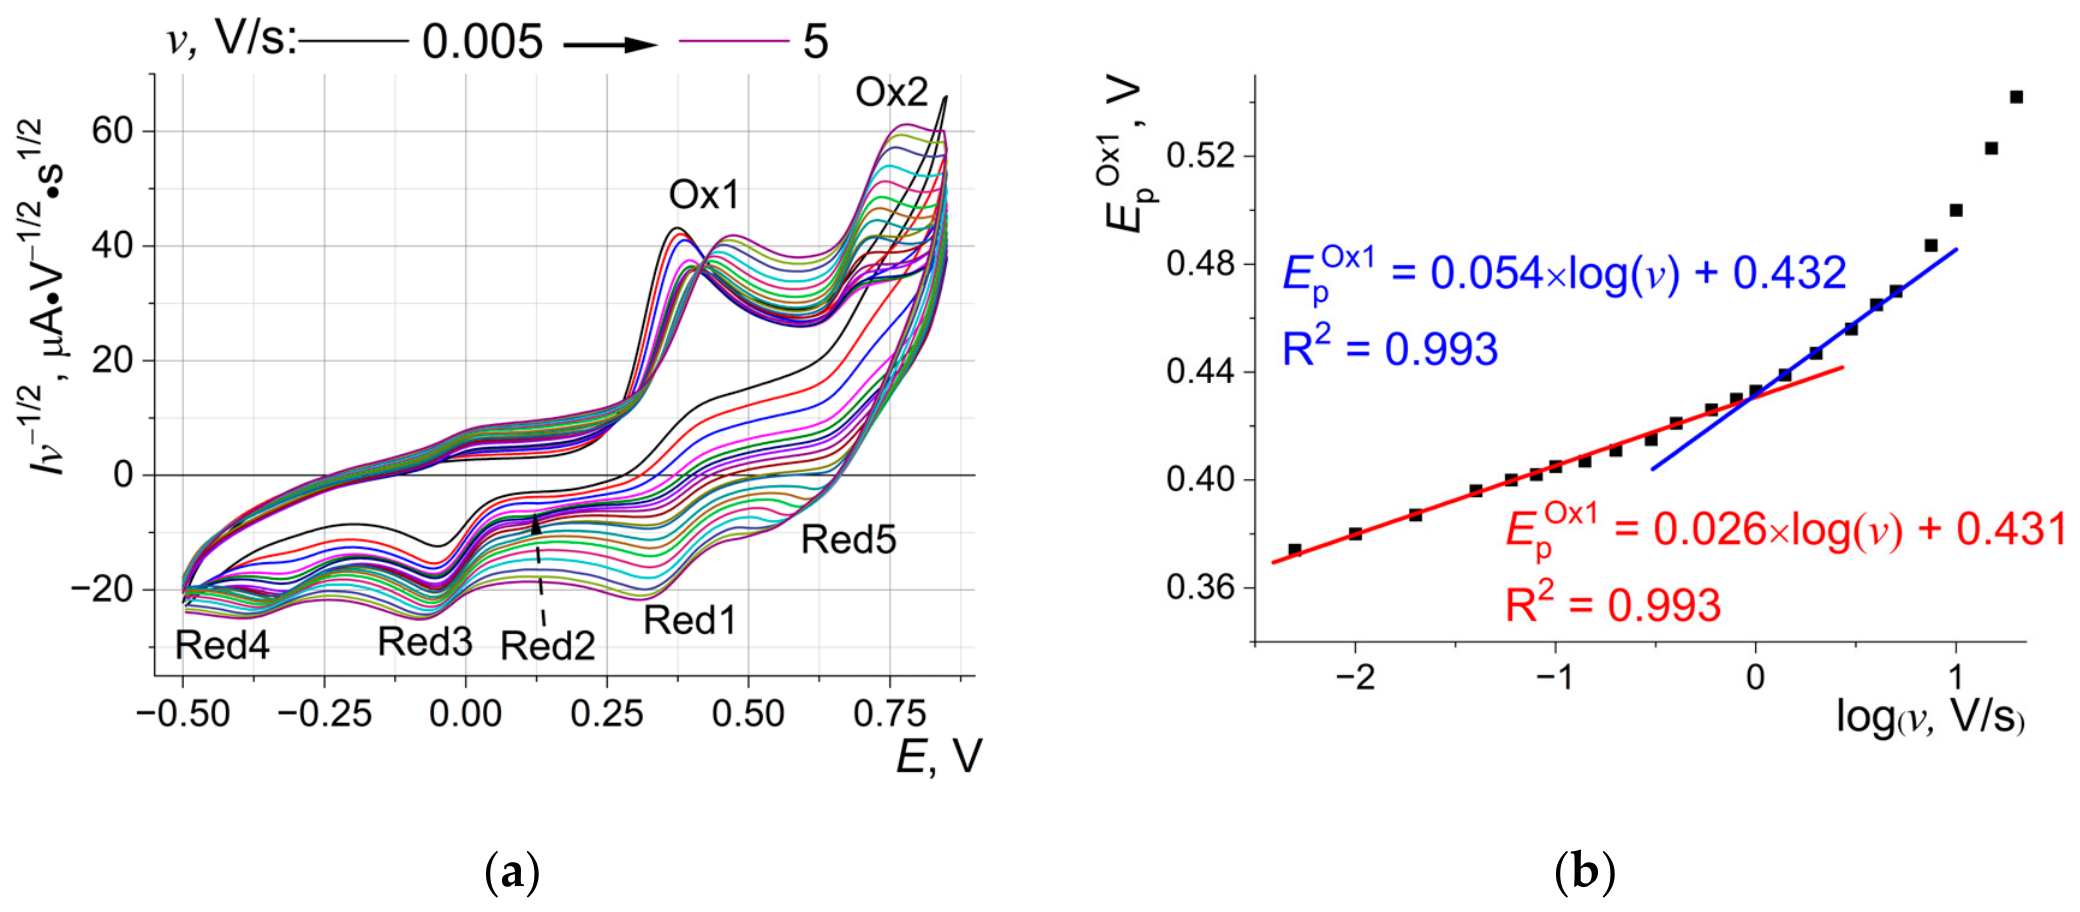
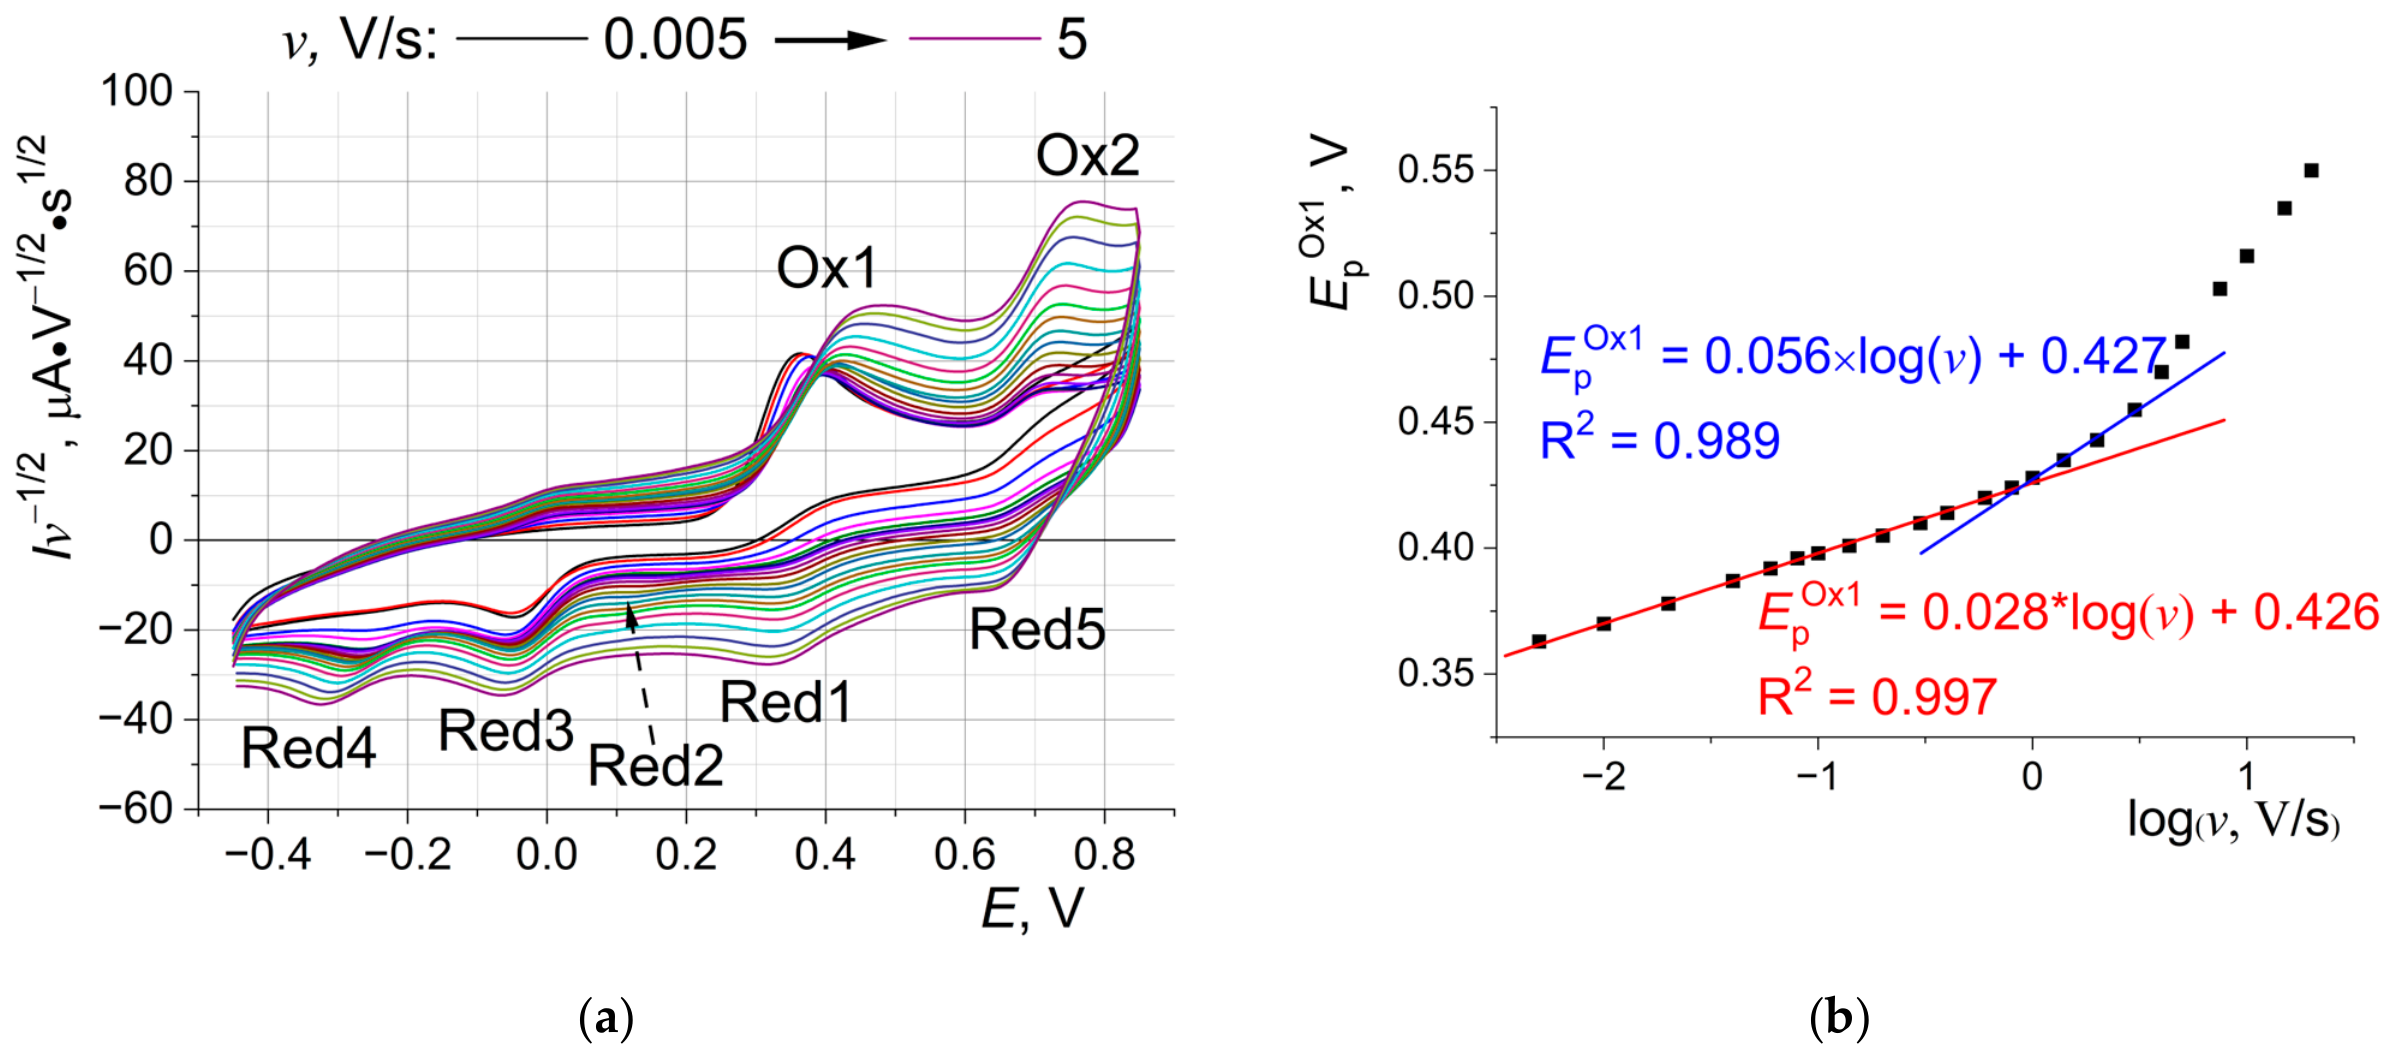
The working solution with pH = 5 was chosen for more detailed study of electrode processes due to the presence of two separated oxidation signals. The CVs recorded at different scan rates, normalized by the √v value, are shown in Figure 7a. Corresponding data for pH 3, 7 and 9 are provided in Figure A1, Figure A2 and Figure A3.
The maximum oxidation current of the [NiII(PDTC)2]2− complex is observed at low potential scan rates. This behavior is explained by a two-electron transfer process: the first electron transfer is followed by a chemical step involving third ligand coordination and then a second electron transfer (electrooxidation of [NiIII(PDTC)3]3−). The second electron transfer has a lower standard electrode potential (potential inversion), and the entire process can be represented by an ECE mechanism (Equations (3)–(5)). The formal redox potential, E0′, for the first step was calculated as 0.386 V (the half-sum of peak potentials (Ep) of oxidation (Ox1) and reduction (Red1)) at high v values, at which the process is reversible.
Ox1/Red1: [NiII(PDTC)2]2− − 1ē = [NiIII(PDTC)2]2−, E0 = 0.386 V
[NiIII(PDTC)2]2− + ½[NiII(PDTC)2]2− = [NiIII(PDTC)3]3− + ½NiII
[NiIII(PDTC)3]3− − 1ē = [NiIV(PDTC)3]2−, E0 < 0.386 V
The dependence of the first oxidation peak potential on log(v) confirms this mechanism and exhibits several linear regions (Figure 7b). The slope for low and medium scan rates is 26 mV/dec, indicating the predominant influence of the chemical step of ligand exchange (Equation (4)) on the peak potential. At these v values, the chemical step has sufficient time to occur, increasing the number of electrons participating in the process and consequently increasing the peak current (Equation (5)). Due to potential inversion, the second electrochemical step does not affect the peak potential but does affect the peak height.
A further increase in scan rate led to a larger slope (54 mV/dec.), which corresponds to the kinetics of a quasi-reversible one-electron oxidation process (Equation (3)). At high v values, the reduction of the product formed according to Equation (3) occurs faster than the chemical step (Equation (4)). A higher scan rate range (from 5 to 20 V/s) corresponded to another linear region. Similar behavior has been reported in the literature and attributed to the impact of solution-resistance and/or charging currents [33,34].
The presence of a second oxidation peak (Ox2) in voltammograms, including those recorded at low scan rates, indicates the formation of additional nickel(III) species after the first oxidation. The nickel(III) bis-complex with dithiocarbamates undergoes an additional chemical step of ligand coordination. Based on the ECE mechanism where the first step is the oxidation of the initial complex (Equation (3)), the following reaction sequence is proposed for the second and third steps:
[NiIII(PDTC)2] + xOH = [NiIII(PDTC)2(OH)x](1+x)−
Ox2: [NiIII(PDTC)2(OH)x](1+x)− − 1ē = [NiIV(PDTC)2(OH)x]x, E0 > 0.386 V,
where x = 1 or 2.
The rate of hydroxo ion coordination (Equation (6)) exceeds the rate of dithiocarbamate ligand exchange (Equation (4)), as discussed previously regarding Figure 4b. The noticeable increase in Ox2 current and decrease in Ox1 current with increasing scan rate further confirm this assumption (Figure 7a). Indeed, the coordination of a hydroxo group/water molecule appears to be faster than the coordination of a third dithiocarbamate molecule, which requires rearrangement of the complex and changes in initial ligand positions. However, potential inversion occurs only upon dithiocarbamate addition, as shown by experimental data for pH = 5.
The absence of an electroreduction signal for Ni(IV) hydroxo-complexes (Red2) at small v values and pH = 3, as well as for the solution at pH = 5, suggests an equilibrium between nickel(III) and nickel(IV) complexes with PDTC and OH. In this case, the formation of tris-complexes with dithiocarbamate ligands is thermodynamically preferred. Thus, Equation (4) may not be entirely correct when considering aqueous media instead of organic solvents. The following ligand exchange reactions are more likely to occur:
[NiIII(PDTC)2(OH)x](1+x)− + ½[NiII(PDTC)2]2− = [NiIII(PDTC)3]3− + ½Ni2+ + xOH
[NiIV(PDTC)2(OH)x]x + ½[NiII(PDTC)2]2− = [NiIV(PDTC)3]2− + ½Ni2+ + xOH
Consequently, the formation of hydroxo-complexes is primary and determined by kinetic factors. This conclusion is also supported by the revealed influence of pH on the Ox1 peak potential (Figure 6). Indeed, the chemical step that follows the first one-electron oxidation (Ox1) influences the peak position. Dithiocarbamate ligand exchange leads to potential inversion of the second one-electron oxidation and does not influence Ep, whereas hydroxo ion coordination does.
The rate constants for the processes discussed above were estimated. Rate constants for the one-electron oxidation of the studied complex (Equation (3)) and the subsequent chemical step (Equation (6)) were calculated using Equations (10) and (11), respectively, based on the obtained dependences of the Ox1 peak potential on log(v) [23].
E p a = E 0 + 0.78 R T 1 α n F 1.15 R T 1 α n F log k E 2 R T 1 α n F D + 1.15 R T 1 α n F log v
E p a = E 0 + 0.78 R T n F 1.15 R T n F log k C R T n F + 1.15 R T n F log v
Here, kE and kC are the heterogeneous electron transfer rate constant and the observed rate constant of the chemical step, respectively. All other parameters have the generally accepted meanings. The transfer coefficient, α, was calculated using the expression EpEp/2 = 47.7/αn. Averaging the α values obtained for the range of potential scan rates from 1.4 V/s to 5 V/s resulted in α = 0.56.
Assuming that the previously calculated diffusion coefficient of [CuII(PDTC)2]2− does not differ significantly from that of [NiII(PDTC)2]2− [27], the values of kE and kC were 0.008 cm/s and 5.5 s−1, respectively. This assumption is based on the quantum chemical calculations showing similarity in coordination spheres for copper(II) and nickel(II) complexes. It should be also noted that the calculated kE is approximate, as Equation (10) was derived for electrochemically irreversible processes rather than the quasi-reversible ones observed at high scan rates (indicated by Red1 in Figure 7a). For a more accurate determination of kE, the Nicholson method [35] was used, since quasi-reversibility of the process was observed at scan rate values corresponding to the slope of 54 mV/dec. The average value of the constant for v from 1 V/s to 5 V/s was 0.01 cm/s. For pH = 3, the corresponding values of kE and kC were 0.01 cm/s and 2.4 s−1. The decrease in kC value with decreasing pH from 5 to 3 may have resulted from a decreased rate of deprotonation of the coordinated water molecule. Since oxidation peaks for pH = 7 and 9 result from merged signals (Ox1 and Ox2), calculating kinetic parameters in these cases is unreliable.
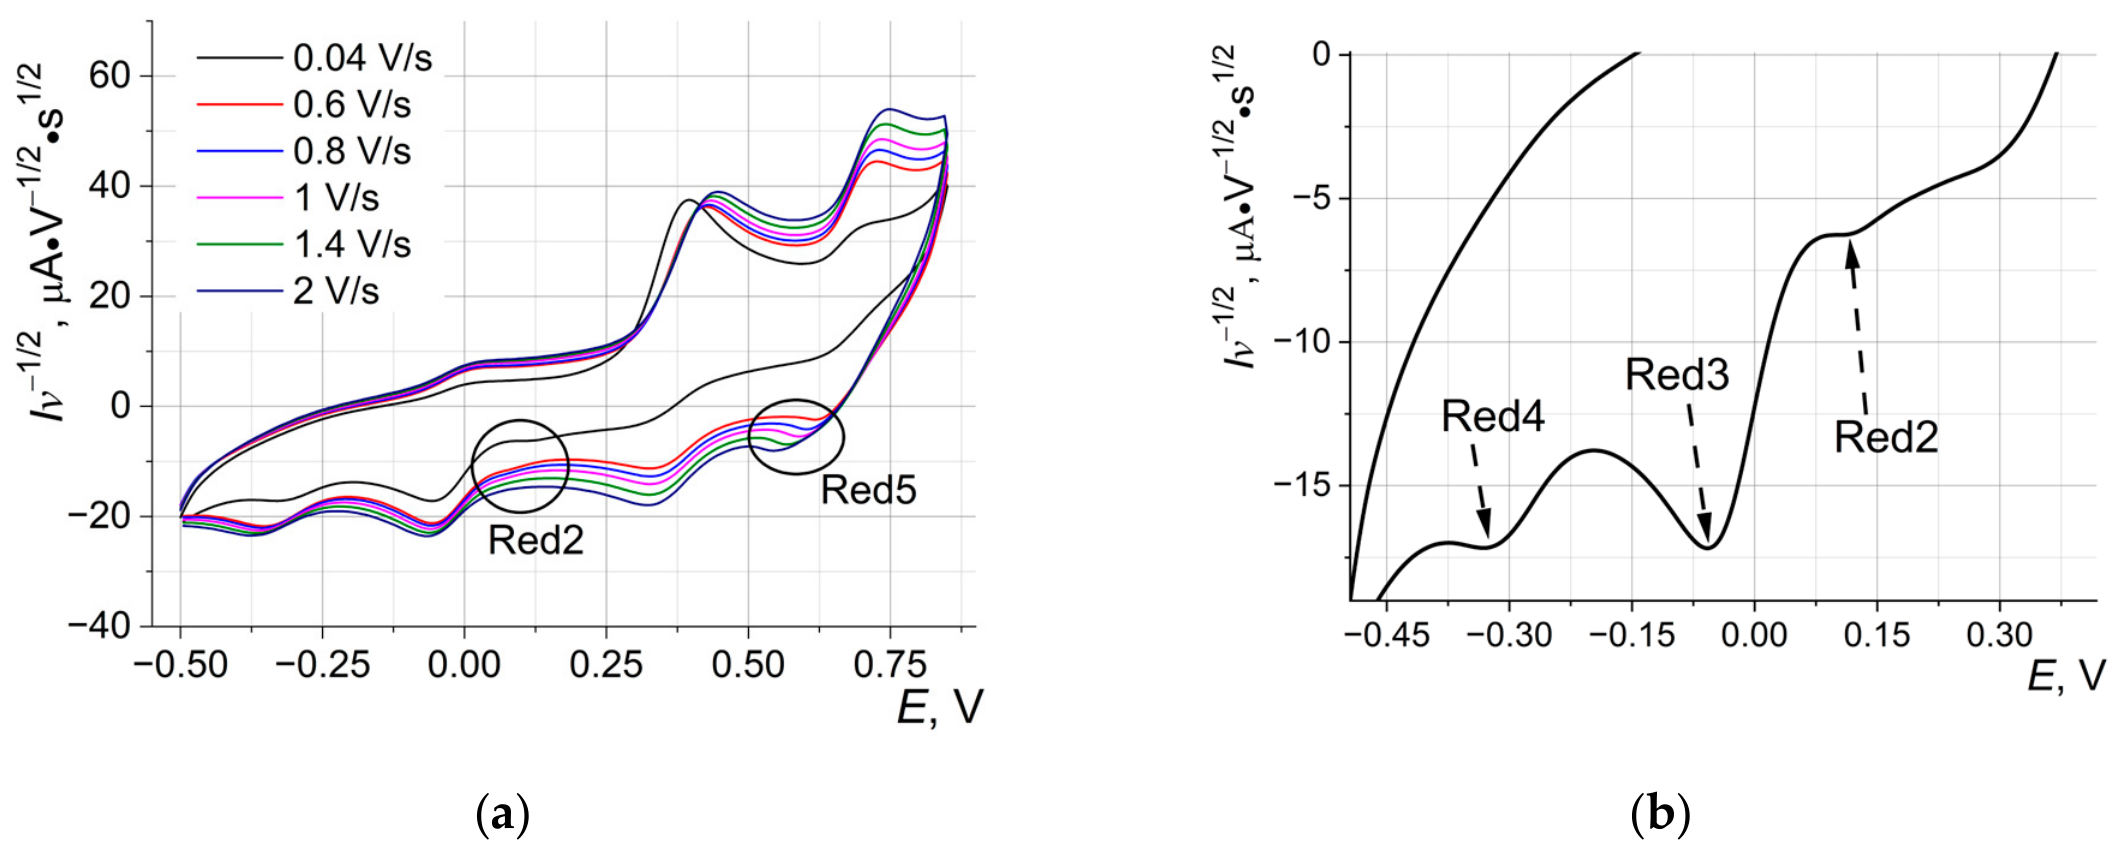
A significant detail of the recorded voltammograms (Figure 7a and Figure 8) is the presence of two reduction signals (Red5 and Red2) produced after the second oxidation peak. A possible explanation for this behavior is the presence of several forms of hydroxo-complexes (mono- and bis-derivatives).
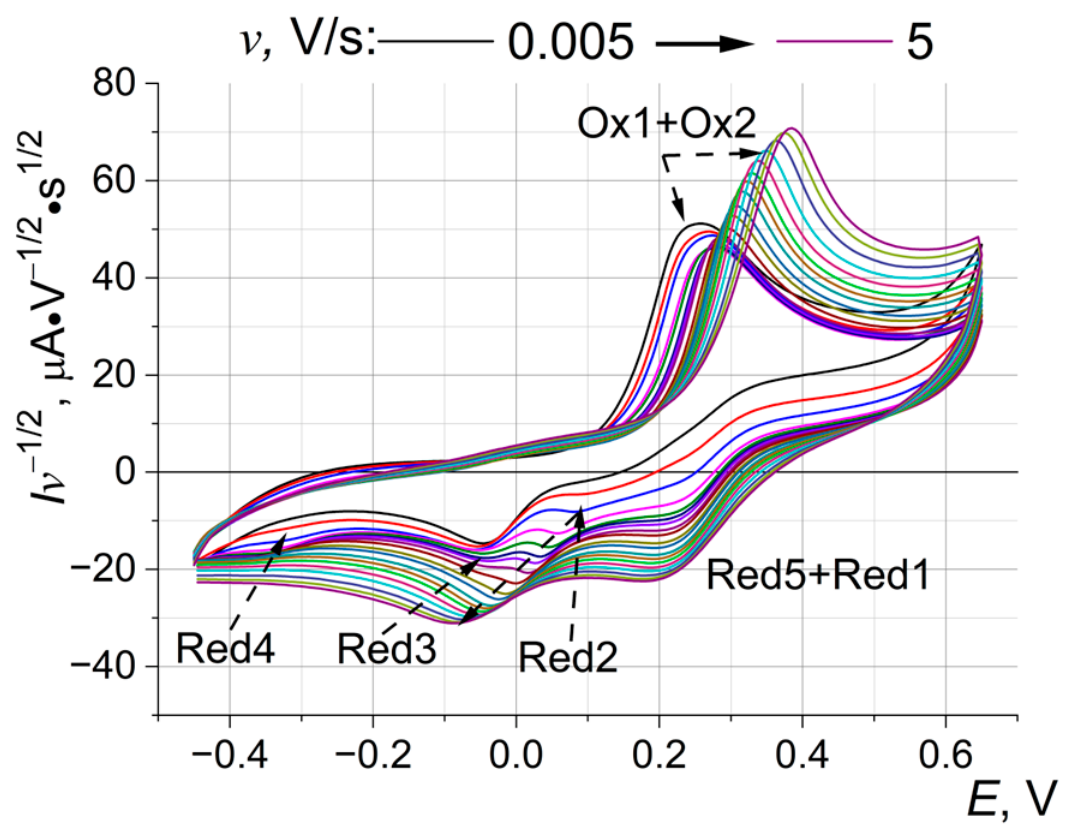
From Figure 7, Figure A1, Figure A2 and Figure A3, a significant effect of pH on the Red4 peak is evident, but the reduction of the Ni(III) tris-complexes to Ni(II) should not depend on pH, which can be observed for the similar Red3 peak. The Red4 and Red5 peaks are expressed at pH = 3 and pH = 5, whereas at these pH values the Red2 peak is suppressed and appears only at low-to-medium potential scan rates. Conversely, for pH = 7 and pH = 9, the situation is reversed: the Ox2 peak appears at more cathodic potentials (at pH = 9 the merging with Ox1 can be assumed), the Red2 peak is more pronounced, and Red4 appears only at low-to-medium potential scan rates, while Red5 seems to be absent.
After Ox1 and before the regeneration of Ni(II), an equilibrium exists between the hydroxo-forms of the complexes in solution, which depends on pH (Equations (12) and (13)). Both hydroxo-forms, according to Equations (8) and (9), can convert to tris-forms. This implies that [NiIII(PDTC)2(OH)2]3− can be formed in alkaline media, while [NiIII(PDTC)2(OH)]2− is formed in neutral and acidic media. The dihydroxo-complex of Ni(IV) can be formed in less alkaline media, which is consistent with the increased charge of the nickel center. Thus, the Red4 peak can be attributed to the reduction of the more electron-deficient form, [NiIII(PDTC)2(OH)]2−, while Red5 is associated with the reduction of [NiIV(PDTC)2(OH)].
[NiIII(PDTC)2(OH)]2− + OH ⇔ [NiIII(PDTC)2(OH)2]3−
[NiIV(PDTC)2(OH)] + OH ⇔ [NiIV(PDTC)2(OH)2]2−
It is worth noting that at pH = 7, at medium and high scan rates, the first reduction peak, similar to pH 3 and 5, could be attributed to the reverse Ox1 process. However, this peak also appears at low scan rates, which contradicts the assertion of the formation of the tris-complex, and its reduction potential is greater than the Ox1 peak (Figure A2). Accordingly, it should be attributed to the reverse process from Ox2—Red5. As the scan rate increases, the Ox1 and Ox2 peaks shift toward the anodic potentials, but it seems clear that the Ox2 process has better electron transfer kinetics, and the Ox2 peak shifts more slowly with the scan rate. It appears that as the scan rate increases, Ox1 overlaps Ox2 and merges with it. Therefore, at low scan rates, the first reduction peak should be attributed to Red5, while Ox1 and Ox2 are separated. At medium and high scan rates, the Ox1 and Ox2 processes represent a single peak, Ox1 + Ox2, and the first reduction peak is the fusion of Red1 and Red5. The significantly more pronounced Red5 peak at low scan rates at pH = 7 compared to pH = 3 and 5 is explained by the greater fraction of the hydroxo-forms with increasing pH and the correspondingly lower rate of formation of the tris-form. It is important to note that this process is most likely not a direct coordination of OH to the Ni(III) complex after Ox1, but rather the coordination and subsequent deprotonation of water. Therefore, this reaction can be very rapid, and the rate constant for the addition and removal of the hydroxo group does not correlate directly with its concentration.
At pH = 9 (Figure 5 and Figure A3), a broadening of the oxidation peak was recorded at low scan rates; however, only one oxidation peak was observed as the scan rate increased. It is quite difficult to determine whether the Ox2 potential shifted completely toward Ox1, or whether the nickel(III) dihydroxo-complex is rapidly formed and capable of being oxidized at a potential below Ox1, similar to the tris-form. As will be shown in the next section, the standard potential of this reaction is significantly lower than that of the Ni(II/III) bis-complex transition. In contrast to pH = 7, no reduction peak (Red5) is observed after Ox1 and Ox2 at low scan rates when pH = 9. This can be explained by a shift in equilibrium according to Equation (13) toward the dihydroxo-complexes of Ni(IV), or by the reaction according to Equation (12), the product of which after oxidation is the dihydroxo derivative of Ni(IV). At medium and high scan rates, the first reduction peak, as at pH = 7, is assigned to two processes: Red5 and Red1. It can only be assumed that a higher scan rate increases the contribution of Red1 to this peak.
The appearance of the Red2 peak at pH = 3 and 5 and the Red4 peak at pH = 7 and 9 at low-to-medium scan rates is explained by the equilibria according to Equations (12) and (13). Specifically, when the potential slowly passes the reduction potential of a form, for example, [NiIV(PDTC)2(OH)2]2− at pH = 5, a small portion of this form is reduced. However, to maintain equilibrium, [NiIV(PDTC)2(OH)] is converted to [NiIV(PDTC)2(OH)2]2−, which is reduced again, requiring the equilibrium to be re-established. At very low potential scan rates, these peaks are not observed because, according to Equations (8) and (9), all hydroxo-forms have sufficient time to transform into tris-dithiocarbamate complexes. Based on the above, the observed peaks can be more accurately attributed to the following processes (Equations (14)–(17)):
Ox2: [NiIII(PDTC)2(OH)]2− − 1ē ⇔ [NiIV(PDTC)2(OH)]
Red5: [NiIV(PDTC)2(OH)] + 1ē ⇔ [NiIII(PDTC)2(OH)]2−
Red2: [NiIV(PDTC)2(OH)2]2− + 1ē ⇔ [NiIII(PDTC)2(OH)2]3−
Red4: [NiIII(PDTC)2(OH)]2− + 1ē ⇔ [NiII(PDTC)2(OH)]3−
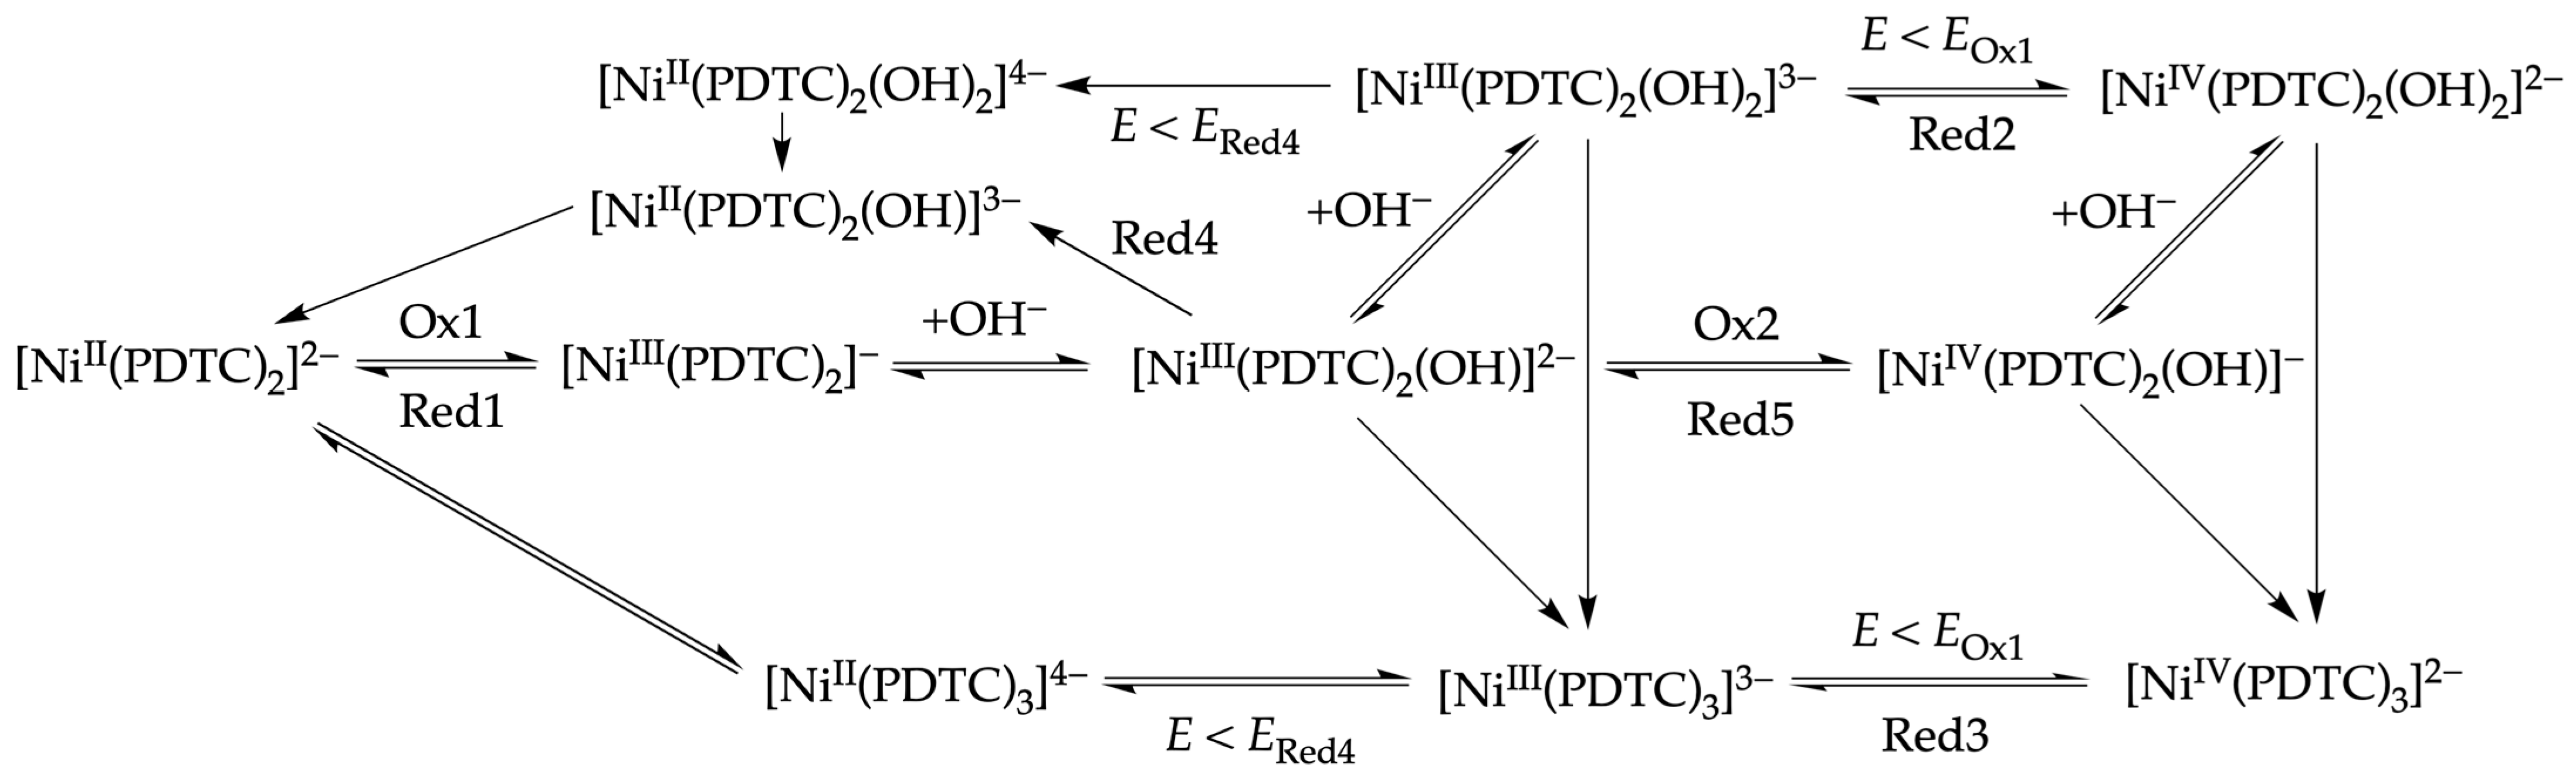
Finally, all chemical and electrochemical steps are summarized in the proposed pathway (Scheme 2).
We previously studied PDTC complexes with Cu(II). As with nickel ions, the pH of the working solution influenced the current–voltage signals of the complexes. The removal of the first electron in the case of copper ions requires overcoming a lower energy barrier (Epa approximately 200 mV, for pH = 5) and also leads to the formation of hydroxo-complexes, which generate their own signals. Notably, the first oxidation peak of copper complexes exhibits high electrochemical reversibility. This is likely due to the absence of a thermodynamically more favorable step involving the addition of a third PDTC ligand in the case of copper complexes.
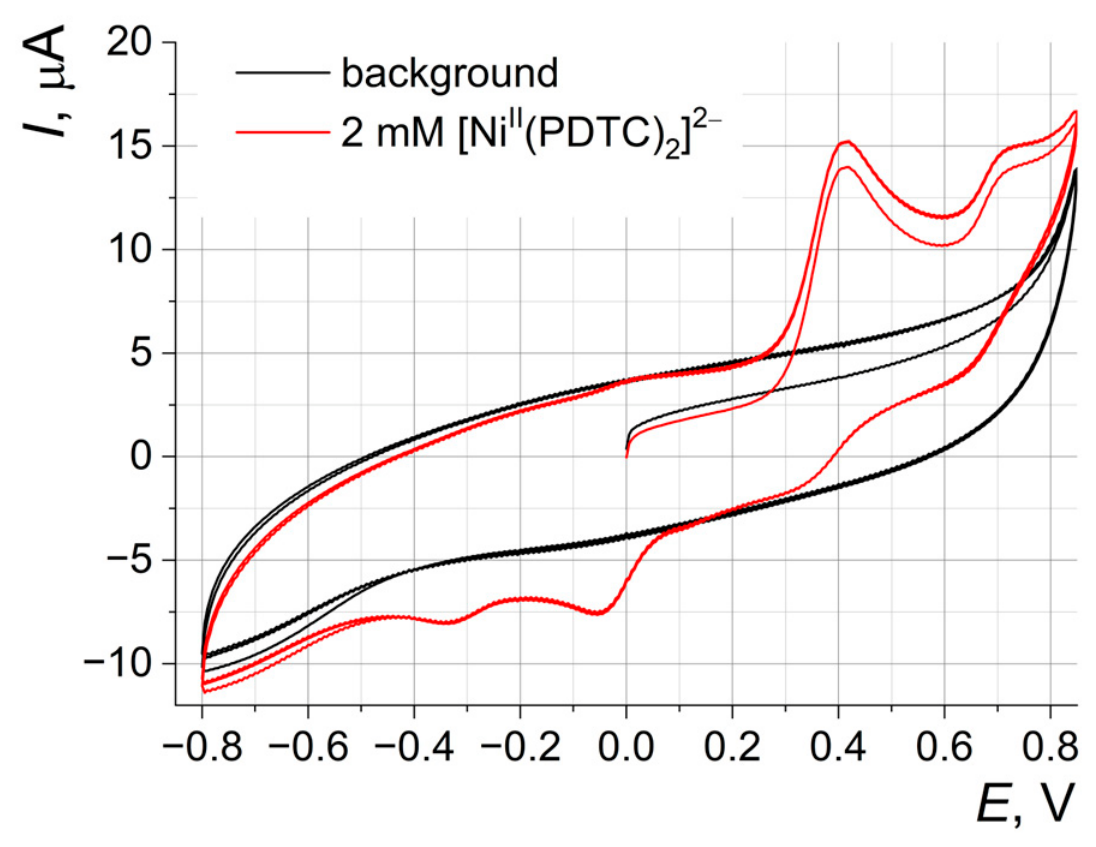
The proposed mechanism includes the formation of tris-dithiocarbamates and dihydroxo-complexes of Ni(III). However, no peaks on the CVs corresponded to the electroreduction of the mentioned complexes. As discussed above, the Red4 peak more likely corresponds to the reduction of [NiIII(PDTC)2(OH)]2−, as more electron-deficient species compared to [NiIII(PDTC)3]3− and [NiIII(PDTC)2(OH)2]3−. To address this shortcoming, further experiments were conducted over a wider potential range (Figure 9). No additional reduction signals were observed up to −0.8 V, except for one corresponding to the reduction of dissolved oxygen. Despite prolonged preliminary sparging with argon, this signal could not be completely removed.
On the other hand, the improved stability of the Ox1 peak current was revealed. It is also important to note the reproducibility of the Red2 and Red3 peaks between the first and subsequent cycles. Within a narrow range, a higher proportion of these Ni(IV) forms is recovered in the second and third cycles. A stable curve was obtained in the second potential cycle, instead of the third one for a narrowed potential range (see Figure 4a). These observations indicate a more complete regeneration of the initial Ni(II) complexes. The use of more negative potentials (up to −1 to −1.5V) led to the appearance of significant reduction currents, probably corresponding to the formation of Ni(0) or Ni(I) insoluble species (indicated by a new sharp oxidation peak on the backward scan) and the hydrogen evolution reaction (evidenced by gas bubbles on the electrode surface).

2.3. Quantum Chemical Calculations

To provide additional evidence for the described electrochemical transformations, quantum chemical calculations were used. Standard redox potentials were obtained from the calculated Gibbs energies according to the method described in the literature [36], which previously gave good results for copper complexes with phosphorylated dithiocarbamates [27]. Standard redox potentials of nickel(III/II) complexes are given in Table 1 (calculations using the C-PCM and SMD solvent models give similar results).
As can be seen from Table 1, the standard redox potentials of the nickel(III/II) bis-complex are in the range of 0.216 to 0.485 V (depending on the number of water molecules and the solvent model), which is in relatively good agreement with the Ox1 process (see Figure 6). Despite the fact that the initial Ni(II) complex has a square-planar structure without water molecules, it is not entirely correct to consider only the direct oxidation reaction of [NiII(PDTC)2]2− to [NiIII(PDTC)2], since Ox1 is followed by a chemical step of water coordination and its deprotonation, which shifts the oxidation potential to the cathodic region due to stabilization of the oxidation product. Calculation considering the coordinated water molecules to the oxidation product ([NiIII(PDTC)2(H2O)x]) gives results closer to the experimental ones (Ni(III) bis-complex structures are given in Figures S7–S12).
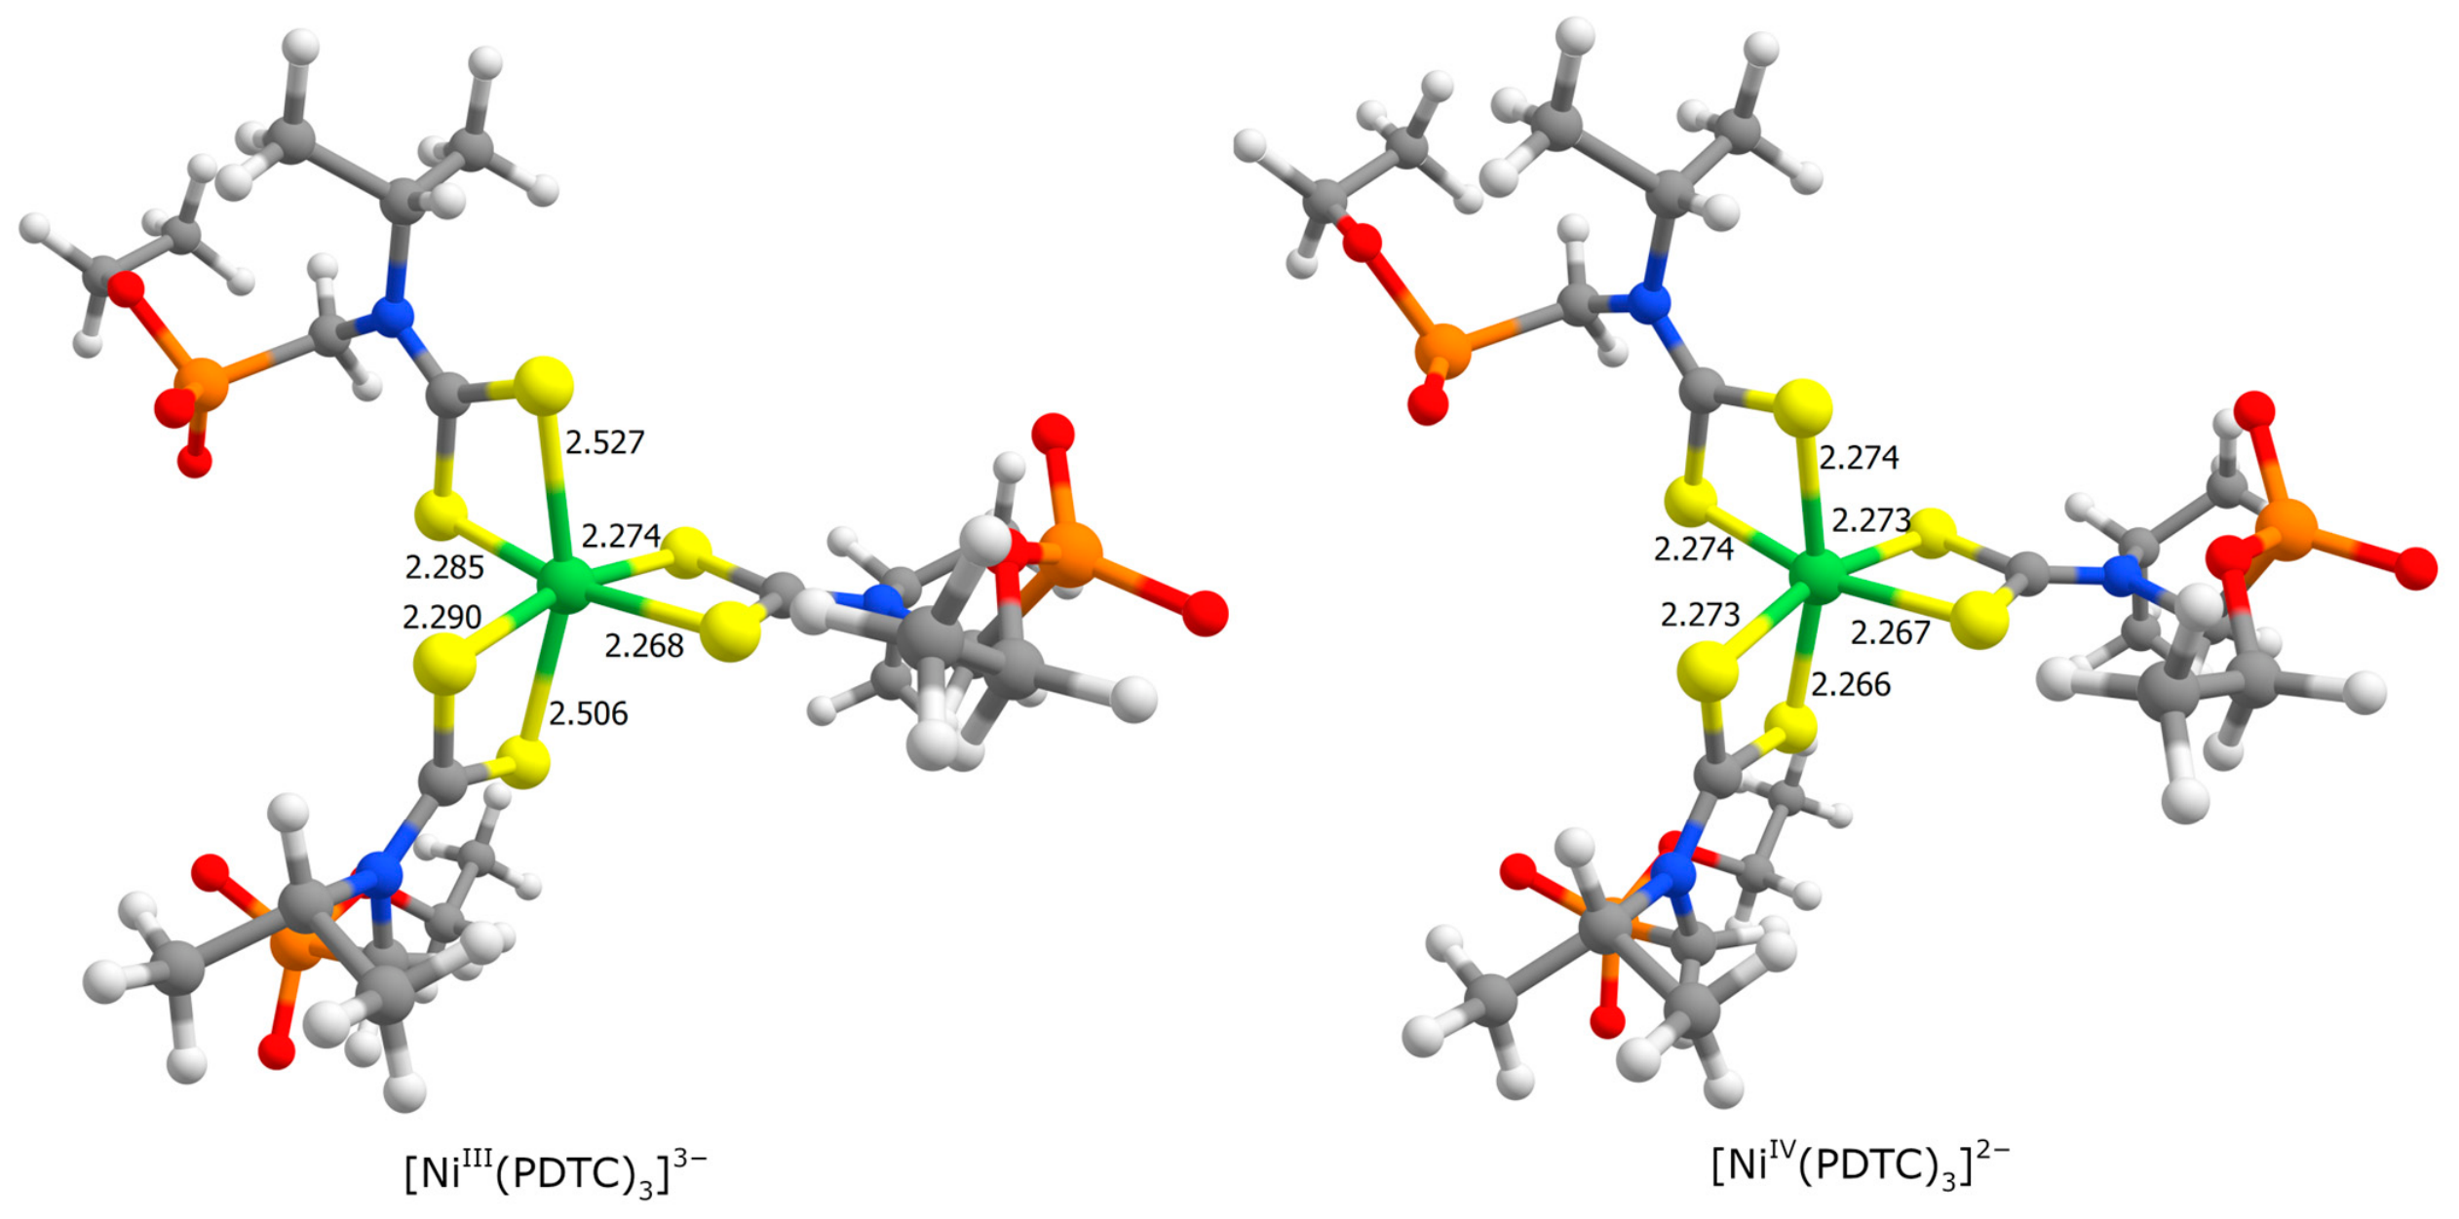
The standard redox potential of the nickel(II/III) tris-complex (the optimized structure is shown in Figure 3, and the nickel(III) product is shown in Figure 10) is significantly lower (by more than 1.2 V) than that of the bis-complex (see Table 1), so the possible formation of such species may explain the observed oxidation in excess PDTC (see Figure 1). Interestingly, nickel(III) in the tris-complex (Figure 10) has a distorted octahedral arrangement with four short equatorial bonds (about 2.3 Å) and two long axial bonds (about 2.5 Å). This distortion is consistent with the EPR data (Section 2.1).
In addition, Table 1 lists the standard redox potentials of the hydroxo-forms with two PDTC ligands (optimized structures of the corresponding nickel(II) complexes are shown in Figures S25–S36, ESI). Comparing the potentials for the tris-dithiocarbamate and hydroxo-complexes, it is evident that the potentials of the dihydroxo- and tris-complexes are close and lie in the region of strongly negative potentials, while the potential for the mono-hydroxo-form is significantly more positive, which confirms our decision to assign the Red4 peak to the reduction of [NiIII(PDTC)2(OH)]2−.
The standard redox potentials of nickel(IV/III) complexes are listed in Table 2. First of all, it should be noted that the standard redox potentials of simple bis-complexes are very high (1.6 V or more), regardless of the presence or absence of additional water molecules. Accordingly, the Ox2 peak cannot be assigned to these forms. Further analysis of the spin densities in the oxidation products (the optimized structures are shown in Figures S13–S18, ESI) shows that these products are likely not nickel(IV) complexes, but rather nickel(III) complexes with PDTC radicals.
In contrast, the oxidation potential of the tris-form of nickel(III) is slightly negative (Table 2) and is approximately 0.4–0.5 V lower than that of the nickel(II) bis-complex (see Table 1), which is in good agreement with the known potential inversion for these transitions. The optimized structure of the nickel(IV) tris-complex is shown in Figure 10, and the coordination arrangement has again become more octahedral upon the formation of nickel(IV)—all six nickel–sulfur bonds are virtually identical (2.27 Å) compared to the distorted nickel(III) tris-complex (also shown in Figure 10).
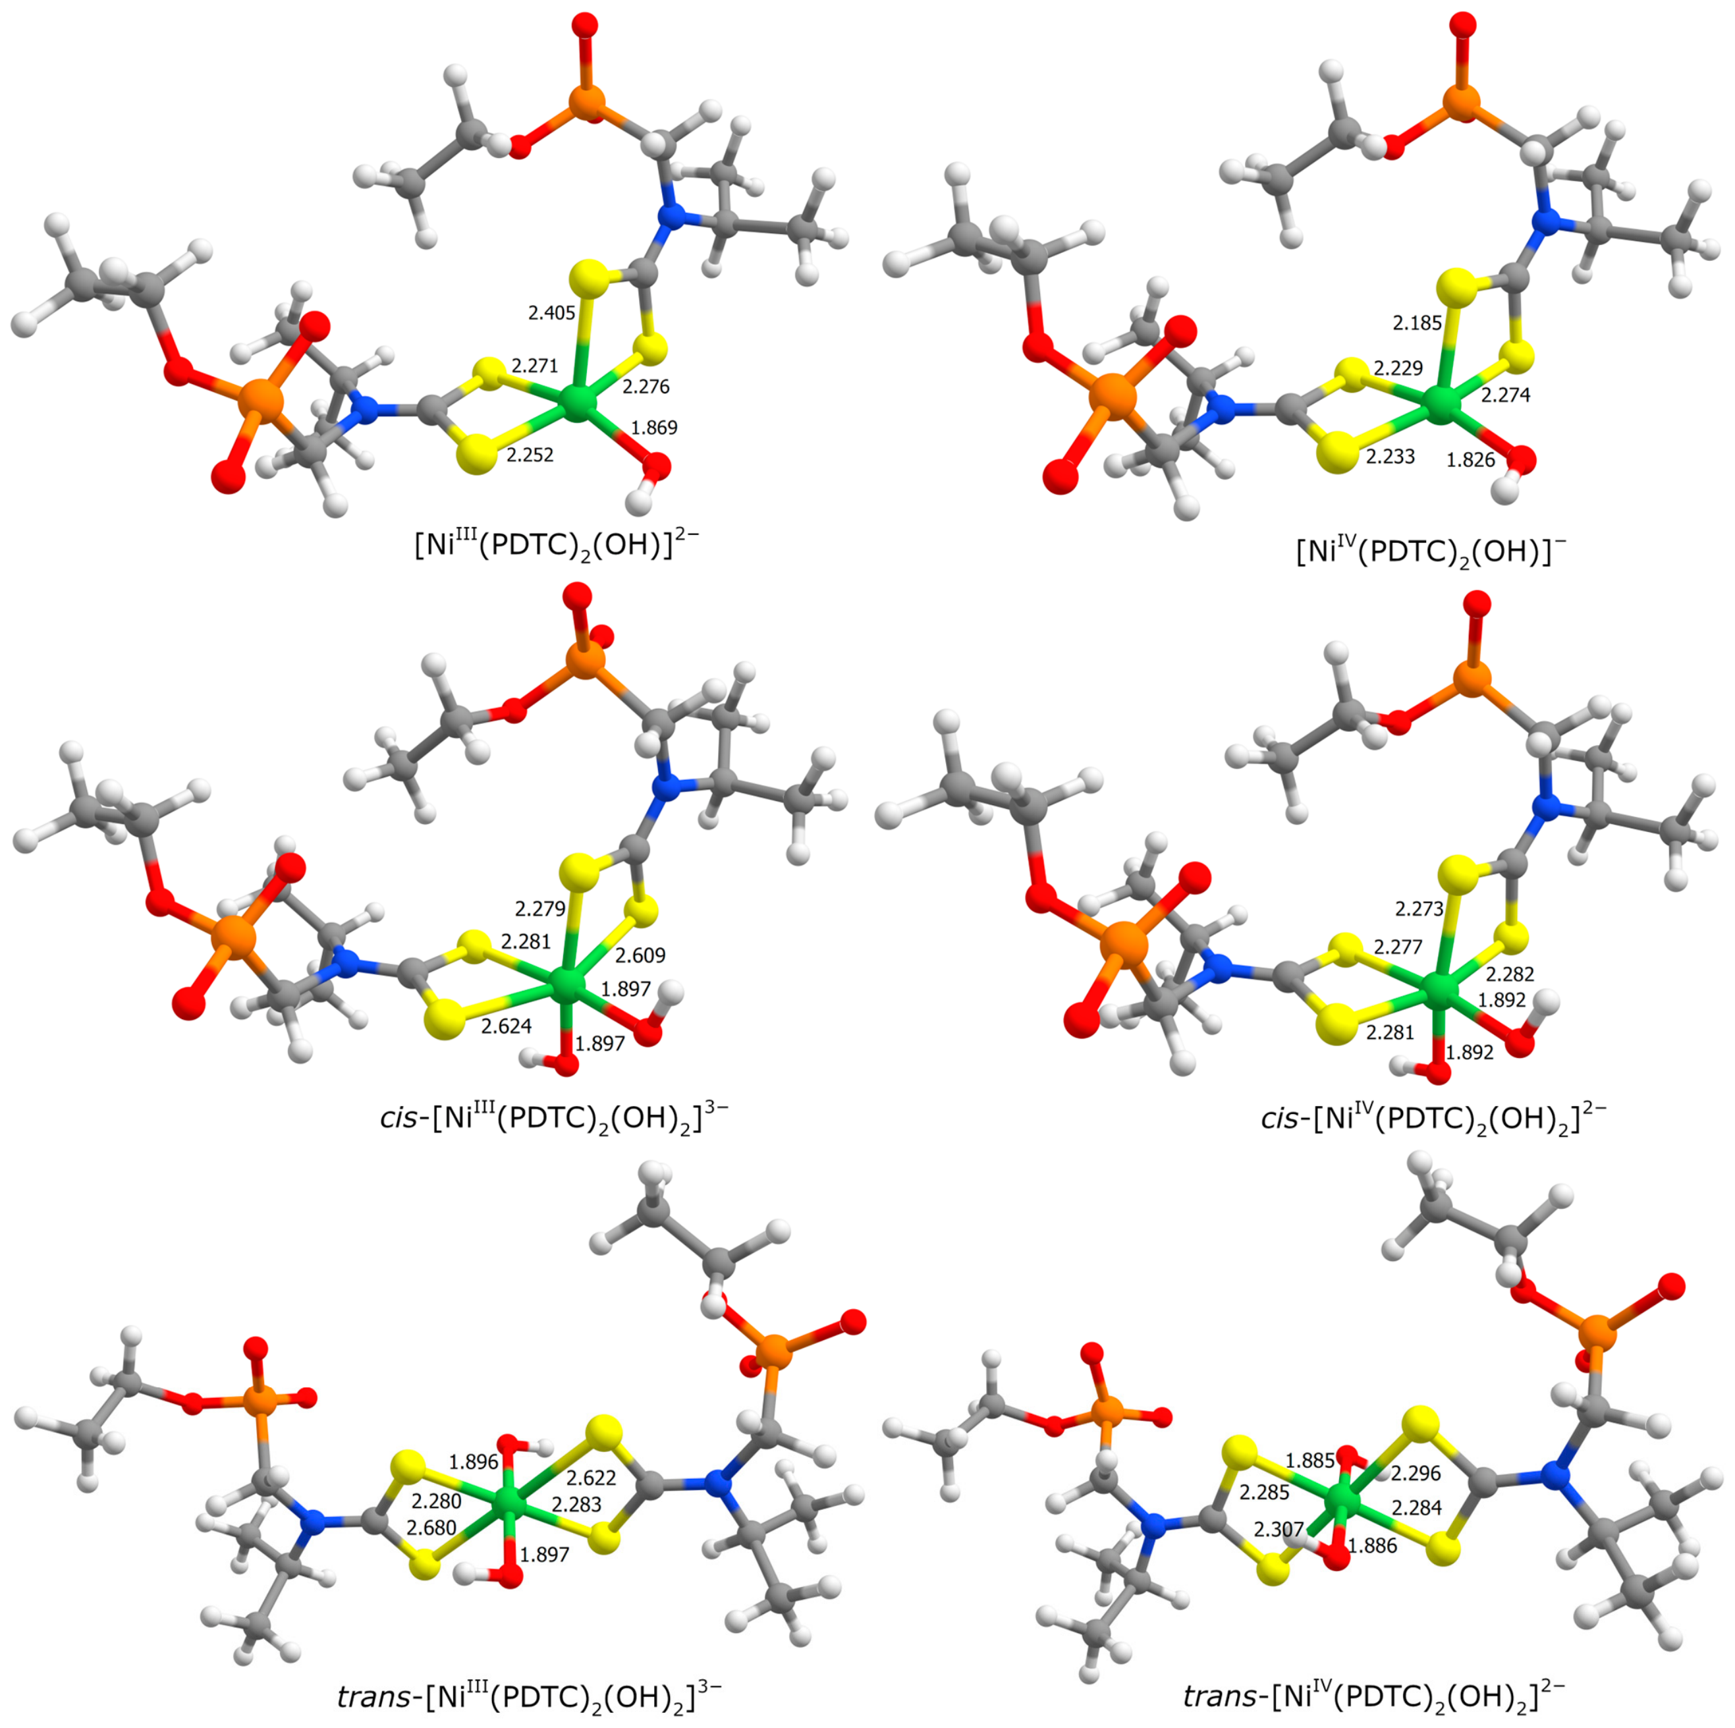
The standard redox potentials of the hydroxo-forms of nickel(IV/III) are also given in Table 2, and some optimized structures of nickel(III) and nickel(IV) are shown in Figure 11 (all structures can be found in Figures S37–S60, ESI). If only one hydroxo group is present in the first coordination sphere, the potential is ~0.9 V, whereas the presence of two hydroxo groups reduces the value to −0.15 V (see Table 2). This confirms the assignment of the Ox2 process to the oxidation of the mono-hydroxo derivative of Ni(III). In the case of the dihydroxo derivative, potential inversion is observed, as for the tris-dithiocarbamate complex of Ni(III), due to the high electron density on nickel after the coordination of the second hydroxo group. Interestingly, in both nickel(III) and nickel(IV) bis-complexes with one hydroxo group, the central ion has a square-pyramidal coordination structure; even the addition of a water molecule does not change the situation—it leaves the first coordination sphere during the optimization process (see Figures S41–S44 and S53–S56). At the same time, in complexes with two hydroxo groups nickel is six-coordinated (Figure 11).
It is important to note that the absolute values of the standard potentials for reactions obtained during calculations and observed experimentally may either correlate well with the experimental peaks (e.g., for the Ox1/Red1 pair at high scan rates or for Red3 at low scan rates) or shift significantly (e.g., for the Ox2/Red5 pair). This is due to the presence of multiple interconnected chemical steps, which depend on the potential scan rate and shift the peak potentials, as well as the different concentrations of substances in a real solution. In a quantum chemical approach, only a specific reaction can be calculated without considering subsequent transformations. Therefore, agreement with experimental values can be reached only indirectly, through calculations of various possible structures. However, all calculated standard electrode potentials are located relative to each other in the same way as in the experimental CVs. Thus, quantum chemical calculations can significantly help to interpret and understand experimental results.

3. Materials and Methods

Commercially available reagents and solvents were used for the experiments. Phosphorylated dithiocarbamates were provided by I.I. Mirzayanov and A.R. Garifzyanov; synthesis and characterization is described in [37].
pH measurements were made with the automatic titrator Titrando 907 (Metrohm, Herisau, Switzerland) with the glass electrode 6.0258.010 (Metrohm, Herisau, Switzerland). Thermostating was carried out using the F25-HL circulating thermostat (Julabo, Seelbach, Germany).
The spectrophotometer Cary 50 Bio (Varian, Mulgrave, Australia) was used for registration of electronic absorption spectra in 1.0 cm quartz cells.
The Rapid Mix RX2000 (Applied Photophisics, Leatherhead, UK) spectrophotometric accessory was used for kinetic measurements.
EPR spectra were recorded with the ESP 300 spectrometer (Bruker, Karlsruhe, Germany) and simulated using the EasySpin software package (version 6.0.7) [38]. For recording of the EPR spectra, two thin tubes (1 mm outer diameter) with a sample were placed inside a single 5 mm diameter tube. To obtain a good glass spectrum at low temperature, methanol was added to the sample solution (30% v/v).
The electrochemical study was carried out using a CHI440B electrochemical analyzer (CH Instruments, Bee Cave, TX, USA) at room temperature in a three-electrode cell. The working electrode was a glassy carbon electrode (GCE) with a geometric surface area of 0.0314 cm2 (OhmLiberScience, Saint Petersburg, Russia); the reference electrode was a silver chloride electrode Ag/AgCl (1 M KCl) (CHI128; CH Instruments, Bee Cave, TX, USA); and the auxiliary electrode was a platinum wire (CHI129; CH Instruments, Bee Cave, TX, USA). Stirring was performed using a Topolino magnetic stirrer (IKA, Staufen, Germany).
Before the electrochemical experiments, GCE was polished using silicon carbide abrasive paper (7000 grit), kept in isopropanol for 5 min, and electrochemical activation of the electrode was carried out by cycling the potential in a solution containing PDTC, followed by short-term (0.1 s) cathodization at a potential of −5 V until stabilized curves were obtained.
Quantum chemical calculations were performed using the Orca program (version 6) [39,40] at the B3LYP/def2-TZVPPD level [41,42,43,44,45] with D3 dispersion correction [46,47]. The C-PCM [48] and SMD [49] models were used to account for solvent effects. Initial structures for calculations were made using the Avogadro program (version 1.2.0) [50]. Chemcraft (version 1.8, build 780) [51] was used for viewing and visualizing calculation results.

4. Conclusions

An electrochemical study of new nickel complexes with phosphorylated dithiocarbamates in aqueous media was carried out. The appearance of new voltammetric signals was revealed in comparison with the literature data for non-aqueous media. The reason for the appearance of new signals is the formation of complexes with hydroxo groups, which appear in the coordination sphere after the one-electron oxidation of [NiII(PDTC)2]2−.
The calculated rate constant for the coordination of the first hydroxo group was 5.5 s−1 at pH = 5 and 2.4 s−1 at pH = 3. The formation of the monohydroxo-form of Ni(III) and Ni(IV) was confirmed, while the formation of dihydroxo-forms and the potential inversion effect for the oxidation of [NiIII(PDTC)2(OH)2]3− were proposed in an alkaline media.
The decrease in oxidation and reduction peaks for hydroxo-complexes in voltammograms recorded at low potential scan rates indicates the formation of more thermodynamically stable tris-dithiocarbamate forms of Ni(III) and Ni(IV) at all pH values.
Based on the obtained results, the most probable mechanism of electrode oxidation of the [NiII(PDTC)2]2− complex in an aqueous medium is ECCEEC, where the first step, E, corresponds to the one-electron oxidation of [NiII(PDTC)2]2−; the next step, C, corresponds to the coordination of hydroxo groups to the Ni(III) complex; the third step, C, corresponds to the equilibrium between the hydroxo- and tris-dithiocarbamate complexes of nickel(III); the fourth step, E, is the oxidation of [NiIII(PDTC)3]3−, occurring at low and medium scan rates; the fifth step, E, is the oxidation of the hydroxo-forms of Ni(III); and the last step, C, is the transition of the hydroxo-complexes of nickel(IV) to the tris-dithiocarbamate form.
Quantum chemical calculation of standard electrode potentials has proven to be a powerful and reliable method for characterizing the observed processes in such a complex multiparameter system.

Supplementary Materials

The following supporting information can be downloaded at https://www.mdpi.com/article/10.3390/inorganics14060168/s1: Figures S1–S6: Structures of nickel(II) bis-complexes; Figures S7–S12: Structures of nickel(III) bis-complexes; Figures S13–S18: Structures of “nickel(IV)” bis-complexes; Figures S19–S24: Structures of nickel(II/III/IV) tris-complexes; Figures S25–S36: Structures of nickel(II) hydroxo-forms; Figures S37–S48: Structures of nickel(III) hydroxo-forms; Figures S49–S60: Structures of nickel(IV) hydroxo-forms; Tables S1–S60: Corresponding xyz-matrices for optimized structures.

Author Contributions

Conceptualization, V.G.S. and N.S.A.; methodology, N.Y.S. and M.S.B.; software, N.Y.S. and M.S.B.; validation, V.G.S. and N.S.A.; formal analysis, Y.I.K., M.S.B. and N.Y.S.; investigation, N.S.A., Y.I.K., N.Y.S., M.S.B. and A.A.R.; resources, Y.I.K., M.S.B. and A.A.R.; data curation, N.S.A., Y.I.K., N.Y.S. and M.S.B.; writing—original draft preparation, N.S.A., Y.I.K. and N.Y.S.; writing—review and editing, M.S.B. and V.G.S.; visualization, N.S.A., Y.I.K., M.S.B. and N.Y.S.; supervision, V.G.S.; project administration, N.S.A.; funding acquisition, N.Y.S. All authors have read and agreed to the published version of the manuscript.

Funding

The work of N.Y.S. was funded by financial support from the government assignment for the FRC Kazan Scientific Center of RAS, grant number 125030503189-7.

Institutional Review Board Statement

Not applicable.

Informed Consent Statement

Not applicable.

Data Availability Statement

The original contributions presented in this study are included in the article/Supplementary Materials. Further inquiries can be directed to the corresponding author.

Acknowledgments

The authors express their sincere gratitude to I.I. Mirzayanov and A.R. Garifzyanov for providing phosphorylated dithiocarbamate.

Conflicts of Interest

The authors declare no conflicts of interest. The funders had no role in the design of the study; in the collection, analyses, or interpretation of data; in the writing of the manuscript; or in the decision to publish the results.

Abbreviations

The following abbreviations are used in this manuscript:
C-PCMConductor-like polarizable continuum model
CVsCyclic voltammograms
dtcDithiocarbamate
EPRElectronic paramagnetic resonance
GCEGlassy carbon electrode
PDTCPhosphorylated dithiocarbamate
SMDSolvation model (based) on density

Appendix A

Figure A1. Normalized voltammograms of the [NiII(PDTC)2]2− complex obtained at different potential scan rates (a) and the dependence of the anodic peak potential, Ox1, on log(v) (b); pH = 3.
Inorganics 14 00168 g0a1
Figure A2. Normalized voltammograms of the [NiII(PDTC)2]2− complex obtained at different potential scan rates; pH = 7.
Inorganics 14 00168 g0a2
Figure A3. Normalized voltammograms of the [NiII(PDTC)2]2− complex obtained at different potential scan rates; pH = 9.
Inorganics 14 00168 g0a3

References

  1. Coucouvanis, D. The Chemistry of the Dithioacid and 1, 1-Dithiolate Complexes, 1968–1977. In Progress in Inorganic Chemistry; John Wiley and Sons: Hoboken, NJ, USA, 1979; pp. 301–469. [Google Scholar]
  2. Bond, A.M.; Martin, R.L. Electrochemistry and Redox Behaviour of Transition Metal Dithiocarbamates. Coord. Chem. Rev. 1984, 54, 23–98. [Google Scholar] [CrossRef]
  3. Hogarth, G. Metal-Dithiocarbamate Complexes: Chemistry and Biological Activity. Mini Rev. Med. Chem. 2012, 12, 1202–1215. [Google Scholar] [CrossRef] [PubMed]
  4. Yan, Y.; Krishnakumar, S.; Yu, H.; Ramishetti, S.; Deng, L.-W.; Wang, S.; Huang, L.; Huang, D. Nickel(II) Dithiocarbamate Complexes Containing Sulforhodamine B as Fluorescent Probes for Selective Detection of Nitrogen Dioxide. J. Am. Chem. Soc. 2013, 135, 5312–5315. [Google Scholar] [CrossRef] [PubMed]
  5. Kumar Pal, S.; Singh, B.; Yadav, J.K.; Yadav, C.L.; Drew, M.G.B.; Singh, N.; Indra, A.; Kumar, K. Homoleptic Ni(II) Dithiocarbamate Complexes as Pre-Catalysts for the Electrocatalytic Oxygen Evolution Reaction. Dalton Trans. 2022, 51, 13003–13014. [Google Scholar] [CrossRef] [PubMed]
  6. Ajiboye, T.O.; Ajiboye, T.T.; Marzouki, R.; Onwudiwe, D.C. The Versatility in the Applications of Dithiocarbamates. Int. J. Mol. Sci. 2022, 23, 1317. [Google Scholar] [CrossRef] [PubMed]
  7. Sarker, J.C.; Hogarth, G. Dithiocarbamate Complexes as Single Source Precursors to Nanoscale Binary, Ternary and Quaternary Metal Sulfides. Chem. Rev. 2021, 121, 6057–6123. [Google Scholar] [CrossRef] [PubMed]
  8. Lakshmanan, P.; Arulmozhi, R.; Thirumaran, S.; Ciattini, S. Ni(II) Dithiocarbamate: Synthesis, Crystal Structures, DFT Studies and Applications as Precursors for Nickel Sulfide and Nickel Oxide Nanoparticles. Polyhedron 2022, 218, 115766. [Google Scholar] [CrossRef]
  9. Flamme, M.; Cressey, P.B.; Lu, C.; Bruno, P.M.; Eskandari, A.; Hemann, M.T.; Hogarth, G.; Suntharalingam, K. Induction of Necroptosis in Cancer Stem Cells Using a Nickel(II)-Dithiocarbamate Phenanthroline Complex. Chem. Eur. J. 2017, 23, 9674–9682. [Google Scholar] [CrossRef] [PubMed]
  10. Phinney, J.T.; Bruland, K.W. Trace Metal Exchange in Solution by the Fungicides Ziram and Maneb (Dithiocarbamates) and Subsequent Uptake of Lipophilic Organic Zinc, Copper and Lead Complexes into Phytoplankton Cells. Environ. Toxicol. Chem. 1997, 16, 2046–2053. [Google Scholar] [CrossRef]
  11. Valentine, H.L.; Viquez, O.M.; Amarnath, K.; Amarnath, V.; Zyskowski, J.; Kassa, E.N.; Valentine, W.M. Nitrogen Substituent Polarity Influences Dithiocarbamate-Mediated Lipid Oxidation, Nerve Copper Accumulation, and Myelin Injury. Chem. Res. Toxicol. 2009, 22, 218–226. [Google Scholar] [CrossRef] [PubMed]
  12. Yeo, C.I.; Tiekink, E.R.T.; Chew, J. Insights into the Antimicrobial Potential of Dithiocarbamate Anions and Metal-Based Species. Inorganics 2021, 9, 48. [Google Scholar] [CrossRef]
  13. Maurya, C.; Bajpai, S. Biological Applications of Metal Complexes of Dithiocarbamates. J. Appl. Sci. Educ. 2022, 2, 1–16. [Google Scholar] [CrossRef]
  14. Regulacio, M.D.; Tomson, N.; Stoll, S.L. Dithiocarbamate Precursors for Rare-Earth Sulfides. Chem. Mater. 2005, 17, 3114–3121. [Google Scholar] [CrossRef]
  15. Roffey, A.; Hollingsworth, N.; Hogarth, G. Synthesis of Ternary Sulfide Nanomaterials Using Dithiocarbamate Complexes as Single Source Precursors. Nanoscale Adv. 2019, 1, 3056–3066. [Google Scholar] [CrossRef] [PubMed]
  16. Bobinihi, F.F.; Onwudiwe, D.C.; Hosten, E.C. Synthesis and Characterization of Homoleptic Group 10 Dithiocarbamate Complexes and Heteroleptic Ni(II) Complexes, and the Use of the Homoleptic Ni(II) for the Preparation of Nickel Sulphide Nanoparticles. J. Mol. Struct. 2018, 1164, 475–485. [Google Scholar] [CrossRef]
  17. Sathiyaraj, E.; Thirumaran, S.; Ciattini, S.; Selvanayagam, S. Synthesis and Characterization of Ni(II) Complexes with Functionalized Dithiocarbamates: New Single Source Precursors for Nickel Sulfide and Nickel-Iron Sulfide Nanoparticles. Inorganica Chim. Acta 2019, 498, 119162. [Google Scholar] [CrossRef]
  18. Bobinihi, F.F.; Fayemi, O.E.; Onwudiwe, D.C. Synthesis, Characterization, and Cyclic Voltammetry of Nickel Sulphide and Nickel Oxide Nanoparticles Obtained from Ni(II) Dithiocarbamate. Mater. Sci. Semicond. Process. 2021, 121, 105315. [Google Scholar] [CrossRef]
  19. Hendrickson, A.R.; Martin, R.L.; Rohde, N.M. Dithiocarbamates of Nickel in the Formal Oxidation States I-IV. Electrochemical Study. Inorg. Chem. 1975, 14, 2980–2985. [Google Scholar] [CrossRef]
  20. Lachenal, D. Electrochemical Behaviour of Nickel (II) and Ni (IV) N,N-Diethyldithiocarbamates. Synthesis of a Nickel(IV) Species. Inorg. Nucl. Chem. Lett. 1975, 11, 101–106. [Google Scholar] [CrossRef]
  21. Richburg, C.S.; Farnum, B.H. Influence of Pyridine on the Multielectron Redox Cycle of Nickel Diethyldithiocarbamate. Inorg. Chem. 2019, 58, 15371–15384. [Google Scholar] [CrossRef] [PubMed]
  22. Islam, R.; Blakemore, K.; Farnum, B.H. Role of Solvent Coordination in the Multi-Electron Redox Cycle of Nickel Diethyldithiocarbamate. Inorg. Chem. 2024, 63, 15851–15862. [Google Scholar] [CrossRef] [PubMed]
  23. Bard, A.J.; Faulkner, L.R.; White, H.S. Electrochemical Methods: Fundamentals and Applications; Wiley: Hoboken, NJ, USA, 2022. [Google Scholar]
  24. Mazumder, M.M.R.; Burton, A.; Richburg, C.S.; Saha, S.; Cronin, B.; Duin, E.; Farnum, B.H. Controlling One-Electron vs Two-Electron Pathways in the Multi-Electron Redox Cycle of Nickel Diethyldithiocarbamate. Inorg. Chem. 2021, 60, 13388–13399. [Google Scholar] [CrossRef] [PubMed]
  25. Mazumder, M.M.R.; Dalpati, N.; Pokkuluri, P.R.; Farnum, B.H. Zinc-Catalyzed Two-Electron Nickel(IV/II) Redox Couple for Multi-Electron Storage in Redox Flow Batteries. Inorg. Chem. 2022, 61, 19039–19048. [Google Scholar] [CrossRef] [PubMed]
  26. Humeres, E.; Debacher, N.A.; de Sierra, M.M.S.; Franco, J.D.; Schutz, A. Mechanisms of Acid Decomposition of Dithiocarbamates. 1. Alkyl Dithiocarbamates. J. Org. Chem. 1998, 63, 1598–1603. [Google Scholar] [CrossRef]
  27. Aksenin, N.S.; Bukharov, M.S.; Rodionov, A.A.; Kuzin, Y.I.; Gubaidullin, A.T.; Islamov, D.R.; Shtyrlin, V.G.; Serov, N.Y. Copper Complexes with Phosphorylated Dithiocarbamates in Aqueous Media: Complexation, Structures and Redox Activity. Inorganics 2026, 14, 114. [Google Scholar] [CrossRef]
  28. Chant, R.; Hendrickson, A.; Martin, R.; Rohde, N. Metal Ion and Ligand Dependency of the Redox Behaviour of Some First Row Transition Metal Dithiocarbamates. Aust. J. Chem. 1973, 26, 2533–2536. [Google Scholar] [CrossRef]
  29. Unoura, K.; Fukase, Y.; Sato, Y.; Chida, N.; Ogino, H. Voltammetric Behavior of Doubly-Bridged Dioxobis(Dithiocarbamato)Dimolybdenum(V) Complexes in Dichloromethane. Bull. Chem. Soc. Jpn. 1994, 67, 3122–3124. [Google Scholar] [CrossRef]
  30. Jian, F.; Bei, F.; Zhao, P.; Wang, X.; Fun, H.; Chinnakali, K. Synthesis, Crystal Structure and Stability Studies of Dithiocarbamate Complexes of Some Transition Elements (M.=Co, Ni, Pd). J. Coord. Chem. 2002, 55, 429–437. [Google Scholar] [CrossRef]
  31. Kifle, A.B.; Malakhova, N.; Ivoilova, A.; Leonova, N.; Saraeva, S.; Kozitsina, A. Evaluation of Electrochemical Performance of Antimony Modified Screen-Printed Carbon Electrodes. Chim. Techno Acta 2024, 11, 202411204. [Google Scholar] [CrossRef]
  32. Svalova, T.S.; Zaidullina, R.A.; Medvedeva, M.V.; Vedernikova, E.D.; Kozitsina, A.N. Electrochemical Behavior of Chloramphenicol on Carbon Electrodes in a Microelectrochemical Cell. Chim. Techno Acta 2022, 9, 20229409. [Google Scholar] [CrossRef]
  33. Aoki, K.J.; Chen, J.; Liu, Y.; Jia, B. Peak Potential Shift of Fast Cyclic Voltammograms Owing to Capacitance of Redox Reactions. J. Electroanal. Chem. 2020, 856, 113609. [Google Scholar] [CrossRef]
  34. Xiao, F.; Zhou, H.; Lin, H.; Li, H.; Zou, T.; Wu, Y.; Guo, Z. A Fast Scan Cyclic Voltammetric Digital Circuit with Precise Ohmic Drop Compensation by Online Measuring Solution Resistance and Its Biosensing Application. Anal. Chim. Acta 2021, 1175, 338744. [Google Scholar] [CrossRef] [PubMed]
  35. Deroco, P.B.; Wachholz Junior, D.; Kubota, L.T. Silver Inkjet-Printed Electrode on Paper for Electrochemical Sensing of Paraquat. Chemosensors 2021, 9, 61. [Google Scholar] [CrossRef]
  36. Yan, L.; Lu, Y.; Li, X. A Density Functional Theory Protocol for the Calculation of Redox Potentials of Copper Complexes. Phys. Chem. Chem. Phys. 2016, 18, 5529–5536. [Google Scholar] [CrossRef] [PubMed]
  37. Mirzayanov, I.I.; Garifzyanov, A.R.; Islamov, D.R.; Shtyrlin, V.G. Synthesis and Crystal Structure of Dipotassium Salts of N-Alkyl-N-{[O-Alkoxy(Hydroxy)Phosphoryl]Methyl}ditiocarbamic Acids. Russ. J. Gen. Chem. 2020, 90, 381–384. [Google Scholar] [CrossRef]
  38. Stoll, S.; Schweiger, A. EasySpin, a Comprehensive Software Package for Spectral Simulation and Analysis in EPR. J. Magn. Reson. 2006, 178, 42–55. [Google Scholar] [CrossRef] [PubMed]
  39. Neese, F. The ORCA Program System. WIREs Comput. Mol. Sci. 2012, 2, 73–78. [Google Scholar] [CrossRef]
  40. Neese, F. Software Update: The ORCA Program System—Version 6.0. WIREs Comput. Mol. Sci. 2025, 15, e70019. [Google Scholar] [CrossRef]
  41. Becke, A.D. Density-Functional Thermochemistry. III. The Role of Exact Exchange. J. Chem. Phys. 1993, 98, 5648. [Google Scholar] [CrossRef]
  42. Lee, C.; Yang, W.; Parr, R.G. Development of the Colle-Salvetti Correlation-Energy Formula into a Functional of the Electron Density. Phys. Rev. B 1988, 37, 785–789. [Google Scholar] [CrossRef] [PubMed]
  43. Weigend, F.; Ahlrichs, R. Balanced Basis Sets of Split Valence, Triple Zeta Valence and Quadruple Zeta Valence Quality for H to Rn: Design and Assessment of Accuracy. Phys. Chem. Chem. Phys. 2005, 7, 3297. [Google Scholar] [CrossRef] [PubMed]
  44. Weigend, F. Accurate Coulomb-Fitting Basis Sets for H to Rn. Phys. Chem. Chem. Phys. 2006, 8, 1057. [Google Scholar] [CrossRef] [PubMed]
  45. Rappoport, D.; Furche, F. Property-Optimized Gaussian Basis Sets for Molecular Response Calculations. J. Chem. Phys. 2010, 133, 134105. [Google Scholar] [CrossRef] [PubMed]
  46. Grimme, S.; Antony, J.; Ehrlich, S.; Krieg, H. A Consistent and Accurate Ab Initio Parametrization of Density Functional Dispersion Correction (DFT-D) for the 94 Elements H-Pu. J. Chem. Phys. 2010, 132, 154104. [Google Scholar] [CrossRef] [PubMed]
  47. Grimme, S.; Ehrlich, S.; Goerigk, L. Effect of the Damping Function in Dispersion Corrected Density Functional Theory. J. Comput. Chem. 2011, 32, 1456–1465. [Google Scholar] [CrossRef] [PubMed]
  48. Cossi, M.; Rega, N.; Scalmani, G.; Barone, V. Energies, Structures, and Electronic Properties of Molecules in Solution with the C-PCM Solvation Model. J. Comput. Chem. 2003, 24, 669–681. [Google Scholar] [CrossRef] [PubMed]
  49. Marenich, A.V.; Cramer, C.J.; Truhlar, D.G. Universal Solvation Model Based on Solute Electron Density and on a Continuum Model of the Solvent Defined by the Bulk Dielectric Constant and Atomic Surface Tensions. J. Phys. Chem. B 2009, 113, 6378–6396. [Google Scholar] [CrossRef] [PubMed]
  50. Hanwell, M.D.; Curtis, D.E.; Lonie, D.C.; Vandermeersch, T.; Zurek, E.; Hutchison, G.R. Avogadro: An Advanced Semantic Chemical Editor, Visualization, and Analysis Platform. J. Cheminform. 2012, 4, 17. [Google Scholar] [CrossRef] [PubMed]
  51. Chemcraft. Graphical Software for Visualization of Quantum Chemistry Computations, Version 1.8, Build 780. Available online: https://www.chemcraftprog.com (accessed on 22 July 2025).
Scheme 1. Phosphorylated dithiocarbamate used in the work.
Inorganics 14 00168 sch001
Figure 1. (a) Electronic absorption spectra of nickel(II) solutions with phosphorylated dithiocarbamate. c(Ni(II)) = 4.08∙10−4 M, c(PDTC) = 8.18∙10−4–8,11∙10−3M. (b) Absorbance of a nickel(II) solution with excess of phosphorylated dithiocarbamate at a wavelength of 390 nm as a function of time. c(Ni(II)) = 4.02∙10−4 M, c(PDTC) = 1.97∙10−2 M. pH = 8, T = 25 °C, 1 M KNO3.
Inorganics 14 00168 g001
Figure 2. Experimental and simulated EPR spectra of NiIII(PDTC)33− at room temperature (a) and at 105 K (b). The signal marked with an asterisk belongs to the reference radical.
Inorganics 14 00168 g002
Figure 3. Optimized structures (B3LYP-D3/def2-TZVPPD level) of the nickel(II) complexes with PDTC in water (C-PCM model). Coordination bond lengths are given in Å. Hydrogen atoms—white, carbon—gray, nitrogen—blue, oxygen—red, phosphorus—orange, sulfur—yellow, nickel—green.
Inorganics 14 00168 g003
Figure 4. Cyclic voltammograms recorded in 2 mM aqueous solution of [NiII(PDTC)2]2−, pH = 9, background electrolyte—0.1 M KNO3: (a) scan rate of 0.1 V/s; (b) the set of scan rates from 0.005 V/s to 0.2 V/s.
Inorganics 14 00168 g004
Figure 5. Normalized cyclic voltammograms of [NiII(PDTC)2]2− recorded at different potential scan rates; pH = 9.
Inorganics 14 00168 g005
Figure 6. Cyclic voltammograms of [NiII(PDTC)2]2− recorded in solutions with different pH values (3, 5, 7, and 9) at a scan rate of 0.1 V/s.
Inorganics 14 00168 g006
Figure 7. Normalized voltammograms of the [NiII(PDTC)2]2− complex obtained at different potential scan rates (a) and the dependence of the anodic peak potential Ox1 on log(v) (b); pH = 5.
Inorganics 14 00168 g007
Figure 8. Normalized voltammograms of the [NiII(PDTC)2]2− complex obtained at different potential scanning rates (a) and part of the normalized voltammogram for the scan rate 40 mV/s (b); pH = 5.
Inorganics 14 00168 g008
Scheme 2. Proposed scheme of electrochemical transformations of NiII(PDTC)22− in an aqueous medium.
Inorganics 14 00168 sch002
Figure 9. Cyclic voltammograms recorded in the absence and in the presence of 2 mM [NiII(PDTC)2]2−, pH = 5, background electrolyte—0.1 M KNO3.
Inorganics 14 00168 g009
Figure 10. Optimized structures (B3LYP-D3/def2-TZVPPD level) of the nickel(III) and (IV) tris-complexes with PDTC in water (C-PCM model). Coordination bond lengths are given in Å. Hydrogen atoms—white, carbon—gray, nitrogen—blue, oxygen—red, phosphorus—orange, sulfur—yellow, nickel—green.
Inorganics 14 00168 g010
Figure 11. Optimized structures (B3LYP-D3/def2-TZVPPD level) of the nickel(III) and (IV) hydroxo-complexes with PDTC in water (C-PCM model). Coordination bond lengths are given in Å. Hydrogen atoms—white, carbon—gray, nitrogen—blue, oxygen—red, phosphorus—orange, sulfur—yellow, nickel—green.
Inorganics 14 00168 g011
Table 1. Calculated standard redox potentials for nickel(III)/nickel(II) complexes transitions relative to Ag/AgCl (1 M KCl) (E = 0.222 V).
TransitionE(C-PCM), VE(SMD), V
[NiIII(PDTC)2] + 1ē ⇔ [NiII(PDTC)2]2−0.4850.480
[NiIII(PDTC)2(H2O)] + 1ē ⇔ [NiII(PDTC)2(H2O)]2−0.2160.251
[NiIII(PDTC)2(H2O)2] + 1ē ⇔ [NiII(PDTC)2(H2O)2]2−0.2550.237
[NiIII(PDTC)3]3− + 1ē ⇔ [NiII(PDTC)3]4−−0.979−1.175
[NiIII(PDTC)2(OH)]2− + 1ē ⇔ [NiII(PDTC)2(OH)]3−−0.633−0.677
cis-[NiIII(PDTC)2(OH)2]3− + 1ē ⇔ cis-[NiII(PDTC)2(OH)2]4−−0.891−1.164
trans-[NiIII(PDTC)2(OH)2]3− + 1ē ⇔ trans-[NiII(PDTC)2(OH)2]4−−0.837−0.892
Table 2. Calculated standard redox potentials for nickel(IV)/nickel(III) complex transitions relative to Ag/AgCl (1 M KCl) (E = 0.222 V).
TransitionE(C-PCM), VE(SMD), V
[NiIV(PDTC)2] + 1ē ⇔ [NiIII(PDTC)2]1.8361.646
[NiIV(PDTC)2(H2O)] + 1ē ⇔ [NiIII(PDTC)2(H2O)]1.7461.810
[NiIV(PDTC)2(H2O)2] + 1ē ⇔ [NiIII(PDTC)2(H2O)2]2.0602.123
[NiIV(PDTC)3]2− + 1ē ⇔ [NiIII(PDTC)3]3−−0.134−0.199
[NiIV(PDTC)2(OH)] + 1ē ⇔ [NiIII(PDTC)2(OH)]2−0.8880.924
cis-[NiIV(PDTC)2(OH)2]2− + 1ē ⇔ cis-[NiIII(PDTC)2(OH)2]3−−0.189−0.136
trans-[NiIV(PDTC)2(OH)2]2− + 1ē ⇔ trans-[NiIII(PDTC)2(OH)2]3−−0.149−0.165
Disclaimer/Publisher’s Note: The statements, opinions and data contained in all publications are solely those of the individual author(s) and contributor(s) and not of MDPI and/or the editor(s). MDPI and/or the editor(s) disclaim responsibility for any injury to people or property resulting from any ideas, methods, instructions or products referred to in the content.