

Synthesis, Characterization, and Anticancer Activity of 3-Chlorothiophene-2-carboxylic Acid Transition Metal Complexes
 ,
,
Abstract

1. Introduction
2. Results and Discussion
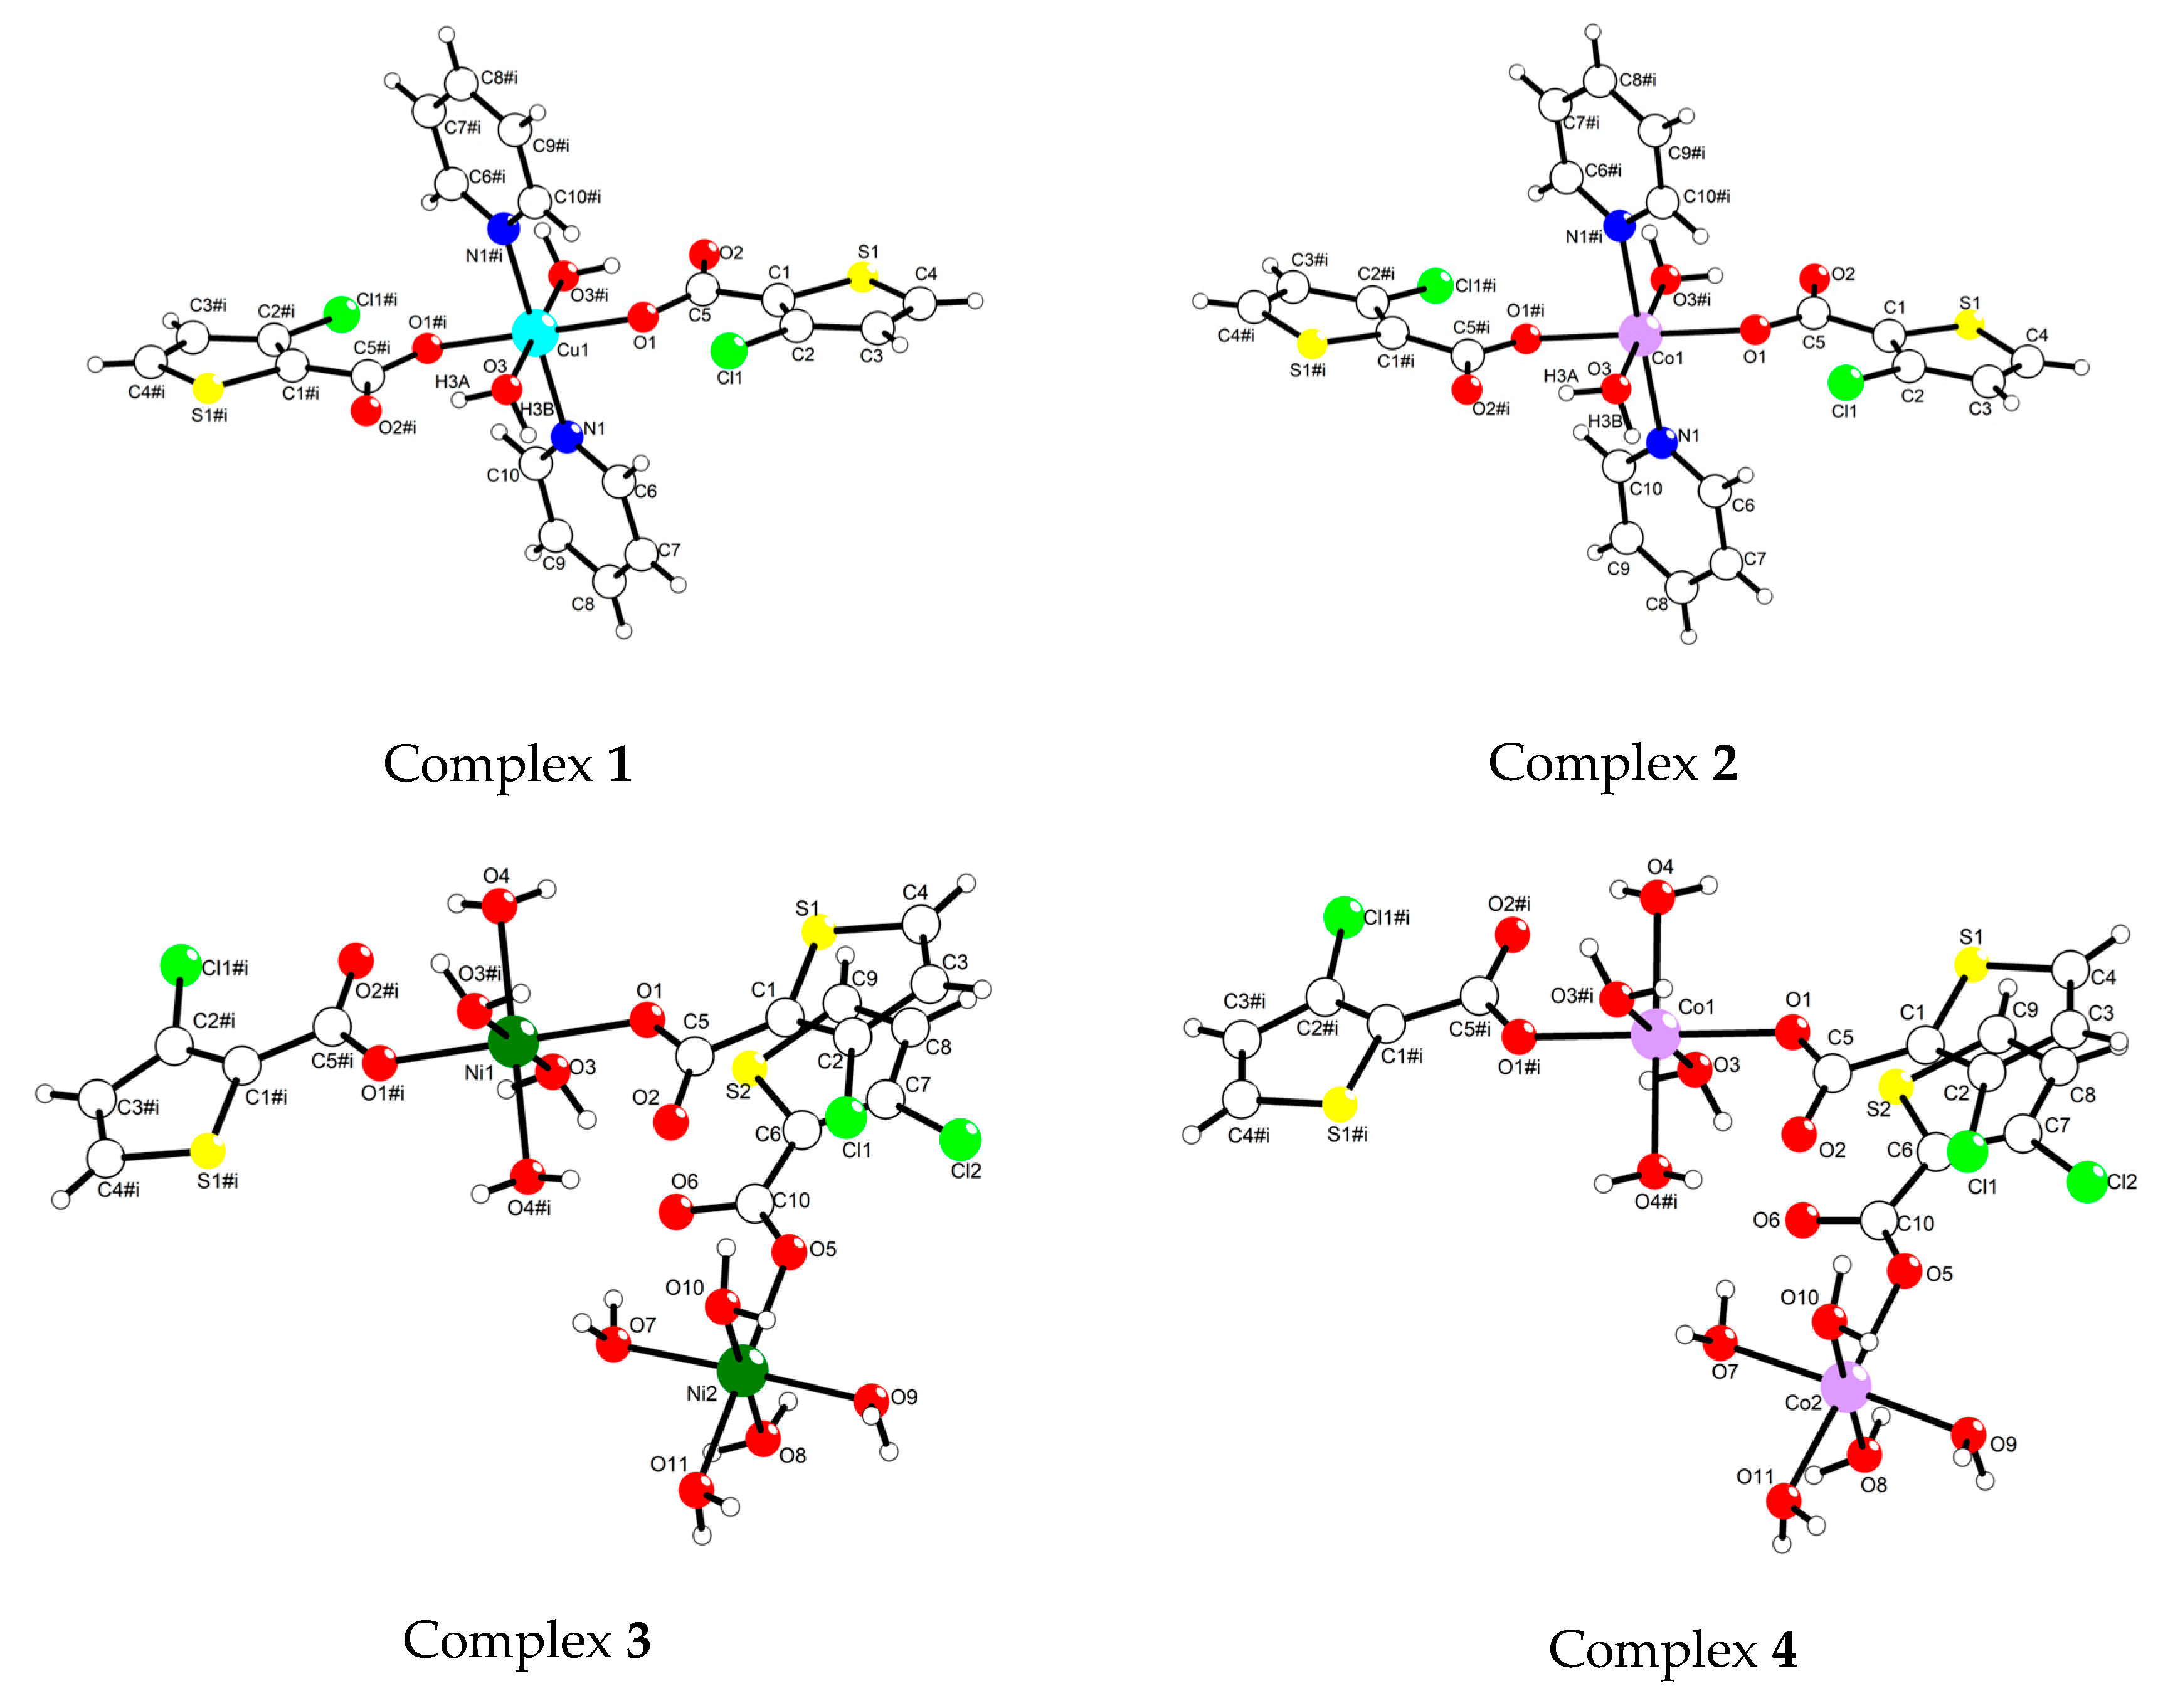
2.1. Crystal Structure Analyses of Complexes 1–4
2.2. Infrared Spectra of Complexes 1–4
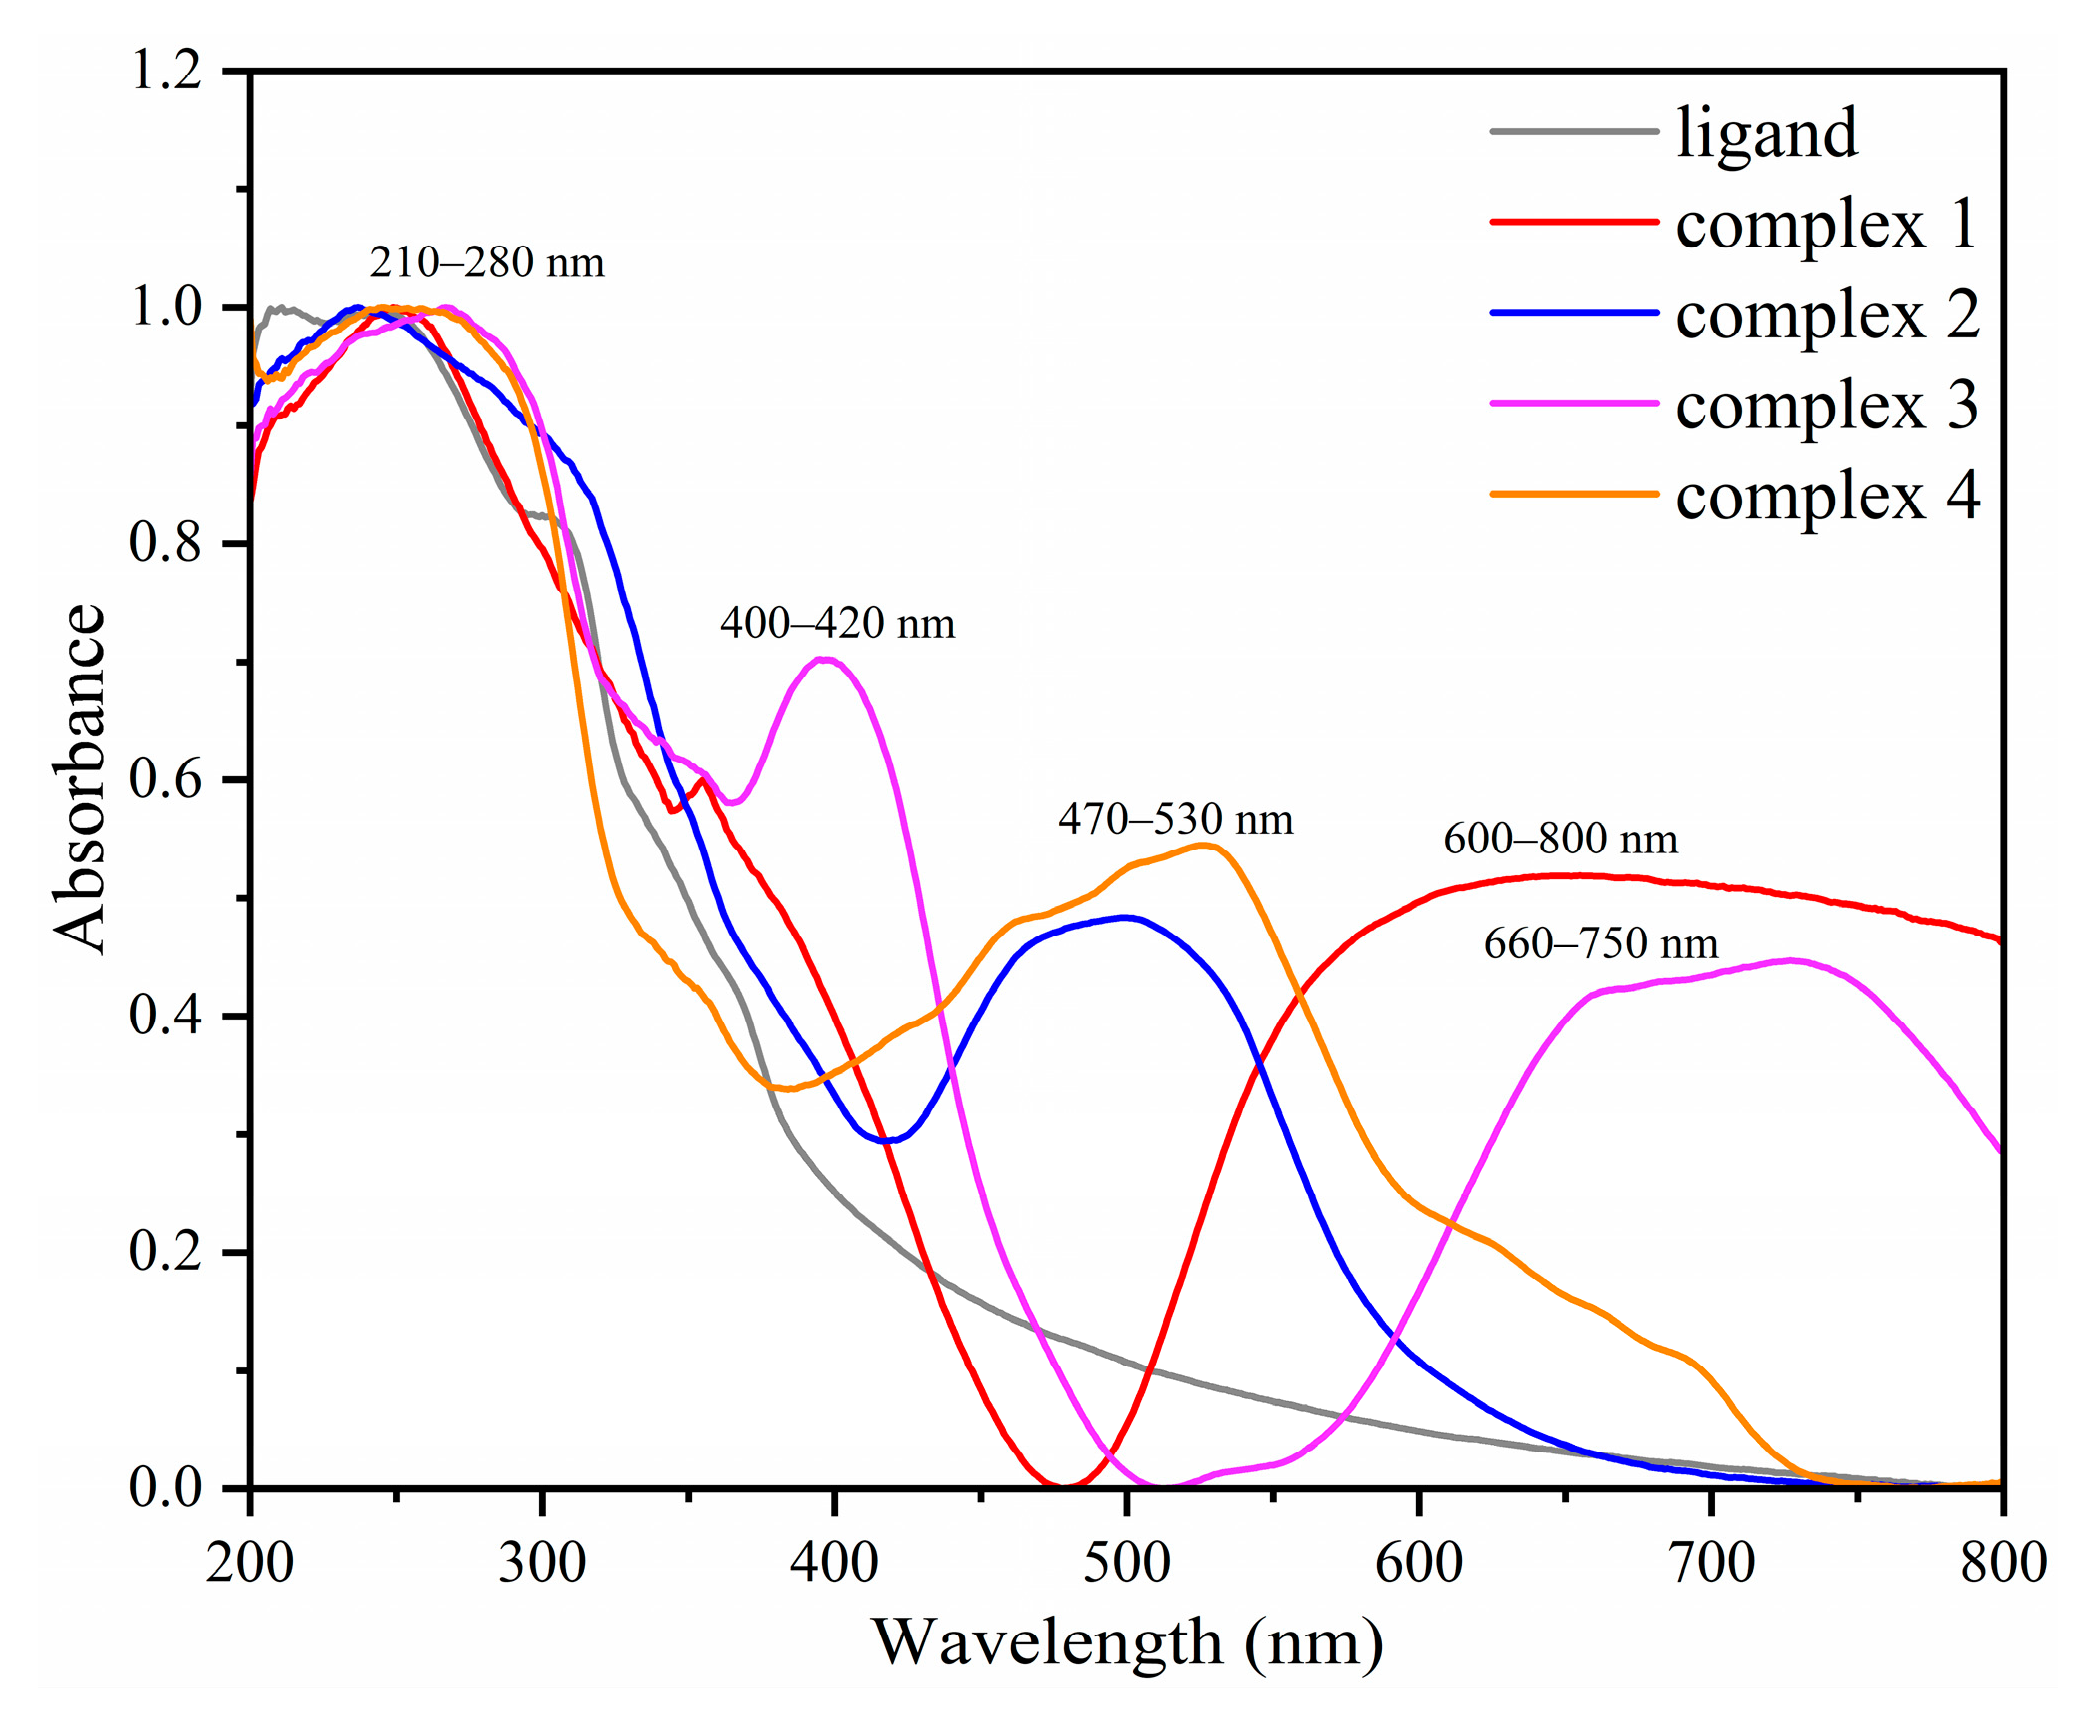
2.3. UV-Visible Diffuse Reflectance Spectra of Complexes 1–4
2.4. Electron Paramagnetic Resonance Spectrum of Complex 1
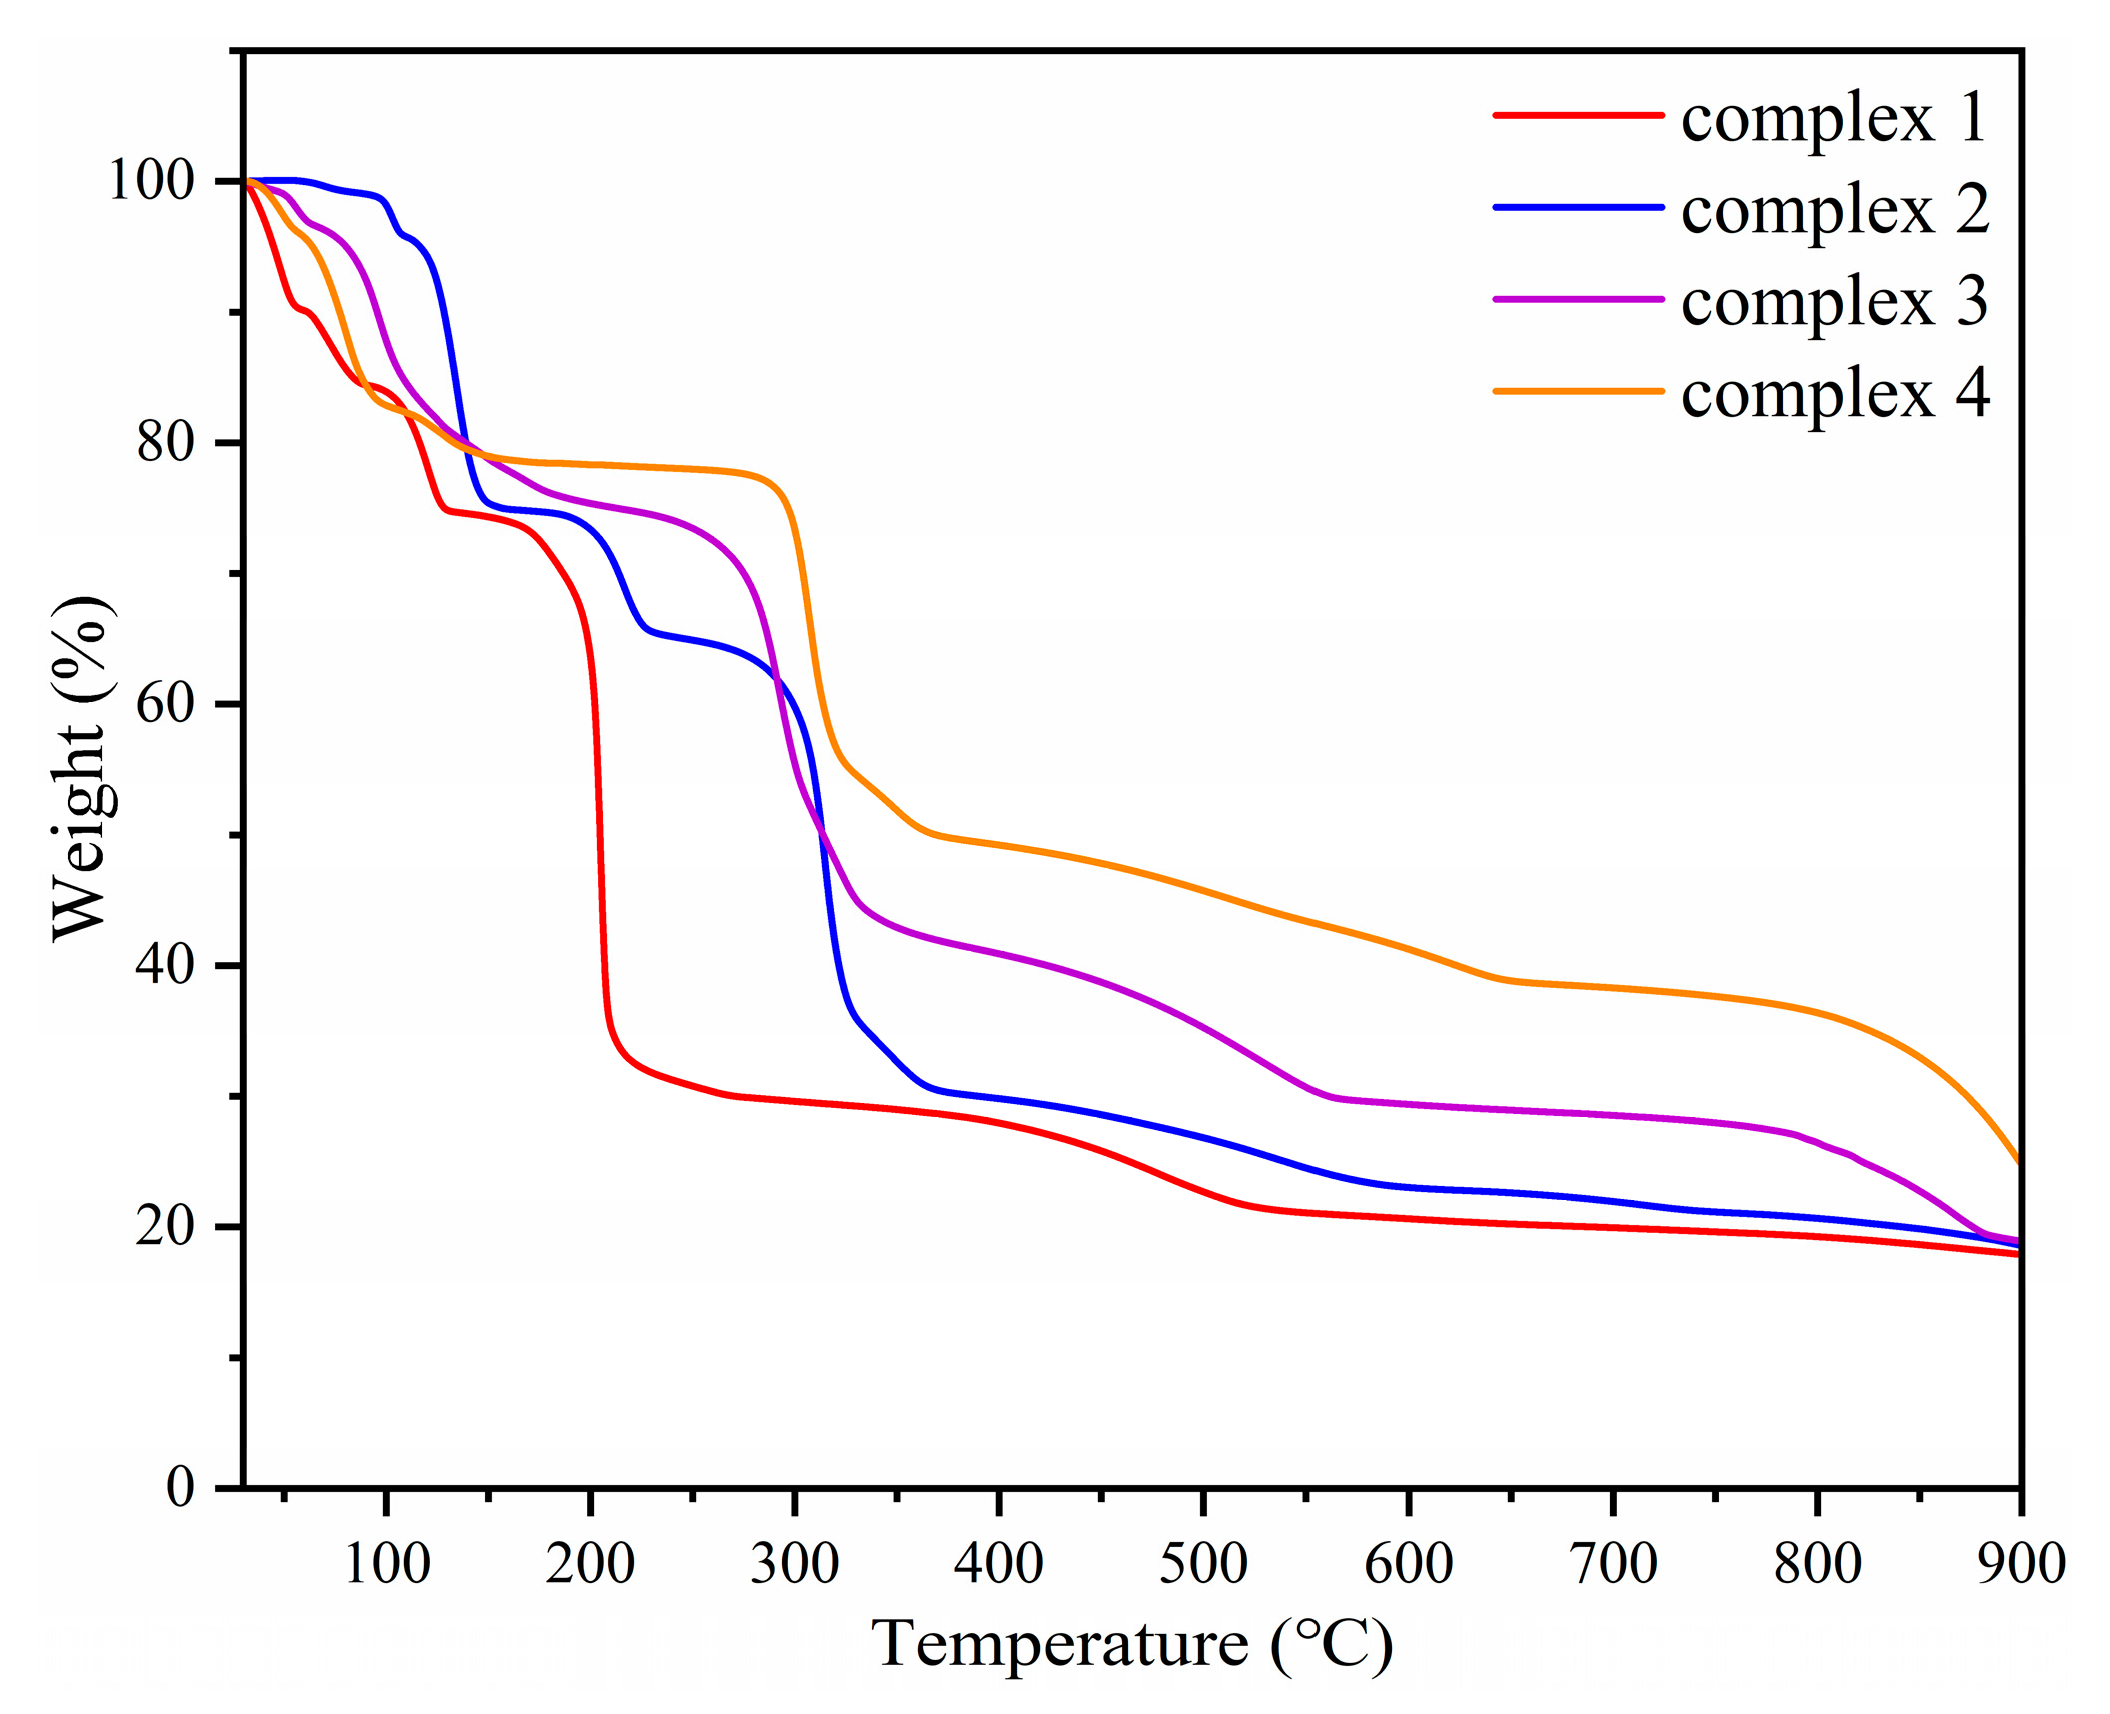
2.5. Thermogravimetric Analysis of Complexes 1–4
2.6. Electrospray Ionization Mass Spectrometry Analysis of Complexes 1–4
2.7. Reduction Potential and Stability Analysis of Complexes 1–4
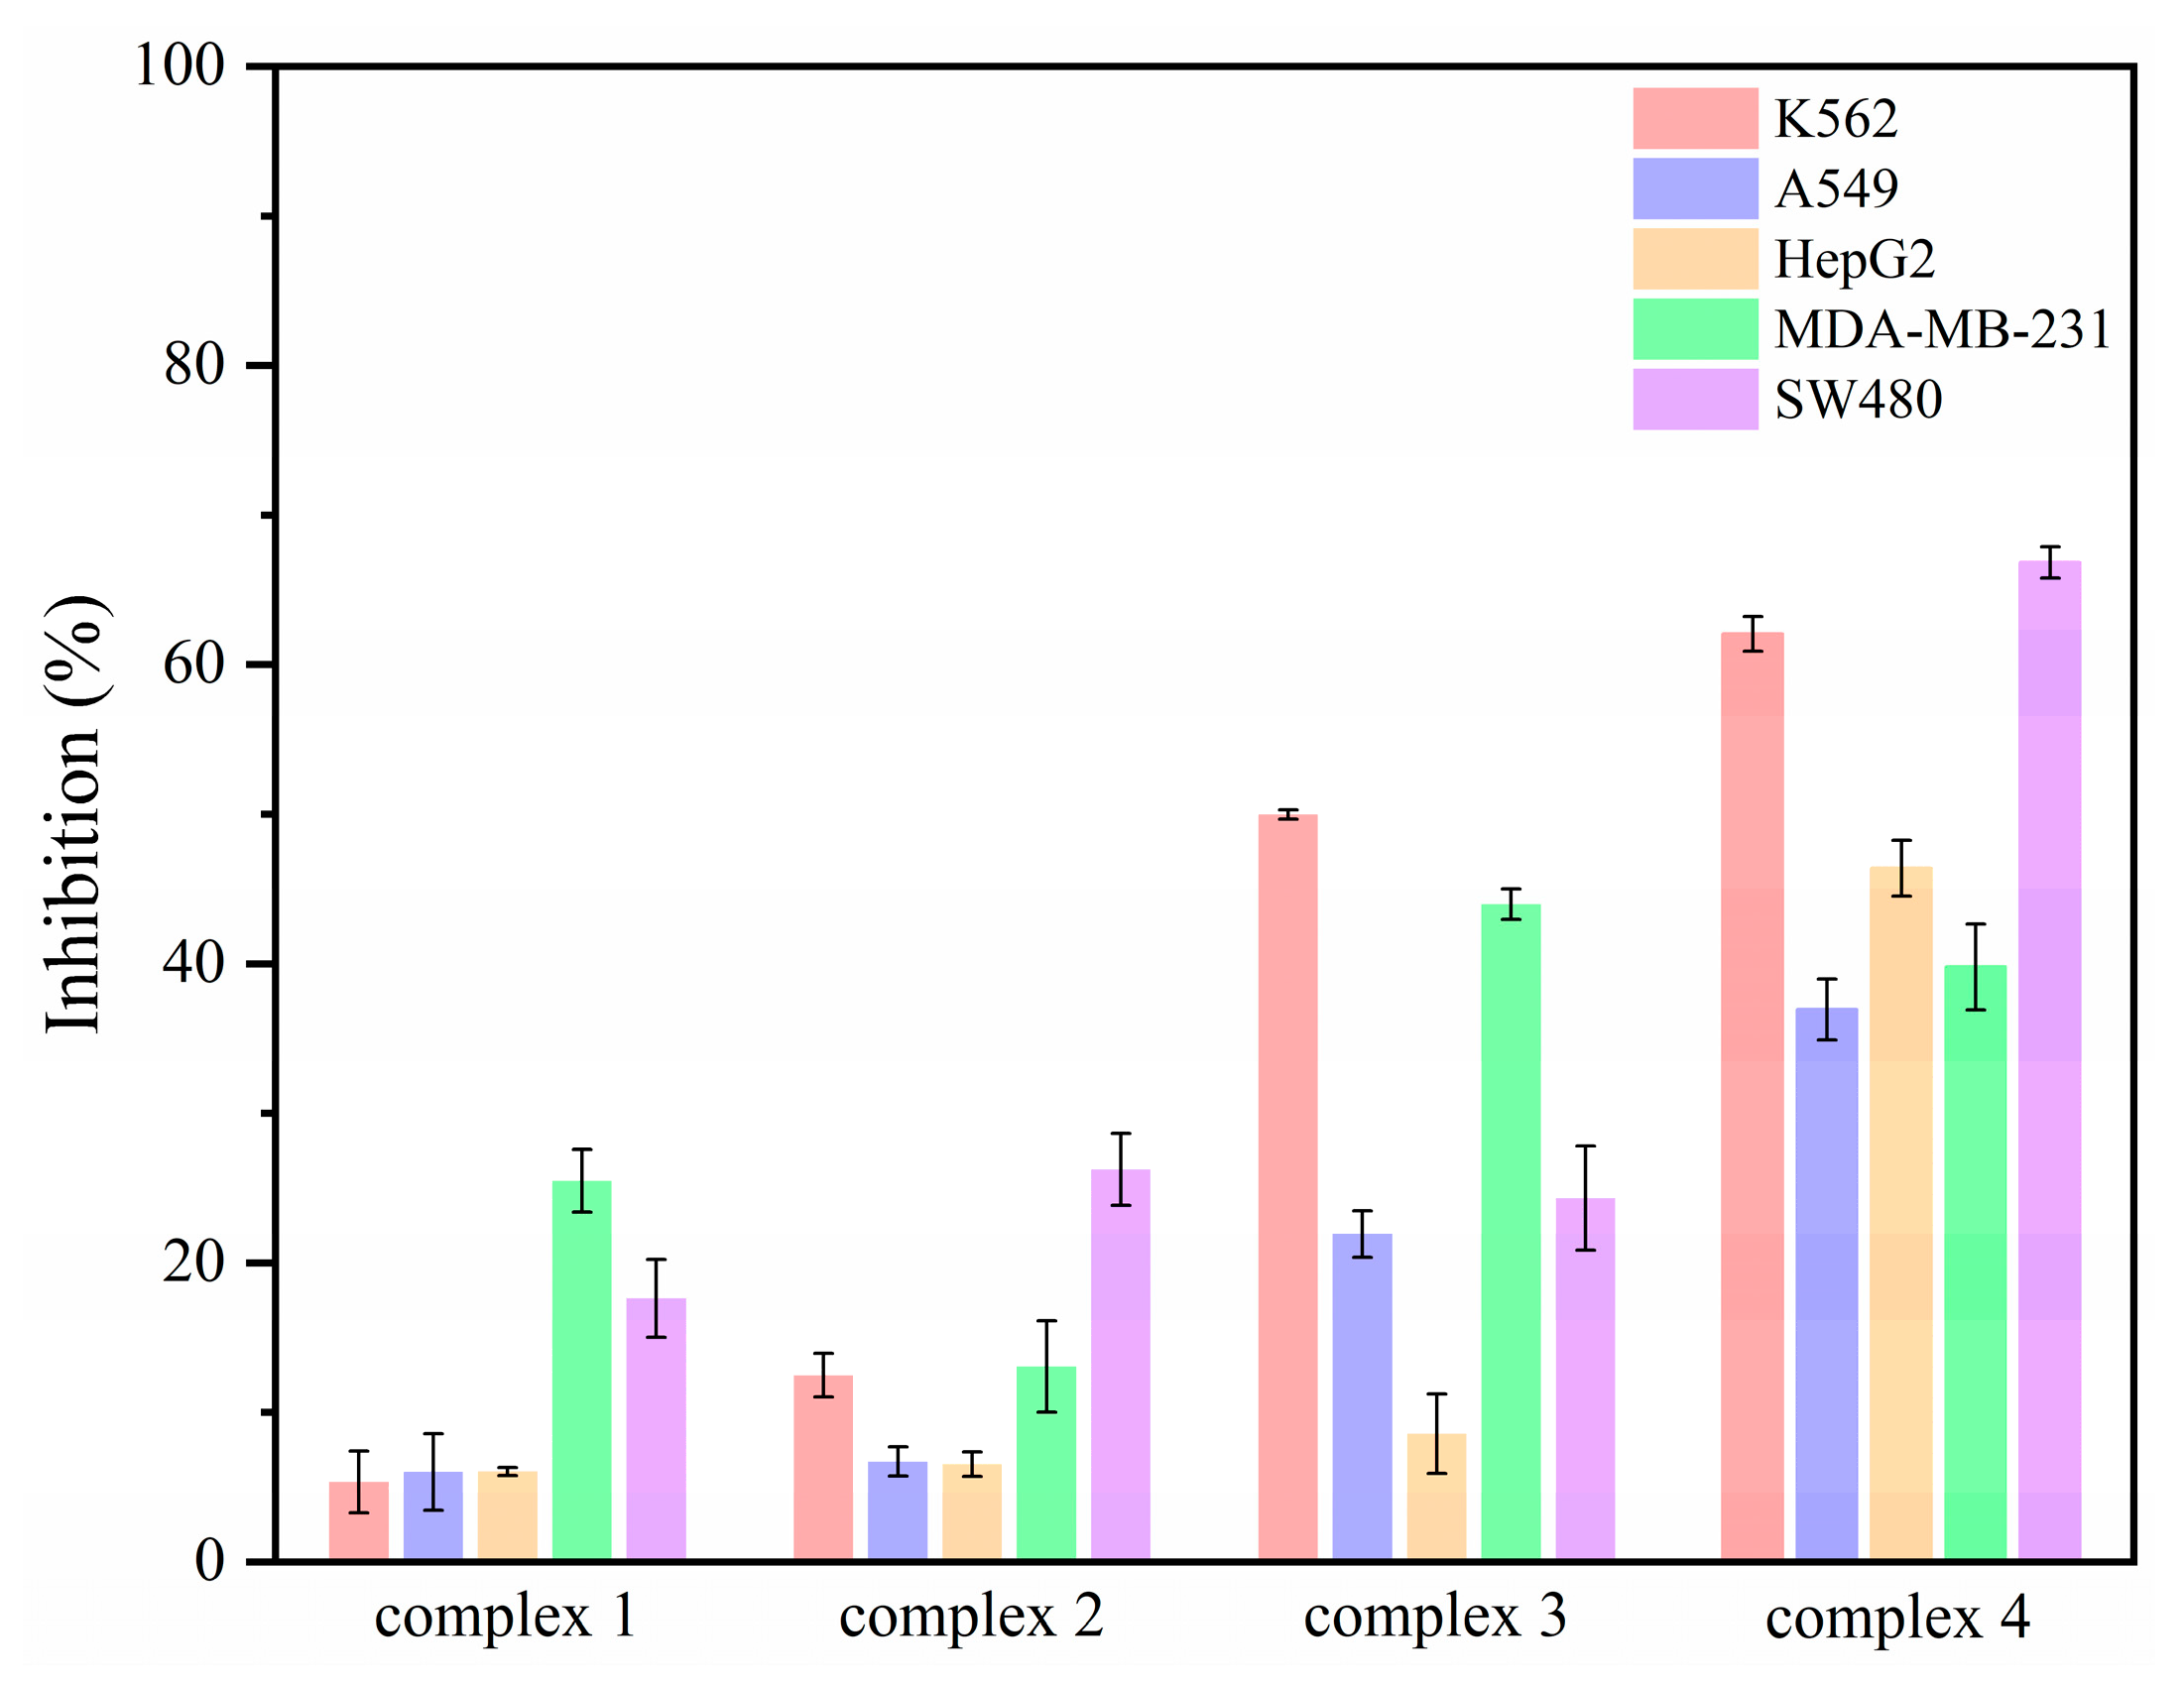
2.8. Cytotoxicity Assays of Complexes 1–4
3. Experimental Section
3.1. Materials and Methods of Characterization
3.2. Single-Crystal X-Ray Structure Determinations
3.3. Cytotoxicity Assay
4. Conclusions
Supplementary Materials
Author Contributions
Funding
Institutional Review Board Statement
Informed Consent Statement
Data Availability Statement
Acknowledgments
Conflicts of Interest
References
- Erxleben, A. Transition metal salen complexes in bioinorganic and medicinal chemistry. Inorg. Chim. Acta 2018, 472, 40–57. [Google Scholar] [CrossRef]
- Ott, I. On the medicinal chemistry of gold complexes as anticancer drugs. Coord. Chem. Rev. 2009, 253, 1670–1681. [Google Scholar] [CrossRef]
- Gasser, G.; Metzler-Nolte, N. The potential of organometallic complexes in medicinal chemistry. Curr. Opin. Chem. Biol. 2012, 16, 84–91. [Google Scholar] [CrossRef]
- Voloshin, Y.Z.; Varzatskii, O.A.; Bubnov, Y.N. Cage complexes of transition metals in biochemistry and medicine. Russ. Chem. Bull. 2007, 56, 577–605. [Google Scholar] [CrossRef]
- Dalia, S.; Afsan, F.; Hossain, M.; Khan, M.N.; Zakaria, C.; Zahan, M.K.-E.; Ali, M. A short review on chemistry of schiff base metal complexes and their catalytic application. Int. J. Chem. Stud. 2018, 6, 2859–2866. [Google Scholar]
- Soldevila-Barreda, J.J.; Metzler-Nolte, N. Intracellular Catalysis with Selected Metal Complexes and Metallic Nanoparticles: Advances toward the Development of Catalytic Metallodrugs. Chem. Rev. 2019, 119, 829–869. [Google Scholar] [CrossRef]
- Williams, C.K.; Nozaki, K. Metal Complexes for Catalytic Polymerizations. Inorg. Chem. 2020, 59, 957–959. [Google Scholar] [CrossRef]
- Oehninger, L.; Rubbiani, R.; Ott, I. N-Heterocyclic carbene metal complexes in medicinal chemistry. Dalton Trans. 2013, 42, 3269–3284. [Google Scholar] [CrossRef]
- Dasmahapatra, U.; Maiti, B.; Alam, M.M.; Chanda, K. Anti-cancer property and DNA binding interaction of first row transition metal complexes: A decade update. Eur. J. Med. Chem. 2024, 275, 116603. [Google Scholar] [CrossRef]
- Wang, L.; Chong, S.; Wu, S.; Sun, Y.; Zhang, Y.; Sun, C.; Zhu, M. Construction of Zn (II)/Mn (II) complexes based carboxylic acid ligands and their drug delivery, antiproliferation and DNA interaction. J. Mol. Liq. 2025, 425, 127187. [Google Scholar] [CrossRef]
- Guan, Q.; Shi, X.; Shen, J.; Zhao, G. Antimicrobial, anticancer and DNA binding studies of transition metal(II) complexes containing 2-phenyl-4-selenazole carboxylic acid. Sci. China Chem. 2013, 56, 588–594. [Google Scholar] [CrossRef]
- Garcia-Valdivia, A.A.; Jannus, F.; Garcia-Garcia, A.; Choquesillo-Lazarte, D.; Fernandez, B.; Medina-O’donnell, M.; Lupianez, J.A.; Cepeda, J.; Reyes-Zurita, F.J.; Rodriguez-Dieguez, A. Anti-cancer and anti-inflammatory activities of a new family of coordination compounds based on divalent transition metal ions and indazole-3-carboxylic acid. J. Inorg. Biochem. 2021, 215, 111308. [Google Scholar] [CrossRef]
- Tamer, Ö.; Mahmoody, H.; Feyzioğlu, K.F.; Kılınç, O.; Avci, D.; Orun, O.; Dege, N.; Atalay, Y. Synthesis of the first mixed ligand Mn (II) and Cd (II) complexes of 4-methoxy-pyridine-2-carboxylic acid, molecular docking studies and investigation of their anti-tumor effects in vitro. Appl. Organomet. Chem. 2019, 34, e5416. [Google Scholar] [CrossRef]
- Zhang, S.; Zhong, X.; Yuan, H.; Guo, Y.; Song, D.; Qi, F.; Zhu, Z.; Wang, X.; Guo, Z. Interfering in apoptosis and DNA repair of cancer cells to conquer cisplatin resistance by platinum(iv) prodrugs. Chem. Sci. 2020, 11, 3829–3835. [Google Scholar] [CrossRef]
- Zhang, L.; Yin, H.; Zhang, J.-C.; Luo, M.; Meng, X.-G. Synthesis, crystal structure and anticancer activity of 4-chloro-2-methoxybenzoic acid transition metal complexes. J. Mol. Struct. 2024, 1316, 139080. [Google Scholar] [CrossRef]
- Wang, X.; Yan, M.; Wang, Q.; Wang, H.; Wang, Z.; Zhao, J.; Li, J.; Zhang, Z. In Vitro DNA-Binding, Anti-Oxidant and Anticancer Activity of Indole-2-Carboxylic Acid Dinuclear Copper(II) Complexes. Molecules 2017, 22, 171. [Google Scholar] [CrossRef]
- Rijwan; Arjmand, F.; Tabassum, S. Synthesis, spectroscopic, single crystal X-ray diffraction studies of Bilastine, BLA(bpy)2Cu(II) & Zn(II) complexes as anticancer chemotherapeutic agents: Validation of their cytotoxic potency on cancer cell lines. J. Mol. Struct. 2025, 1328, 141244. [Google Scholar]
- Rijwan; Arjmand, F.; Tabassum, S. Repurposing the antihistamine drug bilastine as an anti-cancer metallic drug entity: Synthesis and single-crystal X-ray structure analysis of metal-based bilastine and phen [Co(II), Cu(II) and Zn(II)] tailored anticancer chemotherapeutic agents against resistant cancer cells. Dalton Trans. 2024, 53, 10126–10141. [Google Scholar] [PubMed]
- Li, H.-M.; Li, G.-D.; Li, J.-Y.; Zhang, T. An Iodine-Functionalized Metal–Organic framework for catalytic alkene bromination. Inorg. Chem. Commun. 2022, 141, 109529. [Google Scholar] [CrossRef]
- Prakash, A.; Saini, S.; Basappa, S.; Gupta, D.K.; Mao, L.; Bose, S.K. Metal-Organic Frameworks for Catalytic Construction of C−B Bond and Related Reactions. ChemCatChem 2022, 15, e202201156. [Google Scholar] [CrossRef]
- Koner, S. Catalytic epoxidation of olefin over metal-organic framework solids: A mini-review. J. Organomet. Chem. 2025, 1025, 123449. [Google Scholar] [CrossRef]
- Xie, H.; Bai, M.; Wang, A.; Chen, Z.; Chang, F.; Lian, J.; Xu, S. Antenna-based optimization of triplet radioluminescence of Tb-organic complex scintillator for efficient X-ray detection. J. Colloid Interface Sci. 2024, 676, 45–51. [Google Scholar] [CrossRef]
- Psalti, A.E.; Andriotou, D.; Diamantis, S.A.; Chatz-Giachia, A.; Pournara, A.; Manos, M.J.; Hatzidimitriou, A.; Lazarides, T. Mixed-Metal and Mixed-Ligand Lanthanide Metal-Organic Frameworks Based on 2,6-Naphthalenedicarboxylate: Thermally Activated Sensitization and White-Light Emission. Inorg. Chem. 2022, 61, 11959–11972. [Google Scholar] [CrossRef]
- Zhang, Y.; Xu, S.; Huang, K.; Zhang, X.-Y.; Qin, D.-B.; Zhao, B. A Novel 2D Copper–Organic Framework for Catalyzing CO2 Chemical Fixation and Luminescence Sensing. Cryst. Growth Des. 2023, 23, 7873–7881. [Google Scholar] [CrossRef]
- Kelland, L. The resurgence of platinum-based cancer chemotherapy. Nat. Rev. Cancer 2007, 7, 573–584. [Google Scholar] [CrossRef]
- Fernández, C.Y.; Rocha, A.; Azam, M.; Alvarez, N.; Min, K.; Batista, A.A.; Costa-Filho, A.J.; Ellena, J.; Facchin, G. Synthesis, Characterization, DNA Binding and Cytotoxicity of Copper(II) Phenylcarboxylate Complexes. Inorganics 2023, 11, 398. [Google Scholar] [CrossRef]
- Fernandez, C.Y.; Alvarez, N.; Rocha, A.; Mendes, L.F.S.; Costa-Filho, A.J.; Ellena, J.; Batista, A.A.; Facchin, G. Phenanthroline and phenyl carboxylate mixed ligand copper complexes in developing drugs to treat cancer. J. Inorg. Biochem. 2024, 260, 112700. [Google Scholar] [CrossRef] [PubMed]
- Mandal, P.; Sonkar, C.; Dhankhar, S.S.; Nagaraja, C.M.; Mukhopadhyay, S. Ruthenium(II)-arene complexes containing ferrocenamide ligands: Synthesis, characterisation and antiproliferative activity against cancer cell lines. J. Organomet. Chem. 2020, 916, 121247. [Google Scholar] [CrossRef]
- Umar, Q.; Huang, Y.; Nazeer, A.; Yin, H.; Zhang, J.C.; Luo, M.; Meng, X.G. Synthesis, characterization and anticancer activities of Zn2+, C(2+, Co2+ and Ni2+ complexes involving chiral amino alcohols. RSC Adv. 2022, 12, 32119–32128. [Google Scholar] [CrossRef]
- Rostami, L.; Golchoubian, H. Copper(II) complexes containing hemilabile tridentate ligand as chromotropic probes. J. Coord. Chem. 2017, 70, 3660–3676. [Google Scholar] [CrossRef]
- Klanicová, A.; Houck, J.D.; Baran, P.; Trávníček, Z. Synthesis, X-ray structures, properties and SOD-like activity of ternary copper(II) complexes showing the N4O2 coordination with a combination of monodentate and bidentate N-donor ligands. Inorg. Chim. Acta 2012, 384, 47–53. [Google Scholar] [CrossRef]
- Santana, F.S.; Briganti, M.; Cassaro, R.A.A.; Totti, F.; Ribeiro, R.R.; Hughes, D.L.; Nunes, G.G.; Reis, D.M. An Oxalate-Bridged Copper(II) Complex Combining Monodentate Benzoate, 2,2′-bipyridine and Aqua Ligands: Synthesis, Crystal Structure and Investigation of Magnetic Properties. Molecules 2020, 25, 1898. [Google Scholar] [CrossRef] [PubMed]
- Song, X.; Wang, Y.; Wang, C.; Wang, D.; Zhuang, G.; Kirlikovali, K.O.; Li, P.; Farha, O.K. Design Rules of Hydrogen-Bonded Organic Frameworks with High Chemical and Thermal Stabilities. J. Am. Chem. Soc. 2022, 144, 10663–10687. [Google Scholar] [CrossRef] [PubMed]
- Deacon, G. Relationships between the carbon-oxygen stretching frequencies of carboxylato complexes and the type of carboxylate coordination. Coord. Chem. Rev. 1980, 33, 227–250. [Google Scholar] [CrossRef]
- Kim, M.C.; Cho, S.H.; Lee, S.B.; Kim, Y.; Boo, J.H. Characterization of polymer-like thin films deposited on silicon and glass substrates using PECVD method. Thin Solid Films 2004, 447–448, 592–598. [Google Scholar] [CrossRef]
- Layman, K.A.; Bussell, M.E. Infrared Spectroscopic Investigation of Thiophene Adsorption on Silica-Supported Nickel Phosphide Catalysts. J. Phys. Chem. B 2004, 108, 15791–15802. [Google Scholar] [CrossRef]
- Sainz-Díaz, C.I.; Francisco-Márquez, M.; Vivier-Bunge, A. Molecular structure and spectroscopic properties of polyaromatic heterocycles by first principle calculations: Spectroscopic shifts with the adsorption of thiophene on phyllosilicate surface. Theor. Chem. Acc. 2009, 125, 83–95. [Google Scholar] [CrossRef]
- Luo, M.; Guo, C.C.; Li, Y.Z.; Zhang, J.C. Syntheses and crystal structure of copper (II) and cobalt (II) complexes containing N-heterocyclic compounds. J. Iran. Chem. Soc. 2017, 15, 415–420. [Google Scholar] [CrossRef]
- Nazeer, A.; Umar, Q.; Yang, Y.; Luo, M. Zn (II), Cu (II), Co (II), and Ni (II) complexes bearing aza-heterocyclic ligands: Synthesis, characterization, and anticancer activities. J. Iran. Chem. Soc. 2024, 21, 1599–1609. [Google Scholar] [CrossRef]
- Luo, M.; Li, H.M. One-pot synthesis and biological and catalytic applications of organometallic complexes involving oxazolines and (R)/(S)-a-phenylethylamine. J. Iran. Chem. Soc. 2019, 17, 963–971. [Google Scholar] [CrossRef]
- Maślewski, P.; Wyrzykowski, D.; Witwicki, M.; Dołęga, A. Histaminol and Its Complexes with Copper(II)—Studies in Solid State and Solution. Eur. J. Inorg. Chem. 2018, 2018, 1399–1408. [Google Scholar] [CrossRef]
- Muhammad, N.; Sadia, N.; Zhu, C.; Luo, C.; Guo, Z.; Wang, X. Biotin-tagged platinum(iv) complexes as targeted cytostatic agents against breast cancer cells. Chem. Commun. Camb. 2017, 53, 9971–9974. [Google Scholar] [CrossRef] [PubMed]
- Zhang, S.; Yuan, H.; Guo, Y.; Wang, K.; Wang, X.; Guo, Z. Towards rational design of RAD51-targeting prodrugs: Platinum(IV)-artesunate conjugates with enhanced cytotoxicity against BRCA-proficient ovarian and breast cancer cells. Chem. Commun. Camb 2018, 54, 11717–11720. [Google Scholar] [CrossRef] [PubMed]
- Guo, Y.; Zhang, S.; Yuan, H.; Song, D.; Jin, S.; Guo, Z.; Wang, X. A platinum(iv) prodrug to defeat breast cancer through disrupting vasculature and inhibiting metastasis. Dalton Trans. 2019, 48, 3571–3575. [Google Scholar] [CrossRef]
- Sheldrick, G.M. SHELXT—Integrated space-group and crystal-structure determination. Acta Crystallogr. A Found. Adv. 2015, 71, 3–8. [Google Scholar] [CrossRef] [PubMed]
- Sheldrick, G.M. Crystal structure refinement with SHELXL. Acta Crystallogr. C Struct. Chem. 2015, 71, 3–8. [Google Scholar] [CrossRef]
- Macrae, C.F.; Edgington, P.R.; McCabe, P.; Pidcock, E.; Shields, G.P.; Taylor, R.; Towler, M.; van de Streek, J. Mercury: Visualization and analysis of crystal structures. J. Appl. Crystallogr. 2006, 39, 453–457. [Google Scholar] [CrossRef]
- Dolomanov, O.V.; Bourhis, L.J.; Gildea, R.J.; Howard, J.A.K.; Puschmann, H. OLEX2: A complete structure solution, refinement and analysis program. J. Appl. Crystallogr. 2009, 42, 339–341. [Google Scholar] [CrossRef]


| complex 1 | |||
| Bond | Length/ | Bond | Length/ |
| Cu(1)-O1 | 1.9866(12) | Cu1-O1#i | 1.9866(12) |
| Cu1-N1 | 2.0039(15) | Cu1-N1#i | 2.0039(15) |
| Cu1-O3 | 2.4473(14) | Cu1-O3#i | 2.4473(14) |
| Bond | Angle/(°) | Bond | Angle/(°) |
| O1#i-Cu1-O1 | 180.00(8) | O1-Cu1-O3 | 86.40(49) |
| O1#i-Cu1-N1#i | 89.43(6) | N1-Cu1-O3 | 91.41(53) |
| O1-Cu1-N1#i | 90.57(6) | N1#i-Cu1-O3 | 88.59(53) |
| O1#i-Cu1-N1 | 90.57(6) | O1#i-Cu1-O3#i | 86.40(49) |
| O1-Cu1-N1 | 89.43(6) | O1-Cu1-O3#i | 93.60(49) |
| N1#i-Cu1-N1 | 180.0 | N1-Cu1-O3#i | 88.59(53) |
| O1#i-Cu1-O3 | 93.60(49) | N1#i-Cu1-O3#i | 91.41(53) |
| O3-Cu1-O3#i | 180.00(4) | ||
| complex 2 | |||
| Bond | Length/Å | Bond | Length/Å |
| Co1-O1 | 2.0744(9) | Co1-O1#i | 2.0744(9) |
| Co1-N1 | 2.1341(11) | Co1-N1#i | 2.1342(11) |
| Co1-O3 | 2.1419(9) | Co1-O3#i | 2.1420(9) |
| Bond | Angle/(°) | Bond | Angle/(°) |
| O1#i-Co1-O1 | 180.0 | O1-Co1-O3 | 89.13(4) |
| O1#i-Co1-N1 | 91.25(4) | N1-Co1-O3 | 90.40(4) |
| O1-Co1-N1 | 88.75(4) | N1#i-Co1-O3 | 89.60(4) |
| O1#i-Co1-N1#i | 88.75(4) | O1#i-Co1-O3#i | 89.13(4) |
| O1-Co1-N1#i | 91.25(4) | O1-Co1-O3#i | 90.87(4) |
| N1-Co1-N1#i | 180.0 | N1-Co1-O3#i | 89.60(4) |
| O1#i-Co1-O3 | 90.87(4) | N1#i-Co1-O3#i | 90.40(4) |
| O3-Co1-O3#i | 180.00(4) | ||
| complex 3 | |||
| Bond | Length/Å | Bond | Length/Å |
| Ni1-O3 | 2.043(2) | Ni2-O5 | 2.031(2) |
| Ni1-O3#i | 2.043(2) | Ni2-O11 | 2.051(3) |
| Ni1-O1 | 2.065(2) | Ni2-O10 | 2.059(3) |
| Ni1-O1#i | 2.065(2) | Ni2-O8 | 2.059(3) |
| Ni1-O4#i | 2.084(2) | Ni2-O7 | 2.075(3) |
| Ni1-O4 | 2.084(2) | Ni2-O9 | 2.078(3) |
| Bond | Angle/(°) | Bond | Angle/(°) |
| O3-Ni1-O3#i | 180.00(4) | O5-Ni2-O11 | 179.46(12) |
| O3-Ni1-O1 | 84.96(10) | O5-Ni2-O10 | 89.81(11) |
| O3#i-Ni1-O1 | 95.04(10) | O11-Ni2-O10 | 89.76(12) |
| O3-Ni1-O1#i | 95.04(10) | O5-Ni2-O8 | 91.86(12) |
| O3#i-Ni1-O1#i | 84.96(10) | O11-Ni2-O8 | 88.57(13) |
| O1-Ni1-O1#i | 180.0 | O10-Ni2-O8 | 178.13(12) |
| O3-Ni1-O4#i | 91.76(10) | O5-Ni2-O7 | 92.81(11) |
| O3#i-Ni1-O4#i | 88.24(10) | O11-Ni2-O7 | 87.53(14) |
| O1-Ni1-O4#i | 89.88(10) | O10-Ni2-O7 | 91.90(12) |
| O1#i-Ni1-O4#i | 90.12(10) | O8-Ni2-O7 | 88.87(14) |
| O3-Ni1-O4 | 88.24(10) | O5-Ni2-O9 | 88.78(11) |
| O3#i-Ni1-O4 | 91.76(10) | O11-Ni2-O9 | 90.89(14) |
| O1-Ni1-O4 | 90.12(10) | O10-Ni2-O9 | 89.05(11) |
| O1#i-Ni1-O4 | 89.88(10) | O8-Ni2-O9 | 90.14(14) |
| O4#i-Ni1-O4 | 180.0 | O7-Ni2-O9 | 178.16(12) |
| complex 4 | |||
| Bond | Length/Å | Bond | Length/Å |
| Co1-O3#i | 2.067(3) | Co2-O5 | 2.065(4) |
| Co1-O3 | 2.067(3) | Co2-O11 | 2.078(4) |
| Co1-O1#i | 2.116(3) | Co2-O9 | 2.103(4) |
| Co1-O1 | 2.116(3) | Co2-O10 | 2.103(4) |
| Co1-O4 | 2.124(4) | Co2-O8 | 2.111(4) |
| Co1-O4#i | 2.124(4) | Co2-O7 | 2.134(4) |
| Bond | Angle/(°) | Bond | Angle/(°) |
| O3#i-Co1-O3 | 180.0 | O5-Co2-O11 | 178.32(19) |
| O3#i-Co1-O1#i | 84.70(14) | O5-Co2-O9 | 90.97(15) |
| O3-Co1-O1#i | 95.30(14) | O11-Co2-O9 | 90.37(19) |
| O3#i-Co1-O1 | 95.30(14) | O5-Co2-O10 | 89.05(15) |
| O3-Co1-O1 | 84.70(14) | O11-Co2-O10 | 89.97(16) |
| O1#i-Co1-O1 | 180.0 | O9-Co2-O10 | 88.44(16) |
| O3#i-Co1-O4 | 91.94(14) | O5-Co2-O8 | 91.68(16) |
| O3-Co1-O4 | 88.07(14) | O11-Co2-O8 | 89.32(17) |
| O1#i-Co1-O4 | 88.15(14) | O9-Co2-O8 | 90.21(19) |
| O1-Co1-O4 | 91.85(14) | O10-Co2-O8 | 178.48(19) |
| O3#i-Co1-O4#i | 88.06(14) | O5-Co2-O7 | 90.81(16) |
| O3-Co1-O4#i | 91.93(14) | O11-Co2-O7 | 87.87(19) |
| O1#i-Co1-O4#i | 91.85(14) | O9-Co2-O7 | 177.90(16) |
| O1-Co1-O4#i | 88.15(14) | O10-Co2-O7 | 92.70(16) |
| O4-Co1-O4#i | 180.0 | O8-Co2-O7 | 88.63(18) |
| Complex | K562 | A549 | HepG2 | MDA-MB-231 | SW480 |
|---|---|---|---|---|---|
| Cell Inhibition (%) | |||||
| 1 | 5.34 2.06 | 6.01 2.57 | 6.04 0.28 | 25.48 2.09 | 17.61 2.60 |
| 2 | 12.48 1.45 | 6.71 0.98 | 6.54 0.82 | 13.06 3.05 | 26.24 2.40 |
| 3 | 49.96 0.31 | 21.91 1.56 | 8.57 2.67 | 43.98 1.02 | 24.32 3.49 |
| 4 | 62.05 1.15 | 36.93 2.04 | 46.38 1.86 | 39.78 2.86 | 66.83 1.05 |
| Complex | 1 | 2 | 3 | 4 |
|---|---|---|---|---|
| Empirical formula | C20H18Cl2CuN2O6S2 | C20H18Cl2CoN2O6S2 | C30H48Cl6Ni3O30S6 | C30H48Cl6Co3O30S6 |
| Formula mass | 580.92 | 576.31 | 1469.87 | 1470.53 |
| Temp (K) | 100(2) K | 100(2) | 100(2) | 200(2) |
| Wavelength (Å) | 1.34139 Å | 1.34139 | 1.34139 | 1.34139 |
| Crystal system | Monoclinic | Monoclinic | Triclinic | Triclinic |
| Space group | P21/c | P21/c | ||
| a (Å) | 6.8852(3) | 6.7286(4) | 7.5046(3) | 7.5626(8) |
| b (Å) | 8.7665(4) | 9.0683(5) | 11.0363(4) | 11.0377(12) |
| c (Å) | 19.5603(8) | 19.1980(11) | 16.0898(6) | 16.1607(17) |
| (°) | 90 | 90 | 88.6166(15) | 88.380(4) |
| β (°) | 97.221(2) | 94.914(2) | 86.0285(15) | 85.918(4) |
| (°) | 90 | 90 | 88.3027(14) | 88.693(4) |
| Volume (Å3) | 1171.28(9) | 1167.10(12) | 1328.50(9) | 1344.7(2) |
| Z | 2 | 2 | 1 | 1 |
| Dcalcd (Mg/m3) | 1.647 | 1.640 | 1.837 | 1.816 |
| μ (mm−1) | 7.770 | 6.779 | 9.590 | 8.820 |
| F (000) | 590 | 586 | 750 | 747 |
| θ range (°) | 3.964 to 72.649 | 4.021 to 72.547 | 2.395 to 52.088 | 2.385 to 52.095 |
| Total reflec. | 24271 | 27729 | 23001 | 21832 |
| Independent reflections | 3495 [R(int) = 0.0654] | 3496 [R(int) = 0.0444] | 4418 [R(int) = 0.0504] | 4487 [R(int) = 0.0690] |
| R1, wR2 [I > 2σ(I)] | 0.0395, 0.1058 | 0.0291, 0.0763 | 0.0433, 0.1023 | 0.0607, 0.1438 |
| R1, wR2 [all data] | 0.0441, 0.1084 | 0.0307, 0.0773 | 0.0469, 0.1048 | 0.0680, 0.1475 |
| Residuals (e.Å3) | 1.125, −0.877 | 0.874, −0.884 | 0.827, −0.525 | 0.822, −0.675 |
Disclaimer/Publisher’s Note: The statements, opinions and data contained in all publications are solely those of the individual author(s) and contributor(s) and not of MDPI and/or the editor(s). MDPI and/or the editor(s) disclaim responsibility for any injury to people or property resulting from any ideas, methods, instructions or products referred to in the content. |
© 2025 by the authors. Licensee MDPI, Basel, Switzerland. This article is an open access article distributed under the terms and conditions of the Creative Commons Attribution (CC BY) license (https://creativecommons.org/licenses/by/4.0/).
Share and Cite
Hu, B.; Kang, Q.; Meng, X.; Yin, H.; Yang, X.; Yang, Y.; Luo, M. Synthesis, Characterization, and Anticancer Activity of 3-Chlorothiophene-2-carboxylic Acid Transition Metal Complexes. Inorganics 2025, 13, 238. https://doi.org/10.3390/inorganics13070238
Hu B, Kang Q, Meng X, Yin H, Yang X, Yang Y, Luo M. Synthesis, Characterization, and Anticancer Activity of 3-Chlorothiophene-2-carboxylic Acid Transition Metal Complexes. Inorganics. 2025; 13(7):238. https://doi.org/10.3390/inorganics13070238
Chicago/Turabian StyleHu, Baiquan, Qianqian Kang, Xianggao Meng, Hao Yin, Xingzhi Yang, Yanting Yang, and Mei Luo. 2025. "Synthesis, Characterization, and Anticancer Activity of 3-Chlorothiophene-2-carboxylic Acid Transition Metal Complexes" Inorganics 13, no. 7: 238. https://doi.org/10.3390/inorganics13070238
APA StyleHu, B., Kang, Q., Meng, X., Yin, H., Yang, X., Yang, Y., & Luo, M. (2025). Synthesis, Characterization, and Anticancer Activity of 3-Chlorothiophene-2-carboxylic Acid Transition Metal Complexes. Inorganics, 13(7), 238. https://doi.org/10.3390/inorganics13070238