Article

In Vitro Antibacterial Activities and Calf Thymus DNA–Bovine Serum Albumin Interactions of Tridentate NNO Hydrazone Schiff Base–Metal Complexes

by
Maida Katherine Triviño-Rojas
1,
Santiago José Jiménez-Lopez
1,
Richard D’Vries
2,
Alberto Aragón-Muriel
3,* and
Dorian Polo-Cerón
1,*
1
Laboratorio de Investigación en Catálisis y Procesos (LICAP), Facultad de Ciencias Naturales y Exactas, Departamento de Química, Universidad del Valle, Cali 760001, Colombia
2
Grupo de Investigación en Química de Productos Naturales, Departamento de Química, Facultad de Ciencias Naturales, Exactas y de la Educación, Universidad del Cauca, Popayán 190003, Colombia
3
Grupo de Investigaciones Bioquímicas (GIB), Departamento de Química, Universidad del Magdalena, Santa Marta 470004, Colombia
*
Authors to whom correspondence should be addressed.
Inorganics 2025, 13(7), 213; https://doi.org/10.3390/inorganics13070213
Submission received: 26 February 2025 / Revised: 18 March 2025 / Accepted: 22 March 2025 / Published: 25 June 2025

Abstract

Their demonstrable bioactive characteristics, coupled with their wide structural diversity and coordination versatility, render Schiff bases and their coordination complexes biologically active compounds demonstrating outstanding properties. This research describes the synthesis and characterization of new Cu(II) and Ni(II) complexes with an NNO-donor hydrazone ligand (HL). The crystal structure of the HL ligand was determined through single-crystal X-ray diffraction studies. The in vitro antibacterial activities of the HL ligand and its metal(II) complexes against Gram-positive and Gram-negative bacteria demonstrated that the metal(II) complexes displayed greater antimicrobial activities compared to the free Schiff base ligand. Furthermore, the interaction of the ligand and the complexes with calf thymus DNA (CT-DNA) was explored through electronic absorption and viscosity measurements, suggesting intercalation as the most likely mode of binding. The compounds promoted oxidative DNA cleavage, as demonstrated by the strand breaks of the pmChery plasmid under oxidative stress conditions. Finally, fluorescence spectroscopy also revealed the strong binding affinity of these compounds for bovine serum albumin (BSA).

1. Introduction

One of the biggest issues facing modern public health is antibacterial resistance. The effectiveness of traditional antimicrobial treatments is currently under threat from this silent pandemic [1]. In the face of this crisis, the search for innovative alternatives to combat resistant pathogens has gained crucial relevance. In recent years, the use of metallopharmaceuticals has been explored as an alternative to the traditional chemotherapeutics used for the treatment of different diseases. One of the keys to the success of this type of compound depends on the properties of the organic ligands that coordinate with the metal centers. In this sense, Schiff base (SB) ligands have been of interest to researchers seeking new bioactive molecules, since their biological properties and different binding points make them good candidates as ligands for metal ions [2,3,4].
Hydrazones are organic compounds that belong to the family of Schiff bases (SBs) and are characterized by their general structure, R1R2C=NNR3R4. The chemical properties of their nitrogen (nucleophilic) and carbon (electrophilic–nucleophilic) atoms enable them to take part in a variety of reactions to produce molecules with a wide structural variety and multiple properties, such as antimicrobial activity [5,6] and uses as precursors in dyes, pigments, and catalysts [7]. SB derivatives have shown promise in medicine, potentially helping to treat conditions like mental disorders, cancer, and tuberculosis [8,9,10,11]. Different reports evidence that the formation of coordination compounds with bioactive hydrazones improves its biological activity. The incorporation of heteroatoms like N, O, and S and different functional groups into their structure can contribute to improving the chelating effect of the ligand, increasing their usefulness in chemical, biological, medicinal, and analytical applications [12].
Copper (Cu2⁺) and nickel (Ni2⁺) ions are essential metals that play fundamental roles in numerous physiological processes in living organisms. Copper is known for its role as a cofactor for several enzymes, including superoxide dismutase, which protects cells from oxidative damage, and cytochrome C oxidase, which is part of the mitochondrial respiratory chain and catalyzes the reduction of molecular oxygen to water [13]. The intrinsic properties of copper, combined with the selectivity of different Schiff bases, are promising for applications as antimicrobial agents [14]. Nickel, although less studied, has also been identified as a cofactor for enzymes such as Ni-superoxide dismutase, urease, methyl-coenzyme M reductase (MCR), and CO-dehydrogenase, which play a role in regulating cellular metabolism [15]. The biological properties of nickel and Schiff bases have prompted studies of chemotherapeutic applications, including antimicrobial activity [16,17].
Metal complexes can selectively interact with biological structures in specific and generally controlled ways. These interactions are essential for major biological activities, like enzymatic catalysis and electron transport, and may regulate the stability and activity of essential biomolecules. Metal ions that interact with DNA can affect its structure and, thus, affect genetic replication and gene expression [18]. Bovine serum albumin (BSA) is the most abundant protein in plasma and is considered a model of globular proteins. It is also one of the most studied because its structure is similar to human serum albumin (HSA), making it a biological target for studying the interaction of drugs and potential therapeutic agents [19]. Because coordination compounds may interact with DNA and biomolecules [20], it is essential to understand these interactions to design and develop new drugs for the treatment of various diseases, including cancers, autoimmune disorders, and microbial infections. In our interest in obtaining new compounds with antibacterial activities, the present work addresses the synthesis and comprehensive characterization of 2-((2-(6-bromopyridin-2-yl)hydrazono)methyl)phenol ligand and the copper(II) and nickel(II) complexes (Figure 1, HL). The antibacterial activity of the obtained compounds against Gram-positive and Gram-negative bacterial strains is evaluated, in addition to testing their interaction with DNA chains through different experiments.

2. Results and Discussion

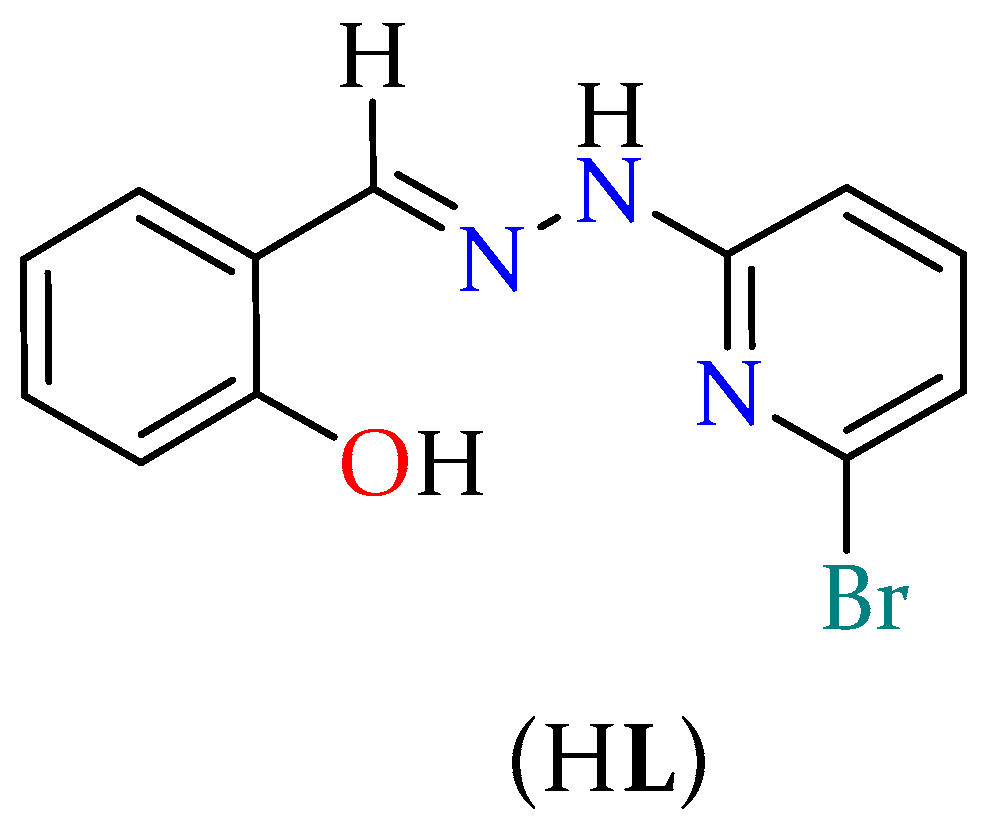
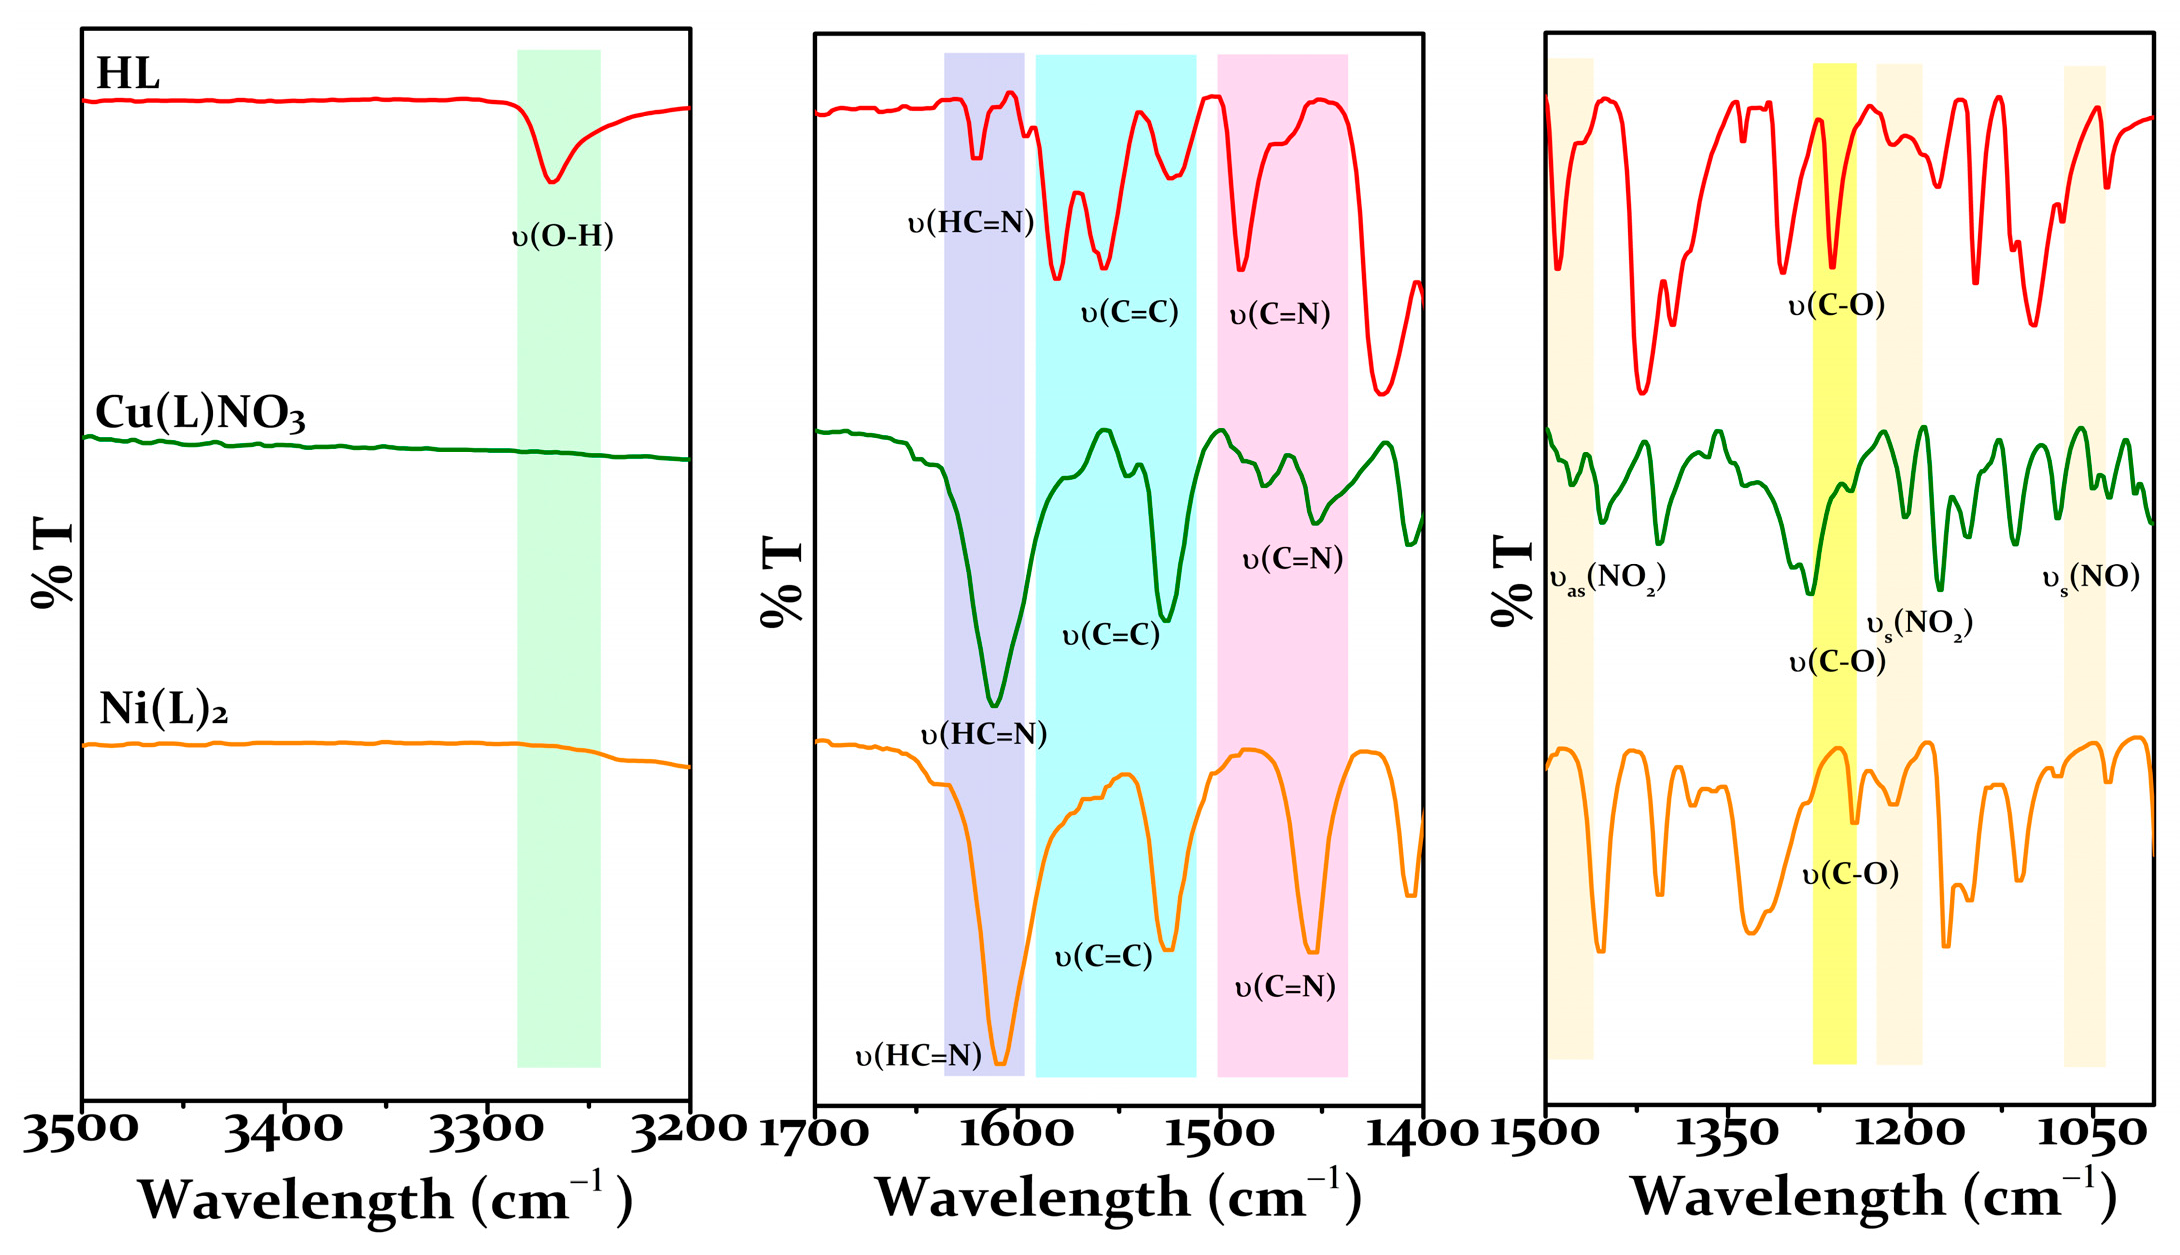
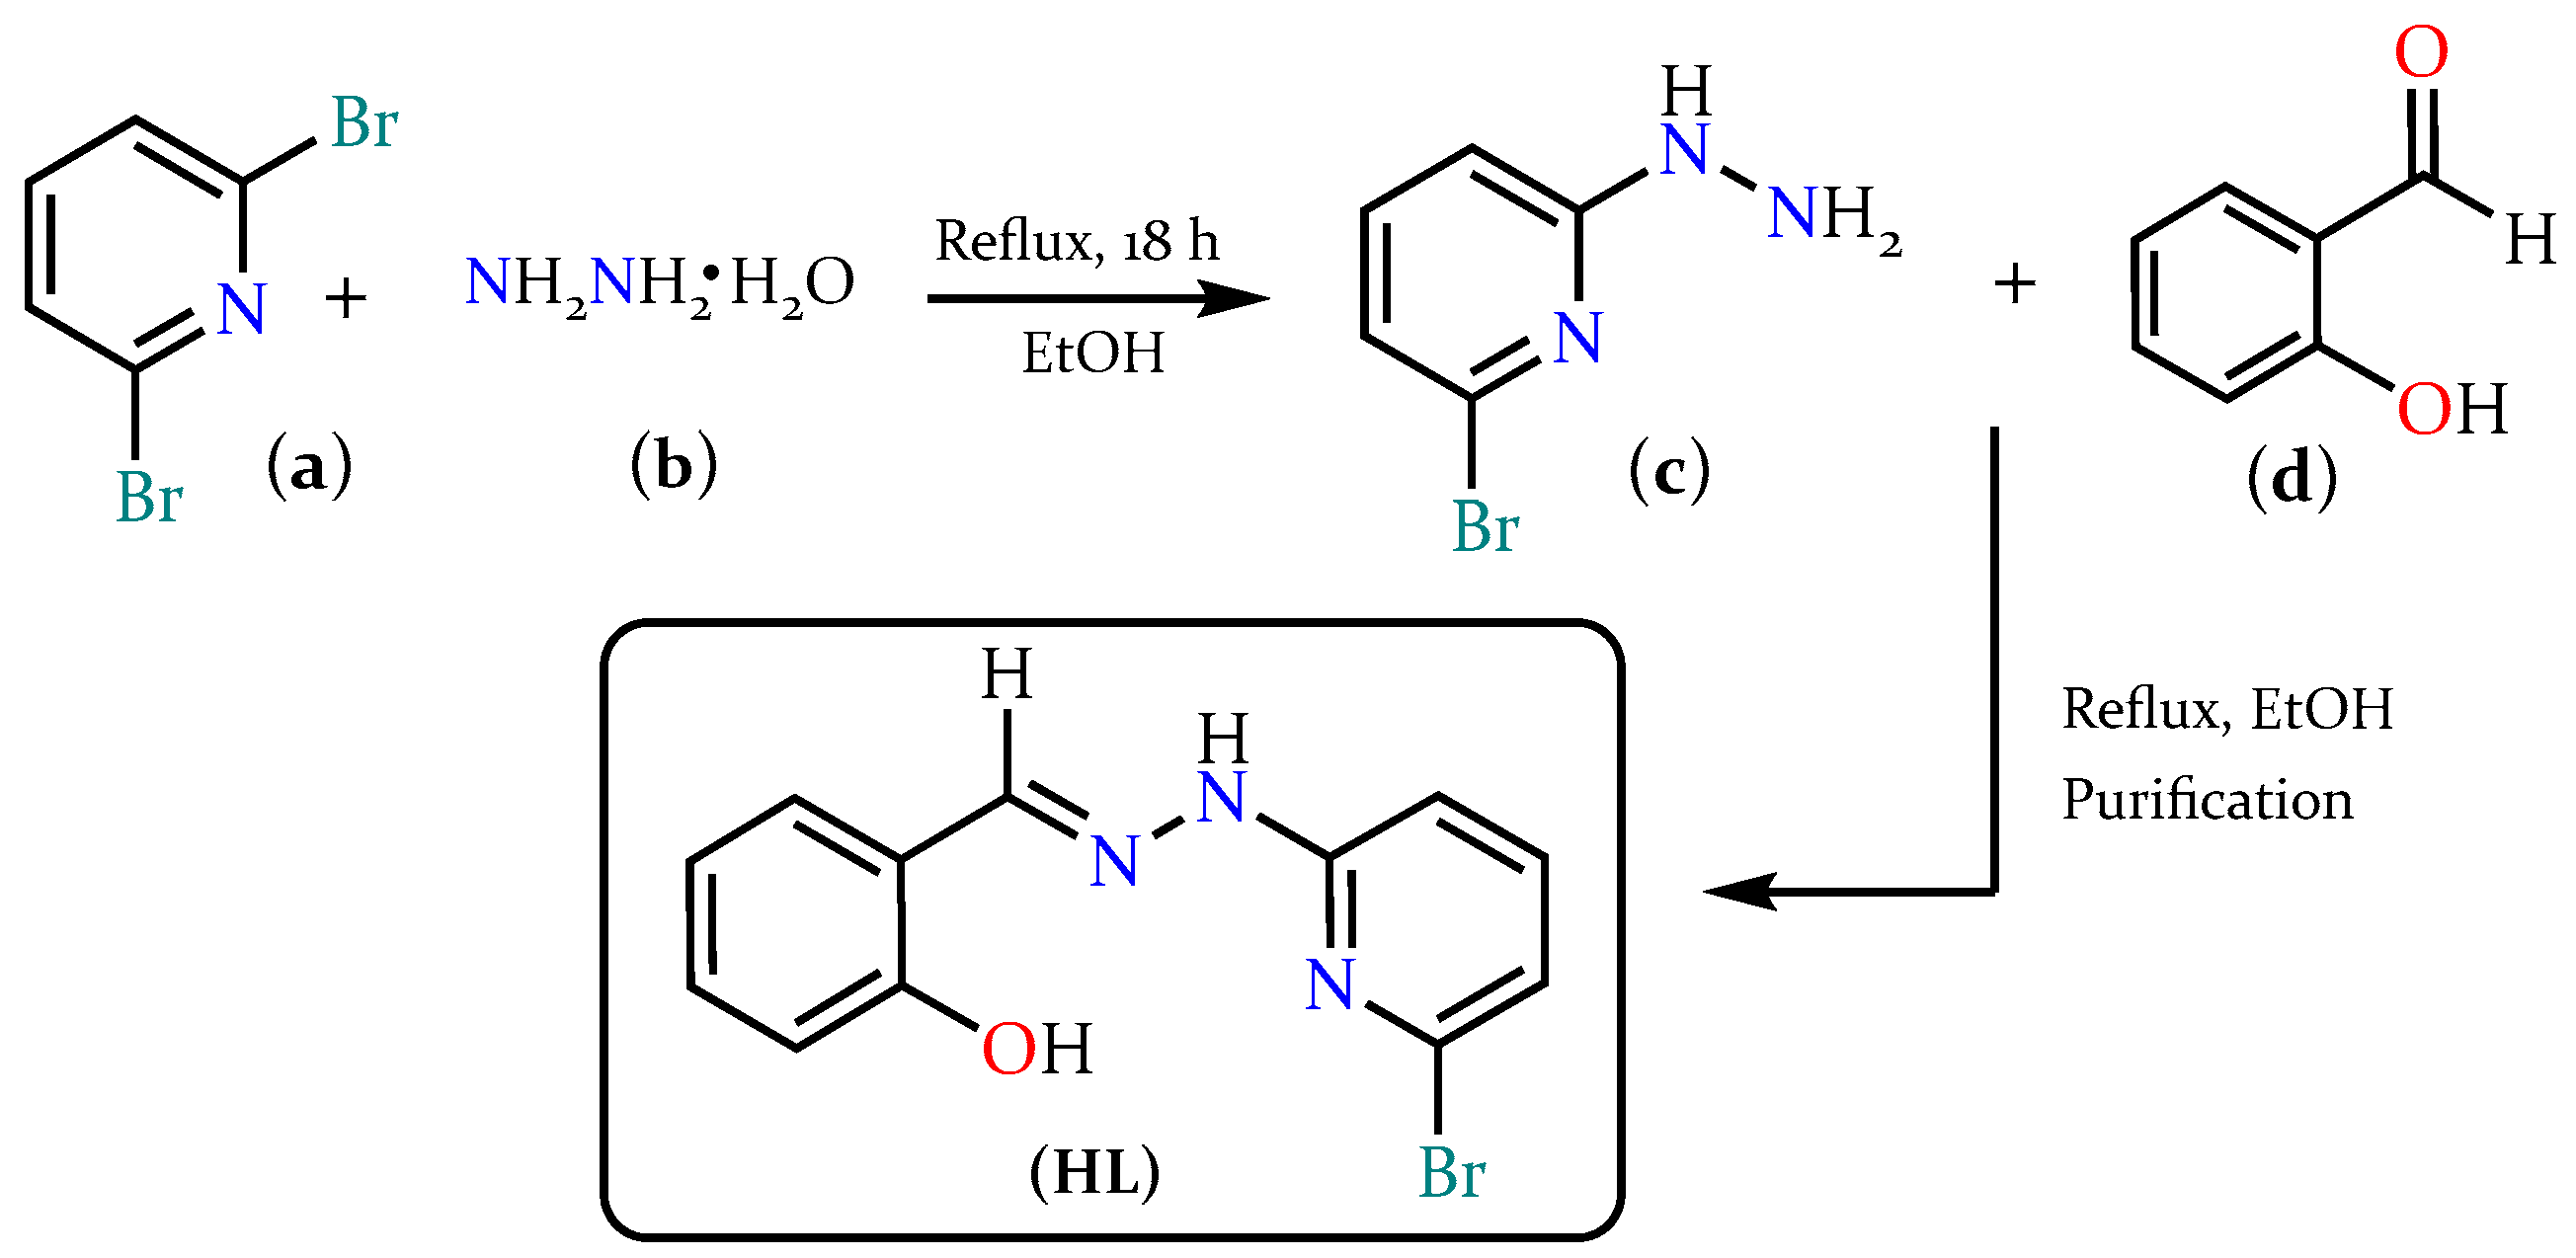
2.1. Synthesis and Characterization of HL

The Schiff base (HL) derived from the condensation reaction between 2-bromo-6-hydrazinylpyridine and benzaldehyde was prepared in a 1:1 molar ratio, based on previous studies [21]. The ligand was isolated as an air-stable pale beige solid that was soluble in DMSO, ethanol, methanol, and DMF but slightly soluble in water. In order to elucidate the molecular structure, the 1H-NMR spectrum of HL was recorded in DMSO-d6. The signals corresponding to the protons of the NH and OH groups are observed at 9 and 12 ppm, respectively. The azomethine (CH=N) proton appears as a singlet peak observed at δ = 8 ppm. In addition, in the range of 6–7 ppm, the expected signals appear as multiplet peaks corresponding to the aromatic protons of the organic structure. In the mass spectrum of HL, a peak at m/z = 291 is observed, indicative of the [M]+ ion. Another peak at m/z = 274 corresponds to [M-OH]+, and a peak at m/z = 197 represents [M-C6H5-OH]+. The solid was recrystallized in ethanol, obtaining a single crystal available for the single-crystal X-ray analysis. The (E)-2-((2-(6-bromopyridin-2-yl)hydrazono)methyl)phenol compound (HL) was crystallized in the orthorhombic space group Pbca (Figure 2, Table 1). The compound presents a conformation, E, with respect to the C=N bond. The molecule is almost planar, with torsion angles in C8–C7–C6–N3 and C4–C5–N2–N3 of 3.01(1) and 0.11(1)°, respectively. The O1–H1···N3 intramolecular interaction, with a distance of 2.644(4) Å, is observed. N2–H2···O1, with a distance of 3.080(4) Å, joins the molecules along the [010] direction (Figure 3a). The 3D supramolecular arrangement is given by π-π slipped-stacking interactions, with distances for N2···C12 and C4···C8 of 3.527(6) and 3.397(6) Å along the [100] and [001] directions (Figure 3b,c).

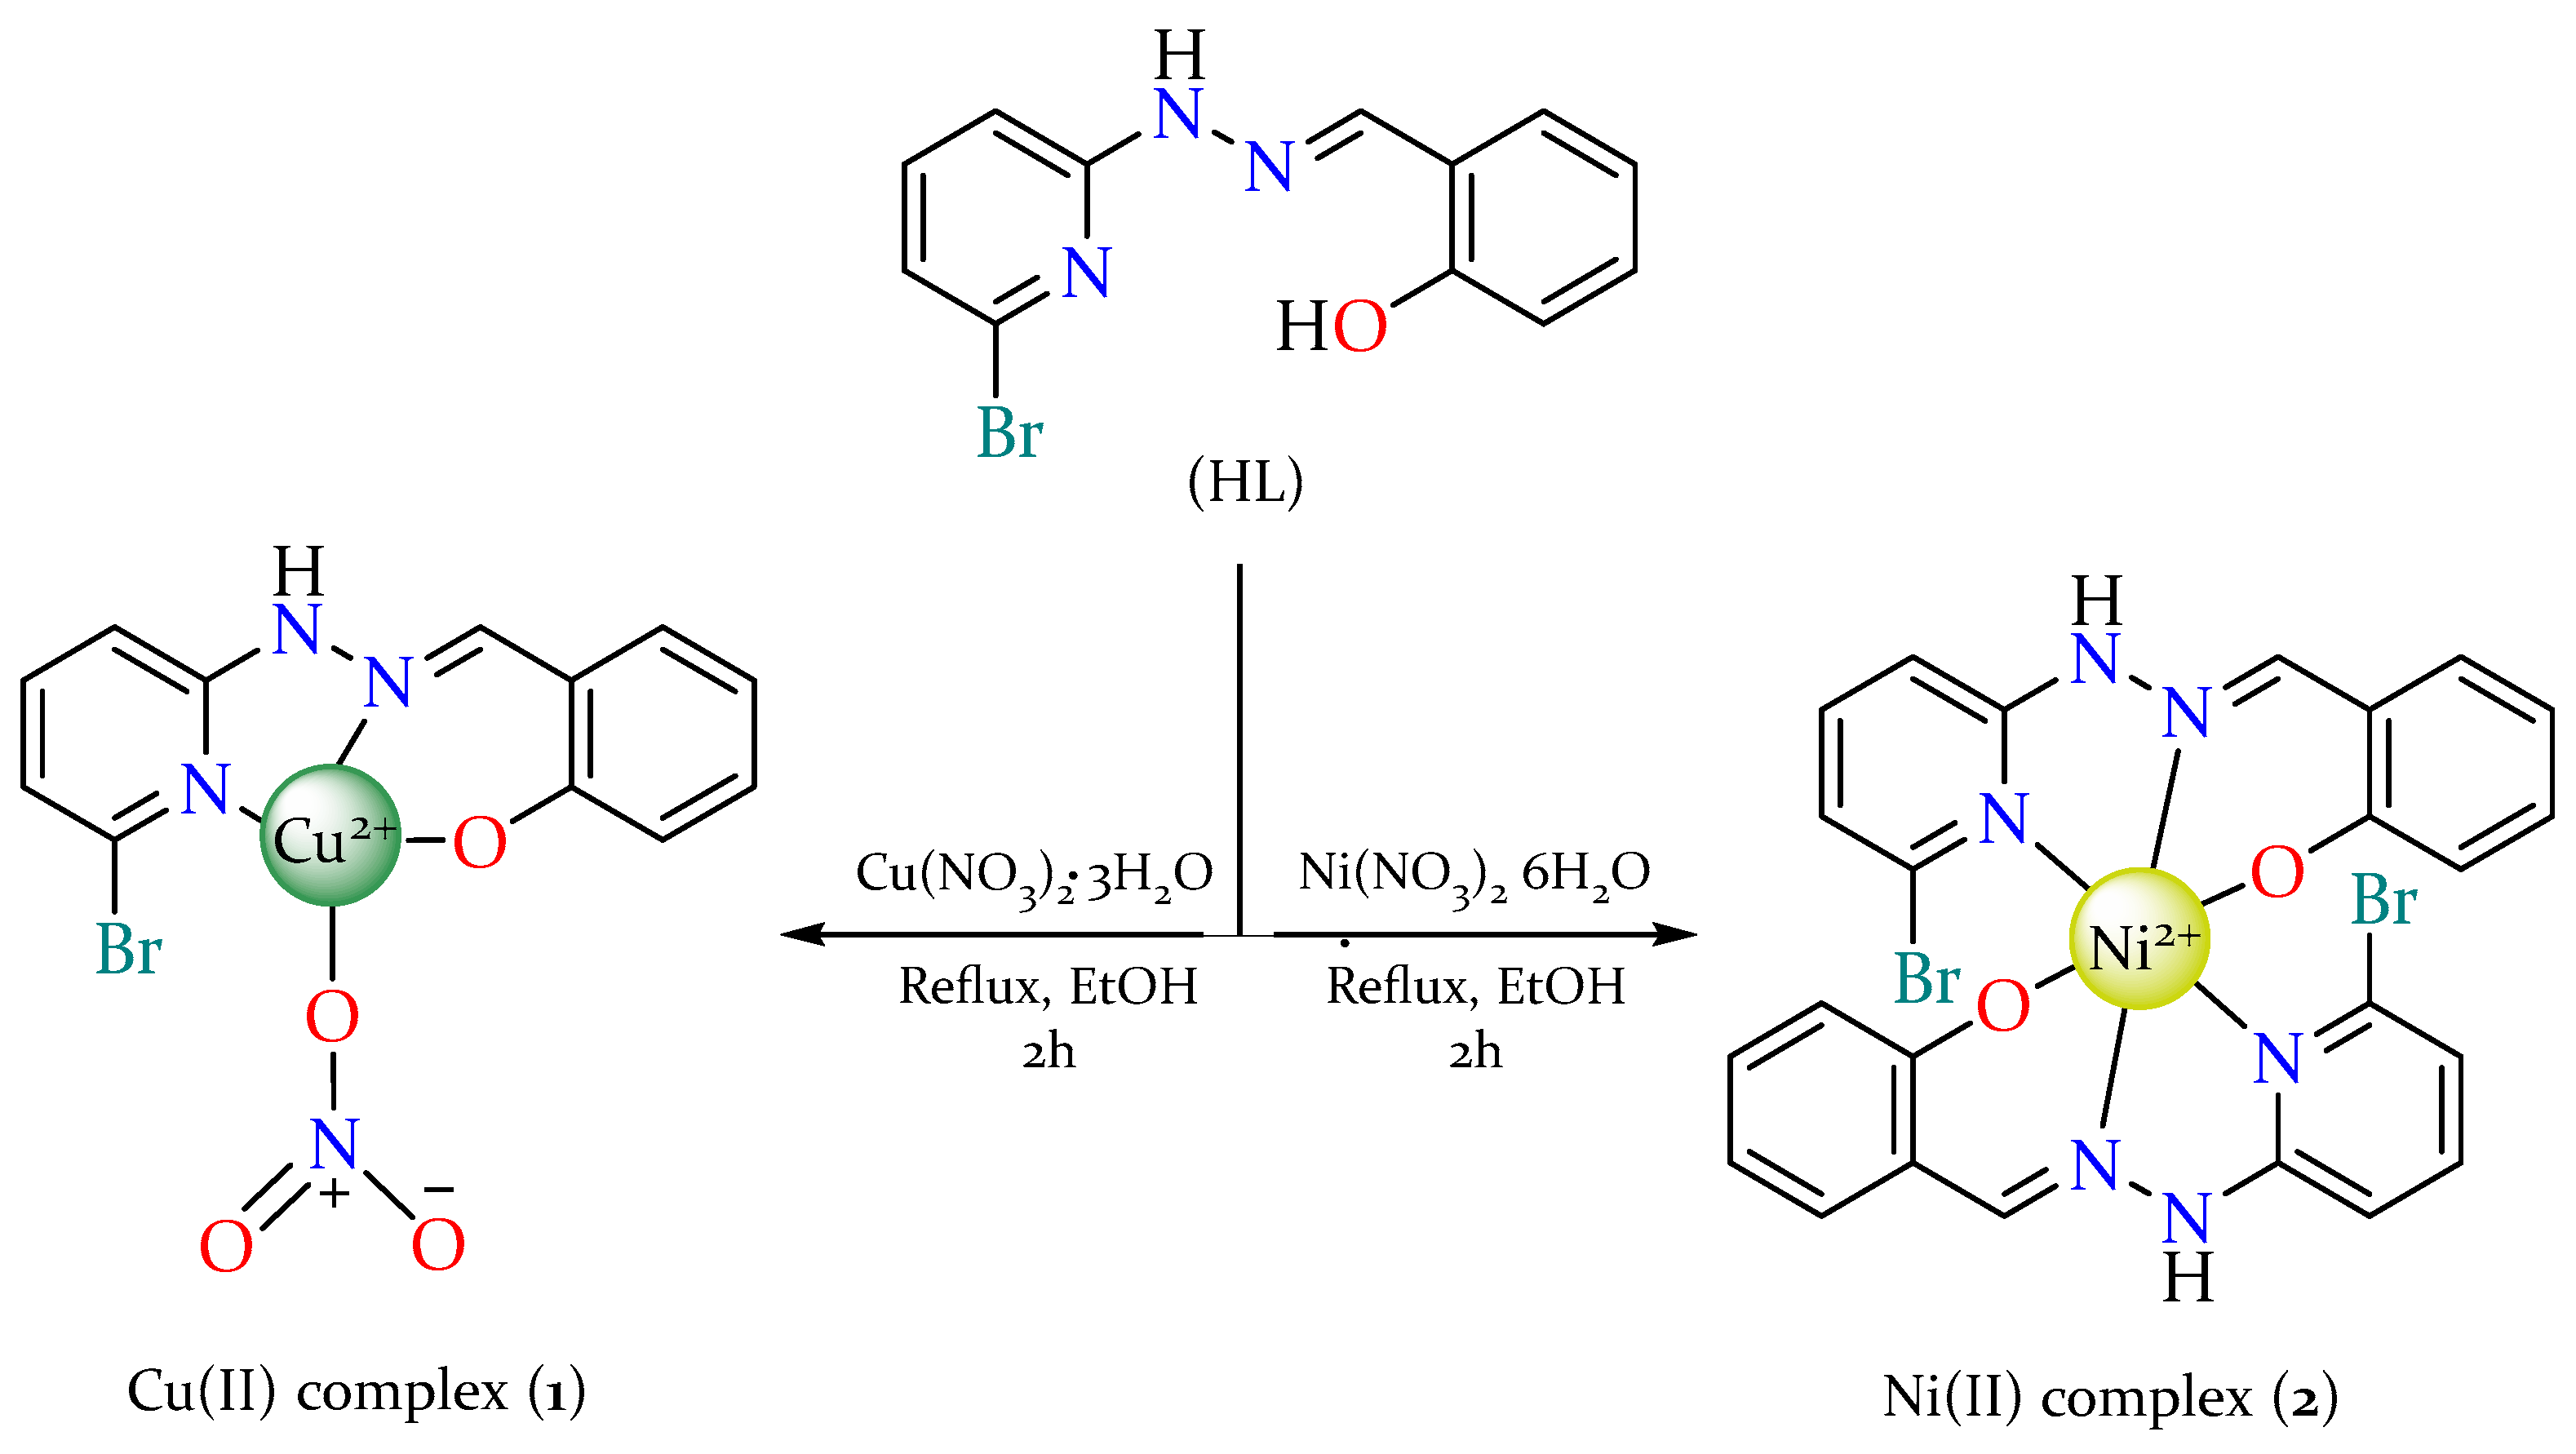
2.2. Synthesis and Characterization of Metal Complexes

The complexes 1 [Cu(L)(NO3)] and 2 [Ni(L)2] were isolated as stable crystalline solids. The elemental analysis showed a significant correlation with the suggested structures, and the molar conductivity values of the complexes in MeOH at 25 °C indicated that the synthesized compounds are non-ionic and non-electrolytic in nature (<76 Ω−1cm2mol−1) [22]. The method of continuous variations (Job’s method) was used to analyze the stoichiometry of the metal complexes. The results suggest a metal–ligand stoichiometry of 1:1 and 1:2 for complexes 1 and 2, respectively (Figure S1, Supplementary Material). Additionally, the amount of metal in compounds 1 and 2 was found by atomic absorption. A 5-point calibration curve was utilized to ascertain the concentration in ppm of Cu(II) and Ni(II), which were very close to the expected values for the proposed structures (Figure S2, Supplementary Material). No significant changes were observed in the absorption bands and stability constant values (K), indicating that the compounds are stable, even after 24 h. This indicates that the metal complexes exhibited stability in solution and that the observed biological activity is not influenced by the decomposition of the compounds. (Figures S3 and S4, Supplementary Material). Unfortunately, after several attempts, it was not possible to isolate any crystals of complexes 1 and 2 to be studied by X-ray diffraction.
The complexes’ formations were evaluated using FT-IR spectroscopy, comparing the spectra of complexes 1 and 2 with the free ligand HL (Figure 4). To identify coordination modes, characteristic peaks have been examined, whose variations in intensity and/or position are interpreted because of their participation in the chelation process. In the FT-IR spectra of complexes 1 and 2, the ν(O–H) band (3200 cm−1) is not observed, indicating the deprotonation of the phenol group and the coordination to the metal. This statement is further supported by the shift to lower wavenumbers of the phenolic stretching frequency ν(C–O) after the formation of the complex (from 1260 cm−1 to ~1245 cm−1). The ν(HC=N) and ν(C=N) vibration frequencies present a shift from 1620 cm−1 to 1610 cm−1 and from 1489 cm−1 to 1454 cm−1 due to the interaction of the nitrogen atom of the pyrimidine ring and azomethine nitrogen atom with the M(II) ions, respectively. Additionally, for complex 1, the bands related to the vibrational modes of the nitrate group are observed at 1434–1540 cm−14), 1306–1316 cm−11), and 1005–1023 cm−1) (ν2). The vibrations observed in compounds 1 and 2 are comparable to those of other coordination complexes described in the literature [23,24,25].
The analysis of absorption spectra allows for the identification of electronic transitions and the monitoring of metal complex formation, which confirms their synthesis through changes in the absorption bands. Electronic absorption spectra were obtained for HL and its complexes in the wavelength range of 200 to 800 nm (1 × 10⁻³ M in MeOH at 25 °C) (Figure 5). The HL Schiff base ligand’s absorption spectrum showed three strong bands at around 240, 311, and 340 nm. These bands could be caused by π-π* or n-π* transitions [26]. When the absorption spectra of the ligand HL and the M(II) complexes were compared, a hypochromic effect was seen in the absorption peaks and the appearance of new bands. There are broad bands at 413 nm for complex 1 and at 408 nm for complex 2. These bands are caused by the charge transfer between the metal ion and the organic ligand, while the band at 458 nm in the spectrum of complex 1 might be caused by charge transfers from the nitro group to the copper center [27,28,29]. These changes indicate the formation of complexes between the metal cations and the organic ligand HL.

2.3. Biological Studies

2.3.1. Antibacterial Activity

The in vitro antibacterial activity against Gram-positive bacteria (Staphylococcus aureus ATCC 29213, Listeria monocytogenes ATCC 19115, and Bacillus cereus ATCC 10876) and Gram-negative bacteria (Escherichia coli ATCC 25922, Salmonella typhimurium ATCC 14028, and Pseudomonas aeruginosa ATCC 27853) was tested in HL and complexes 1 and 2 by using the broth microdilution method. The minimum inhibitory concentrations (MIC) expressed in µg/mL were validated over three experiments and are listed in Table 2. The results obtained were compared with the reference antibiotics ciprofloxacin (Cp) and silver nitrate (AgNO3). Complexes 1 and 2 showed antibacterial activity; however, it was less than that of the reference drugs used. The MIC values obtained suggest that M(II) complexes have significant antibacterial behavior compared to the ligand HL, which could be rationalized in terms of changes in the polarity of the metal/ligand system. In the chelation process, the lipophilicity of the metal complex increases, and uncharged molecules could penetrate cell membranes, making their interaction through the bacterial cell wall more effective [30,31]. Interesting antibacterial activity was recorded for the Ni(II) complex in B. cereus and S. typhimurium strains, where it was found to be more active, with an MIC value of 62.5 µg/mL. The Ni(II) complex displayed higher antibacterial activity against all the strains evaluated. This can be accounted for on the basis of a lower polarity in its molecular architecture (NiL2), which facilitates its interaction with the lipophilic walls of cell membranes compared to the Cu(II) complex. Overall, broad-spectrum antibacterial action was observed in the complexes, although Gram-positive strains were more susceptible to the compounds. This suggests that the action of the compounds could be caused by their effect on cell membranes, which may lead to the inhibition of cellular functions or damage to the fundamental molecular structures of the cell [32].

2.3.2. DNA Interactions
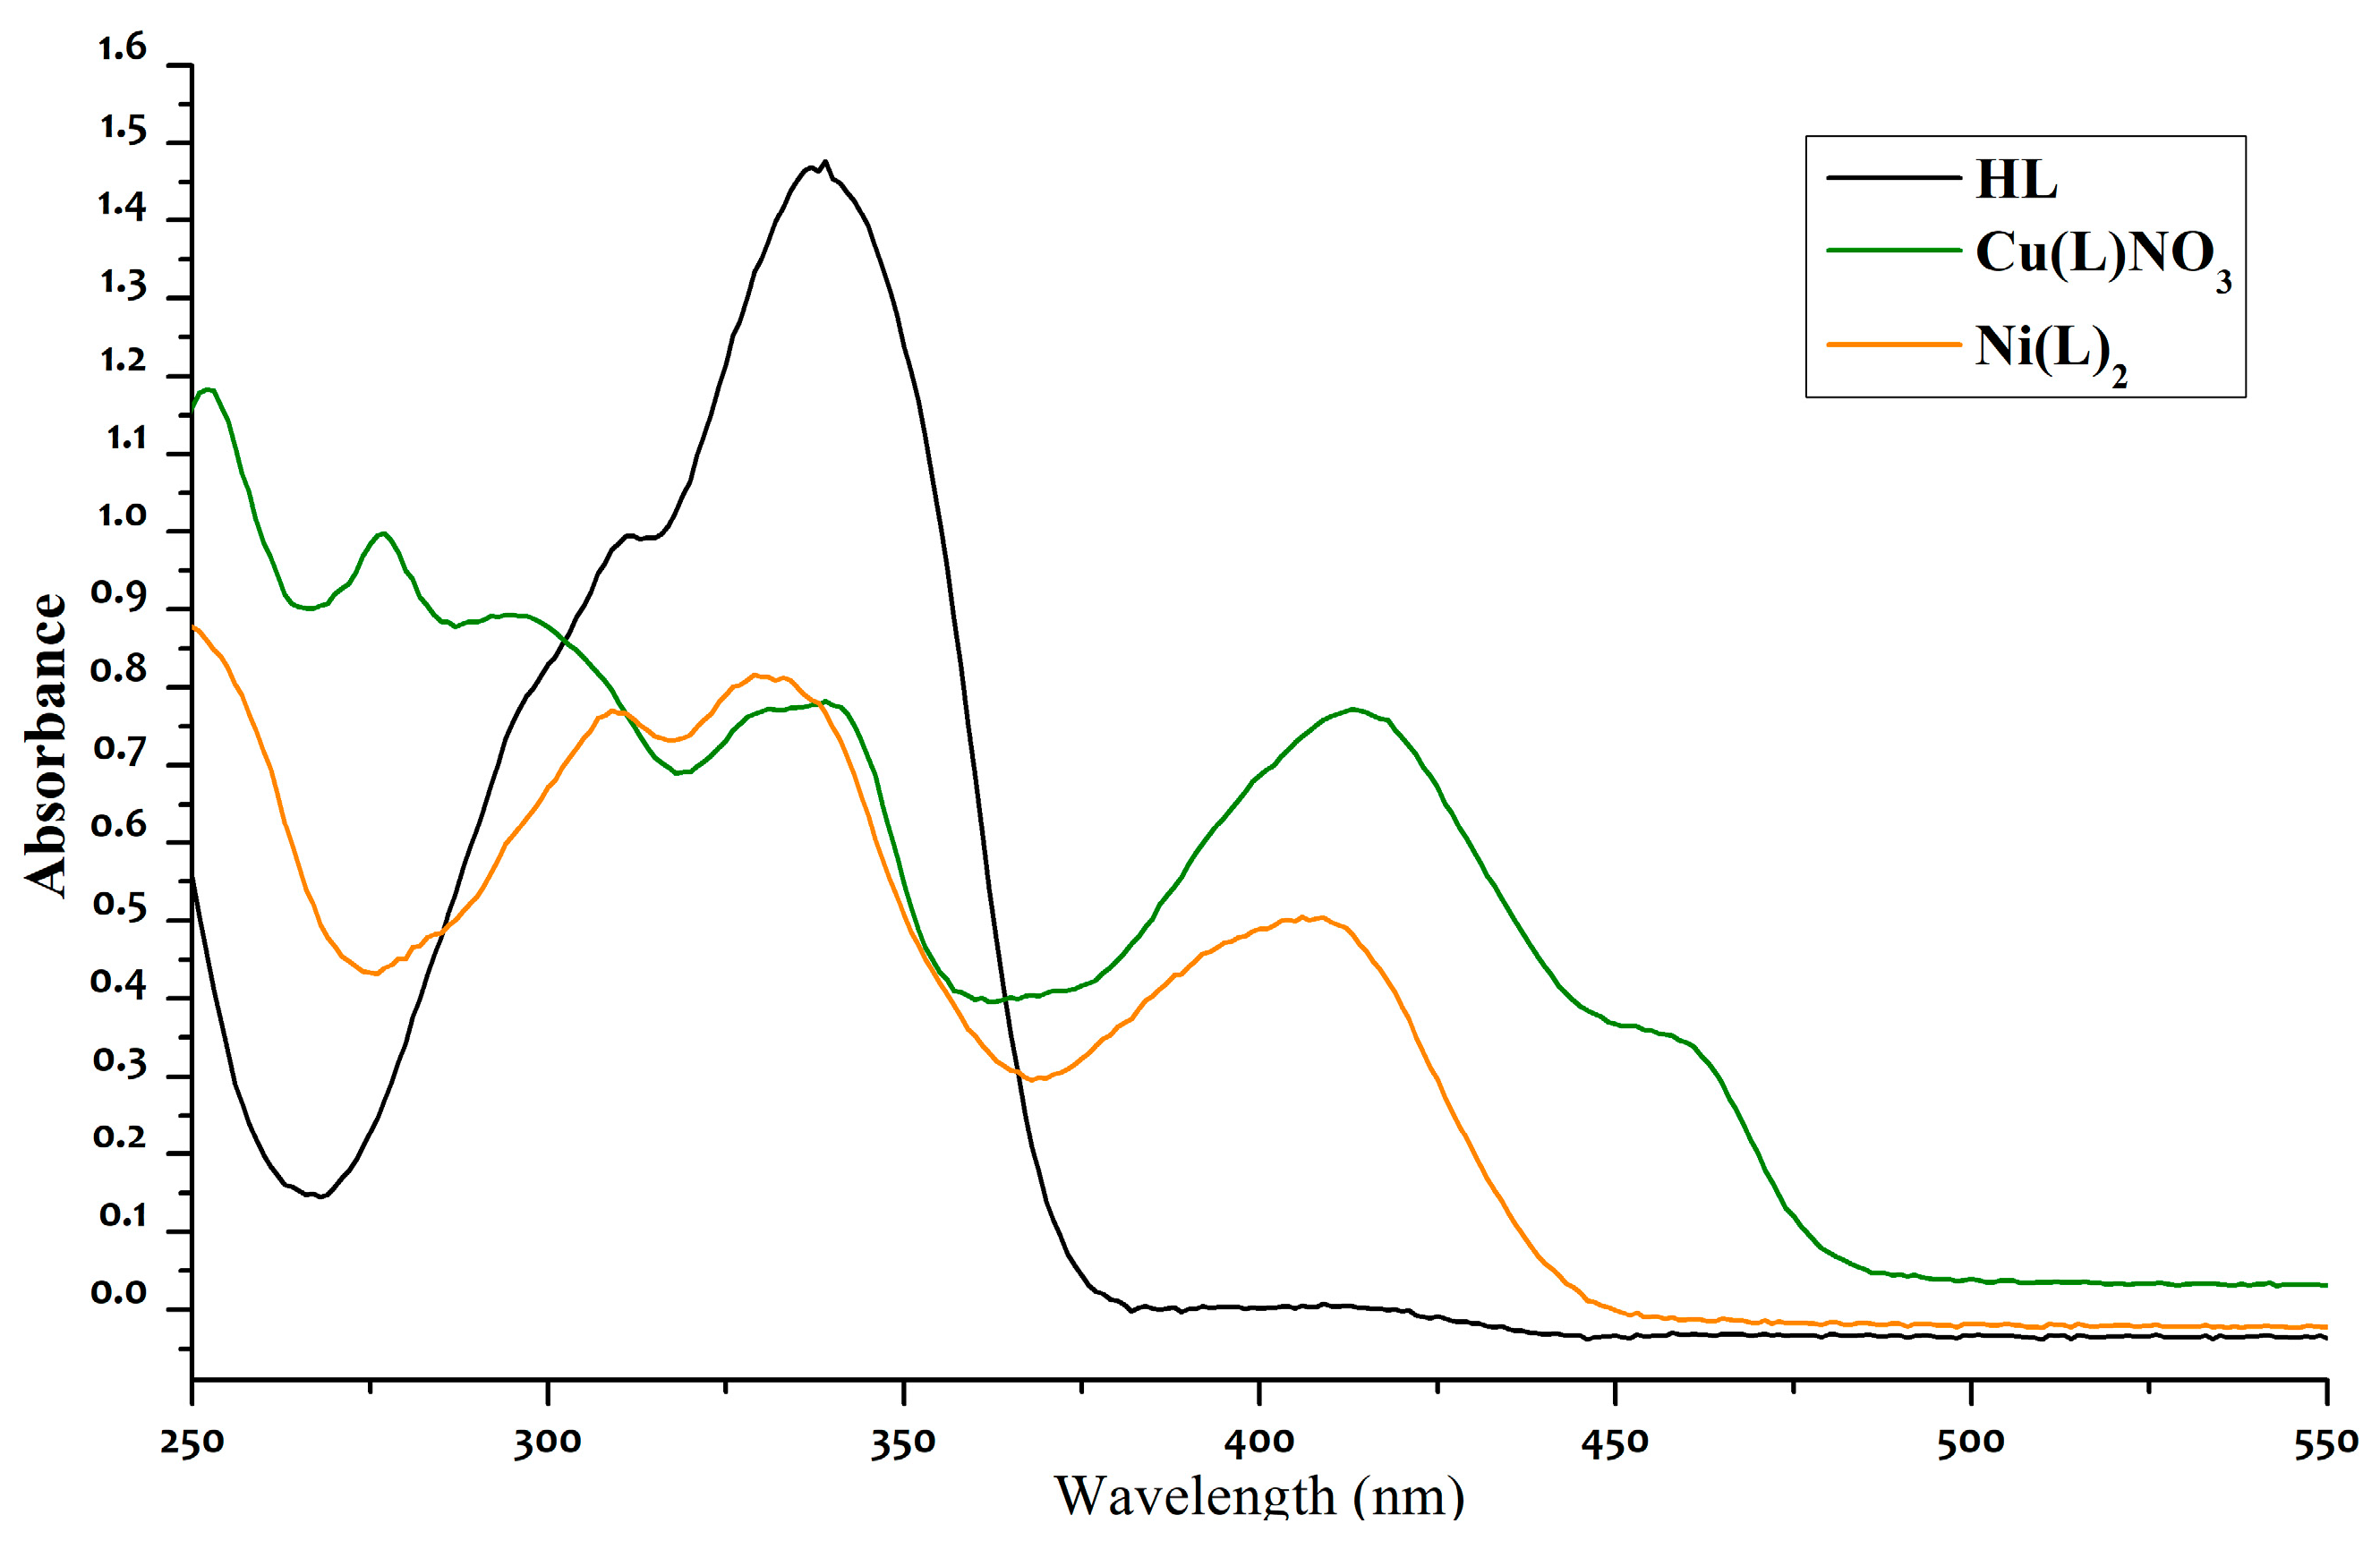
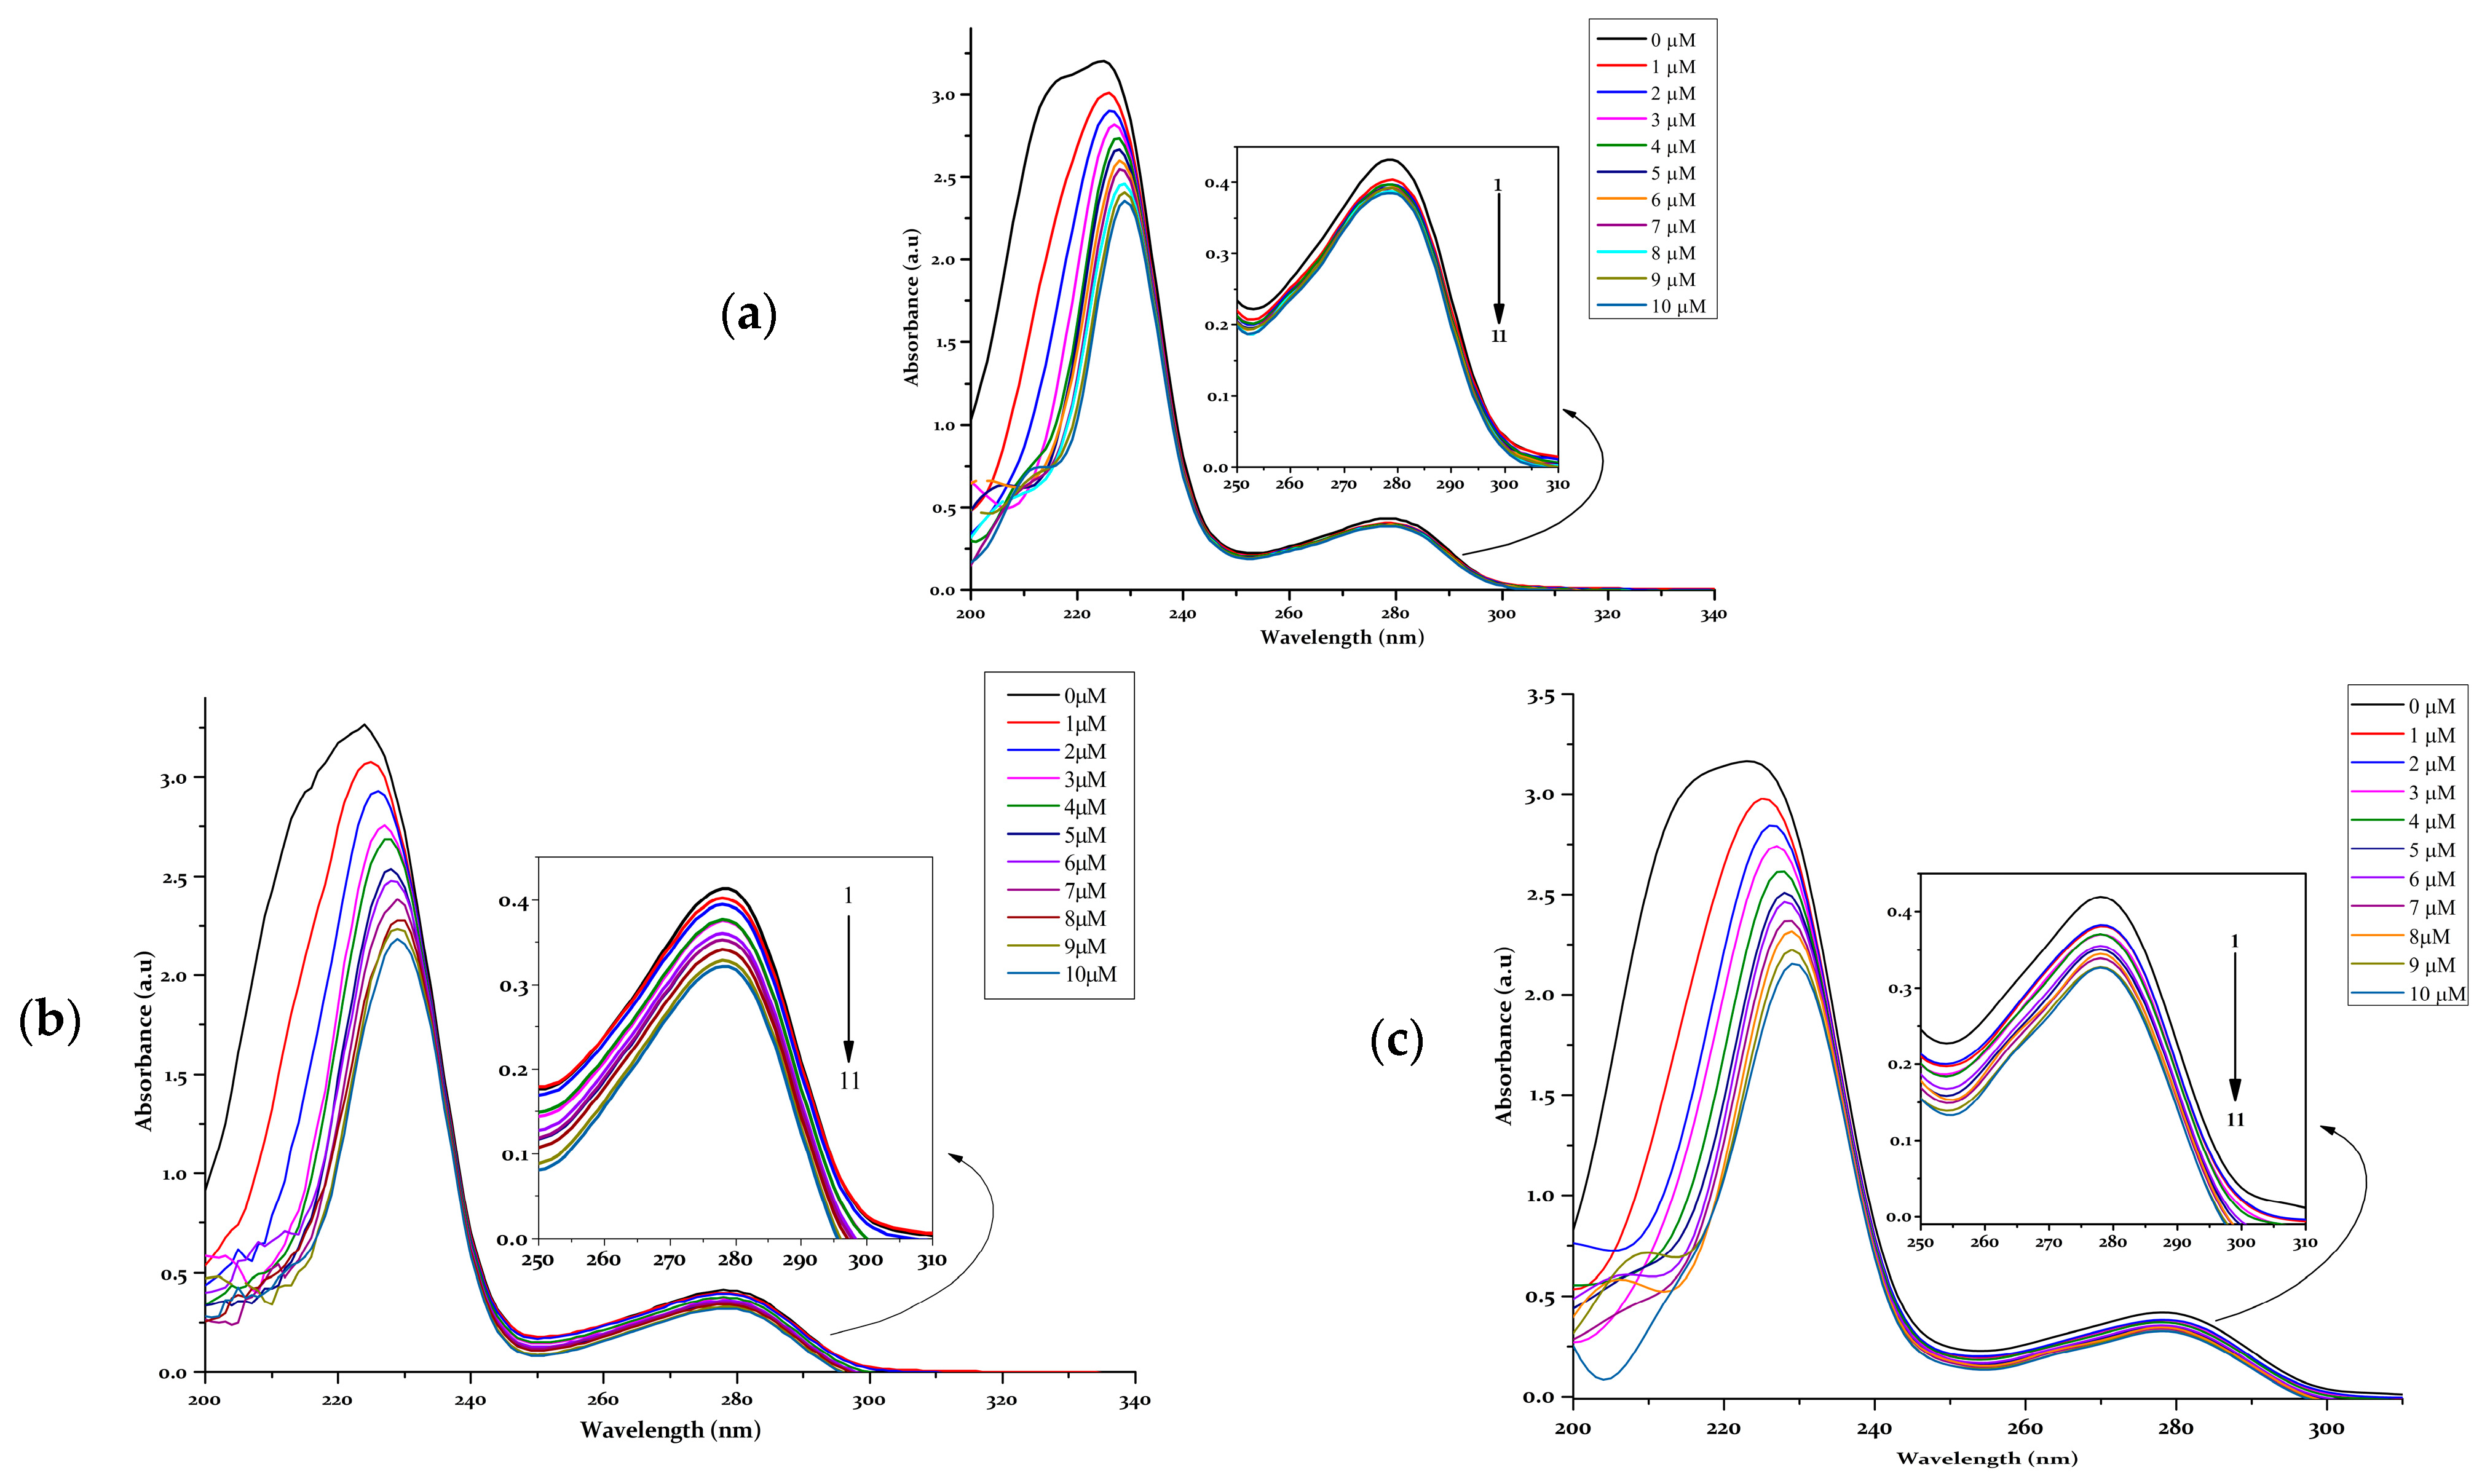
One of the mechanisms that drugs have to inhibit bacterial cell proliferation is their interaction and effect on microbial DNA strands. Therefore, different in vitro assays were carried out to assess the interaction mechanisms between the synthesized compounds and the DNA biopolymer.
  • UV-vis studies
Monitoring the electronic absorption spectrum in a DNA titration is one of the methods used to preliminarily evaluate the possible binding modes of compounds with the DNA macromolecule [33]. The conformational modifications of DNA that result from the interaction of such compounds cause alterations in the electronic spectra, such as hypochromic, hyperchromic, hypsochromic (blue-shift), or bathochromic (red-shift) changes [34]. The electronic spectra of M(II) complexes, recorded with the increasing CT-DNA concentration, are given in Figure 6. The absorption spectra of coordination complexes 1 and 2 exhibit a reduction in absorbance, indicating hypochromism. This phenomenon occurs upon the formation of a molecule-DNA complex through intercalation, resulting in a more stable species stabilized by the π-π stacking between the base pairs and the aromatic systems of the intercalating molecule, leading to a decrease in molar absorptivity [35]. The red shift (bathochromism) of the band (413 nm), a characteristic of compound 1, also suggests an intercalation binding mode that changes the electronic environment and stabilizes the DNA molecule [36]. From the above, it can be inferred that the complexes form adducts with DNA in an intercalative form.
In order to quantitatively compare the binding affinity of the compounds with DNA, the intrinsic binding constants (Kb) were determined employing the Wolfe–Shimer equation (Equation (1)). The calculated binding constants were 3.43 × 10³ M−1, 1.49 × 10⁷ M−1, and 6.96 × 10⁴ M−1 for HL, complex 1, and complex 2, respectively. The Kb values obtained for metal complexes 1 and 2 were slightly higher than those of classical intercalation metal complexes, such as cisplatin analogues (6.05 × 10⁴ M−1 to 3.48 × 10⁵ M−1) [37].
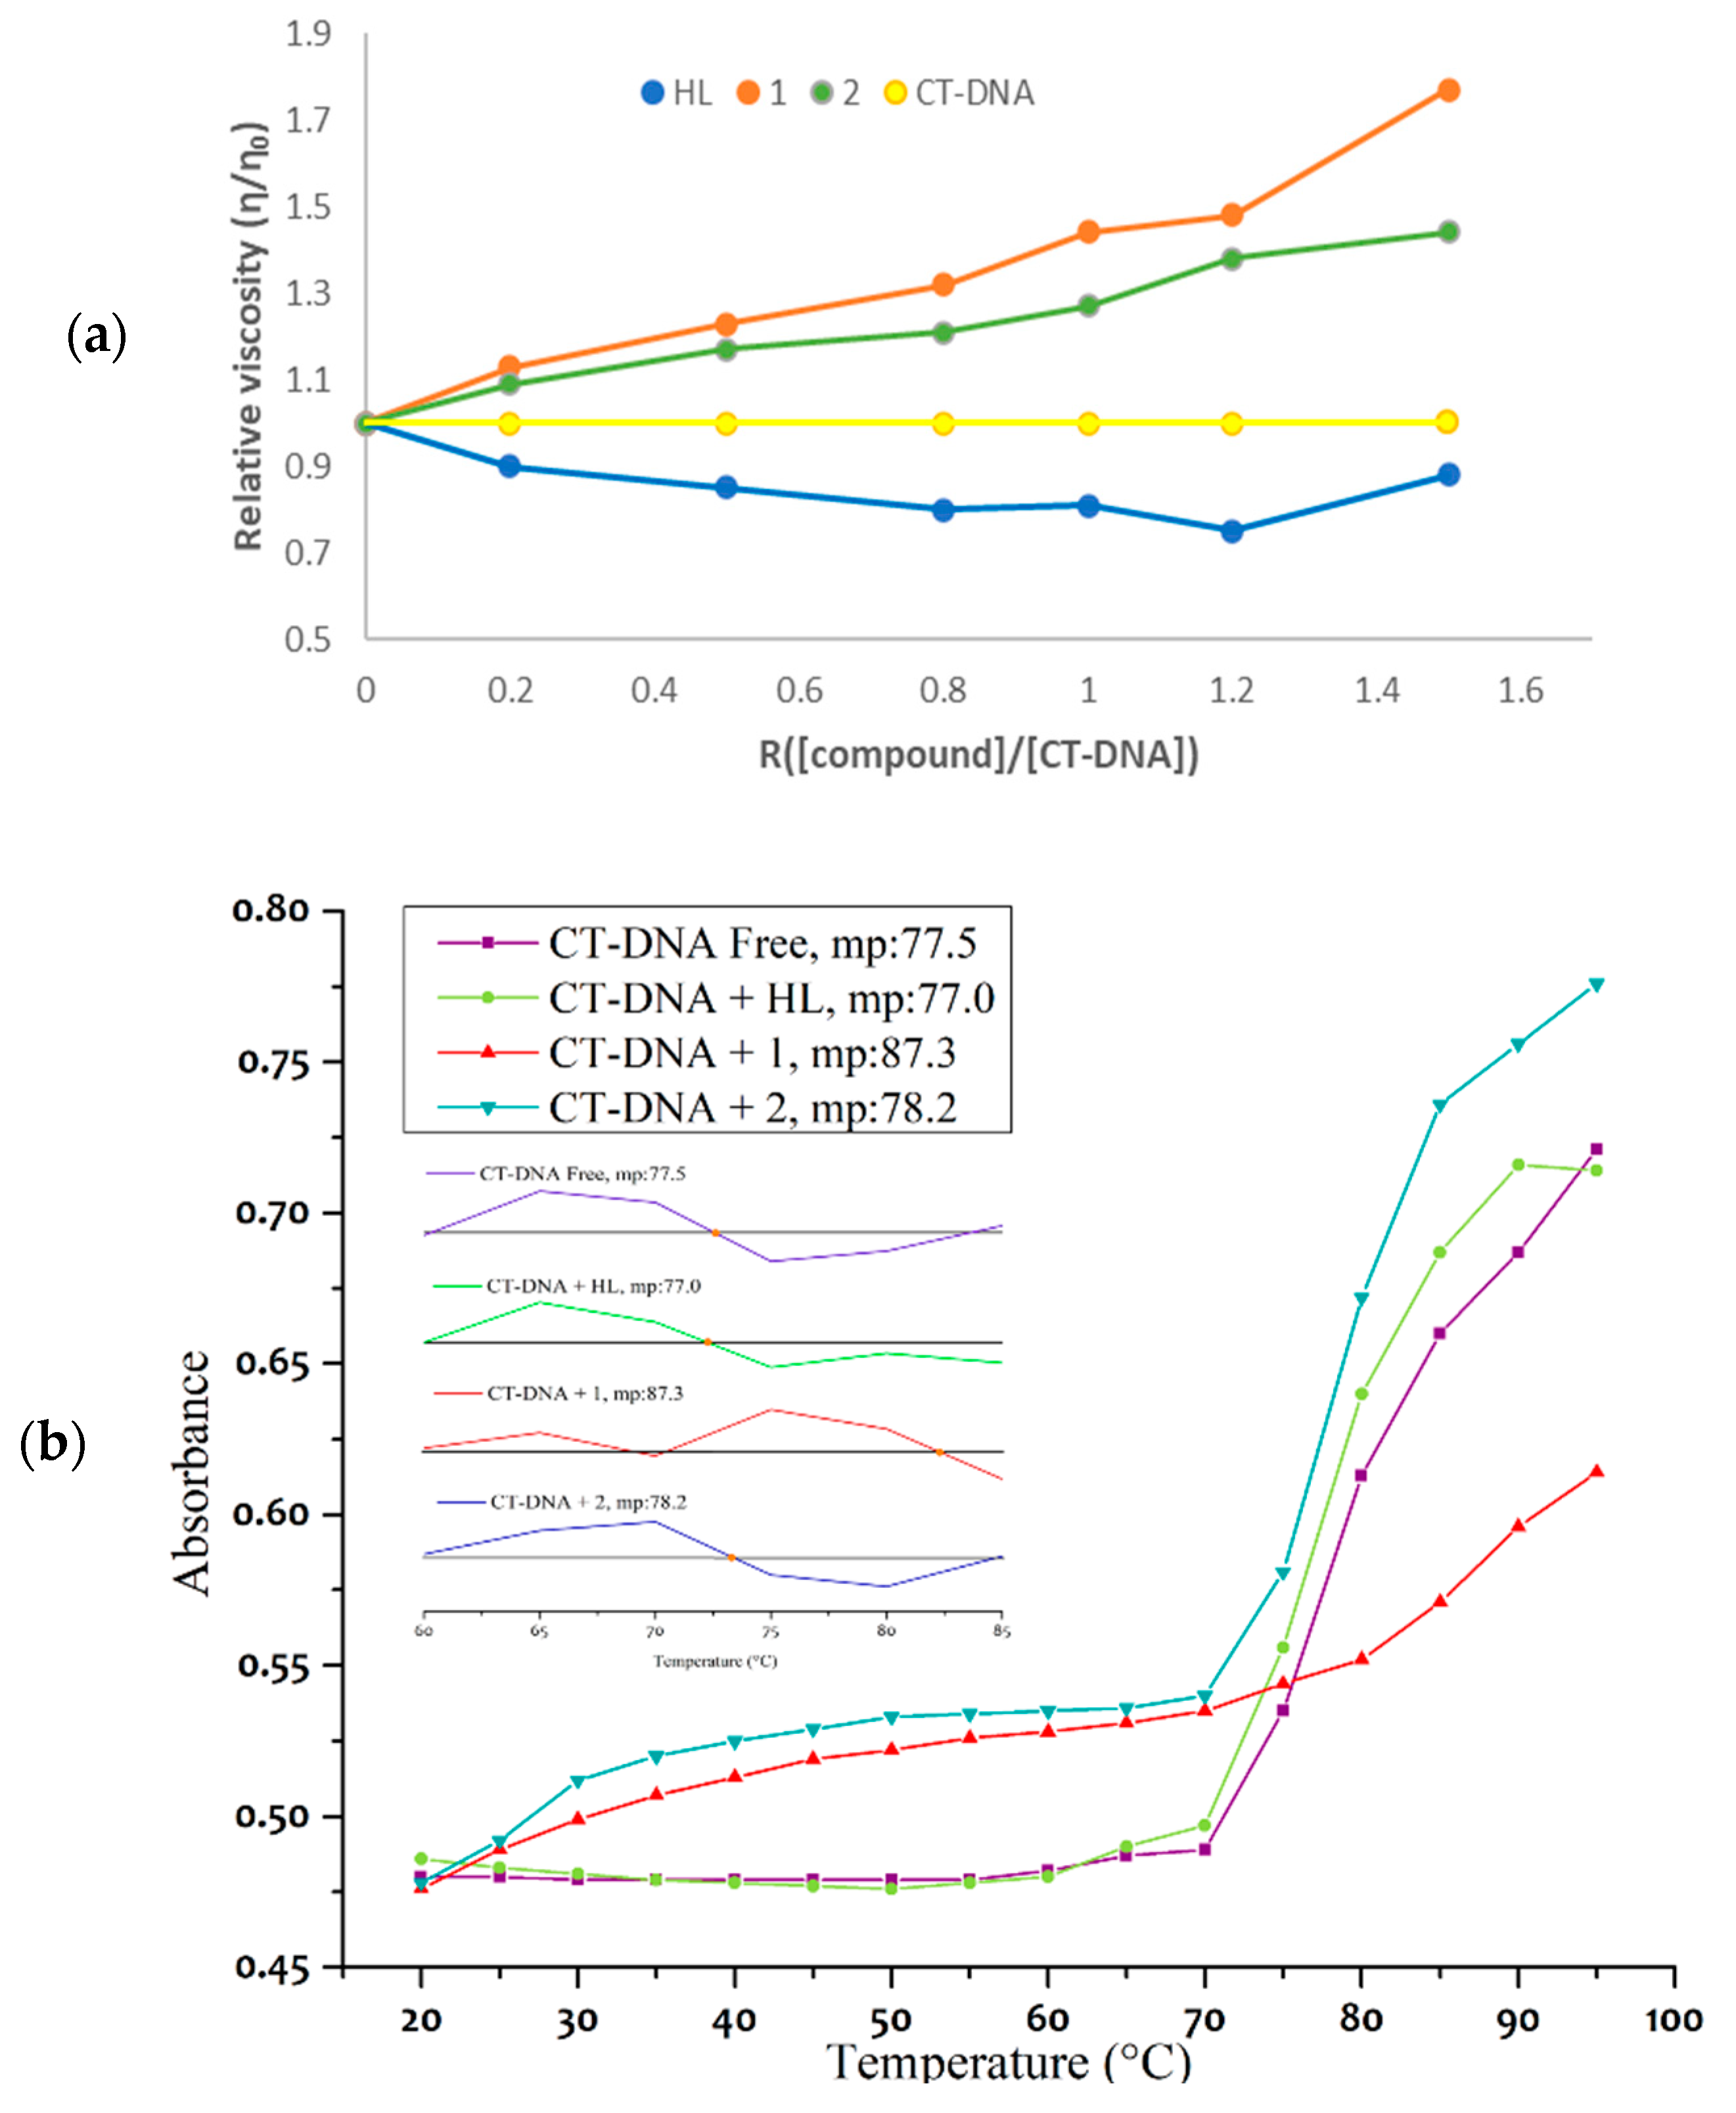
  • Viscosity measurements and DNA melting
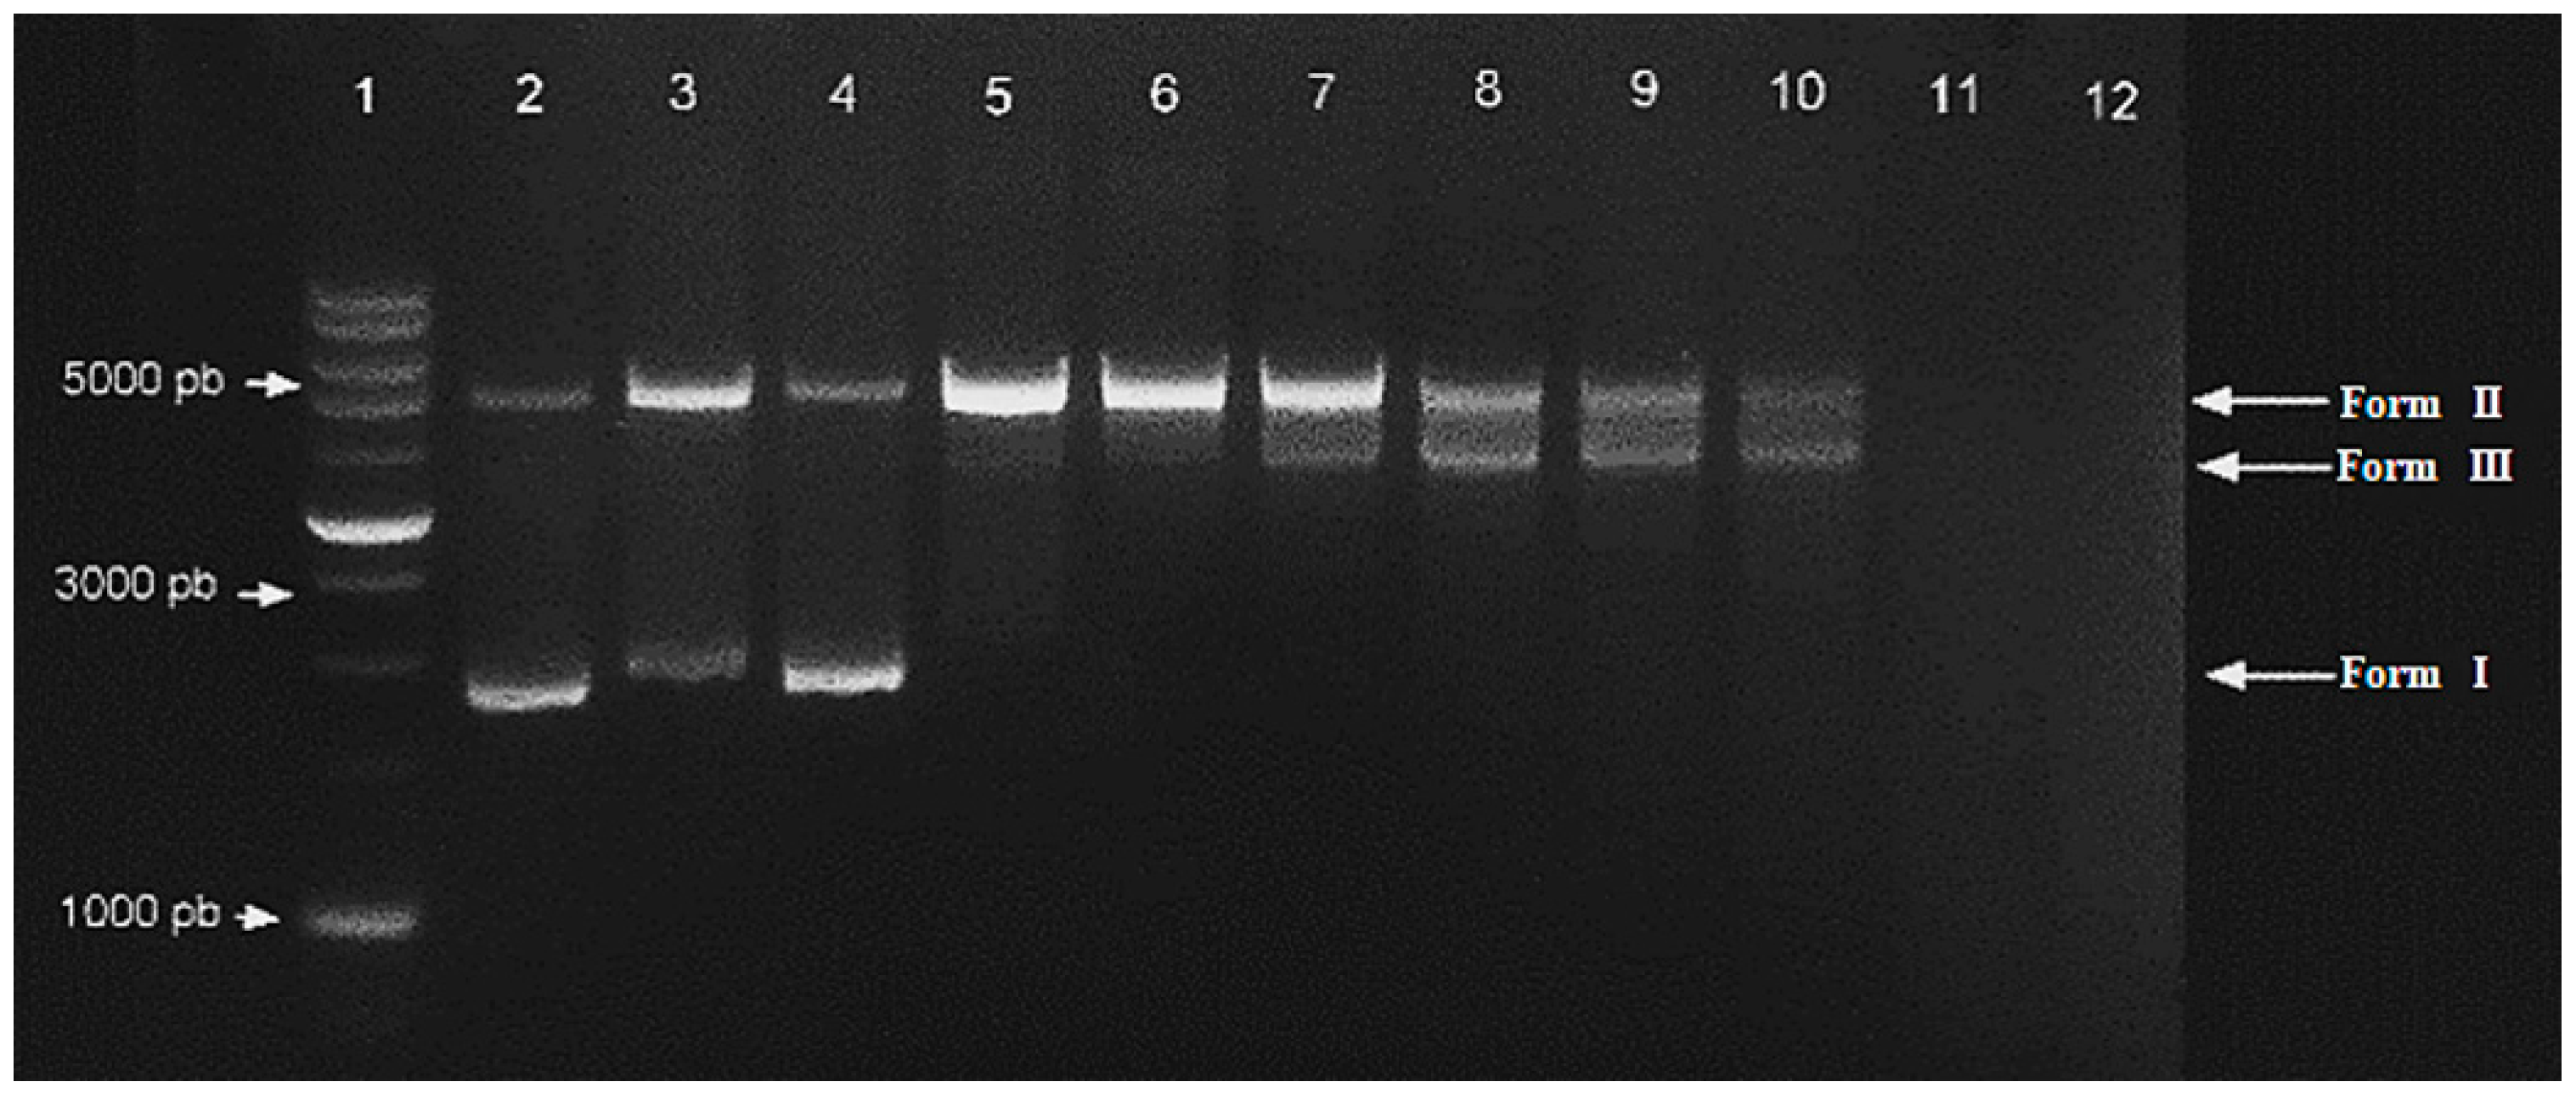
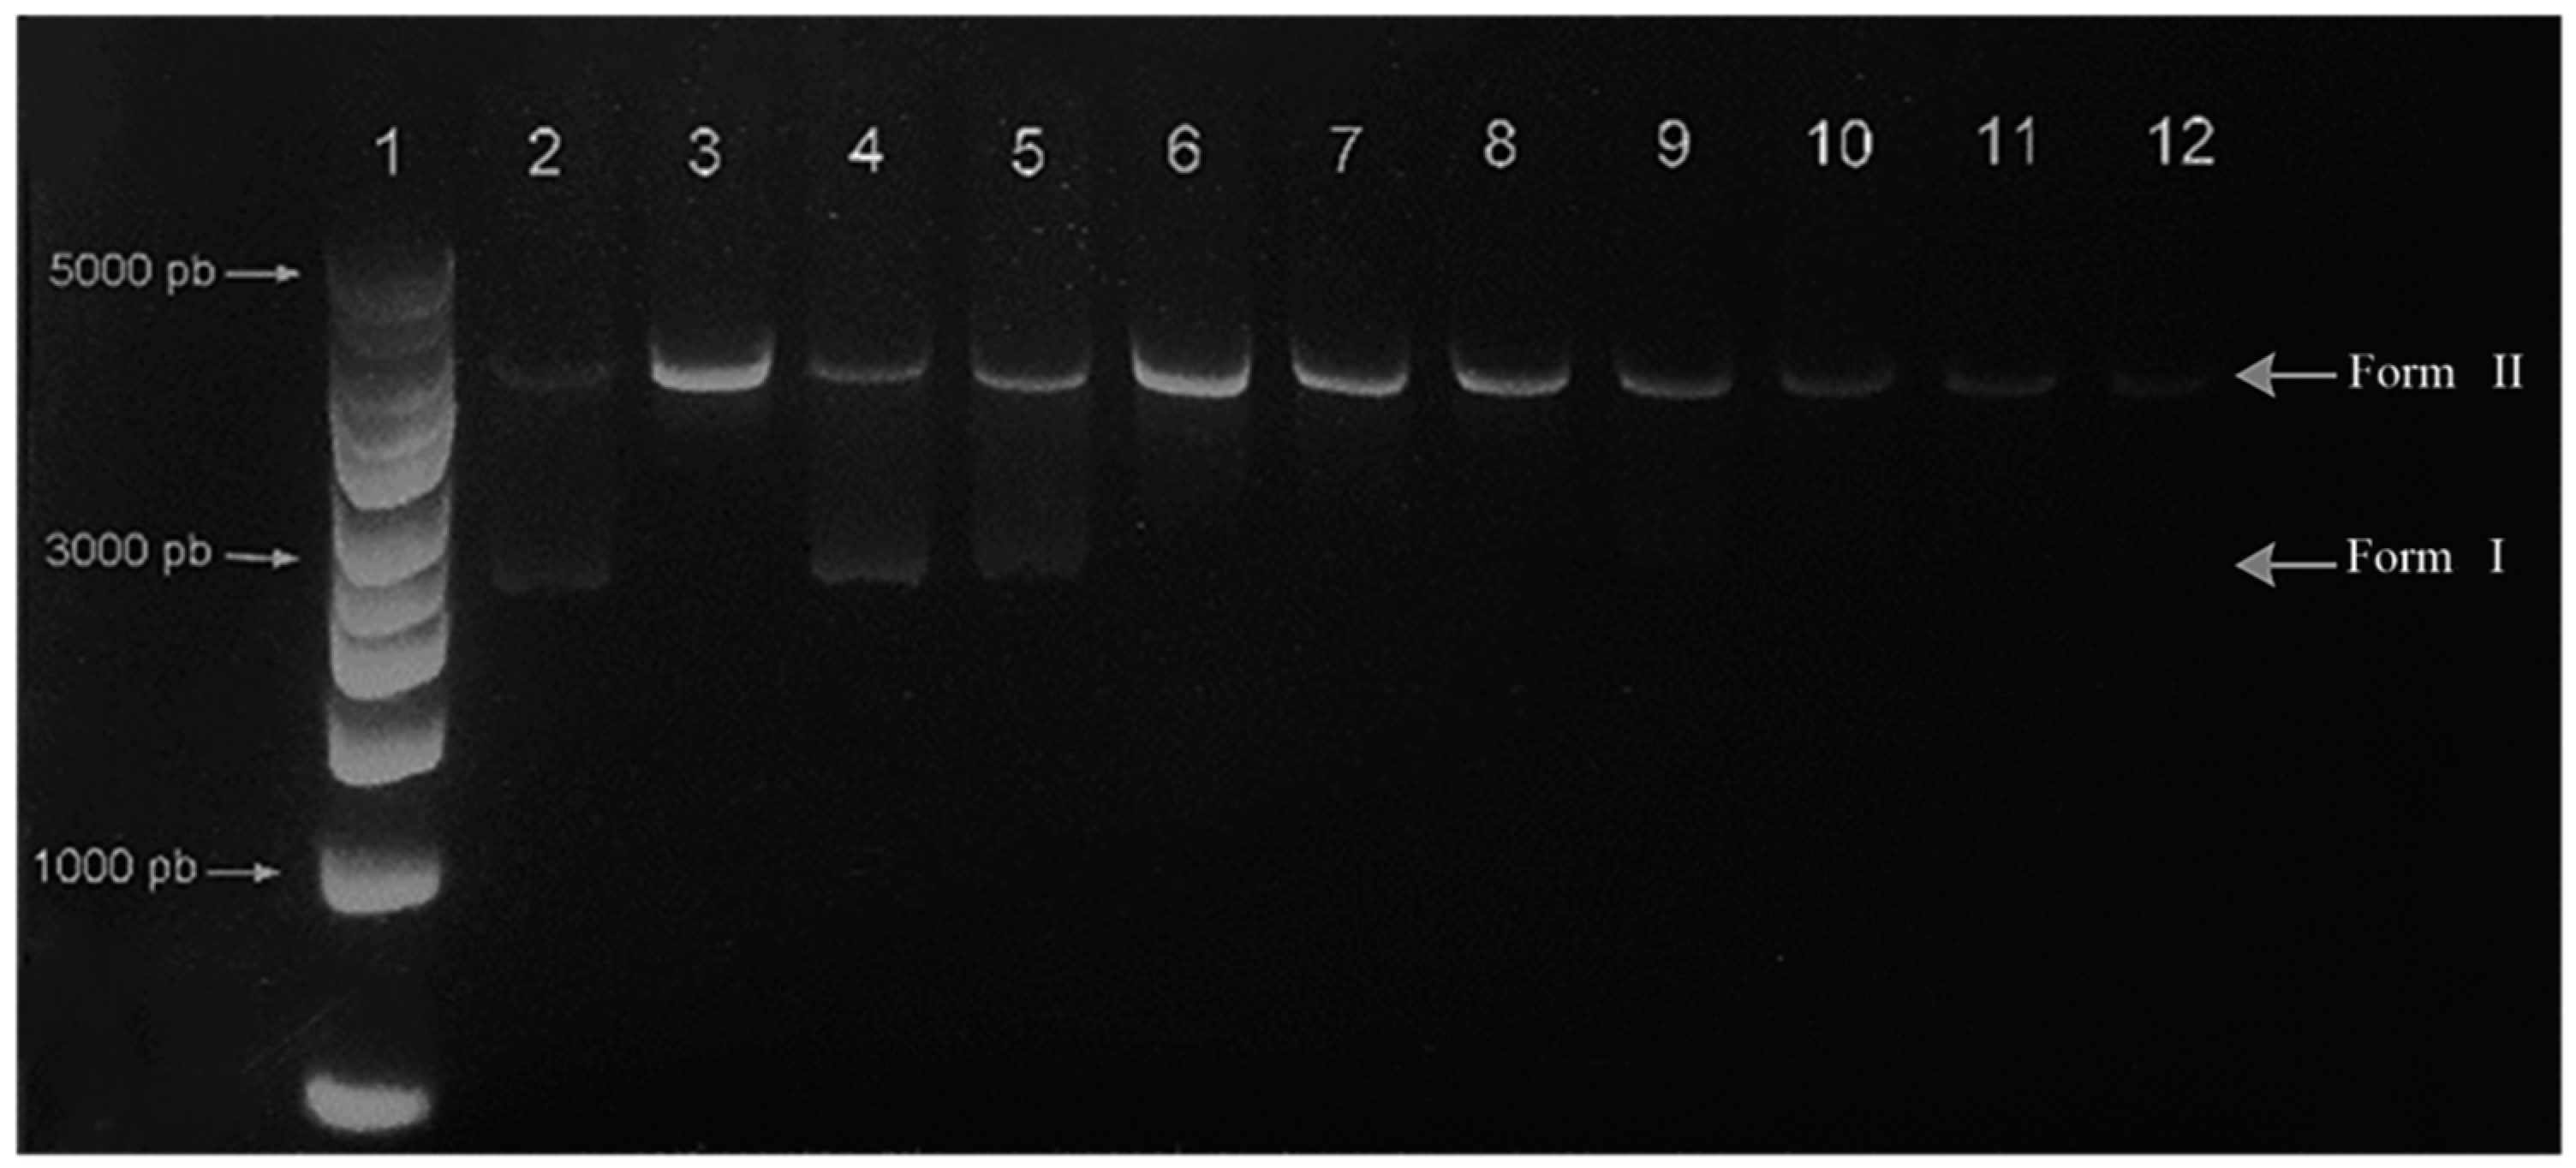
Viscosity measurements are a highly sensitive tool to validate the interaction between compounds and DNA, since they reflect the structural modifications and size alterations resulting from the binding. The viscosity of a CT-DNA solution (600 μM) was determined upon the addition of increasing concentrations of the compounds HL, 1, and 2 (R = [compound]/[DNA]) of between 0 and 1.5 (Figure 7a). The efflux times were recorded by processing the video’s photograms with Camtasia Studio® software. The data showed that the relative viscosities of DNA increased when the CT-DNA complex adduct was formed with metal complexes 1 and 2, presenting a common behavior of compounds that intercalate inside the nucleobases of DNA, as they induce the elongation of the DNA by unwinding or stretching the double helix [38]. Additionally, the binding mode of the synthesized compounds was studied through DNA melting curves, measuring the electronic absorption at the maximum absorbance of DNA (260 nm) (Figure 7b). It was observed that both complexes 1 and 2 cause an increase in the melting point (Tm) of DNA. Interestingly, the experiment showed that the interaction of complex 1 generated an increase in the Tm (~10 °C) of DNA, which is usually related to an intercalation binding mode that generates greater stability between the strands of the DNA double helix [39]. This result is consistent with the highest value in the intrinsic binding constants (Kb) and viscosity measurements observed for complex 1.
  • DNA cleavage
Metal complexes might induce genotoxicity by causing damage or conformational alterations in the DNA of prokaryotic and eukaryotic cells, which can lead to cell death by apoptosis [40]. Therefore, analyzing these interactions is crucial for understanding the mechanisms of action of certain drugs and developing new therapeutic strategies. DNA is a macromolecule that can present different conformations that affect the electrophoretic mobility in the agarose gel. Double-stranded, circular, supercoiled DNA (form I) has a higher electrophoretic mobility than relaxed, circular DNA (form II). Form III is the linear conformation resulting from the cleavage of form II, and its electrophoretic migration is between form I and form II [22,41]. In this study, the effects of compounds HL, 1, and 2 on the DNA conformation of the pmCherry vector isolated from E. coli BL21 were analyzed in the presence and absence of H2O2 by monitoring the reaction by electrophoresis in a 1% agarose gel with a 1X TAE buffer at a pH of 7.2 and with Bioline HyperLadder™ 1 kb as a molecular weight marker. Figure 8 and Figure 9 illustrate the displacement patterns of the vector in response to the interaction with the analyzed compounds.
The results obtained showed that both complexes 1 and 2 can alter the conformation of DNA in the absence of an exogenous reagent (H2O2, lane 5, Figure 8 and Figure 9), favoring the relaxed, circular form (form II), while the control (free plasmid) and the HL ligand did not generate significant changes in the conformation of the plasmid DNA (lanes 2 and 4, Figure 8 and Figure 9). In the presence of H2O2, complexes 1 and 2 showed an increase in oxidative DNA cleavage as the concentration of the complexes increased. This is particularly evident for complex 1, where a reactive oxygen species generator contributed to an increase in oxidative DNA cleavage (lanes 6–10) [23], resulting in the appearance of the linear conformation (form III). At a concentration higher than 50 μmol·L−1, damage was generated in the DNA, and the bands corresponding to the supercoiled form of DNA (form I) were not observed in the gel (Figure 8, lanes 11 and 12).

2.3.3. BSA Interaction

The analysis of the complex-BSA interaction was performed at 25 °C in Tris-HCl/NaCl buffer (100 mM/50 mM, pH 7.4) by electronic absorption and fluorescence assays. BSA shows two characteristic absorption peaks: a low-intensity peak around 280 nm, associated with amino acid residues like tryptophan (Trp), tyrosine (Tyr), and phenylalanine (Phe), and an intense peak between 220 and 240 nm, related to its secondary structure. The analysis of the variations in these peaks allows the investigation into the interaction mechanisms between the compound and albumin. Absorption and emission spectroscopies also allow the identification of quenching patterns, determining whether the mechanism is dynamic or static. Dynamic quenching affects only the excited state of the fluorophore, while static quenching occurs when a compound–protein complex is formed, altering both absorption and emission.
Figure 10 shows the absorption spectra of BSA after titration with the compounds, where two phenomena stand out: a notable decrease in the intensity of the absorption spectrum and a bathochromic effect on the peak of the protein secondary structure, demonstrating a clear affinity of the compounds for the protein. This change in the absorption spectra suggests a static quenching mechanism [42].
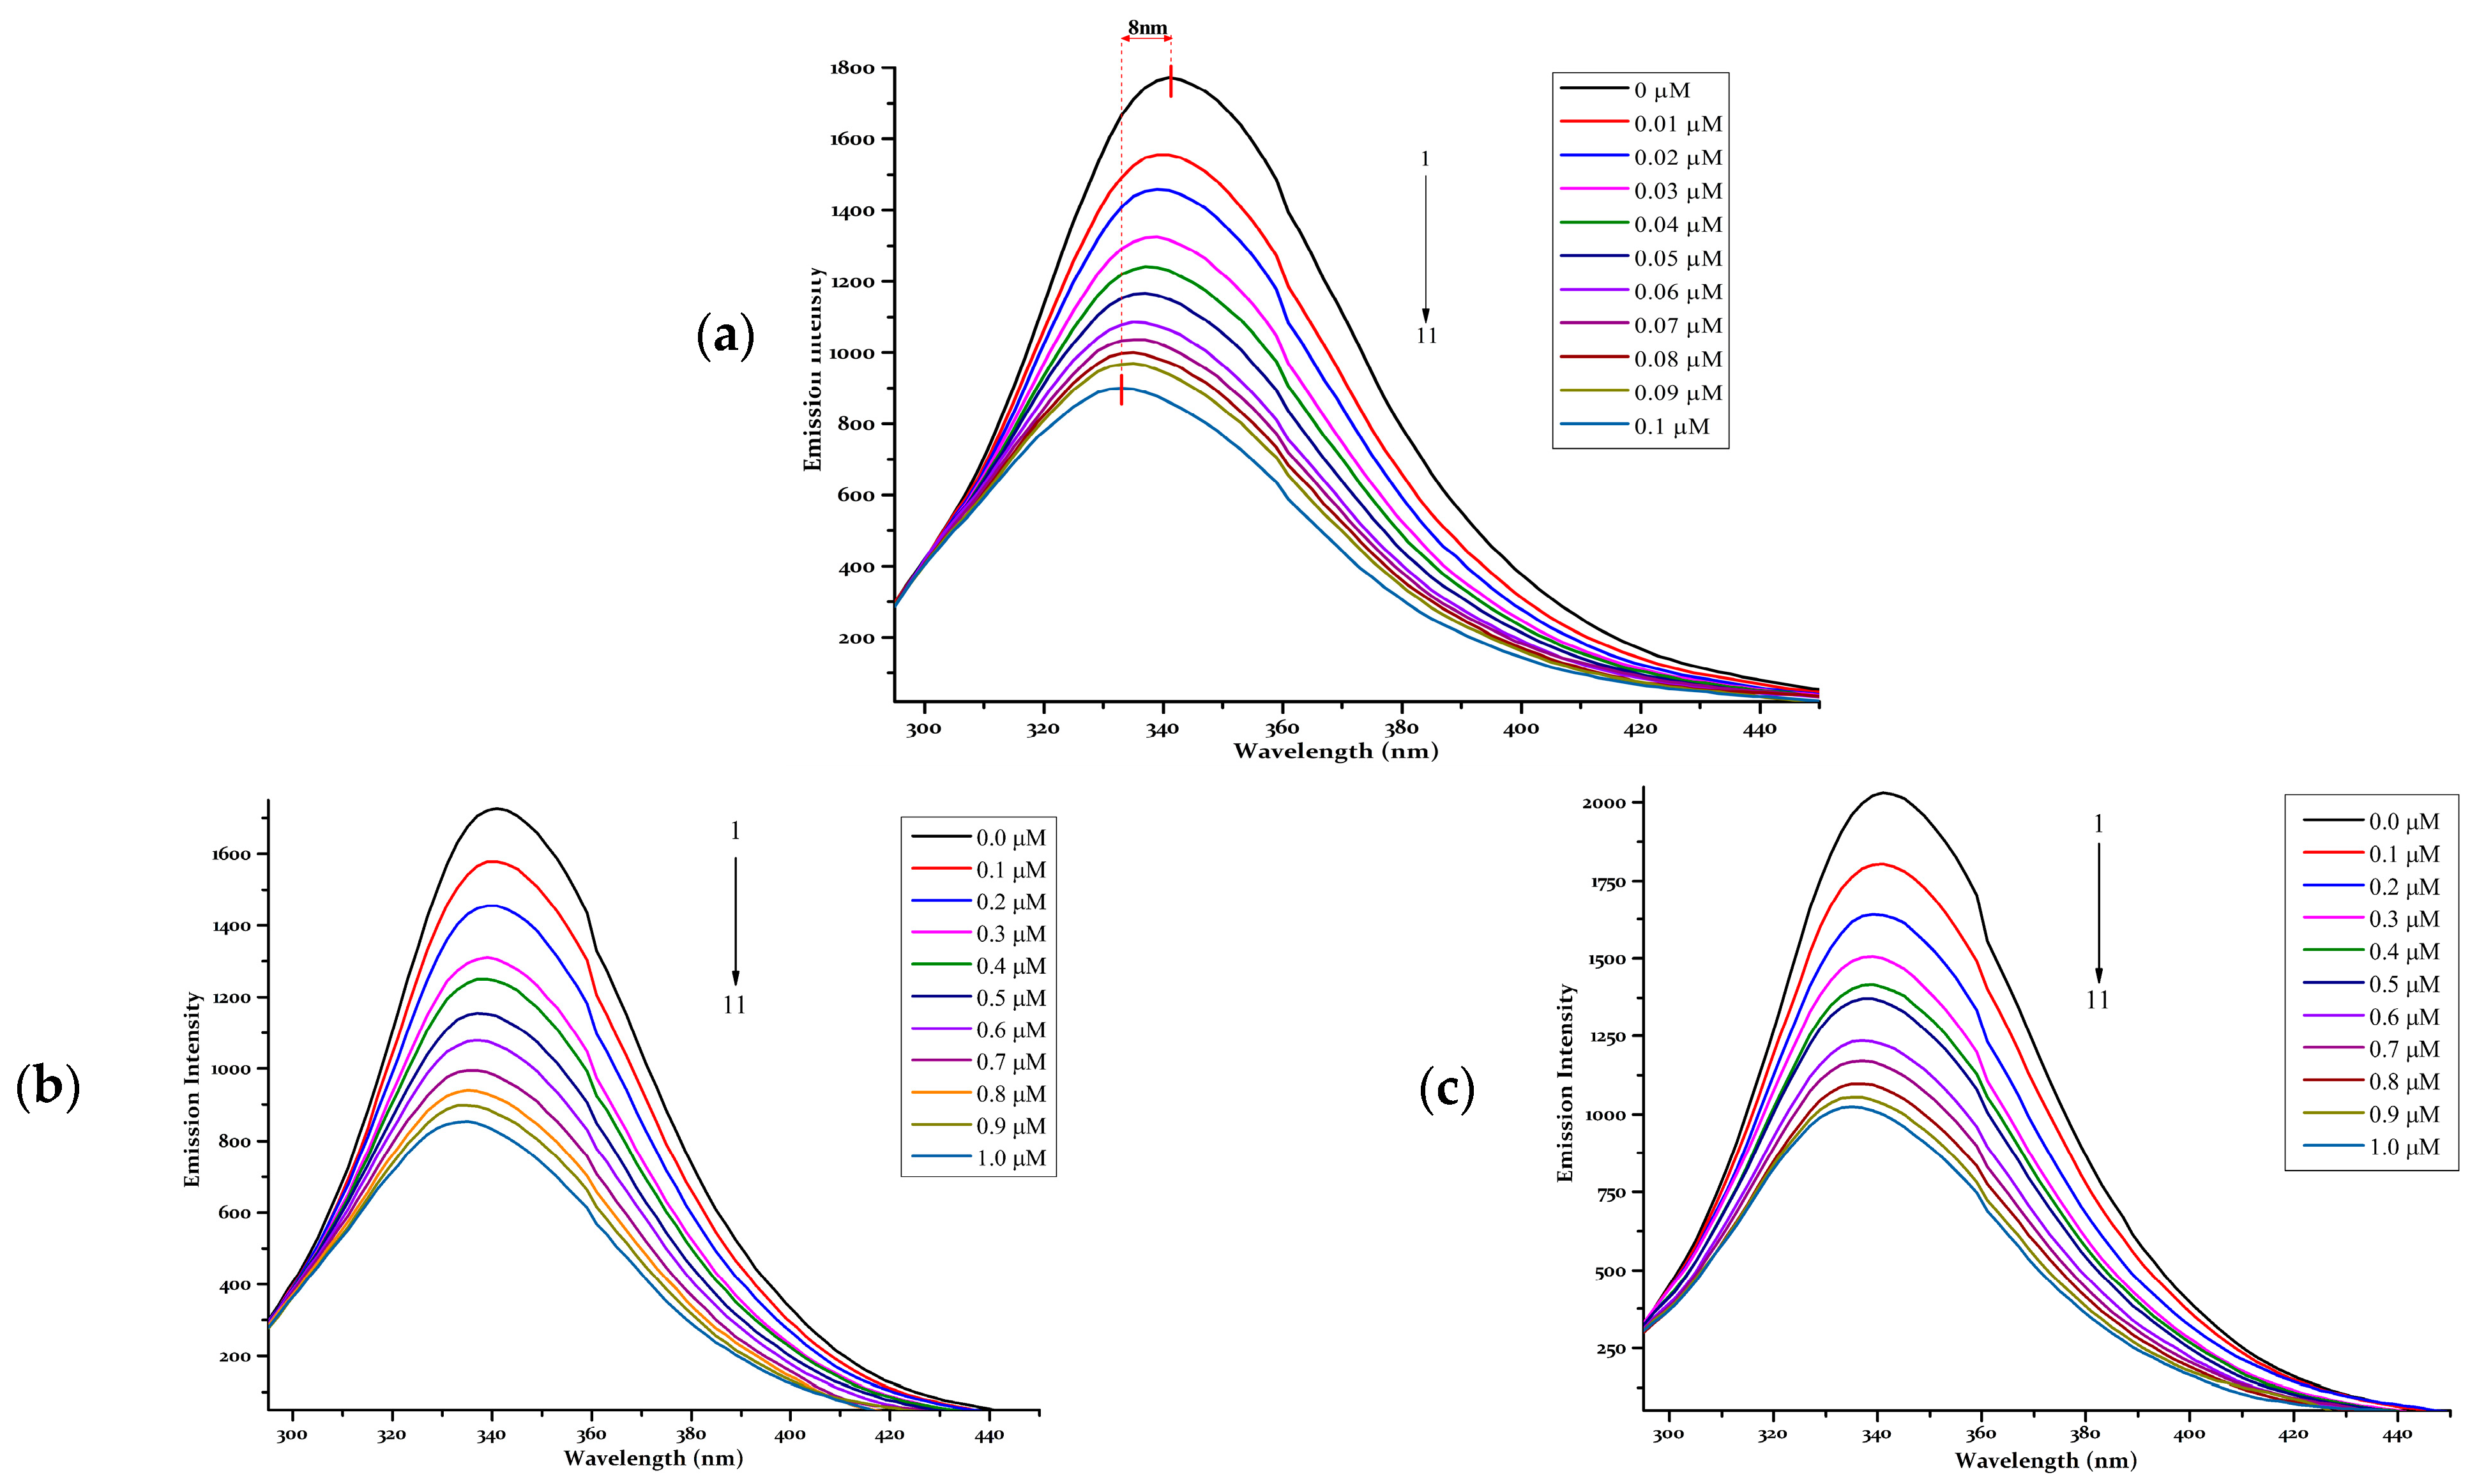
  • BSA fluorescence-quenching assays
The fluorescent properties of BSA are due to the Trp, Tyr, and Phe residues; however, of these three amino acid residues, Trp is the most responsible for the intrinsic fluorescence display of this protein, presenting a characteristic emission maximum of around 340 nm [43]. The analysis of the changes in the emission spectrum provides us with valuable information about the complex protein interaction mechanisms, their binding properties, and the interaction forces involved in this binding process [44].
As seen in Figure 11, after successive additions of the synthesized compounds, the emission intensity of BSA is reduced by 50.4%, 49.5%, and 49.2% of the initial fluorescence intensity of BSA for 1, 2, and 3, respectively. A hypsochromic shift of the emission maximum (a shift to shorter wavelengths) for the compounds is also observed. Both phenomena show an interaction between the compounds and BSA; however, hypsochromism also indicates that an increase in hydrophobicity is generated in the microenvironment surrounding the Trp residue [45,46].
The decrease in intensity of fluorophores is known as quenching; this process of fluorescence extinction is due to different mechanisms known as dynamic quenching, static quenching, or simultaneous quenching (static and dynamic). The quenching parameters were determined using the Stern–Volmer equation and modified Stern–Volmer equations (Table 3). The assessed compounds exhibit quenching constant Ksv values of order ~105 M−1, indicating a high fluorophore sensitivity to the compounds (quenchers). The bimolecular extinction constant Kq values are significantly greater than the biomolecules maximum Kq (2.0 × 10¹⁰ M−1 s−1), most likely indicating static extinction. The number of binding sites was between 0.89 and 1.07, showing that synthesized compounds bonded to one BSA molecule in a stoichiometry of 1:1.

3. Materials and Methods

3.1. Materials

All the reagents and solvents used were obtained from commercial manufacturers (Sigma-Aldrich, St. Louis, MO, USA and Alfa Aesar, Ward Hill, MA, USA), and used as received. The synthesis of the Schiff base ligand (HL) was carried out using standard research methods [21]. The FT-IR spectra of the synthesized compounds were obtained between the 4000 cm−1 and 600 cm−1 regions on a Shimadzu Affinity 1 (FT-IR) device (Shimadzu, Miyazaki, Japan) with an ATR accessory. Their melting points were recorded on a Mel-Temp II apparatus (Thomas Scientific, Chadds Ford, PA, USA) and are reported without correction. The 1H-NMR (400 MHz) spectra were obtained in a DMSO-d6 solution at room temperature (298 K) on a Bruker Ultrashield Avance II 400 spectrophotometer (Bruker Corporation, Billerica, MA, USA). The chemical shifts values(δ) are reported in parts per million (ppm) with respect to tetramethylsilane (TMS, SiMe4, δ = 0), and the coupling constants (J) are given in Hz. The multiplicities are abbreviated in the following manner: singlet (s), doublet (d), double of doublets (dd), and triplet (t). Elemental (C, H, and N) analyses were determined with the Flash EA 1112 Series CHN Analyzer (Thermo Fisher Scientific, Waltham, MA, USA). A Shimadzu AA-6300 atomic absorption spectrometer was used for copper and nickel analyses. The electronic impact (EI) ionization mass spectrum of the ligand was recorded on a Shimadzu-GCMS-QP2010 (Shimadzu Corporation, Miyazaki, Japan) at 40 eV. A Direct Analysis in Real Time (DART) ionization system was used to obtain the mass spectra of the complexes on an AccuTOF JMS-T100LC (JEOL, Ltd., Tokyo, Japan). The conductivity measurements of the metal complexes were determined in ethanol (1 × 10⁻³ M) using an OrionTM 131S (Thermo Fischer Scientific, USA). The UV-vis spectroscopy studies were performed using a Thermo Scientific Evolution 201/220 UV-visible spectrophotometer (Thermo Fisher Scientific, Waltham, MA, USA). The stoichiometry of the metal complexes was investigated using the continuous-variation spectrophotometric Job’s method. Fluorescence measurements were obtained at room temperature (298 K) with a JASCO FP-8500 spectrofluorometer (JASCO Corporation, Tokyo, Japan) using quartz cells (1.0 cm). Viscosity measurements were carried out using a Cannon-Ubbelohde semi-micro viscometer (size 75) (CANNON Instrument Company, State College, USA).

3.2. Synthesis of Ligand (HL)

The 2-((2-(6-bromopyridin-2-yl)hydrazono)methyl)phenol was synthesized by adapting a procedure that was reported elsewhere [21] (Figure 12).
Hydrazine monohydrate (18 mmol) was added to an ethanolic solution of 2,6-dibromopyridine (2.95 mmol) and stirred under reflux for 18 h. The progress of the reaction was monitored by TLC. The Schiff base precursor 2-bromo-6-hydrazinylpyridine was extracted with ethyl acetate twice, and the organic phases were combined, dried, and recrystallized from water. Salicylaldehyde (1.10 mmol) and 2-bromo-6-hydrazinylpyridine (1.10 mmol) were mixed and stirred in ethanol (30 mL) at the reflux temperature for 2 h. A pale beige solid was then washed with distilled water (2 × 15 mL) and then recrystallized from a concentrated ethanolic solution to give the final product, HL. Light yellow crystals of good quality were obtained after one week (yield 81%). m.p.: 184–186 °C. C12H10BrN3O, elemental analysis: C, 49.34 (calc. 49.21); H, 3.45 (3.40); N, 14.38 (14.42)%. IR (selected peaks, ATR cm−1) ν: 3269 (O-H), 1620 (HC=N), 1556 (C=C), 1489 (C=N), 1260 (C–O), 1078 (N-N). The 1H-NMR (DMSO-d6, 400 MHz, ppm) δ: 11.28 (s, 1H), 10.28 (s, 1H), 8.30 (s, 1H), 7.64 (d, J = 9.0 Hz, 1H), 7.55 (t, J = 7.9 Hz, 1H), 7.20 (t, J = 7.7 Hz, 1H), 7.07 (d, J = 8.2 Hz, 1H), 6.93 (d, J = 7.4 Hz, 1H), 6.87 (dd, J = 16.7, 7.9 Hz, 2H). MS electron impact (m/z, 40 eV): 291 [M+] (21.5), 274 [M+-C12H9BrN3] (6.74), 197.97 [M+-C6H5BrN3] (6.54). λAbs = 339 nm, 311 nm, 240 nm. λEm = 520 nm, 380 nm.

3.3. Synthesis of Metal(II) Complexes

Coordination complexes were synthesized by modifying a previously reported procedure [21] (Figure 13).

3.3.1. Synthesis of [Cu(L)(NO3)] (1)

A solution of copper nitrate (0.51 mmol) in EtOH (3 mL) was slowly added to an ethanolic solution (5 mL) of HL (0.51 mmol). The reaction mixture was left under reflux and stirring for 2 h. The green solid obtained was filtered, washed with cold water (2 × 10 mL) and hexane (2 × 10 mL), and then dried at 90 °C (yield 93%). m.p.: >300 °C. C12H9BrCuN4O4, elemental analysis: C, 34.59 (calc. 34.53); H, 2.18 (2.20); N, 13.45 (13.41); Cu, 15.25 (14.82)%. IR (selected peaks, ATR cm−1) ν: 1611 (HC=N), 1526 (C=C), 1453 (C=N), 1478 (asym, −NO2), 1281 (sym, −NO2), 1246 (C–O), 1105 (N-N). ΛM (MeOH, 28.0 °C) (Ω−1cm2mol−1): 76. λAbs = 458 nm, 413 nm, 340 nm, 330 nm. λEm = 460 nm, 435 nm, 370 nm. MS (DART+) m/z: 415.

3.3.2. Synthesis of [Ni(L)2] (2)

The synthesis of complex (2) was performed using the same procedure as that for compound (1) to obtain a yellow-colored powder (yield 90%). m.p.: 284–286 °C. C24H18Br2NiN6O2, elemental analysis: C, 44.97 (calc. 44.58); H, 2.83 (2.79); N, 13.11 (13.16); Ni, 9.16 (9.87)%. IR (selected peaks, ATR cm−1) ν: 1608 (HC=N), 1525 (C=C), 1454 (C=N), 1244 (C–O), 1150 (N-N). ΛM (MeOH, 28.0 °C) (Ω−1cm2mol−1): 45. λAbs = 408 nm, 330 nm, 309 nm. λEm = 480 nm, 372 nm. MS (DART+) m/z: 640.

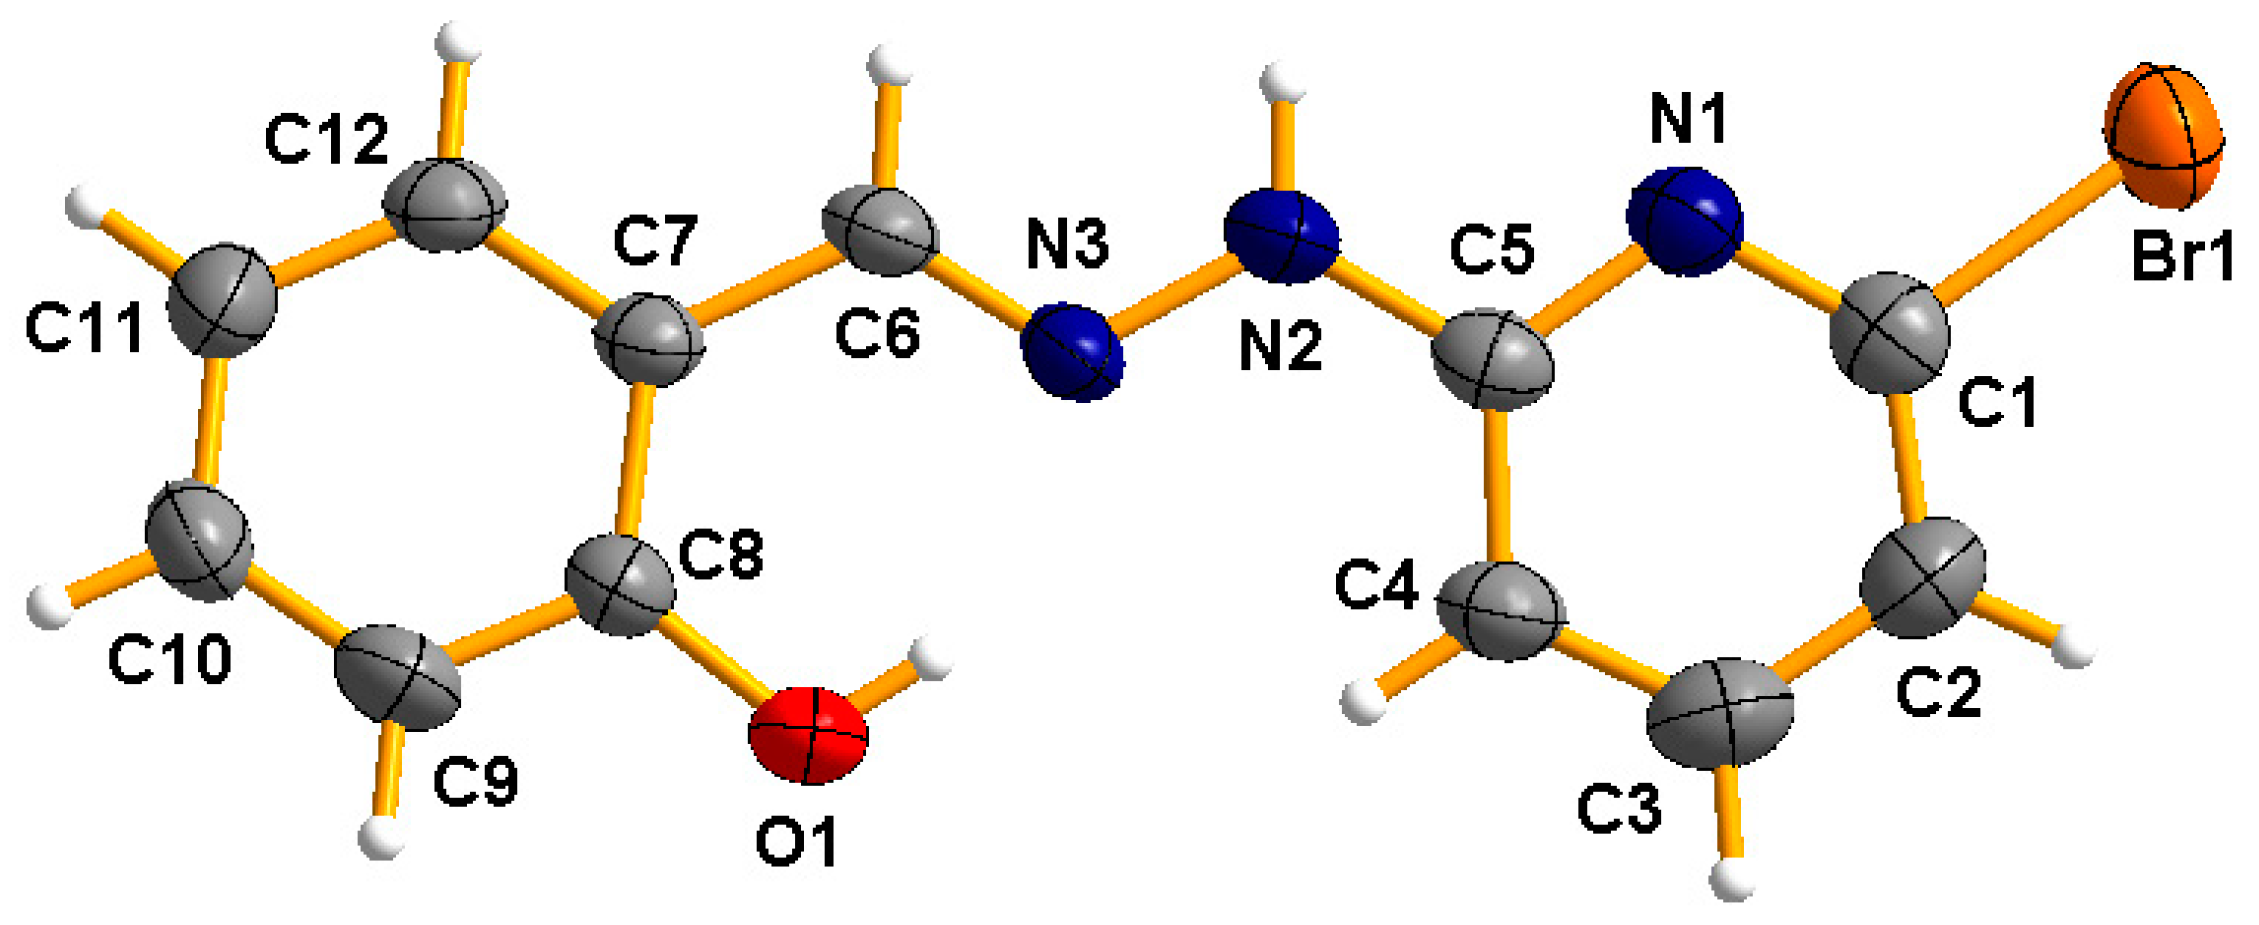
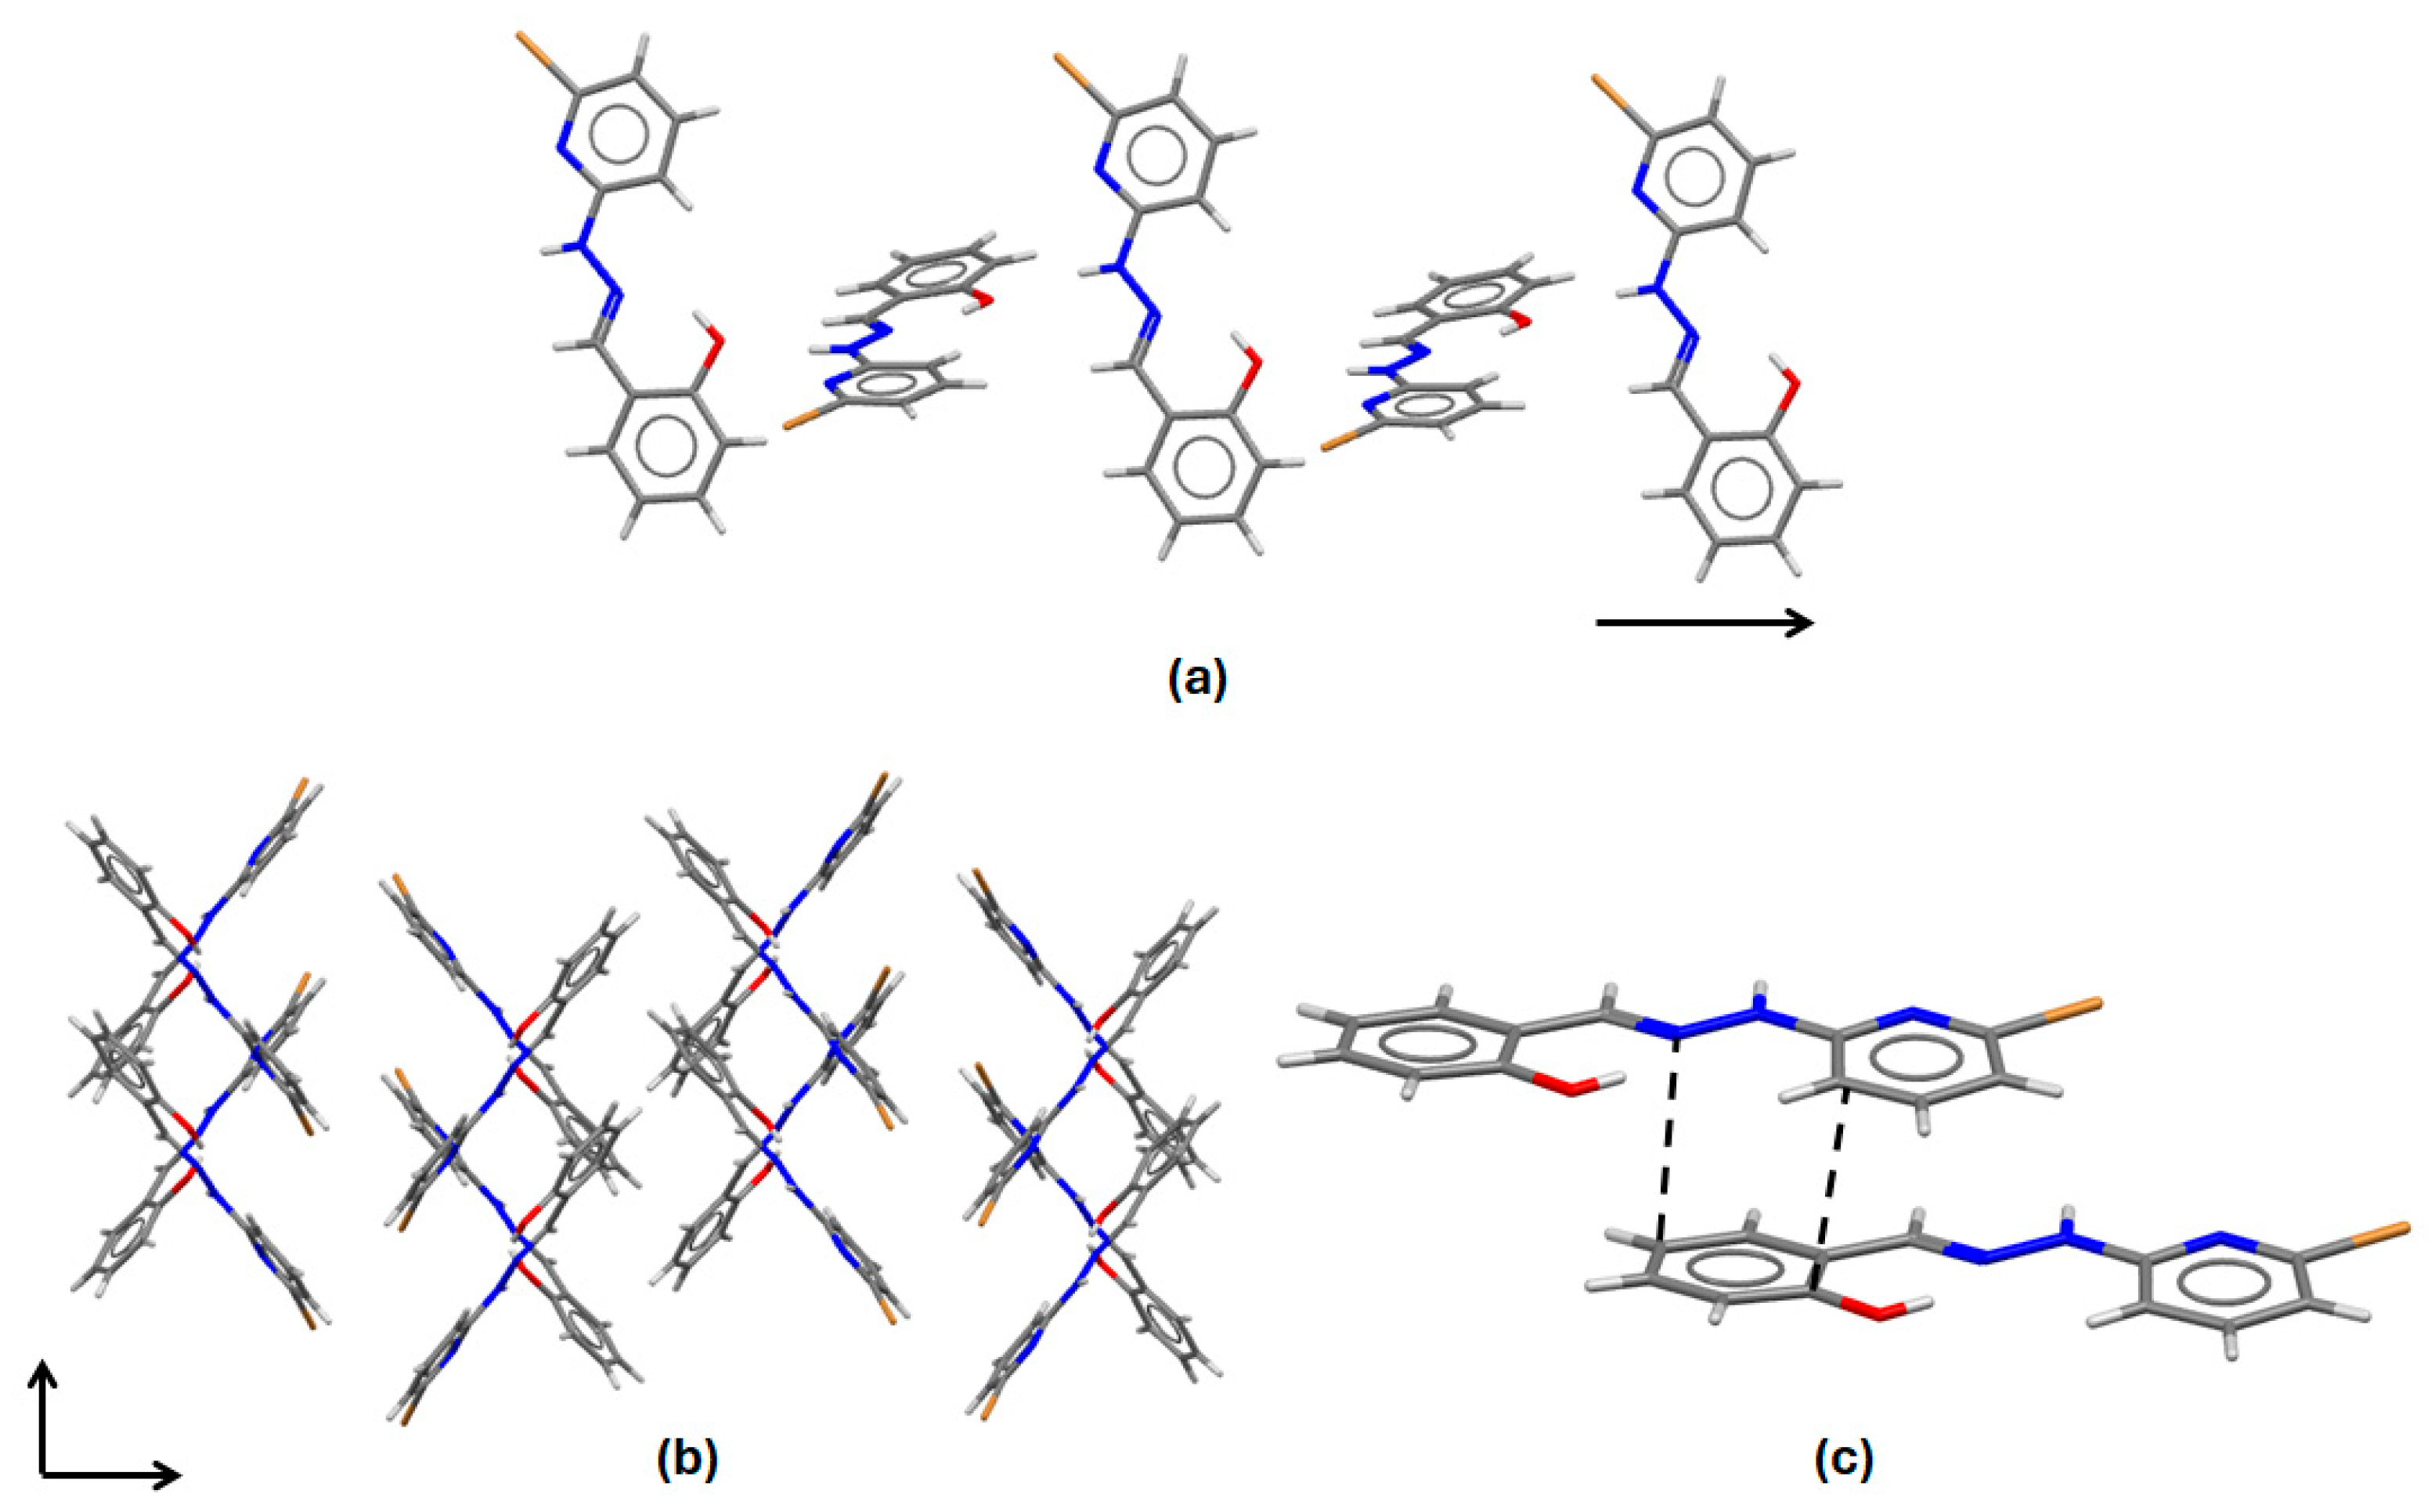
3.4. Single-Crystal Structure Determination of HL

Single-crystal X-ray data for HL were collected at room temperature (298 K) on an Enraf-Nonius Kappa-CCD diffractometer using MoKα radiation (0.71073 Å) monochromated by graphite. The cell refinements were performed using the software Collect and Scalepack, and the final cell parameters were obtained on all the reflections. Data reduction was carried out using the software Denzo-SMN and Scalepack [47]. The structure was solved using the software SHELXS-2013 and then refined using SHELXL-2013 [48], included in Olex [48,49,50]. The non-hydrogen atoms of the molecules were clearly resolved, and the full-matrix least-squares refinement of these atoms, with anisotropic thermal parameters, were performed. All the hydrogen atoms were stereochemically positioned and refined with the riding model (with Uiso(H) = 1.2Ueq) [48]. The ORTEP diagram was prepared with Diamond V3.2 [51]. Mercury V2024.2.0 [52] software was used to prepare the artwork of the supramolecular representation. CCDC 2394306 contains the supplementary crystallographic data for HL. These data can be obtained free of charge via http://www.ccdc.cam.ac.uk/structures from the Cambridge Crystallographic Data Centre, 12 Union Road, Cambridge, UK; fax: (+44) 1223-336-033; or e-mail: deposit@ccdc.cam.ac.uk.

3.5. Antibacterial Activity Test

The effectiveness of the obtained compounds against pathogenic microorganisms was evaluated following the recommended protocols for antimicrobial susceptibility testing by microdilution [53]. The minimum inhibitory concentration was determined in triplicate using the broth microdilution technique on three Gram-positive strains (Staphylococcus aureus ATCC 29213, Listeria monocytogenes ATCC 19115, and Bacillus cereus ATCC 10876) and three Gram-negative strains (Escherichia coli ATCC 25922, Salmonella typhimurium ATCC 14028, and Pseudomonas aeruginosa ATCC 27853). Briefly, bacterial strains were grown in chocolate agar under aerobic conditions and incubated at 37 °C for 24 h. A colony from the bacterial strains was initially resuspended in Mueller–Hinton broth (MHB) to reach a turbidity value of 0.5 McFarland, and the resulting suspension contained approximately 1–4 × 10⁸ colony-forming units (CFU)/mL. Using this suspension, a final solution was obtained that had a concentration of 1–5 × 10⁵ CFU/mL in Mueller–Hinton broth. The bacterial inoculum was incubated in sterile 96-well polypropylene microplates for 20 h in a concentration range of between 3.90 μg/mL and 3000 μg/mL of HL, 1 and 2. A free medium with DMSO (0.01%) and a bacterial medium without an inhibiting agent were used as the positive and negative controls, respectively. Ciprofloxacin (CP) and silver nitrate (AgNO3) were used as the control antibiotics.

3.6. DNA Interaction

UV-visible absorption titrations were performed to investigate the interaction of compounds HL, 1, and 2 with DNA. In addition, viscosity measurements, thermal denaturation, and agarose gel electrophoresis were carried out using standard methodologies and protocols, which were adapted in our laboratory [54]. Lyophilized calf thymus (CT-DNA), obtained from Sigma Aldrich, was utilized, along with a pmCherry vector that was extracted from E. coli BL21 (DH5α). All the solutions of DNA exhibited an A260/A280 ratio of between 1.8 and 1.9, indicating that the DNA was sufficiently free of RNA and proteins. The UV-vis spectra of HL, 1, and 2 were used to examine the stability of the compounds in solution. The DNA was resuspended in 10 mmol/L Tris and 1 mmol/L EDTA in deionized water, with the pH adjusted to approximately 7.5. The DNA solutions were stored at −5 °C and used within a period of 5 days. Absorption titrations were carried out with a constant amount of the compound, 50 μmol/L, along with enhanced DNA amounts (0–50 µmol/L), and the corresponding DNA solution was used as a reference solution. The solutions of the complexes contained deionized water and a DMSO of approximately 0.2%. The CT-DNA absorbance was eliminated by adding an equal amount of CT-DNA to the sample and the standard solution. The solution mixtures (compound-DNA) were incubated for 5 min, and the absorption spectra were recorded in the range 230–500 nm at room temperature. The binding constants (Kb) of the complexes were calculated according to the literature through the Wolfe–Shimmer Equation (1) [30], where [DNA] is the molar concentration of base pairs, εa is the apparent extinction coefficient of the bound complex (Aobs/[compound]), εf is the extinction coefficient of the molecule under study, and εb is the extinction coefficient of the fully bound compound-DNA complex. Plotting [DNA]/(εaεf) vs. [DNA] gives the value of Kb (the ratio of slope to intercept) [30,54].
[ D N A ] ( ε a ε f ) = [ D N A ] ( ε b ε f ) + 1 K b ( ε b ε f )

3.7. BSA Interaction

The BSA binding studies of the compounds HL, 1, and 2 were performed in a Tris-HCl/NaCl buffer solution (100 mM/50 mM, pH = 7.4) [55]. Stock solutions of the compounds were prepared in a DMSO buffer (1:20). The UV-vis absorption titrations were performed in the range of 200–350 nm at a constant concentration of BSA (2.8 mL, 10 µM) while gradually increasing the concentration of the synthesized compounds (10 µL; 0–10 µM). After each addition, the solutions were kept at room temperature for 5 min to ensure a complete reaction.
The fluorescence emission spectra were measured from 250 to 450 nm at an excitation wavelength of 280 nm. The BSA was titrated against the compounds (0–1.0 mM) at a constant BSA concentration of 1 µM in a Tris–HCl buffer (pH = 7.2). Each spectrum was carried out at room temperature after an incubation time of 5 min. The experimental data was used to draw the Stern–Volmer plot, and the quenching parameters were then calculated from the Stern–Volmer equation (Equation (2)) and modified Stern–Volmer equations (Equation (3)) [56].
F 0 F = 1 + k q τ 0 Q = 1 + K s v Q
where F0 is the BSA fluorescence intensity in the absence of compounds (HL, 1 and 2), F is the BSA fluorescence intensity in the presence of compounds, Kq is the fluorophore quenching rate constant, τ0 is the average lifetime of the molecule without the quencher (10−8 s), [Q] is the molar concentration of the compounds (quenchers), and KSV is the Stern–Volmer (quenching) constant. The KSV was determined from the slope of the linear plot of F0/F versus [Q].
log F 0 F F = log K b + n   l o g Q
where Kb is the binding constant, and n is the number of binding sites.

3.8. Stability Studies of the Complexes

The stability of the complexes in the MHB medium was evaluated using a Thermo Scientific Evolution 220 UV-visible spectrophotometer to obtain electronic absorption spectra using a method similar to previously reported studies [57]. The measurements were performed in the range of 300–550 nm in 1 cm quartz cells. Next, 2 mL samples of solutions of the compounds, with concentrations of between 1 and 5 × 10⁻⁶ M, were prepared. The solutions were left at ambient conditions for 24 h, and the UV-vis spectra were measured again. The stability constant (K) can be obtained from the double reciprocal linear graph by the relationship between the slope and the intercept.

4. Conclusions

The present study indicates that metal complexes of Cu(II) and Ni(II) with a new NNO-donor hydrazone ligand contribute significantly to the enhanced antibacterial activity in comparison to the free ligand, thereby demonstrating the advantageous impact of metal coordination on biological activity. In particular, the Ni(II) complex exhibited notable efficacy against both Bacillus cereus and Salmonella typhimurium strains, indicating that the central metal plays a vital role in antimicrobial activity. Additionally, the UV-vis spectroscopy and viscosity assays displayed by the DNA interaction studies reveal that these complexes are capable of intercalating into the DNA double helix, which could contribute to their antibacterial mechanism of action. The DNA oxidative fragmentation ability of these chelates also accords with a possible cytotoxic mechanism based on the production of reactive oxygen species. Moreover, interaction studies with bovine serum albumin (BSA) indicated a high affinity of the metal complexes for the protein, thus suggesting the likelihood of a transport mechanism. The fluorescence analysis showed that quenching is static; thus, it suggests the formation of a stable complex within the BSA. The results point to the undoubted potential of hydrazone-derived Cu(II) and Ni(II) complexes as good candidates for the development of new antimicrobial agents, which may find applications in bacterial chemotherapy. However, it is necessary to conduct some additional studies in better biological models to evaluate their specificity, bioavailability, and specific cytotoxic effects before they can be heralded as potential therapeutic alternatives.

Supplementary Materials

The following supporting information can be downloaded at https://www.mdpi.com/article/10.3390/inorganics13070213/s1. Figure S1: the determination of the stoichiometry of the metal complexes by Job’s method of continuous variation; (a) [Cu(L)(NO3)]; (b) [Ni(L)2]. Figure S2: calibration curves for metal quantification by atomic absorption; (a) [Cu(L)(NO3)]; (b) [Ni(L)2]. Figure S3: the absorption spectra of the Cu(II) complex at different concentrations (1.0–5.0 × 10⁶ M) in MTH media and the double reciprocal plot of 1/(A−Ao) vs. 1/[Cu(II)L] (a) at the beginning of the experiment and (b) after 24 h of interaction. Figure S4: the absorption spectra of the Ni(II) complex at different concentrations (1.0–5.0 × 10⁶ M) in MTH media and the double reciprocal plot of 1/(A-Ao) vs. 1/[Ni(II)L] (a) at the beginning of the experiment and (b) after 24 h of interaction. Figure S5: a Stern–Volmer plot of the determination of the extinction constant Ksv for compounds (a) HL; (b) 1; and (c) 2. Figure S6: a modified Stern–Volmer plot of the determination of the extinction constant Kb for compounds (a) HL; (b) 1; and (c) 2. Figure S7: mass spectra with ionization by electronic impact (EI) ionization for HL. Figure S8: the mass spectrum (DART+) of the Cu(II) complex. Figure S9: the mass spectrum (DART+) of the Ni(II) complex. Figure S10: the 1H-NMR spectra for HL. Figure S11: the comparative FT-IR spectra of compound 1 (green) and 2 (orange) with the ligand HL (red).

Author Contributions

Conceptualization, D.P.-C. and A.A.-M.; methodology, M.K.T.-R., S.J.J.-L. and A.A.-M.; software, R.D.; validation, D.P.-C., A.A.-M. and R.D.; formal analysis, M.K.T.-R., S.J.J.-L. and R.D.; investigation, M.K.T.-R., S.J.J.-L. and A.A.-M.; resources, D.P.-C.; writing—original draft preparation, M.K.T.-R., S.J.J.-L. and R.D.; writing—review and editing, D.P.-C., A.A.-M., and R.D.; visualization, D.P.-C. and R.D.; supervision, D.P.-C.; project administration, D.P.-C. and A.A.-M.; funding acquisition, D.P.-C. and A.A.-M. All authors have read and agreed to the published version of the manuscript.

Funding

This research was funded by the Universidad del Valle and the Universidad del Magdalena, VIN2024203 project (Fonciencias). The APC was funded by the Universidad del Magdalena (Editorial Unimagdalena—Vicerrectoría de Investigación).

Institutional Review Board Statement

Not applicable.

Informed Consent Statement

Not applicable.

Data Availability Statement

CCDC 2394306 contains the supplementary crystallographic data for HL. These data can be obtained free of charge via http://www.ccdc.cam.ac.uk/structures/or from the Cambridge Crystallographic Data Centre, 12 Union Road, Cambridge, UK; fax: (+44) 1223-336-033; or e-mail: deposit@ccdc.cam.ac.uk.

Acknowledgments

The authors are grateful to the Universidad del Valle and the Universidad del Magdalena for the support in the execution of the research project.

Conflicts of Interest

The authors declare no conflicts of interest.

References

  1. Mahoney, A.R.; Safaee, M.M.; Wuest, W.M.; Furst, A.L. The Silent Pandemic: Emergent Antibiotic Resistances Following the Global Response to SARS-CoV-2. iScience 2021, 24, 102304. [Google Scholar] [CrossRef] [PubMed]
  2. Abd-El-Aziz, A.; Li, Z.; Zhang, X.; Elnagdy, S.; Mansour, M.S.; ElSherif, A.; Ma, N.; Abd-El-Aziz, A.S. Advances in Coordination Chemistry of Schiff Base Complexes: A Journey from Nanoarchitectonic Design to Biomedical Applications. Top. Curr. Chem. 2025, 383, 8. [Google Scholar] [CrossRef]
  3. Aragón-Muriel, A.; Reyes-Márquez, V.; Cañavera-Buelvas, F.; Parra-Unda, J.R.; Cuenú-Cabezas, F.; Polo-Cerón, D.; Colorado-Peralta, R.; Suárez-Moreno, G.V.; Aguilar-Castillo, B.A.; Morales-Morales, D. Pincer Complexes Derived from Tridentate Schiff Bases for Their Use as Antimicrobial Metallopharmaceuticals. Inorganics 2022, 10, 134. [Google Scholar] [CrossRef]
  4. Sinicropi, M.S.; Ceramella, J.; Iacopetta, D.; Catalano, A.; Mariconda, A.; Rosano, C.; Saturnino, C.; El-Kashef, H.; Longo, P. Metal Complexes with Schiff Bases: Data Collection and Recent Studies on Biological Activities. Int. J. Mol. Sci. 2022, 23, 14840. [Google Scholar] [CrossRef] [PubMed]
  5. Czyżewska, I.; Mazur, L.; Popiołek, Ł. Transition Metal Complexes of Hydrazones as Potential Antimicrobial and Anticancer Agents: A Short Review. Chem. Biol. Drug Des. 2024, 104, e14590. [Google Scholar] [CrossRef]
  6. Shaabani, B.; Khandar, A.A.; Ramazani, N.; Fleck, M.; Mobaiyen, H.; Cunha-Silva, L. Chromium(III), Manganese(II) and Iron(III) Complexes Based on Hydrazone Schiff-Base and Azide Ligands: Synthesis, Crystal Structure and Antimicrobial Activity. J. Coord. Chem. 2017, 70, 696–708. [Google Scholar] [CrossRef]
  7. Jabeen, M. A Comprehensive Review on Analytical Applications of Hydrazone Derivatives. J. Turk. Chem. Soc. A Chem. 2022, 9, 663–698. [Google Scholar] [CrossRef]
  8. Cukierman, D.S.; Accardo, E.; Gomes, R.G.; De Falco, A.; Miotto, M.C.; Freitas, M.C.R.; Lanznaster, M.; Fernández, C.O.; Rey, N.A. Aroylhydrazones Constitute a Promising Class of ‘Metal-Protein Attenuating Compounds’ for the Treatment of Alzheimer’s Disease: A Proof-of-Concept Based on the Study of the Interactions between Zinc(II) and Pyridine-2-Carboxaldehyde Isonicotinoyl Hydrazone. J. Biol. Inorg. Chem. 2018, 23, 1227–1241. [Google Scholar] [CrossRef]
  9. Cukierman, D.S.; Rey, N.A. Tridentate N-Acylhydrazones as Moderate Ligands for the Potential Management of Cognitive Decline Associated with Metal-Enhanced Neuroaggregopathies. Front. Neurol. 2022, 13, 828654. [Google Scholar] [CrossRef]
  10. Mandewale, M.C.; Kokate, S.; Thorat, B.; Sawant, S.; Yamgar, R. Zinc Complexes of Hydrazone Derivatives Bearing 3,4-Dihydroquinolin-2(1H)-One Nucleus as New Anti-Tubercular Agents. Arab. J. Chem. 2019, 12, 4479–4489. [Google Scholar] [CrossRef]
  11. Balsa, L.M.; Ferraresi-Curotto, V.; Lavecchia, M.J.; Echeverría, G.A.; Piro, O.E.; García-Tojal, J.; Pis-Diez, R.; González-Baró, A.C.; León, I.E. Anticancer Activity of a New Copper(ii) Complex with a Hydrazone Ligand. Structural and Spectroscopic Characterization, Computational Simulations and Cell Mechanistic Studies on 2D and 3D Breast Cancer Cell Models. Dalton Trans. 2021, 50, 9812–9826. [Google Scholar] [CrossRef] [PubMed]
  12. Shakdofa, M.M.E.; Shtaiwi, M.H.; Morsy, N.; Abdel-rassel, T.M.A. Metal Complexes of Hydrazones and Their Biological, Analytical and Catalytic Applications: A Review. Main Group Met. Chem. 2014, 13, 187–218. [Google Scholar] [CrossRef]
  13. Povea-Cabello, S.; Brischigliaro, M.; Fernández-Vizarra, E. Emerging Mechanisms in the Redox Regulation of Mitochondrial Cytochrome c Oxidase Assembly and Function. Biochem. Soc. Trans. 2024, 52, 873–885. [Google Scholar] [CrossRef] [PubMed]
  14. Moreno-Narváez, M.E.; González-Sebastián, L.; Colorado-Peralta, R.; Reyes-Márquez, V.; Franco-Sandoval, L.O.; Romo-Pérez, A.; Cruz-Navarro, J.A.; Mañozca-Dosman, I.V.; Aragón-Muriel, A.; Morales-Morales, D. Anticancer and Antimicrobial Activity of Copper(II) Complexes with Fluorine-Functionalized Schiff Bases: A Mini-Review. Inorganics 2025, 13, 38. [Google Scholar] [CrossRef]
  15. Sigel, H.; Sigel, A. Metal Ions in Biological Systems; CRC Press: Boca Raton, FL, USA, 2024; ISBN 9781003573685. [Google Scholar]
  16. Qiu, X.-Y.; Liu, S.-J. Synthesis, Characterization and Crystal Structures of Nickel(II) Complexes Derived from Schiff Bases with Antimicrobial Activity. Polyhedron 2024, 247, 116708. [Google Scholar] [CrossRef]
  17. Alqasaimeh, M.M.; Abu-Yamin, A.-A.M.; Matar, S.A.; Sarairah, I.A.; Salman, M.M.; Al-As’ad, R.M. Synthesis and Characterization of a New Schiff-Base Derivative as an Optical Nickel (II) Chemosensor and Its Antimicrobial Activity. J. Photochem. Photobiol. A Chem. 2024, 447, 115277. [Google Scholar] [CrossRef]
  18. Samir, S. Human DNA Mutations and Their Impact on Genetic Disorders. Recent Pat. Biotechnol. 2024, 18, 288–315. [Google Scholar] [CrossRef] [PubMed]
  19. Sengupta, P.; Pal, U.; Roy, P.; Samanta, T.; Chattopadhyay, N.; Sen, K.; Bose, A. Effect of a Metal Ion in Modulating the Binding Interaction of a Dietary Flavonoid with Bovine Serum Albumin and DNA: A Spectroscopic and Theoretical Approach. ACS Food Sci. Technol. 2022, 2, 114–124. [Google Scholar] [CrossRef]
  20. Abdolmaleki, S.; Aliabadi, A.; Khaksar, S. Riding the Metal Wave: A Review of the Latest Developments in Metal-Based Anticancer Agents. Coord. Chem. Rev. 2024, 501, 215579. [Google Scholar] [CrossRef]
  21. Alagesan, M.; Bhuvanesh, N.S.P.; Dharmaraj, N. Potentially Cytotoxic New Copper(Ii) Hydrazone Complexes: Synthesis, Crystal Structure and Biological Properties. Dalton Trans. 2013, 42, 7210. [Google Scholar] [CrossRef]
  22. Ali, I.; Wani, W.A.; Saleem, K. Empirical Formulae to Molecular Structures of Metal Complexes by Molar Conductance. Synth. React. Inorg. Met. Org. Chem. 2013, 43, 1162–1170. [Google Scholar] [CrossRef]
  23. Polo-Cerón, D. Cu(II) and Ni(II) Complexes with New Tridentate NNS Thiosemicarbazones: Synthesis, Characterisation, DNA Interaction, and Antibacterial Activity. Bioinorg. Chem. Appl. 2019, 2019, 3520837. [Google Scholar] [CrossRef]
  24. Gómez-Saiz, P.; García-Tojal, J.; Maestro, M.A.; Mahía, J.; Arnaiz, F.J.; Lezama, L.; Rojo, T. New 1,3,4-Oxadiazolecopper(ii) Derivatives Obtained from Thiosemicarbazone Complexes. Eur. J. Inorg. Chem. 2003, 2003, 2639–2650. [Google Scholar] [CrossRef]
  25. Mihaylov, M.Y.; Zdravkova, V.R.; Ivanova, E.Z.; Aleksandrov, H.A.; Petkov, P.S.; Vayssilov, G.N.; Hadjiivanov, K.I. Infrared Spectra of Surface Nitrates: Revision of the Current Opinions Based on the Case Study of Ceria. J. Catal. 2021, 394, 245–258. [Google Scholar] [CrossRef]
  26. El-Sherif, A.A.; Fetoh, A.; Abdulhamed, Y.K.; Abu El-Reash, G.M. Synthesis, Structural Characterization, DFT Studies and Biological Activity of Cu(II) and Ni(II) Complexes of Novel Hydrazone. Inorganica Chim. Acta 2018, 480, 1–15. [Google Scholar] [CrossRef]
  27. Zülfikaroğlu, A.; Yüksektepe Ataol, Ç.; Çelikoğlu, E.; Çelikoğlu, U.; İdil, Ö. New Cu(II), Co(III) and Ni(II) Metal Complexes Based on ONO Donor Tridentate Hydrazone: Synthesis, Structural Characterization, and Investigation of Some Biological Properties. J. Mol. Struct. 2020, 1199, 127012. [Google Scholar] [CrossRef]
  28. Patil, S.S.; Tadavi, S.K.; Dikundwar, A.; Bendre, R.S. The Transition Metal Complexes of Fe(II), Ni(II) and Cu(II) Derived from Phthalazine Based Ligands: Synthesis, Crystal Structures and Biological Activities. J. Mol. Struct. 2022, 1247, 131293. [Google Scholar] [CrossRef]
  29. Panja, S.K.; Dwivedi, N.; Saha, S. Tuning the Intramolecular Charge Transfer (ICT) Process in Push–Pull Systems: Effect of Nitro Groups. RSC Adv. 2016, 6, 105786–105794. [Google Scholar] [CrossRef]
  30. Daravath, S.; Vamsikrishna, N.; Ganji, N.; Venkateswarlu, K.; Shivaraj. Synthesis, Characterization, DNA Binding Ability, Nuclease Efficacy and Biological Evaluation Studies of Co(II), Ni(II) and Cu(II) Complexes with Benzothiazole Schiff Base. Chem. Data Collect. 2018, 17–18, 159–168. [Google Scholar] [CrossRef]
  31. Claudel, M.; Schwarte, J.V.; Fromm, K.M. New Antimicrobial Strategies Based on Metal Complexes. Chemistry 2020, 2, 849–899. [Google Scholar] [CrossRef]
  32. Aragón-Muriel, A.; Liscano, Y.; Upegui, Y.; Robledo, S.M.; Ramírez-Apan, M.T.; Morales-Morales, D.; Oñate-Garzón, J.; Polo-Cerón, D. In Vitro Evaluation of the Potential Pharmacological Activity and Molecular Targets of New Benzimidazole-Based Schiff Base Metal Complexes. Antibiotics 2021, 10, 728. [Google Scholar] [CrossRef]
  33. Howsaui, H.B.; Sharfalddin, A.A.; Abdellattif, M.H.; Basaleh, A.S.; Hussien, M.A. Synthesis, Spectroscopic Characterization and Biological Studies of Mn(II), Cu(II), Ni(II), Co(II) and Zn(II) Complexes with New Schiff Base of 2-((Pyrazine-2-Ylimino)Methyl)Phenol. Appl. Sci. 2021, 11, 9067. [Google Scholar] [CrossRef]
  34. Kellett, A.; Molphy, Z.; Slator, C.; McKee, V.; Farrell, N.P. Molecular Methods for Assessment of Non-Covalent Metallodrug–DNA Interactions. Chem. Soc. Rev. 2019, 48, 971–988. [Google Scholar] [CrossRef]
  35. Sirajuddin, M.; Ali, S.; Badshah, A. Drug–DNA Interactions and Their Study by UV–Visible, Fluorescence Spectroscopies and Cyclic Voltametry. J. Photochem. Photobiol. B 2013, 124, 1–19. [Google Scholar] [CrossRef] [PubMed]
  36. Saygıdeğer Demir, B.; İnce, S.; Yilmaz, M.K.; Sezan, A.; Derinöz, E.; Taskin-Tok, T.; Saygideger, Y. DNA Binding and Anticancer Properties of New Pd(II)-Phosphorus Schiff Base Metal Complexes. Pharmaceutics 2022, 14, 2409. [Google Scholar] [CrossRef] [PubMed]
  37. Patel, M.N.; Parmar, P.A.; Gandhi, D.S.; Patidar, A.P. DNA Interactions and Cytotoxic Studies of Cis-Platin Analogues of Substituted 2,2′-Bipyridines. Spectrochim. Acta A Mol. Biomol. Spectrosc. 2012, 97, 54–59. [Google Scholar] [CrossRef]
  38. Alsaedi, S.; Babgi, B.A.; Abdellattif, M.H.; Arshad, M.N.; Emwas, A.-H.M.; Jaremko, M.; Humphrey, M.G.; Asiri, A.M.; Hussien, M.A. DNA-Binding and Cytotoxicity of Copper(I) Complexes Containing Functionalized Dipyridylphenazine Ligands. Pharmaceutics 2021, 13, 764. [Google Scholar] [CrossRef]
  39. Shinde, R.G.; Khan, A.A.; Barik, A. Exploring the Interaction of Copper-Esculetin Complex with Ct-DNA: Insight from Spectroscopic and Docking Studies. J. Mol. Struct. 2020, 1208, 127901. [Google Scholar] [CrossRef]
  40. Gewirtz, D. A Critical Evaluation of the Mechanisms of Action Proposed for the Antitumor Effects of the Anthracycline Antibiotics Adriamycin and Daunorubicin. Biochem. Pharmacol. 1999, 57, 727–741. [Google Scholar] [CrossRef]
  41. Alam, A.; Agrawal, G.P.; Khan, S.; Khalilullah, H.; Saifullah, M.K.; Arshad, M.F. Towards the Discovery of Potential RdRp Inhibitors for the Treatment of COVID-19: Structure Guided Virtual Screening, Computational ADME and Molecular Dynamics Study. Struct. Chem. 2022, 33, 1569–1583. [Google Scholar] [CrossRef]
  42. Topală, T.; Bodoki, A.; Oprean, L.; Oprean, R. Bovine Serum Albumin Interactions with Metal Complexes. Med. Pharm. Rep. 2014, 87, 215–219. [Google Scholar] [CrossRef]
  43. Samari, F.; Hemmateenejad, B.; Shamsipur, M.; Rashidi, M.; Samouei, H. Affinity of Two Novel Five-Coordinated Anticancer Pt(II) Complexes to Human and Bovine Serum Albumins: A Spectroscopic Approach. Inorg. Chem. 2012, 51, 3454–3464. [Google Scholar] [CrossRef]
  44. Szymańska, M.; Pospieszna-Markiewicz, I.; Mańka, M.; Insińska-Rak, M.; Dutkiewicz, G.; Patroniak, V.; Fik-Jaskółka, M.A. Synthesis and Spectroscopic Investigations of Schiff Base Ligand and Its Bimetallic Ag(I) Complex as DNA and BSA Binders. Biomolecules 2021, 11, 1449. [Google Scholar] [CrossRef] [PubMed]
  45. Lyndem, S.; Sarmah, S.; Das, S.; Singha Roy, A. Coumarin Derivatives: Biomedicinal Properties and Interactions with Carrier Proteins. In Studies in Natural Products Chemistry; Elsevier: Amsterdam, The Netherlands, 2022; pp. 173–220. [Google Scholar]
  46. Long, X.; Zeng, Y.-F.; Liu, Y.; Liu, Y.; Li, T.; Liao, L.; Guo, Y. Synthesis of Novel Genistein Amino Acid Derivatives and Investigation on Their Interactions with Bovine Serum Albumin by Spectroscopy and Molecular Docking. RSC Adv. 2018, 8, 31201–31212. [Google Scholar] [CrossRef]
  47. Otwinowski, Z.; Minor, W. Processing of X-Ray Diffraction Data Collected in Oscillation Mode. In Methods in Enzymology; Academic Press: Cambridge, MA, USA, 1997; pp. 307–326. [Google Scholar]
  48. Sheldrick, G.M. A Short History of SHELX. Acta Crystallogr. A 2008, 64, 112–122. [Google Scholar] [CrossRef]
  49. Farrugia, L.J. WinGX and ORTEP for Windows: An Update. J. Appl. Crystallogr. 2012, 45, 849–854. [Google Scholar] [CrossRef]
  50. Dolomanov, O.V.; Bourhis, L.J.; Gildea, R.J.; Howard, J.A.K.; Puschmann, H. OLEX2: A Complete Structure Solution, Refinement and Analysis Program. J. Appl. Crystallogr. 2009, 42, 339–341. [Google Scholar] [CrossRef]
  51. Brandenburg, K. Diamond; Crystal Impact GbR: Bonn, Germany, 2006. [Google Scholar]
  52. Macrae, C.F.; Bruno, I.J.; Chisholm, J.A.; Edgington, P.R.; McCabe, P.; Pidcock, E.; Rodriguez-Monge, L.; Taylor, R.; van de Streek, J.; Wood, P.A. Mercury CSD 2.0—New Features for the Visualization and Investigation of Crystal Structures. J. Appl. Crystallogr. 2008, 41, 466–470. [Google Scholar] [CrossRef]
  53. Gajic, I.; Kabic, J.; Kekic, D.; Jovicevic, M.; Milenkovic, M.; Mitic Culafic, D.; Trudic, A.; Ranin, L.; Opavski, N. Antimicrobial Susceptibility Testing: A Comprehensive Review of Currently Used Methods. Antibiotics 2022, 11, 427. [Google Scholar] [CrossRef]
  54. Londoño-Mosquera, J.-D.; Aragón-Muriel, A.; Polo-Cerón, D. Synthesis, Antibacterial Activity and DNA Interactions of Lanthanide(III) Complexes of N(4)-Substituted Thiosemicarbazones. Univ. Sci. 2018, 23, 141–169. [Google Scholar] [CrossRef]
  55. Alroba, A.A.N.; Aazam, E.S.; Zaki, M. Synthesis and Characterization of Metal Complexes [M(L)(Im)]NO3, In Vitro DNA/BSA Binding Behavior and Cytotoxicity on HepG2 Cancer Cells. ChemistrySelect 2024, 9, e202400737. [Google Scholar] [CrossRef]
  56. Churchill, C.M.; Brake, T.; Cuss, C.W. Effect of PH and Metal Ions on Protein–Metal Complexation Modeled by Fluorescence Quenching. J. Chem. Educ. 2025, 102, 316–323. [Google Scholar] [CrossRef]
  57. Aragón-Muriel, A.; Liscano-Martínez, Y.; Rufino-Felipe, E.; Morales-Morales, D.; Oñate-Garzón, J.; Polo-Cerón, D. Synthesis, Biological Evaluation and Model Membrane Studies on Metal Complexes Containing Aromatic N,O-Chelate Ligands. Heliyon 2020, 6, e04126. [Google Scholar] [CrossRef] [PubMed]
Figure 1. Structural formula of HL: 2-((2-(6-bromopyridin-2-yl)hydrazono)methyl)phenol.
Inorganics 13 00213 g001
Figure 2. An ORTEP diagram, displayed with 50% probability, for the compound (E)-2-((2-(6-bromopyridin-2-yl)hydrazono)methyl)phenol (HL).
Inorganics 13 00213 g002
Figure 3. (a) N–H···O interactions along the [010] direction; (b) crystal packing view in the plane (101); (c) the stacking interaction for the compound HL.
Inorganics 13 00213 g003
Figure 4. The comparative FT-IR spectra of compound 1 (green) and 2 (orange) with the ligand HL (red).
Inorganics 13 00213 g004
Figure 5. UV-visible spectra of compounds HL (line black), 1 (line green), and 2 (line orange).
Inorganics 13 00213 g005
Figure 6. The electron absorption spectra at a constant concentration of 50 μmol·L−1 of 1 (a) and 2 (b), titrated with CT-DNA to concentrations of 0 μmol·L−1 (green), 10 μmol·L−1 (red), 15 μmol·L−1 (blue), 20 μmol·L−1 (dark green), 25 μmol·L−1 (orange), 30 μmol·L−1 (pink), 35 μmol·L−1 (purple), 40 μmol·L−1 (grey), 45 μmol·L−1 (yellow), and 50 μmol·L−1 (brown) in nucleotides. The arrows show the changes upon increasing the amounts of CT DNA.
Inorganics 13 00213 g006
Figure 7. (a) The effect of increasing the amounts of the compound (R = [compound]/[DNA]) to between 0.0 and 1.5 on the viscosity of CT-DNA ([CT-DNA] = 600 μM (purple line), HL (blue line), 1 (red line), and 2 (green line); at 23 °C). Where η = the viscosity of the CT-DNA compound, and ηo = the viscosity of the free CT-DNA; (b) the thermal denaturation curves of CT-DNA (100 µM) in the absence and in the presence of the compounds (20 µM); CT-DNA alone (line purple), CT-DNA + HL (green line), CT-DNA + 1 (red line), and CT-DNA + 2 (blue line).
Inorganics 13 00213 g007
Figure 8. The agarose gel electrophoretic pattern of the pmCherry vector extracted from E. coli (10 ng·μL−1) with H2O2 (50 μmol·L−1) and varying concentrations of complex 1. Lane 1: HyperLadder 1 kb (15 μL); lane 2: pmCherry; lane 3: pmCherry + H2O2; lane 4: pmCherry + HL (50 μmol·L−1); lane 5: pmCherry +1 (50 μmol·L−1); lanes 6 to 12: pmCherry + H2O2 + 1 (5 μmol·L−1, 10 μmol·L−1, 15 μmol·L−1, 20 μmol·L−1, 40 μmol·L−1, 50 μmol·L−1, and 70 μmol·L−1, respectively).
Inorganics 13 00213 g008
Figure 9. The agarose gel electrophoretic pattern of the pmCherry vector extracted from E. coli (10 ng·μL−1) with H2O2 (50 μmol·L−1) and varying concentrations of complex 2. Lane 1: HyperLadder 1 kb (15 μL); lane 2: pmCherry; lane 3: pmCherry + H2O2; lane 4: pmCherry + HL (50 μmol·L−1); lane 5: pmCherry +2 (50 μmol·L−1); lanes 6 to 12: pmCherry + H2O2 + 2 (5 μmol·L−1, 10 μmol·L−1, 15 μmol·L−1, 20 μmol·L−1, 40 μmol·L−1, 50 μmol·L−1, and 70 μmol·L−1, respectively).
Inorganics 13 00213 g009
Figure 10. The electronic absorption spectra of a BSA solution (10 µM) after titration to increasing concentrations (0 → 10 µM) of compounds HL, 1, and 2 (a, b, and c, respectively).
Inorganics 13 00213 g010
Figure 11. The emission spectra of BSA (1 µM) at λex = 280 nm after titration (0→0.1 µM) with compounds HL, 1, and 2 (a, b, and c, respectively); the dotted red lines show the hypsochromic effect in each titration. The arrows show the emission intensity changes upon the increasing concentrations of compounds.
Inorganics 13 00213 g011
Figure 12. The synthetic route of the ligand (HL): (a) 2,6-dibromopyridine; (b) hydrazine monohydrate; (c) 2-bromo-6-hydrazinylpyridine; (d) salicylaldehyde.
Inorganics 13 00213 g012
Figure 13. General procedure for the synthesis of coordination compounds [Cu(L)(NO3)] (1); [Ni(L)2] (2). Proposed structures for 1 and 2.
Inorganics 13 00213 g013
Table 1. Summarized crystallographic data.
Compound(E)-2-((2-(6-Bromopyridin-2-yl)hydrazono)methyl)phenol
Emp. FormulaC12H10BrN3O
FW (g/mol)292.13
Temp. (K)293
λ (Å)MoKα = 0.71073
Crystal systemOrthorhombic
Space groupPbca
a (Å)5.7564(1)
b (Å)12.4294(4)
c (Å)32.2384(10)
α (°)90
β (°)90
γ (°)90
Volume (Å3)2306.61(11)
Z8
ρ calcd (mg/m3)1.683
Abs.Coeff (mm−1)3.550
F(000)1168
θ range (°)3.3 to 26.4
Reflections collected/unique [R(int)]18,864/2345 [0.124]
Completeness (%)99.5
Data/restraints/parameters2345/0/156
Gof on F20.956
R1 [I > 2σ(I)]0.0476
wR2 [I > 2σ(I)]0.1342
Table 2. MIC values against Gram-positive (S. aureus, L. monocytogenes, and B. cereus) and Gram-negative (E. coli, S. typhimurium, and P. aeruginosa) bacteria (μg/mL).
CompoundS. aureus ATCC25923L. monocytogenes ATCC19115B. cereus ATCC10876E. coli ATCC25922S. typhimurium ATCC14028P. aeruginosa ATCC 27853
HL>1000>1000>250>500>1000>2000
1>250>500>62.5>250>250500
2125>25062.525062.5250
Cp *<3.9<3.9<3.9<3.9<3.9<3.9
AgNO3 *<5.0<5.0<5.0<5.0<5.0<5.0
* Drug control: ciprofloxacin (Cp) and silver nitrate (AgNO3).
Table 3. Stern–Volmer quenching constants (Ksv and kq), binding constant Kb, and binding sites for complex–BSA interactions (n) at room temperature for the BSA-1 and BSA-2 study systems.
K sv   × 10 5 M 1 k q   × 10 14 M 1 s 1 K b   × 10 5 M 1 n
BSA-HL8.928.926.710.89
BSA-111.3011.3012.201.07
BSA-29.909.907.300.92
Disclaimer/Publisher’s Note: The statements, opinions and data contained in all publications are solely those of the individual author(s) and contributor(s) and not of MDPI and/or the editor(s). MDPI and/or the editor(s) disclaim responsibility for any injury to people or property resulting from any ideas, methods, instructions or products referred to in the content.

