Abstract
The development of high-performance electrochromic materials demands innovative approaches to simultaneously control the nanoscale architecture and the electronic structure. We present a dual-modification strategy that synergistically combines copper doping with the Langmuir–Blodgett (LB) assembly to overcome the traditional performance trade-offs in tungsten oxide-based electrochromic systems. Cu-doped W18O49 nanowires with varying Cu concentrations (0–12 mol%) were synthesized hydrothermally and assembled into thin films via the LB technique, with LB precursors characterized by contact angle, surface tension, viscosity, and thermogravimetric-differential scanning calorimetry (TG-DSC) analyses. The films were systematically evaluated using scanning electron microscopy, X-ray photoelectron spectroscopy, chronoamperometry, and transmittance spectroscopy. Experimental results reveal an optimal Cu-doping concentration of 8 mol%, achieving a near-infrared optical modulation amplitude of 76.24% at 1066 nm, rapid switching kinetics (coloring/bleaching: 5.0/3.0 s), and a coloration efficiency of 133.00 cm2/C. This performance is speculated to be a balance between Cu-induced improvements in ion intercalation kinetics and LB-ordering degradation caused by lattice strain and interfacial charge redistribution, while mitigating excessive doping effects such as structural deterioration and thermodynamic instability. The work establishes a dual-modification framework for designing high-performance electrochromic interfaces, emphasizing the critical role of surface chemistry and nanoscale assembly in advancing adaptive optoelectronic devices like smart windows.
1. Introduction
The escalating global energy crisis and environmental challenges have intensified demands for energy-efficient technologies and sustainable functional materials, particularly in the field of optoelectronic devices. Electrochromic materials, capable of reversibly modulating optical properties under external electric fields, have emerged as pivotal components for smart windows, adaptive displays, and energy-saving coatings, offering transformative potential for reducing building energy consumption [1,2,3,4,5,6,7,8,9,10]. Among these materials, tungsten oxide (WO3) has distinguished itself as a frontrunner for next-generation electrochromic devices due to its high coloration efficiency, strong optical contrast, cost-effectiveness, and long-term operational stability [11,12].
Recent advancements have focused on doping strategies and optimized thin-film fabrication processes to enhance electrochromic performance. For instance, Yong et al. reported molybdenum-doped WO3 films achieving 55% optical modulation at 550 nm [13], while Nguyen et al. demonstrated 59% modulation via spin-coated WO3 [14]. However, persistent limitations in film uniformity, slow switching kinetics, and insufficient spectral coverage continue to impede their practical implementation. These challenges underscore an urgent need for innovative manufacturing strategies.
In this work, we address these limitations through the synergistic integration of two modification approaches: (1) precise engineering of W18O49 nanowires via copper (Cu) doping, and (2) the novel application of Langmuir–Blodgett (LB) assembly in thin-film fabrication. The LB technique [15,16,17], leveraging amphiphilic molecular self-organization at air-water interfaces, enables the deposition of ordered, homogeneous monolayers with controlled thickness—a critical advancement over conventional methods prone to inhomogeneity and impurity incorporation. By systematically regulating Cu-doping concentrations (0%, 4%, 8%, 12%), we achieved exceptional electrochromic performance, including a 76.24% modulation amplitude at 1066 nm (near-infrared, NIR), rapid switching kinetics (5.0 s coloration and 3.0 s bleaching), and a coloration efficiency of 133.00 cm2/C.
Furthermore, extending electrochromic activity to the NIR spectrum [18,19,20,21,22] represents a strategic imperative, given that nearly 50% of solar energy resides in this region. For instance, Zhou et al. reported WO3/Ag NW films achieving 68.3% of optical modulation at 1100 nm [23], while Huang et al. demonstrated 72% modulation at 1200 nm via hydrothermal WO3 nanosheets [24]. Our Cu-doped W18O49 films, fabricated via LB technology, also effectively address this requirement by demonstrating robust NIR modulation capabilities that synergize energy-saving benefits with radiative thermal control. This study not only advances the fundamental understanding of doping-engineered electrochromism but also establishes a scalable paradigm for multifunctional smart coatings in sustainable architecture and adaptive optics, bridging material innovation with practical energy management solutions.
2. Materials and Methods
2.1. Material and Reagent Information
Tungsten hexachloride (WCl6, 99.9%), polyvinylpyrrolidone (PVP, average molecular weight 2500, K12), copper(II) chloride dihydrate (CuCl2·2H2O, 99%), n-hexane (99%), anhydrous ethanol (99.5%), and propylene carbonate (PC, 99%) were procured from Macklin Biochemical Co., Ltd. (Shanghai, China). Lithium perchlorate (LiClO4, 99%) was supplied by Tongyuan Chemical Co., Ltd. (Guangzhou, China). Indium tin oxide (ITO)-coated glass substrates (1 × 1 cm2, 2 × 2 cm2; sheet resistance: 10 Ω/cm2) were purchased from New Vision Optoelectronics Technology Co., Ltd. (Guangzhou, China). All chemicals were used as received without further purification.
2.2. Fabrication of Thin Films and Devices
2.2.1. Synthesis of W18O49 Nanowires
Four batches of precursors were prepared by dissolving 0.125 g WCl6, 0.003 g PVP, and varying masses of CuCl2·2H2O (0 g, 0.0021 g, 0.0043 g, and 0.0064 g, corresponding to Cu molar ratios of 0%, 4%, 8%, and 12%, respectively) in 50 mL anhydrous ethanol under magnetic stirring until complete dissolution. Each solution was diluted to 150 mL with ethanol and transferred into a Teflon-lined autoclave for hydrothermal treatment at 180 °C for 10 h. The resulting suspensions were centrifuged at 8000 rpm for 5 min, after which the supernatant was discarded, and the blue gel-like precipitates were collected for subsequent use.
2.2.2. Preparation of LB Solutions
The nanowire gels from each doping group were redispersed in 2 mL ethanol and 4 mL n-hexane, followed by homogenization via mechanical stirring. The mixtures were sonicated for 2 min in a 200 mL water-filled beaker and aged for 24 h to stabilize the colloidal suspensions.
2.2.3. LB Film Deposition
Figure 1 shows the experimental steps and the schematic diagram of the LB method for film formation. ITO substrates were ultrasonically cleaned sequentially in deionized water, ethanol, and water (10 min each) and dried under nitrogen. Then, 0.6 mL of the aged LB dispersion was spread onto a 30 mL deionized water subphase in a 50 mL beaker. After 5 min of solvent evaporation, ITO substrates were vertically immersed into the subphase at a 30° angle and withdrawn at a controlled speed (1 min immersion and 1 min withdrawal) to deposit monolayers. Substrates were air-dried to evaporate residual solvent and annealed at 150 °C for 1 min (single-layer films for SEM) or 30 min (7-layer films for device integration). Film deposition was performed on the glass side of 1 × 1 cm2 substrates and the ITO side of 2 × 2 cm2 substrates.
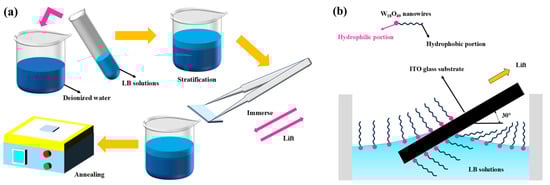
Figure 1.
LB film formation: (a) experimental process, (b) mechanism.
2.2.4. Device Assembly
Electrochromic devices were fabricated by sandwiching the LB-coated ITO substrate (2 × 2 cm2) with a bare ITO substrate using conductive adhesive, creating an active area of ~1.5 cm2. The interlayer was filled with 1.5 mol/L LiClO4-PC electrolyte to complete the “sandwich” structure.
2.3. Characterization and Analytical Methods
2.3.1. LB Precursor Solution Analysis
Interfacial Properties: Surface tension and contact angles were measured using an Attension Theta Lite optical tensiometer (TL200, Biolin Scientific, Gothenburg, Sweden).
Viscosity: Determined with a HAAKE MARS 40 rheometer (Thermo Scientific, Waltham, MA, USA) at 25 °C (Contact angle, surface tension and viscosity were tested three times).
Thermogravimetric-Differential Scanning Calorimetry (TG-DSC): Conducted on a STA 449 F5 instrument (NETZSCH, Selb, Germany) from 25 °C to 400 °C at 10 °C/min under nitrogen flow.
2.3.2. Thin Film and Device Characterization
Morphology: Surface topography was imaged by scanning electron microscopy (SEM, EVO18, Carl Zeiss AG, Oberkochen, Germany) at 20,000× magnification.
Chemical Composition: X-ray photoelectron spectroscopy (XPS, Thermo Fisher Scientific, Waltham, MA, USA) with Al Kα radiation (1486.6 eV).
Electrochemical Performance: Cyclic chronoamperometry (CA) (±2.5 V, 30 s per cycle, 5 cycles) using a CHI660E electrochemical workstation (CHI660E, CH Instruments, Shanghai, China).
Optical Modulation: Transmittance spectra at 550, 600, 700, 800, 900, 1000, 1066 nm were recorded with a microspectrometer (Morpho PG2000, Shanghai, China). Optical modulation amplitude, switching times, and coloration efficiency were calculated using synchronized electrochemical-optical data.
3. Results and Discussion
3.1. Interfacial Properties
The contact angle measurements (Figure 2a–d) demonstrate favorable wettability of the LB solutions on ITO substrates (contact angles < 90°), facilitating uniform thin-film spreading. Low-concentration Cu-doping (4%) increased the contact angle, whereas higher doping levels (>4%) further reduced the contact angle and enhanced substrate wettability. This behavior is corroborated by the surface tension and viscosity trends (Figure 2e–f): 4% Cu-doping marginally elevated both parameters, while higher doping concentrations monotonically decreased them.
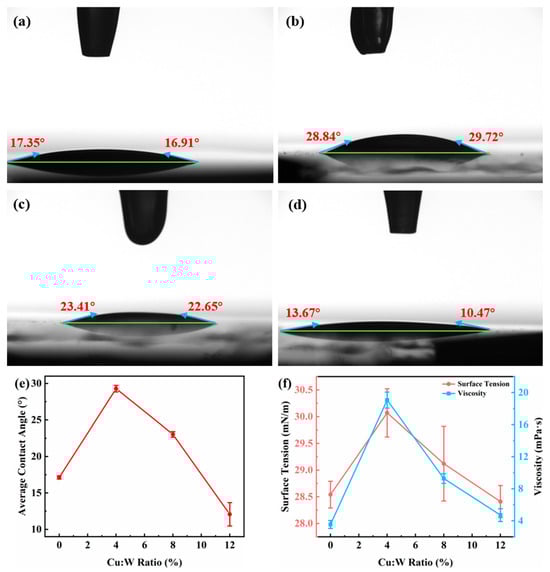
Figure 2.
Interfacial properties of W18O49 nanowire LB precursor solutions with different copper doping concentrations—contact angle: (a) 0%, (b) 4%, (c) 8%, (d) 12%, (e) contact angle line chart, (f) line chart of surface tension and viscosity. In figures (a–d), the horizontal green baseline represents the surface of the ITO substrate, and the angle between the blue arrow and the green baseline is the contact angle, which is marked in red.
The directional patterns in the experimental data suggest a competitive interplay between the two modification mechanisms—Cu-doping and LB-derived film formation—which necessitates the existence of a synergistic concentration threshold for optimal electrochromic performance. Subsequently, this critical concentration value will be determined through comprehensive characterization.
3.2. TG-DSC Analysis
As illustrated in Figure 3, the thermogravimetric-differential scanning calorimetry (TG-DSC) profiles of copper-doped W18O49 nanowire LB precursor solutions exhibit similar trends across varying doping concentrations. The DSC curves reveal an endothermic peak near 100 °C, while the TG curves display a monotonic mass loss from room temperature to ~110 °C, attributable to the evaporation of ethanol and n-hexane (boiling points: 78 °C and 69 °C, respectively). Above 110 °C, the TG curves plateau, indicating thermal stability of the residual material. The absence of additional endothermic or exothermic transitions in the DSC profiles confirms no phase transformations occurred during the heating process [25].
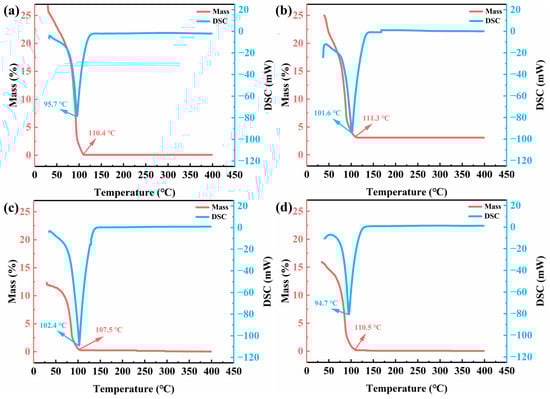
Figure 3.
TG-DSC curves of W18O49 nanowire LB precursor solutions with different copper doping concentrations: (a) 0%, (b) 4%, (c) 8%, (d) 12%.
Notably, the 8% Cu-doped sample demonstrates the highest endothermic peak temperature (102.4 °C) in the DSC analysis, suggesting that solvent evaporation requires greater energy input, which reflects enhanced thermodynamic stability. This phenomenon is speculated to arise from optimized W18O49 crystal structures at moderate Cu-doping levels, characterized by reduced porosity and strengthened solvent molecule adsorption on the material surface. Such thermodynamic stability is critical for LB film fabrication, as it ensures a controlled solvent evaporation process, promoting the formation of uniform and dense thin films. The resulting compact nanostructure facilitates continuous electron transport pathways while optimizing ion insertion/extraction kinetics, thereby collectively enhancing electrochromic performance. This result indicates that 8% may be the optimal synergistic concentration to be determined, but other characterization methods are still needed for comprehensive judgment.
3.3. SEM Morphology
Scanning electron microscopy (SEM) analysis revealed distinct structural evolution in Cu-doped W18O49 thin films (Figure 4). All films exhibited interconnected nanowire networks, a morphology favorable for electrochromic applications due to their high surface area, which facilitates abundant Li+ intercalation sites and shortened ion diffusion pathways. Compared to spin-coated films, LB-assembled films demonstrated significantly improved nanowire alignment overall, indicative of optimized assembly kinetics.
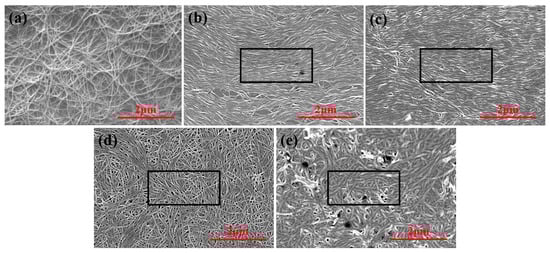
Figure 4.
SEM images of W18O49 thin films with different copper doping concentrations: (a) spin coating method (0%); LB method: (b) 0%, (c) 4%, (d) 8%, (e) 12%. The black rectangular box is the selection area for evaluating the orderliness of orientation.
The structural ordering of Cu-doped W18O49 nanowires was quantitatively assessed by analyzing SEM images using Image Pro Plus software (v6.0, Media Cybernetics, 10 Eunos Road 8, Singapore). A rectangular region (2.5 × 1.2 μm2) was selected to calculate the alignment ratio, defined as the percentage of nanowires oriented within ±10° of the dominant alignment axis relative to the total nanowire count in the region. The alignment ratio systematically decreased with increasing Cu-doping concentration: 65.24% for 0% Cu (pristine), 50.65% for 4% Cu, 40.92% for 8% Cu, and 20.54% for 12% Cu. This structural degradation is attributed to two primary mechanisms:
- (1)
- Lattice strain effects: Cu ions occupying interstitial sites or substituting W atoms within the W18O49 lattice induce local lattice distortions. Such strain perturbations disrupt the anisotropic growth dynamics of one-dimensional nanowires, destabilizing their ordered assembly.
- (2)
- Interfacial charge redistribution: Doping alters the surface charge characteristics of nanowires [26], perturbing the critical electrostatic equilibrium required for LB orientation at the air-liquid interface and introducing defects in monolayer stacking.
The interplay between atomic-scale lattice strain and mesoscale charge imbalance underscores the sensitivity of LB assembly to dopant-induced perturbations, emphasizing the necessity for precise doping control in nanofilm engineering.
Significantly, Figure 4e shows localized dark spots in the 12% Cu-doped film, suggesting that excessive doping may compromise surface quality through heterogeneous phase segregation or impurity accumulation. Cross-referencing SEM observations with DSC data (Figure 3), we deduce that the optimal synergistic Cu-doping concentration lies near 8%.
3.4. XPS Analysis
X-ray photoelectron spectroscopy (XPS) surveys (Figure 5) confirm the elemental composition of W, O, Cu, and trace C/Si in all films. The Si signal originates from the ITO substrate, while residual carbon (C 1s at 284.8 eV) stems from incomplete solvent evaporation during annealing, as evidenced by localized film blackening at excessive temperatures (>150 °C). Notably, Cu 2p 3/2 peaks emerge at 931.5–932.8 eV (Figure 5a–d insets), with peak intensity scaling linearly with nominal doping concentrations, verifying controlled Cu incorporation into the W18O49 matrix.
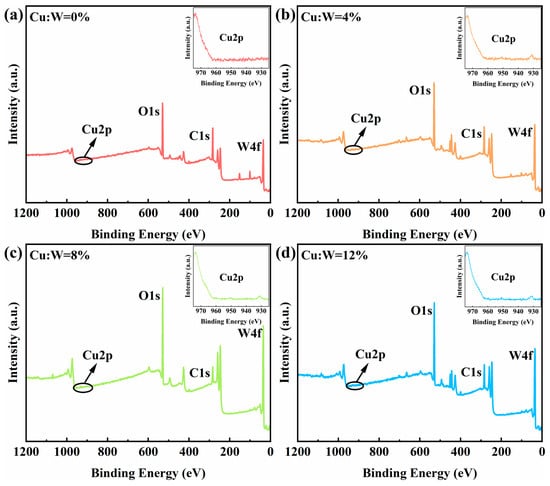
Figure 5.
XPS spectra of W18O49 thin films with different copper doping concentrations: full spectra and Cu 2p spectra. (a) 0%, (b) 4%, (c) 8%, (d) 12%.
The calculated O/W atomic ratio (~2.81) slightly exceeded the stoichiometric W18O49 value (2.72), attributed to the oxygen contribution of hydroxyl groups adsorbed on the substrate and surface, but also largely confirmed the elemental composition of W18O49. O 1s deconvolution (Figure 6) quantifies lattice oxygen (529.43 ± 0.1 eV) and oxygen vacancies (530.51 ± 0.1 eV) [27,28]. As the concentration of copper doping increases, the concentration of oxygen vacancies first decreases and then increases, reaching a minimum relative content of 8%, indicating that copper ions occupy the positions of oxygen vacancies to the maximum extent at this copper doping concentration, providing a higher density of coloring sites per unit area. This also proves that the 8% is likely to be the optimal synergistic doping concentration.
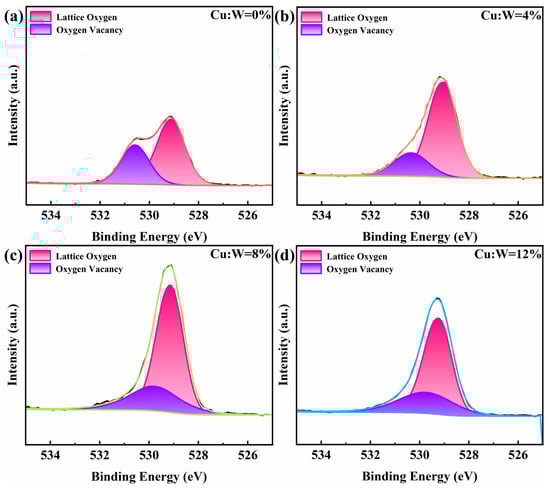
Figure 6.
XPS spectra of W18O49 thin films with different copper doping concentrations: O 1s spectra. (a) 0%, (b) 4%, (c) 8%, (d) 12%. The four different colors “red, orange, green, and blue” represent the fitting peak shapes of the experimental groups with copper doping concentrations of “0%, 4%, 8%, and 12%”, respectively.
3.5. Electrochemical Performance
The electrochemical dynamics of Cu-doped W18O49 electrochromic devices were investigated via chronoamperometry (CA) under ± 2.5 V cycling (Figure 7). All devices exhibit rapid current stabilization within 2–3 s during both coloration (negative bias) and bleaching (positive bias) phases, indicative of efficient double-layer charging and fast Faradaic charge transfer kinetics. When a step voltage is applied, the larger the sudden change value of the current, the faster the insertion/extraction rate of ions in the thin film, and the smaller the charge transfer resistance. The decrease in the sudden change value of current may reflect an increase in interface resistance or obstruction of ion diffusion, indicating the deterioration of material structure. Based on the above comparative analysis, the film doped with 8% copper exhibits a comprehensive combination of high-ion transport speed and strong stability, demonstrating excellent electrochemical performance. At other doping concentrations, the instability of current mutation values may be due to the inability of LB assembly process to maintain a defect minimized single-layer structure due to dopant interference, resulting in locally dense/sparse regions. This morphological heterogeneity will increase the charge transfer resistance.
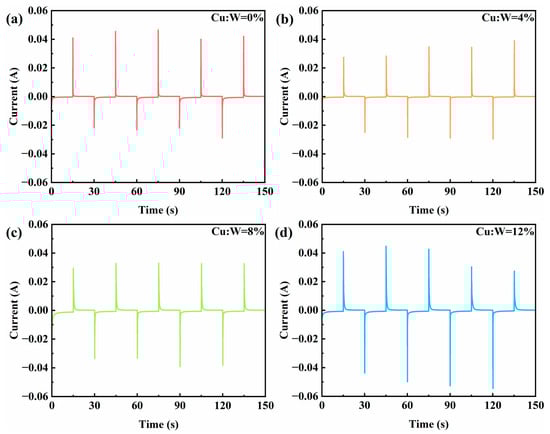
Figure 7.
Current–time curves of W18O49 thin film devices with different copper doping concentrations: (a) 0%, (b) 4%, (c) 8%, (d) 12%.
3.6. Optical Modulation and Device Metrics
Figure 8 quantifies the electrochromic response of devices through synchronized transmittance–time profiling. Key performance metrics were calculated as follows:
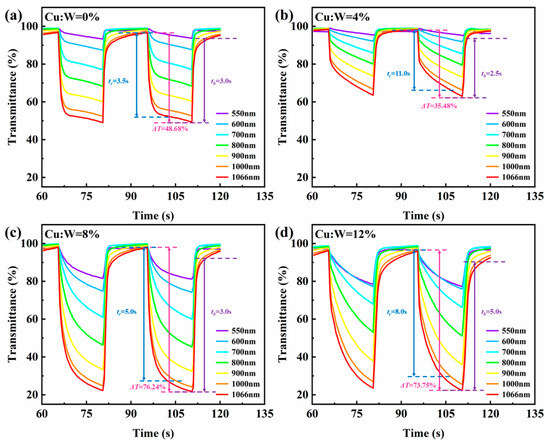
Figure 8.
Transmittance–time curves of W18O49 thin film devices with different copper doping concentrations: (a) 0%, (b) 4%, (c) 8%, (d) 12%.
- Optical modulation amplitude:
- Switching time:
- Coloration efficiency:
As shown in Figure 9 and Table 1, device performance exhibits a volcano-type dependence on Cu concentration. The longer the testing band of the device, the greater the modulation amplitude. At the testing wavelength of 1066 nm, the optimal comprehensive optical performance index was achieved when doped with 8% copper: (ΔT = 76.24%, tc = 5.0 s, tb = 3.0 s, η = 133.00 cm2/C). By combining the electrochemical and optical performance tests of the device, it can be determined that the optimal synergistic concentration for achieving the best electrochromic performance through LB film formation and copper doping is 8%.
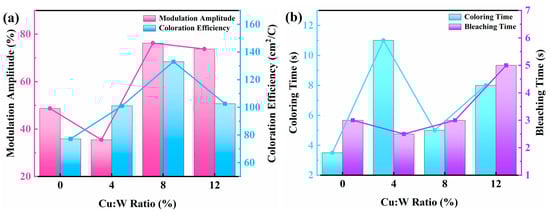
Figure 9.
Line chart: (a) modulation amplitude and coloration efficiency, (b) response time (coloring/bleaching).

Table 1.
Summary of device performance test data.
In summary, we further analyze and rationalize the existence of an optimal synergistic Cu-doping concentration in LB-assembled W18O49 films through the interplay of two competing mechanisms:
- (1)
- Copper doping increases coloring sites: When the copper doping concentration is ≤8%, increasing the copper doping concentration will introduce additional redox active centers, thereby increasing the number of available color development sites and improving the charge storage capacity, enhancing the electrochromic performance. When the copper doping exceeds 8%, the performance degradation originates from a critical point where structural degradation (SEM), defect site competition (XPS), and thermodynamic instability (TG-DSC) outweigh the benefits of increased redox active sites.
- (2)
- LB-order degradation: According to the quantitative analysis of the orderliness of SEM images, higher doping levels disrupt the LB-driven structural alignment of nanowires, leading to reduced ordering and a corresponding decline in coloration site density per unit area, which detrimentally impacts ion diffusion kinetics and optical modulation efficiency.
When the doping concentration is low (≤4%), the degradation of the orderliness of LB films plays a dominant role in affecting their performance, resulting in a decrease in modulation amplitude when doped with 4% copper compared to when not doped with copper. When the doping concentration is high (4–8%), copper doping increases the dominant role of coloring sites and significantly increases the modulation amplitude. When the doping concentration is too high (>8%), the damage to performance caused by excessive doping exceeds the gain of the increase in coloring sites, resulting in a slight decrease in modulation amplitude.
The intersection of these competing curves defines the optimal Cu-doping threshold (around 8%) (Figure 10). At this critical concentration, the improvement of ion intercalation kinetics caused by doping is balanced with the degradation of LB ordering caused by lattice strain and interface charge redistribution, while avoiding the adverse effects of excessive doping.
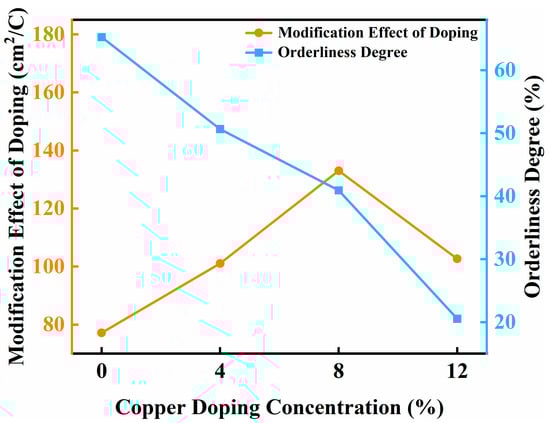
Figure 10.
Speculation on the mechanism of synergistic copper doping concentration.
This speculative mechanistic framework aligns with experimental observations and underscores the necessity of balancing atomic-scale doping effects with nanoscale assembly control for designing high-performance electrochromic systems. The identified 8% Cu-doping level represents a “sweet spot” where competing electronic, ionic, and structural factors achieve mutual optimization, offering a universal guideline for defect engineering in nanostructured functional coatings.
In future improvements, conductivity testing, electrochemical impedance testing and Raman spectroscopy testing can be combined to further analyze the mechanism of the synergistic effect. In addition, due to the use of manual pulling in the LB film formation process in this study, the repeatability is not ideal, and it is difficult to prepare on a large scale. Machine pulling can be used for future improvements.
Table 2 summarizes some recent related studies and compares our research results.
Table 2.
Comparison between this study and other studies.
4. Conclusions
This study demonstrates a new manufacturing strategy for high-performance near-infrared (NIR) electrochromic devices by comprehensively using LB film formation and copper doping to modify W18O49 nanowire thin films. The system optimization of copper doping concentration showed that an 8% copper doped device achieved an excellent near-infrared modulation index at 1066 nm: 76.24% light modulation amplitude, fast switching kinetics (coloring: 5.0 s, bleaching: 3.0 s), and excellent coloration efficiency (133.00 cm2/C), making it the optimal synergistic concentration for achieving excellent comprehensive electrochromic performance. At this critical concentration, it is speculated that the improvement in ion intercalation kinetics caused by doping is balanced with the degradation of LB ordering caused by lattice strain and interface charge redistribution, while avoiding the adverse effects of excessive doping. The observed near-infrared selective electrochromic response makes W18O49 a promising candidate for spectral selective smart windows, meeting the key requirements of thermal management without compromising visible transparency. This work provides a material design blueprint that goes beyond traditional visible light with electrochromic properties and has a direct impact on energy-efficient buildings and adaptive optics systems.
Author Contributions
Conceptualization, Y.W. and H.N.; data curation, Y.W.; formal analysis, Y.W.; funding acquisition, H.N. and R.Y.; investigation, M.L.; methodology, Y.W.; project administration, J.P.; resources, H.N.; software, R.L.; supervision, H.N. and R.Y.; validation, Y.W., R.L., and Z.Z.; visualization, Y.W.; writing—original draft, Y.W., R.H., J.W., M.P., and R.Z.; writing—review and editing, H.N. and R.Y. All authors have read and agreed to the published version of the manuscript.
Funding
This work was funded by National Key R&D Program of China (No.2021YFB3600604), National Natural Science Foundation of China (Grant No.62174057 and 22090024), Guangdong Natural Science Foundation (No.2024A1515012216 and 2023A1515011026), Educational Commission of Guangdong Province (Grant Nos.2022ZDZX1002), Key R&D Plan of Guangdong Province (2022B0303010001), State Key Lab of Luminescent Materials and Devices (Skllmd-2024-05), Southwest Institute of Technology and Engineering Cooperation Fund (HDHDW59A020301), and the 2025 Hundred Step Ladder Climbing Program (j2tw202502026).
Institutional Review Board Statement
Not applicable.
Informed Consent Statement
Not applicable.
Data Availability Statement
Data are contained within the article.
Conflicts of Interest
The authors declare no conflicts of interest.
References
- Wang, Y.; Zhang, Z.; Wang, Z.; Zuo, Y.; Zhou, H.; Sun, D.; Li, Y.; Yan, Y.; Feng, T.; Xie, A. Self-seeded growth of hexagonal-phase WO3 film by a one-step hydrothermal method for high-performance electrochromic energy storage devices. J. Power Sources 2025, 633, 236350. [Google Scholar] [CrossRef]
- Huang, S.; Guo, H.; Xia, P.; Sun, H.; Lu, C.; Feng, Y.; Zhu, J.; Liang, C.; Xu, S.; Wang, C. Integrated device of luminescent solar concentrators and electrochromic supercapacitors for self-powered smart window and display. Nat. Commun. 2025, 16, 2085. [Google Scholar] [CrossRef] [PubMed]
- Jiao, K.; Zhang, Z.; Liu, Y.; Li, J.; Xue, C.; Zhang, J.; Chen, Y.; Chen, Z.; Hou, X.; Zhang, L.; et al. Carbon nanotube-based solid-state mid-infrared electrochromic devices for smart outdoor thermal management. Chem. Eng. J. 2025, 507, 160802. [Google Scholar] [CrossRef]
- Ding, Y.; Qiu, Q.; Jiang, M.; Li, Y.; Shi, J.; Du, L.; Li, C.; Wang, J.; Li, Z. Ti3C2Tx MXene-mediated synthesis of a prussian blue nanocomposite film for a flexible large-area electrochromic device. ACS Appl. Mater. Interfaces 2025, 17, 15657–15665. [Google Scholar] [CrossRef] [PubMed]
- Gillissen, F.; Lobet, M.; Dewalque, J.; Colson, P.; Spronck, G.; Gouttebaron, R.; Duttine, M.; Faceira, B.; Rougier, A.; Henrard, L.; et al. Mixed molybdenum-tungsten oxide as dual-band, VIS-NIR selective electrochromic material. Adv. Opt. Mater. 2025, 13, 2401995. [Google Scholar] [CrossRef]
- Huang, Z.; Peng, Y.; Zhao, J.; Zhang, S.; Qi, P.; Qu, X.; Yan, F.; Ding, B.; Xuan, Y.; Zhang, X. An efficient and flexible bifunctional dual-band electrochromic device integrating with energy storage. Nano Micro Lett. 2025, 17, 98. [Google Scholar] [CrossRef]
- Xu, H.; Haider, I.; Zheng, Y.; Li, W.; Zhuiykov, S.; Cui, Y. Towards the solid-state electrochromic devices: Platform based on transparent and flexible solid polymer electrolyte. Chem. Eng. J. 2025, 508, 161116. [Google Scholar] [CrossRef]
- Wang, Z.; Liu, G.; Li, C.; Qiao, M.; Tian, M.; Lin, X.; Cui, W.; Wang, X.; Liu, J.; Xu, S. W/WO3/TiO2 multilayer film with elevated electrochromic and capacitive properties. Materials 2025, 18, 161. [Google Scholar] [CrossRef]
- Yaseen, M.; Khattak, M.A.; Khan, A.; Bibi, S.; Bououdina, M.; Usman, M.; Khan, N.A.; Pirzado, A.A.; Abumousa, R.A.; Humayun, M. State-of-the-art electrochromic thin films devices, fabrication techniques and applications: A review. Nanocomposites 2024, 10, 1–40. [Google Scholar] [CrossRef]
- Chen, D.; Chua, M.; He, Q.; Zhu, Q.; Wang, X.; Meng, H.; Xu, J.; Huang, W. Multifunctional electrochromic materials and devices recent advances and future potential. Chem. Eng. J. 2025, 503, 157820. [Google Scholar] [CrossRef]
- Li, M.; Hou, M.; Wu, Y.; Li, X.; Guo, C.; Ning, H.; Li, Z.; Lu, K.; Yao, R.; Peng, J. Preparation and performance optimization of Ag-ITO composite electrode in electrochromic devices. SID Symp. Dig. Tech. Pap. 2024, 55, 1119. [Google Scholar] [CrossRef]
- Wu, H.; Ning, H.; Li, M.; Guo, C.; Li, X.; Qiu, T.; Xu, Z.; Luo, C.; Yao, R.; Peng, J. Cu-doped W18O49 nanowire reticular films for electrochromic supercapacitors. APL Mater. 2023, 11, 111120. [Google Scholar] [CrossRef]
- Yong, W.; Chen, N.; Xiong, T.; Fu, G. Development of high-performance Mo-doped WO3 photo-electrochromic devices. Mater. Today Chem. 2024, 38, 102095. [Google Scholar] [CrossRef]
- Nguyen, T.V.; Huynh, K.A.; Le Quyet, V.; Kim, H.; Ahn, S.H.; Kim, S.Y. Highly stable electrochromic cells based on amorphous tungsten oxides prepared using a solution-annealing process. Int. J. Energy Res. 2021, 45, 8061–8072. [Google Scholar] [CrossRef]
- Kondalkar, V.V.; Yang, S.S.; Patil, P.S.; Choudhury, S.; Bhosale, P.N.; Lee, K. Langmuir-Blodgett assembly of nanometric WO3 thin film for electrochromic performance: A new way. Mater. Lett. 2017, 194, 102–106. [Google Scholar] [CrossRef]
- Orman, E.B.; Koca, A.; Özkaya, A.R.; Gürol, I.; Durmus, M.; Ahsen, V. Electrochemical, spectroelectrochemical, and electrochromic properties of lanthanide bis-phthalocyanines. J. Electrochem. Soc. 2014, 161, H422–H429. [Google Scholar] [CrossRef]
- Gu, W.; Li, Q.; Wang, R.; Zhang, L.; Liu, Z.; Jiao, T. Recent progress in the applications of Langmuir–Blodgett film technology. Nanomaterials 2024, 14, 1039. [Google Scholar] [CrossRef]
- Zhai, Y.; Li, J.; Shen, S.; Zhu, Z.; Mao, S.; Xiao, X.; Zhu, C.; Tang, J.; Lu, X.; Chen, J. Recent advances on dual-band electrochromic materials and devices. Adv. Funct. Mater. 2022, 32, 2109848. [Google Scholar] [CrossRef]
- Bai, T.; Li, W.; Fu, G.; Zhang, Q.; Zhou, K.; Wang, H. Dual-band electrochromic smart windows towards building energy conservation. Sol. Energy Mater. Sol. Cells 2023, 256, 112320. [Google Scholar] [CrossRef]
- Cao, S.; Zhang, S.; Zhang, T.; Yao, Q.; Lee, J. A visible light-near-infrared dual-band smart window with internal energy storage. Joule 2019, 3, 1152–1162. [Google Scholar] [CrossRef]
- Li, R.; Lan, F.; Tang, L.; Huang, Y.; Zhao, S.; Wang, B.; Han, Y.; Gao, D.; Jiang, Q.; Zhao, Y.; et al. A local-dissociation solid-state polymer electrolyte with enhanced Li+ transport for high-performance dual-band electrochromic smart windows. Adv. Funct. Mater. 2025, 35, 2419357. [Google Scholar] [CrossRef]
- Wang, J.; Wang, Z.; Cui, L.; Zhang, M.; Huo, X.; Guo, M. Visible-near infrared independent modulation of hexagonal WO3 induced by ionic insertion sequence and cavity characteristics. Adv. Mater. 2024, 36, 2406939. [Google Scholar] [CrossRef] [PubMed]
- Zhou, K.; Wang, H.; Zhang, S.; Jiu, J.; Liu, J.; Zhang, Y.; Yan, H. Electrochromic modulation of near-infrared light by WO3 films deposited on silver nanowire substrates. J. Mater. Sci. 2017, 52, 12783–12794. [Google Scholar] [CrossRef]
- Huang, Q.; Liang, Y.; Cao, S.; Yang, Z. Morphology-dependent near-infrared electrochromic properties of tungsten oxide. Coatings 2023, 13, 344. [Google Scholar] [CrossRef]
- Thummavichai, K.; Wang, N.; Xu, F.; Rance, G.; Xia, Y.; Zhu, Y. In situ investigations of the phase change behaviour of tungsten oxide nanostructures. R. Soc. Open Sci. 2018, 5, 171932. [Google Scholar] [CrossRef]
- Ahmed, I.; Dastider, S.G.; Roy, A.; Mondal, K.; Haldar, K.K. Nitrogen doping in NiS/Ni3S4 nanowire-based electrocatalysts for promoting the second-order hydrogen evolution reaction. ACS Appl. Nano Mater. 2024, 7, 661–671. [Google Scholar] [CrossRef]
- Hai, G.; Huang, J.; Cao, L.; Jie, Y.; Li, J.; Wang, X.; Zhang, G. Influence of oxygen deficiency on the synthesis of tungsten oxide and the photocatalytic activity for the removal of organic dye. J. Alloys Compd. 2017, 690, 239–248. [Google Scholar] [CrossRef]
- Lu, D.; Chen, J.; Deng, S.; Xu, N.; Zhang, W. The most powerful tool for the structural analysis of tungsten suboxide nanowires: Raman spectroscopy. J. Mater. Res. 2008, 23, 402–408. [Google Scholar] [CrossRef]
- Zhao, Y.; Zhang, X.; Chen, X.; Li, W.; Wang, L.; Ren, F.; Zhao, J.; Endres, F.; Li, Y. Preparation of WO3 films with controllable crystallinity for improved near-infrared electrochromic performances. ACS Sustain. Chem. Eng. 2020, 8, 11658–11666. [Google Scholar] [CrossRef]
- Zhang, X.; Dou, S.; Li, W.; Wang, L.; Qu, H.; Chen, X.; Zhang, L.; Zhao, Y.; Zhao, J.; Li, Y. Preparation of monolayer hollow spherical tungsten oxide films with enhanced near infrared electrochromic performances. Electrochim. Acta 2019, 297, 223–229. [Google Scholar] [CrossRef]
Disclaimer/Publisher’s Note: The statements, opinions and data contained in all publications are solely those of the individual author(s) and contributor(s) and not of MDPI and/or the editor(s). MDPI and/or the editor(s) disclaim responsibility for any injury to people or property resulting from any ideas, methods, instructions or products referred to in the content. |
© 2025 by the authors. Licensee MDPI, Basel, Switzerland. This article is an open access article distributed under the terms and conditions of the Creative Commons Attribution (CC BY) license (https://creativecommons.org/licenses/by/4.0/).