Abstract
TiO2 nanoparticles were synthesized by a nitric acid-assisted sol–gel route using three different amounts of nitric acid (NA) (0, 0.05, and 0.10 mL HNO3) to investigate how controlled acid addition influences their structural, optical, and photocatalytic behavior under visible-light irradiation. X-ray diffraction and Raman spectroscopy confirmed the formation of phase-pure anatase TiO2, with slightly increased crystallinity and crystallite size upon NA incorporation. UV–Vis absorption and Tauc analysis revealed a systematic blue shift in the absorption edge accompanied by band-gap widening, attributed to electron–hole confinement and defect-state modification. Photoluminescence spectra showed enhanced visible emission with increasing acid content, indicating a higher density of oxygen vacancies and Ti3+ centers. SEM–EDX analysis verified homogeneous morphology, Ti–O stoichiometry, and the absence of extrinsic impurities. Although the TiO2 sample prepared with 0.10 mL of HNO3 (FNA) showed a wider band gap and slightly larger crystallite size, it still delivered the highest photocatalytic performance in methylene blue degradation, reaching about 74.8% removal after 240 min of visible-light exposure. This unexpected behavior can be explained by a defect-related mechanism in which NA promotes the formation of surface oxygen vacancies and Ti3+ sites. Because of these defects, new electronic states appear between the valence and conduction bands, allowing the material to absorb lower-energy light and improving how electrons interact with the dye.
1. Introduction
The rapid increase in global population, coupled with climate change and accelerated industrialization, has severely impacted water resources, generating a worldwide crisis in freshwater availability [1]. Around the world, access to safe water remains a serious challenge: about 1.2 billion people lack clean drinking water, and another 2.6 billion have no adequate sanitation. As a result, illnesses linked to contaminated water continue to affect mainly children and the elderly [2]. The textile industry is among the largest contributors to this problem. It is estimated that nearly 80% of the pollutants by this sector come from untreated wastewater released directly into rivers and lakes [3]. Each year, more than 70 million tons of synthetic dyes are manufactured, and the textile industry alone consumes over 10,000 tons of these compounds [4]. Among them, methylene blue (MB, C16H18ClN3S) is extensively employed across diverse industrial fields including textiles, plastics, paper, pharmaceuticals, leather, and cosmetics [5]. However, during the dyeing process only about 5% of MB effectively binds to fibers, while the remaining 95% is released as wastewater. Due to its stable aromatic structure, hydrophilic character, and high resistance to light, heat, and common chemical treatments, MB is not easily degraded by conventional wastewater purification processes [6]. Because methylene blue is highly stable, it tends to accumulate in water, leading to considerable environmental pollution. Its presence blocks sunlight from penetrating deep into the water, which weakens photosynthesis in algae and other aquatic plants [7]. Prolonged human exposure has been linked to possible mutagenic and carcinogenic outcomes [8]. Several remediation strategies have been investigated to remove MB from wastewater, including adsorption on activated carbon [9], ultrafiltration [10], reverse osmosis [11], chemical coagulation [12], and photocatalytic degradation [13]. Among these, photocatalysis has emerged as one of the most promising techniques, as it can mineralize organic pollutants into harmless end products such as carbon dioxide and water [14]. Titanium dioxide (TiO2) nanoparticles are the most widely studied photocatalysts, owing to their low cost, chemical stability, environmental safety, and strong photocatalytic performance [15]. A variety of synthetic routes have been explored for TiO2 preparation, including precipitation [16], hydrothermal [17], solvothermal [18], electrochemical [19], and sol–gel techniques. Among these methods, sol–gel synthesis is considered particularly attractive because it is simple, cost-effective, reproducible, and versatile, making it the preferred approach for fabricating TiO2 nanoparticles [20]. The photocatalytic efficiency of TiO2 is strongly affected by its crystal phase, surface area, porosity, and particle size [21]. In this regard, Ramazani et al. [22] investigated the influence of NA on TiO2 nanoparticle formation and demonstrated that increasing the amount of HNO3 (from 0 to 10 mL) resulted in larger nanocrystal sizes. Similarly, Wang et al. [23] compared the role of HCl, HNO3, and H2SO4 in TiO2 synthesis and found that HCl and HNO3 favor rutile phase formation, whereas H2SO4 promotes stabilization of the anatase phase.
In this work, TiO2 nanoparticles were synthesized by a nitric acid-assisted sol–gel method using three different amounts of NA (0, 0.05, and 0.10 mL HNO3). The resulting materials were characterized by XRD, Raman, UV–Vis, PL, and SEM–EDX analyses to establish the relationship between amounts of NA and the evolution of defects, band structure, and photocatalytic response. The degradation of methylene blue under visible light was tested to better understand how the material’s crystallinity, oxygen vacancies, and charge-transfer processes interact during photocatalysis. Based on the results, it seems clear that NA plays a dual role: it helps control the particle shape and at the same time generates structural defects that fine-tune the electronic properties of TiO2, which leads to better activity under visible light.
2. Results and Discussion
2.1. X-Ray Diffraction
Figure 1 shows the X-ray diffraction study to investigate the effects of varying NA on the structure and phase development of the TiO2. TiO2 nanoparticles (nps) without NA (SNA) with MNA and FNA in the 2θ range of 20° to 90° are shown in the X-ray diffraction (XRD) pattern. The Miller indices (hkl) of the peaks are (101), (103), (004), (112), (200), (105), (211), (204), (116), (220), (215), and (224) and the corresponding angles are 25.29°, 37.05°, 37.93°, 38.73°, 47.99°, 53.86°, 55.08°, 62.80°, 68.55°, 70.24°, 75.01°, 82.97°, respectively (JCPDS: 21-1272). A close-up view of the 33–42° region is presented in the inset of Figure 1. While the full XRD scan shows only the dominant (004) reflection, the magnified plot reveals additional diffraction features corresponding to the (103) and (112) planes. These peaks are too weak to be distinguished in the full-range diffractogram, but become evident upon zooming, indicating improved phase resolution in this region. Previous studies have reported that TiO2-based photocatalysts with the NA exhibit higher PA compared to TiO2 without NA [24]. Using the Scherrer Equation [25], the nanoparticles’ crystallite size was determined:
where is a constant (shape factor = 0.94), is the wavelength of the X-ray radiation source (Cu-Kα = 0.15406 nm), is the full width at half maximum (FWHM) of the peak (in radians), is half of the Bragg angle (in degrees), and is the crystallite size (in nm). The average calculated nanoparticle sizes of the various samples are presented in Table 1. The existence of NA is the cause of this rise in the average particle size. Leyva-Porras et at. mentioned that in their previous experiments varying NA and acetic acid both affected the crystal size and phase purity [26]. The following formula has been used to determine the X-ray density for each sample [27]:
where is the number of units per unit cell; in this case the anatase unit cell contains 4 molecules of TiO2. is the molecular mass, the molar mass of TiO2 is 79.866 g/mol. is Avogadro’s Number (6.022 × 10²³ mol−1), and is the unit cell volume (cm3), the cell parameters for TiO2 anatase is tetragonal so . The following formula is used to obtain the lattice constant in the case of a tetragonal crystal structure ( ) [28]:
in this way the lattice constants and were obtained, is the interplaner separation corresponding to miller indices , , . It is implied that the lattice parameters have changed by the peak shift seen towards lower diffraction angles. This is because the presence of NA can create flaws such oxygen vacancies and faulty surfaces, which can alter the nanoparticles’ lattice structure. Additionally, the following formula is used to determine the specific surface area of the anatase TiO2 nanoparticles along the strongest peak (101) [29]:
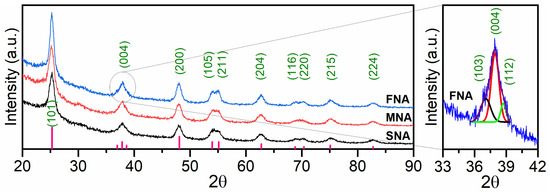
Figure 1.
XRD patterns of TiO2 thin films obtained with different NA volumes (0, 0.05, and 0.10 mL HNO3). The inset (33–42°) presents a magnified view of the main diffraction region, where the (101), (004), and (112) reflections become distinguishable, despite only the (004) peak being visible in the full-range pattern.

Table 1.
Parameters of the prepared samples.
is the X-ray density, and is the crystallite size determined by the Scherrer equation.
Table 1 shows that the average crystallite size of TiO2 increases slightly as the NA amounts rise, which corresponds to a reduction in the estimated surface area. This trend can be attributed to the enhanced condensation and growth of Ti–O–Ti networks under strongly acidic conditions, leading to more ordered anatase crystallites. Thus, the lower surface area in NA-treated samples does not directly cause the improved anatase phase; instead, both are consequences of the same process—acid-assisted crystallization that promotes higher structural order. Similar behavior has been reported for TiO2 synthesized under acid-mediated sol–gel conditions, where stronger acidity results in larger, more crystalline anatase domains with reduced surface area [30,31].
2.2. Raman Spectroscopy
The Raman spectra of the calcined TiO2 samples (Figure 2) display characteristic anatase modes: Eg (~145 cm−1), Eg (~198 cm−1), B1g (~398 cm−1), A1g/B1g (~519 cm−1), and Eg (~641 cm−1). A small blue shift (toward higher wavenumber) and peak broadening are observed in the Eg mode as the amounts of NA increases (SNA → MNA → FNA). Initially, we incorrectly interpreted such shifts as indicative of decreasing particle size, which contradicts the XRD data. However, the blue shift is more probable attributed to lattice strain or bond contraction in the TiO2 crystallites, or local structural distortion resulting from acid treatment or defect incorporation. This effect can coexist with an increase in average crystallite size detected by XRD, because Raman spectroscopy is sensitive to local stress, phonon confinement, and variations in bond force constants rather than overall size. Blue shifts in Raman peaks have been reported in TiO2 nanoparticles under compressive strain or in coated systems [32], as well as in systems where phonon confinement occurs in small or strained crystallites [33]. Therefore, the observed Raman shifts in our system reflect a combination of lattice microstrain and local bond modifications, not a decrease in crystal size.
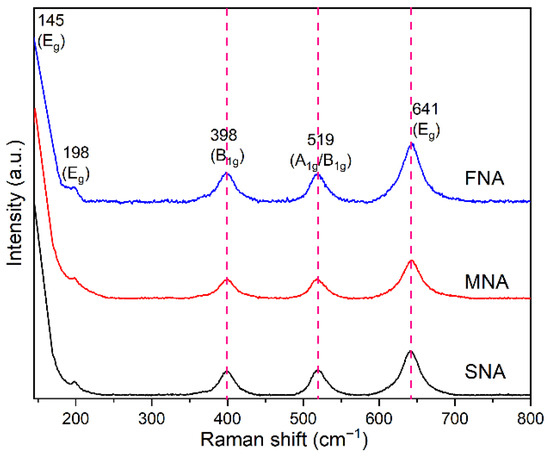
Figure 2.
Raman spectra of the samples SNA, MNA, and FNA.
2.3. UV-Vis
Since UV–Vis absorption is a non-destructive technique to probe the optical behavior of semiconductor nanostructures, we conducted a detailed analysis to understand the band-to-band and defect-mediated transitions. The absorption spectra of SNA, MNA, and FNA are shown in Figure 3a. The absorption edges appear at ~320 nm for SNA, and ~283 nm for both MNA and FNA. Notably, instead of shifting toward longer wavelengths, the absorption edge moves toward shorter wavelengths as the NA content increases. This is accompanied by an increase in crystalline size (from XRD) and increased structural modification or defect formation. We applied the Tauc method, (αhv)n = A(hν − Eg), where n = 1/2 for allowed direct transitions and n = 2 for allowed indirect transitions. By extrapolating the linear region to the photon-energy axis at α = 0, the band gaps were estimated (Figure 3b,c). In the direct transition case, the gap increases from ~3.52 eV (SNA) to ~4.06 eV (MNA, FNA). For indirect transitions, values shift from ~4.21 eV (SNA) to ~4.62 eV (MNA, FNA). Thus, NA incorporation appears to widen the optical band gap in both direct and indirect regimes. At first glance, widening of the band gap might suggest a reduced capacity to absorb visible light; however, the observed photocatalytic activity under visible irradiation may still be feasible through mid-gap defect states or sub-band transitions. NA treatment can induce oxygen vacancies, Ti3+ centers, or lattice distortions, creating localized states that absorb visible photons and facilitate charge transfer (defect-mediated absorption). Indeed, studies on TiO2 modification report that defect states can extend light harvesting into the visible region even when the bulk band gap is not reduced [34,35]. H.M. Mousa et al. reported that a band gap energy of around 3.52 eV in TiO2 plays a crucial role in enhancing electron transfer and thus supports the photodegradation process [36]. Similarly to our findings, other studies have also reported band gaps near 4.0 eV for TiO2 [37]. Likewise, A.N. Enyashin et al. described various anatase nanoforms with band gaps around 4.2 eV, and nanotubular TiO2 exhibiting an indirect band gap of approximately 4.5 eV [38]. These values are in excellent agreement with those obtained in the present work.
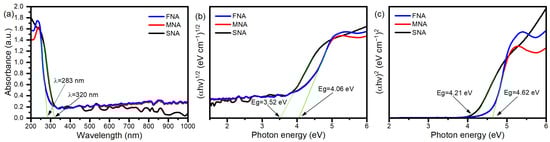
Figure 3.
(a) TiO2 nanoparticles’ UV-vis spectra; curves show the samples SNA, MNA, and FNA’s absorption intensities, (b) Indirect band transition Tauc plot, and (c) For a direct band transition.
2.4. Analysis of Photoluminescence Spectroscopy
To understand the electron–hole recombination behavior in the synthesized TiO2 nanoparticles, PL spectra were recorded at room temperature using a 325 nm excitation wavelength in the range 350–600 nm (Figure 4). Three main emission peaks were observed at 443 nm, 468 nm, and 534 nm. The blue emission at 443 nm is typically associated with self-trapped excitons in the TiO6 octahedra, while the emission near 468 nm arises from oxygen vacancies and Ti3+ defect centers. The green band centered at 534 nm is attributed to F+-type oxygen vacancies (an oxygen vacancy with one trapped electron) [39]. The FNA sample exhibits the highest PL intensity, indicating a higher density of radiative defect states and thus a greater rate of electron–hole recombination via radiative pathways. It can initially appear counterintuitive that a sample showing strong PL also exhibits significant photocatalytic performance. As noted by Chen et al. [40] and Nawaz et al. [41], oxygen vacancies and Ti3+ centers can serve both as radiative sites that enhance PL intensity and as active centers that promote charge separation and surface reactions. In this work, the samples treated with NA probably contain a greater number of defect states, which could explain the higher PL signal together with their improved photocatalytic behavior. Therefore, the PL behavior corroborates the UV–Vis and Raman analyses: NA treatment modifies the TiO2 lattice, generating defect-related energy levels that influence both optical transitions and photocatalytic behavior. We can infer that the enhancement in photoluminescence (PL) is primarily due to defect formation, rather than a reduction in recombination processes.
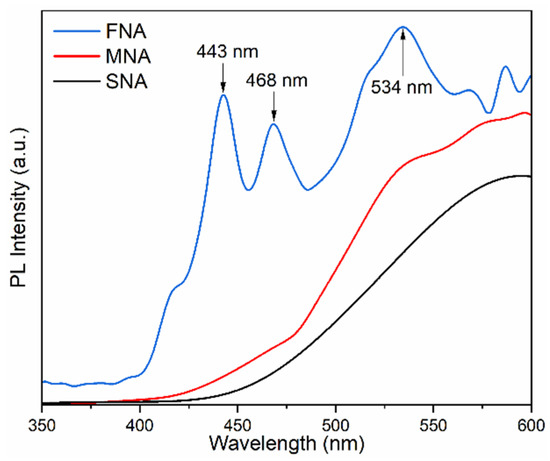
Figure 4.
Photoluminescence spectra of different samples.
2.5. Scanning Electron Microscopy (SEM)
The SEM micrographs (Figure 5a–c) illustrate the surface morphology of the TiO2 NPs. All three samples (SNA, MNA, FNA) show similar nanoparticulate shapes and the presence of agglomerates. No dramatic change in apparent particle size is discernible under the magnification used. Our data suggest that NA does not drastically alter gross morphology under these conditions. It is possible that NA acts partially as a capping or stabilizing agent, but not totally suppressing it (e.g., in related systems, selective adsorption of capping agents influences shape control) [42,43]. The EDX spectra (Figure 5d–f) confirm the presence of Ti and O in all samples, with no detectable impurities. The relative atomic percentages vary slightly; the oxygen content in the untreated sample (SNA) is somewhat lower than the theoretical 66.66%, which may reflect point defects such as oxygen vacancies. Upon addition of NA, the oxygen atomic percentage increases by ~1.6%. This modest increase may suggest that acid treatment influences surface. In sum, while the SEM images at current magnification do not show dramatic morphological contrast, the combined EDX and structural analyses (XRD, Raman, PL) support that NA modifies defect chemistry and crystallite growth more than large-scale shape or aggregation.
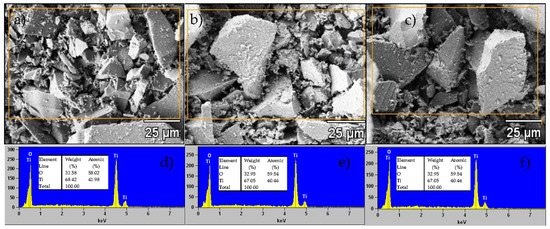
Figure 5.
SEM micrographs and EDS spectra of (a,d) SNA, (b,e) MNA, and (c,f) FNA samples.
2.6. Photodegradation of MB
From an environmental perspective, the chosen nanoparticles’ potential PA is crucial. Because of environmental concerns, TiO2 photocatalysts have gained significant attention for their ability to degrade organic contaminants. Numerous companies discharge a range of dyes into drinking water, which has detrimental consequences on the environment. During the dyeing process, 15–20% of the dyes are thought to be released into the environment [44]. The textile industry uses MB extensively to color its products out of all these dyes. It would be very important to use nanoparticles to break down these waste materials. We investigated the breakdown of MB dye under VL irradiation in order to assess the produced nanoparticles’ photocatalytic capabilities SNA, MNA, and FNA. In order to determine how the materials interacted with the dye before illumination, their adsorption capability was also assessed. The UV-Vis absorption spectra of MB photodegradation in the presence of the materials are shown in Figure 6a–c. Since only 0.27% (Figure 6a), 3.94% (Figure 6b), and 9.85% (Figure 6c) of the dye was removed in the dark before being exposed to VL, SNA, MNA, and FNA demonstrate a limited adsorption capacity of the sample.
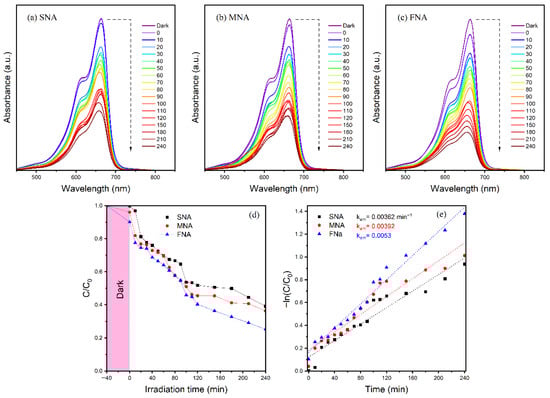
Figure 6.
(a–c) show the UV absorption spectra of MB deterioration under visible light irradiation at various interval times. (d) Photocatalytic MB degradation versus irradiation time. (e) First-order kinetics plots.
A significant factor in the photodegradation of MB is light. As the irradiation time increases, so does the photodegradation activity of SNA, MNA, and FNA nanomaterials. The reason for this is that photoelectrons are produced when visible light irradiation excites the valence electron. These incredibly potent photoelectrons create OH radicals, which are responsible for the photodegradation of MB. The effect of irradiation duration on MB photodegradation was examined in order to examine the photodegradation efficiency of nanomaterials at different time intervals. Under visible light, the experiment was conducted at ambient temperature. Samples were collected every 10 min for the first two hours, and then every 30 min after that. The findings are displayed in Figure 6d. A progressive decline in MB concentration was observed as the irradiation period increased. After 240 min, the degradation reached 60.82% for SNA, 63.66% for MNA, and 74.80% for FNA. These results indicate that the incorporation of the NA further promotes the photocatalytic process.
Although these results indicate that FNA is the most active photocatalyst, this outcome appears contradictory to its structural characteristics—namely, its larger crystallite size, wider band gap, and higher PL intensity, which theoretically should reduce photocatalytic performance. The apparent contradiction can be understood by taking into account the changes in defect structure caused by the NA treatment. The FNA sample likely possesses a higher density of surface oxygen vacancies and Ti3+ centers, which act as shallow trap states and reactive sites for interfacial charge transfer. These defect states create localized levels within the band gap, promoting sub-bandgap excitation and facilitating electron transfer from the conduction band (or from defect states) to adsorbed MB molecules. Consequently, although radiative recombination is more intense (as observed in PL), the presence of well-distributed surface defects increases the probability that photogenerated carriers are captured by MB before recombination occurs. Similar defect-mediated visible-light activity has been reported in TiO2 systems modified by controlled defect engineering [45]. Additionally, MB dye itself can act as a photosensitizer under visible light, transferring electrons into the conduction band of TiO2. This dye-sensitized mechanism is further enhanced by the defect-rich surface of FNA, which provides efficient charge-transfer pathways. Therefore, the superior photocatalytic performance of FNA is best explained as a synergistic effect of defect-mediated charge transfer and dye sensitization, rather than by its intrinsic band-to-band transitions alone.
According to the first-order equation [46], the photocatalytic degradation rate of dyes in heterogeneous photocatalytic systems under visible light irradiation can be represented as follows:
where is the kinetic discoloration rate constant, is time, and is the dye concentration at various irradiation durations and is the initial concentration. When ln(/) is plotted against (Figure 6e), the slope of the curve fitting line and the intercept provide the apparent rate constant for MB degradation. The photocatalytic degradation reaction likewise follows the pseudo first-order reaction, as indicated by the linear connection between ln(/) and . The apparent rate constants for SNA, MNA, and FNA catalysts were determined to be 0.00362, 0.00392, and 0.0053 min−1, respectively.
The active species on the surface of TiO2 often mineralize the organic dyes, either completely or partially, during the photocatalytic process. Positive holes and negative electrons occur on the catalyst surface when TiO2 is exposed to visible light energy, which excites the electrons from the lower valence band to the higher conduction band. Hydroxyl radicals are created when the hole combines with water or hydroxyl ions. Molecular oxygen can be reduced to superoxide anion by an electron in the conduction band () on the catalyst surface. The reactive species that will oxidize the organic molecules adsorbed on the oxide surface are thought to be hydroxyl (), hydrogen peroxides (), and superoxide () radicals [47]. To accomplish full mineralization, these produced radicals reacted with MB to produce a variety of intermediates, including radicals and radical cations, which resulted in the creation of CO2 and H2O. Babyszko et al. investigated the adsorption properties of photocatalysts before the irradiation process [48]. Results showed that during the adsorption process no desorption of MB occurred. Which is comparable to our results. Huang et al., with TiO2 nanoparticles in their 120 min degradation experiment, managed to obtain a value close to 70% [49].
2.7. Proposed Mechanism for Visible-Light MB Degradation by TiO2
Given the wide bandgap of the synthesized TiO2 nanoparticles (3.52–4.06 eV and 4.21–4.62 eV), direct band-to-band excitation under visible light is not possible. Therefore, the observed photocatalytic activity is attributed to a dye-sensitized mechanism. Under visible-light illumination, methylene blue (MB) absorbs photons and reaches its excited state (MB*). This excited dye molecule can inject electrons into defect states of TiO2, such as Ti3+ centers and oxygen vacancies, or directly into the conduction band.
The injected electrons are subsequently transferred to adsorbed oxygen species, generating reactive oxygen species (ROS) such as superoxide radicals (•O2−) and hydroxyl radicals (•OH), which play a leading role in MB oxidative degradation. Simultaneously, the MB radical cation produced after electron injection undergoes oxidation, contributing to the overall discoloration and mineralization process.
This mechanism is consistent with (i) the wide bandgap values obtained from Tauc analysis, (ii) the enhanced PL intensity associated with defect-related emissions, and (iii) the incomplete MB degradation, which is characteristic of dye-sensitized photocatalytic pathways rather than intrinsic TiO2 visible absorption. The proposed mechanism is illustrated in Figure 7 (new schematic diagram).
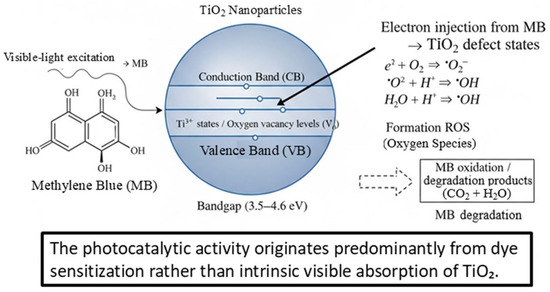
Figure 7.
Proposed dye-sensitized photocatalytic mechanism of methylene blue (MB) degradation over defect-rich TiO2 under visible-light irradiation.
3. Experimental Details
3.1. Materials
Titanium (IV) isopropoxide (Sigma-Aldrich Co., St. Louis, MO, USA), Ethyl Alcohol Absolute (J.T. Baker, purity-99.91%, Phillipsburg, NJ, USA), Nitric Acid (HNO3, J.T. Baker, 65 wt%, USA), deionized water.
3.2. Preparation of TiO2 NPS
We have previously reported a similar methodology to obtain TiO2 thin films (TFs) [50]. In this procedure, NA was gradually added (drop by drop) to 30 mL of isopropyl alcohol to obtain three samples, denoted as SNA (0 mL HNO3), MNA (0.05 mL HNO3), and FNA (0.10 mL HNO3), all samples were kept under constant agitation. After that, 4 mL of titanium (IV) isopropoxide was added dropwise while being stirred for 60 min at RT. Subsequently, After the waiting time the 10 mL of distilled water is added to give the formation of the gel, continuing with agitation for 1 h at RT.
During the sol–gel process, titanium (IV) isopropoxide is hydrolyzed and condensed to create TiO2 nanoparticles. The following reaction occurs when water is added to the precursor solution, causing titanium alkoxide to hydrolyze:
The sol undergoes this transformation into a gel, which, when dried and calcined, produces crystalline TiO2 nanoparticles.
3.3. Structural, Optical, and Morphological Characterization of the Films
The crystalline structure of the samples was examined by X-ray diffraction (XRD) using a Philips (Amsterdam, The Netherlands) PANalytical X’Pert PRO diffractometer equipped with a Cu-Kα radiation source (λ = 0.154 nm). Measurements were carried out within the 2θ range of 20–80°, under operating conditions of 30 kV and 40 mA. Data were collected in continuous scanning mode with a step interval of 0.02° (2θ) and a counting time of 1 s per step. Raman spectroscopy was used to gather structural data. The spectra were acquired with a Labram Dilor system using a He–Ne laser as the excitation source (HORIBA, Kyoto, Japan). Measurements were taken at room temperature over a spectral range of 150–800 cm−1. The surface features of the TiO2 samples were examined by scanning electron microscopy (SEM) with a JEOL (Osaka, Japan) JSM-6300 microscope, providing detailed images of particle morphology. Optical absorption measurements were carried out with a Thermo Fisher Evolution 220 UV–Vis spectrophotometer (Billerica, MA, USA). Photoluminescence (PL) spectra were collected at ambient conditions under excitation from a He–Cd laser, and the emitted light was analyzed with a Horiba/Spex 1404 double spectrometer.
3.4. Photocatalytic Activity Evaluation
Photocatalytic degradation experiments were carried out under visible-light irradiation using a 100 W V-501 reflector LED SMD lamp (ILV, Shenzhen, China) with a correlated color temperature (CCT) of 6500 K, corresponding to an emission range of approximately 420–780 nm. The average light intensity incident on the sample surface was estimated to be ≈10.2 mW·cm−2 (Luminous Efficacy of Radiation (LER) = 300) at a fixed distance of 15 cm. The lamp was positioned vertically above the reaction vessel to ensure uniform illumination. During the test, the suspension was continuously stirred at room temperature to maintain homogeneity. At predetermined intervals, the lamp was briefly turned off to collect aliquots, which were subsequently analyzed by UV–Vis spectroscopy to monitor methylene blue (MB) degradation. This procedure was repeated several times.
In addition, the photocatalytic degradation was carried out using an aqueous MB solution of 8.14 mg L−1, with 20 mg of TiO2 catalyst dispersed in 50 mL of solution under continuous magnetic stirring. A control photolysis experiment without catalyst was performed under identical illumination conditions; no measurable MB degradation was detected after 240 min, confirming that the process is photocatalytic in nature.
4. Conclusions
TiO2 nanoparticles were successfully synthesized through a nitric-acid-assisted sol–gel route using 0, 0.05, and 0.10 mL of HNO3. Structural, optical, and photocatalytic analyses demonstrated that nitric acid plays a significant role in modulating the physicochemical characteristics of the material. All samples crystallized in the anatase phase, and the NA-treated specimens exhibited improved crystallinity and slightly more intense diffraction and Raman signals.
The XRD results indicated only a marginal increase in crystallite size with increasing acid content, suggesting that nitric acid promotes partial condensation and controlled crystal coalescence without inducing any phase transformation. Optical measurements revealed a progressive blue shift in the absorption edge as the NA volume increased, resulting in a wider optical band gap. This trend is consistent with the creation of oxygen vacancies and Ti3+ defect states, which introduce localized energy levels within the band gap. The PL spectra further supported this interpretation, as NA-treated samples displayed stronger visible emission associated with defect-mediated recombination.
SEM–EDX analysis confirmed the formation of agglomerated but compositionally pure TiO2 nanoparticles, containing only Ti and O without detectable impurities. The slight variation in the oxygen content for the NA-treated samples suggests modifications in surface stoichiometry and partial passivation or redistribution of defect sites, which can influence the optical and photocatalytic behavior.
Among all samples, the FNA specimen exhibited the highest photocatalytic performance toward methylene blue degradation under visible light, achieving 74.80% removal after 240 min ( = 0.0053 min−1). Although FNA possesses a slightly larger crystallite size and wider band gap, its superior activity can be attributed to a defect-assisted mechanism in which NA generates a beneficial concentration of oxygen vacancies and Ti3+ centers. These defect states facilitate sub-bandgap excitation, enhance interfacial charge transfer, and enable electron exchange with MB, which may act as a photosensitizer. This synergistic interaction ultimately promotes more efficient charge separation and accounts for the enhanced photocatalytic activity.
Author Contributions
Conceptualization, Y.J.A.-S., S.G.-H., H.A.-B., J.F.G.-T., Y.M. and A.M.-L.; Methodology, Y.J.A.-S., S.G.-H., J.F.G.-T., Y.M. and A.M.-L.; Software, S.G.-H. and A.M.-L.; Validation, Y.J.A.-S., S.G.-H., Y.M. and A.M.-L.; Formal analysis, Y.J.A.-S., S.G.-H., H.A.-B., Y.M. and A.M.-L.; Investigation, Y.J.A.-S., J.F.G.-T. and A.M.-L.; Resources, J.F.G.-T. and A.M.-L.; Writing—original draft, Y.J.A.-S. and A.M.-L.; Writing—review & editing, Y.J.A.-S. and A.M.-L.; Visualization, A.M.-L.; Supervision, A.M.-L.; Project administration, A.M.-L. All authors have read and agreed to the published version of the manuscript.
Funding
This research received no external funding.
Institutional Review Board Statement
Not applicable.
Informed Consent Statement
Not applicable.
Data Availability Statement
The original contributions presented in the study are included in the article, further inquiries can be directed to the corresponding author.
Acknowledgments
The authors thank the financial support of “FONDO PARA EL FORTALECIMIENTO DE LA INVESTIGACIÓN, VINCULACIÓN Y EXTENSIÓN (FONFIVE-UAQ-2024, FIN202428)”. We also thank A. Guzmán-Campuzano for his technical assistance. Also, the authors would like to thank all members of the Nanotechnology and Photocatalysis Laboratory at Airport Campus of the Autonomous University of Querétaro.
Conflicts of Interest
The authors declare no conflicts of interest.
References
- Dutta, S.; Gupta, B.; Srivastava, S.K.; Gupta, A.K. Recent advances on the removal of dyes from wastewater using various adsorbents: A critical review. Mater. Adv. 2021, 2, 4497–4531. [Google Scholar] [CrossRef]
- Linley, S.; Thomson, N.R. Environmental Applications of Nanotechnology: Nano-enabled Remediation Processes in Water, Soil and Air Treatment. Water Air Soil Pollut. 2021, 232, 59. [Google Scholar] [CrossRef]
- Wang, D.M. Environmental protection in clothing industry. In Proceedings of the 2015 International Conference on Sustainable Development (ICSD2015), Wuhan, China, 25–27 September 2015; pp. 729–735. [Google Scholar] [CrossRef]
- Chandanshive, V.; Kadam, S.; Rane, N.; Jeon, B.-H.; Jadhav, J.; Govindwar, S. In situ textile wastewater treatment in high rate transpiration system furrows planted with aquatic macrophytes and floating phytobeds. Chemosphere 2020, 252, 126513. [Google Scholar] [CrossRef]
- Santander, P.; Oyarce, E.; Sánchez, J. New insights in the use of a strong cationic resin in dye adsorption. Water Sci. Technol. 2020, 81, 773–780. [Google Scholar] [CrossRef]
- Maknun, L.; Nazriati, N.; Farida, I.; Kholila, N.; Syufa, R.B.M. Synthesis of Silica Xerogel based Bagasse Ash as a Methylene Blue Adsorbent on Textile Waste. J. Phys. Conf. Ser. 2018, 1093, 012050. [Google Scholar] [CrossRef]
- Mashkoor, F.; Nasar, A. Magsorbents: Potential candidates in wastewater treatment technology—A review on the removal of methylene blue dye. J. Magn. Magn. Mater. 2020, 500, 166408. [Google Scholar] [CrossRef]
- De Oliveira, G.A.R.; De Lapuente, J.; Teixidó, E.; Porredón, C.; Borràs, M.; De Oliveira, D.P. Textile dyes induce toxicity on zebrafish early life stages. Environ. Toxicol. Chem. 2015, 35, 429–434. [Google Scholar] [CrossRef] [PubMed]
- Santoso, E.; Ediati, R.; Kusumawati, Y.; Bahruji, H.; Sulistiono, D.O.; Prasetyoko, D. Review on recent advances of carbon based adsorbent for methylene blue removal from waste water. Mater. Today Chem. 2020, 16, 100233. [Google Scholar] [CrossRef]
- Oyarce, E.; Butter, B.; Santander, P.; Sánchez, J. Polyelectrolytes applied to remove methylene blue and methyl orange dyes from water via polymer-enhanced ultrafiltration. J. Environ. Chem. Eng. 2021, 9, 106297. [Google Scholar] [CrossRef]
- Li, H.; Lin, Y.; Luo, Y.; Yu, P.; Hou, L. Relating organic fouling of reverse osmosis membranes to adsorption during the reclamation of secondary effluents containing methylene blue and rhodamine B. J. Hazard. Mater. 2011, 192, 490–499. [Google Scholar] [CrossRef] [PubMed]
- Ihaddaden, S.; Aberkane, D.; Boukerroui, A.; Robert, D. Removal of methylene blue (basic dye) by coagulation-flocculation with biomaterials (bentonite and Opuntia ficus indica). J. Water Process Eng. 2022, 49, 102952. [Google Scholar] [CrossRef]
- Zhukova, A.I.; Sazonova, A.D.; Kharlanov, A.N.; Asabina, E.A.; Pet’kov, V.I.; Sedov, V.A.; Prokhin, V.D.; Osaulenko, D.A.; Fionov, Y.A.; Mikhalenko, I.I.; et al. Ethanol Dehydration Pathways on NASICON-Type A0.33M2(PO4)3 ((A = Dy, Y, Yb); M = Ti, Zr) Catalysts: The Role of Hydroxyl Group Proton Mobility in Selectivity Control. Catalysts 2025, 15, 515. [Google Scholar] [CrossRef]
- Karami, M.; Ghanbari, M.; Amiri, O.; Salavati-Niasari, M. Enhanced antibacterial activity and photocatalytic degradation of organic dyes under visible light using cesium lead iodide perovskite nanostructures prepared by hydrothermal method. Sep. Purif. Technol. 2020, 253, 117526. [Google Scholar] [CrossRef]
- Mekprasart, W.; Pecharapa, W. Synthesis and Characterization of Nitrogen-Doped Tio2 and Its Photocatalytic Activity Enhancement Under Visible Light. Energy Procedia 2011, 9, 509–514. [Google Scholar] [CrossRef]
- Viana, M.M.; Soares, V.F.; Mohallem, N.D.S. Synthesis and characterization of TiO2 nanoparticles. Ceram. Int. 2010, 36, 2047–2053. [Google Scholar] [CrossRef]
- Yin, H.; Wada, Y.; Kitamura, T.; Kambe, S.; Murasawa, S.; Mori, H.; Sakata, T.; Yanagida, S. Hydrothermal synthesis of nanosized anatase and rutile TiO2 using amorphous phase TiO2. J. Mater. Chem. 2001, 11, 1694–1703. [Google Scholar] [CrossRef]
- Kathirvel, S.; Pedaballi, S.; Su, C.; Chen, B.-R.; Li, W.-R. Morphological control of TiO2 nanocrystals by solvothermal synthesis for dye-sensitized solar cell applications. Appl. Surf. Sci. 2020, 519, 146082. [Google Scholar] [CrossRef]
- Anandgaonker, P.; Kulkarni, G.; Gaikwad, S.; Rajbhoj, A. Synthesis of TiO2 nanoparticles by electrochemical method and their antibacterial application. Arab. J. Chem. 2015, 12, 1815–1822. [Google Scholar] [CrossRef]
- Islam, M.T.; Roni, M.N.P.; Ali, M.Y.; Islam, M.R.; Hossan, M.S.; Rahman, M.H.; Zahid, A.A.S.M.; Alam, M.N.E.; Hanif, M.A.; Akhtar, M.S. Selectivity of Sol-Gel and Hydrothermal TiO2 Nanoparticles towards Photocatalytic Degradation of Cationic and Anionic Dyes. Molecules 2023, 28, 6834. [Google Scholar] [CrossRef]
- Navarro, L.K.T.; Jaroslav, C. Enhancing Photocatalytic Properties of TiO2 Photocatalyst and Heterojunctions: A Comprehensive Review of the Impact of Biphasic Systems in Aerogels and Xerogels Synthesis, Methods, and Mechanisms for Environmental Applications. Gels 2023, 9, 976. [Google Scholar] [CrossRef]
- Ramazani, M.; Farahmandjou, M.; Firoozabadi, T.P. Effect of Nitric Acid on Particle Morphology of the Nano-TiO2. Available online: https://www.ijnnonline.net/article_13474.html (accessed on 23 October 2025).
- Wang, Z.; Xia, D.; Chen, G.; Yang, T.; Chen, Y. The effects of different acids on the preparation of TiO2 nanostructure in liquid media at low temperature. Mater. Chem. Phys. 2008, 111, 313–316. [Google Scholar] [CrossRef]
- Park, J.; Bae, W.B.; Byun, S.W.; Shin, H.; Min, H.; Kim, Y.J.; Kang, S.B. Improvement of Catalytic Methane Oxidation by Nitric Acid Treatment on Pt/TiO2. Adv. Energy Sustain. Res. 2025, 6, 2400358. [Google Scholar] [CrossRef]
- Acosta-Silva, Y.J.; Gallardo-Hernández, S.; Rivas, S.; Espejel-Ayala, F.; Méndez-López, A. Photocatalytic Activities of Methylene Blue Using ZrO2 Thin Films at Different Annealing Temperatures. Coatings 2024, 14, 537. [Google Scholar] [CrossRef]
- Leyva-Porras, C.; Toxqui-Teran, A.; Vega-Becerra, O.; Miki-Yoshida, M.; Rojas-Villalobos, M.; García-Guaderrama, M.; Aguilar-Martínez, J.A. Low-temperature synthesis and characterization of anatase TiO2 nanoparticles by an acid assisted sol–gel method. J. Alloys Compd. 2015, 647, 627–636. [Google Scholar] [CrossRef]
- Thomas, W.; Krishnan, B.; Avellaneda, D.A.; Sanchez, E.O.G.; Martinez, J.A.A.; Shaji, S. Defects induced SnOx-TiO2 nanocomposite thin films for improved visible light driven photocatalysis and photoelectrochemical applications. Appl. Surf. Sci. 2024, 669, 160575. [Google Scholar] [CrossRef]
- Oruç, P.; Turan, N.; Cavdar, S.; Tuğluoğlu, N.; Koralay, H. Investigation of dielectric properties of amorphous, anatase, and rutile TiO2 structures. J. Mater. Sci. Mater. Electron. 2023, 34, 498. [Google Scholar] [CrossRef]
- Jose, S.; Selvi, K.; Bhuvana, K.P.; Bensingh, R.J. Inducing Multicolour emission in MEH-PPV/TiO2 nanocomposites. Opt. Mater. 2024, 157, 116321. [Google Scholar] [CrossRef]
- Kignelman, G.; Thielemans, W. Synergistic effects of acetic acid and nitric acid in water-based sol–gel synthesis of crystalline TiO2 nanoparticles at 25 °C. J. Mater. Sci. 2021, 56, 16877–16886. [Google Scholar] [CrossRef]
- Bischoff, B.L.; Anderson, M.A. Peptization Process in the Sol-Gel Preparation of Porous Anatase (TiO2). Chem. Mater. 1995, 7, 1772–1778. [Google Scholar] [CrossRef]
- Xu, C.Y.; Zhang, P.X.; Yan, L. Blue shift of Raman peak from coated TiO2 nanoparticles. J. Raman Spectrosc. 2001, 32, 862–865. [Google Scholar] [CrossRef]
- Choi, H.C.; Jung, Y.M.; Kim, S.B. Size effects in the Raman spectra of TiO2 nanoparticles. Vib. Spectrosc. 2004, 37, 33–38. [Google Scholar] [CrossRef]
- Ziashahabi, A.; Poursalehi, R.; Naseri, N.; Peymani, R. Shed light on defect induced enhanced visible-light photocatalysis activity of rutile TiO2 nanoparticles: Effects of annealing on blue-gray to light-gray transition. J. Mater. Res. Technol. 2022, 17, 2400–2409. [Google Scholar] [CrossRef]
- Etacheri, V.; Di Valentin, C.; Schneider, J.; Bahnemann, D.; Pillai, S.C. Visible-light activation of TiO2 photocatalysts: Advances in theory and experiments. J. Photochem. Photobiol. C Photochem. Rev. 2015, 25, 1–29. [Google Scholar] [CrossRef]
- Mousa, H.M.; Alenezi, J.F.; Mohamed, I.M.A.; Yasin, A.S.; Hashem, A.-F.M.; Abdal-Hay, A. Synthesis of TiO2@ZnO heterojunction for dye photodegradation and wastewater treatment. J. Alloys Compd. 2021, 886, 161169. [Google Scholar] [CrossRef]
- Chachuli, S.A.M.; Hamidon, M.N.; Ertugrul, M.; Mamat, S.; Jaafar, H.; Aris, N. Influence of B2O3 Addition on the Properties of TiO2 Thick Film at Various Annealing Temperatures for Hydrogen Sensing. J. Electron. Mater. 2020, 49, 3340–3349. [Google Scholar] [CrossRef]
- Enyashin, A.N.; Seifert, G. Structure, stability and electronic properties of TiO2 nanostructures. Phys. Status Solidi (B) 2005, 242, 1361–1370. [Google Scholar] [CrossRef]
- Tsega, M.; Dejene, F.B. Influence of acidic pH on the formulation of TiO2 nanocrystalline powders with enhanced photoluminescence property. Heliyon 2017, 3, e00246. [Google Scholar] [CrossRef]
- Chen, D.; Cheng, Y.; Zhou, N.; Chen, P.; Wang, Y.; Li, K.; Huo, S.; Cheng, P.; Peng, P.; Zhang, R.; et al. Photocatalytic degradation of organic pollutants using TiO2-based photocatalysts: A review. J. Clean. Prod. 2020, 268, 121725. [Google Scholar] [CrossRef]
- Nawaz, R.; Hanafiah, M.M.; Sakawi, Z.; Baki, Z.A.; Abidin, S.B.Z.; Anjum, M.; Ismail, A.F.; Arshad, U. A review of the defective TiO2 materials-based photocatalysis for environmental remediation: Exploring the nexus between light wavelength and energy consumption. Appl. Energy 2025, 393, 126143. [Google Scholar] [CrossRef]
- Kathirvel, S.; Su, C.; Shiao, Y.-J.; Lin, Y.-F.; Chen, B.-R.; Li, W.-R. Solvothermal synthesis of TiO2 nanorods to enhance photovoltaic performance of dye-sensitized solar cells. Sol. Energy 2016, 132, 310–320. [Google Scholar] [CrossRef]
- La, M.-P.; Shiu, J.-W.; Way, T.-F.; Rwei, S.-P. Synthesis and Characterization of Size-Controlled Titania Nanorods through Double Surfactants. Inorg. Chem. 2021, 60, 7952–7960. [Google Scholar] [CrossRef]
- Geçgel, C.; Yabalak, E.; Turabik, M. Simultaneous synthesis of super-paramagnetic hydrochar in a one-pot using subcritical water medium and evaluation of its photocatalytic activity. J. Environ. Manag. 2024, 362, 121333. [Google Scholar] [CrossRef]
- Kar, P.; Aggarwal, D.; Shukla, K.; Gupta, R.K. Defect State Modulation of TiO2 Nanostructures for Photocatalytic Abatement of Emerging Pharmaceutical Pollutant in Wastewater Effluent. Adv. Energy Sustain. Res. 2021, 3, 2100162. [Google Scholar] [CrossRef]
- De Jesús Acosta-Silva, Y.; Toledano-Ayala, M.; Gallardo-Hernández, S.; Godínez, L.A.; Méndez-López, A. Investigation of TiO2 Deposit on SiO2 Films: Synthesis, Characterization, and Efficiency for the Photocatalytic Discoloration of Methylene Blue in Aqueous Solution. Nanomaterials 2023, 13, 1403. [Google Scholar] [CrossRef]
- Athithya, S.; Manikandan, V.S.; Harish, S.K.; Silambarasan, K.; Gopalakrishnan, S.; Ikeda, H.; Navaneethan, M.; Archana, J. Plasmon Effect of Ag Nanoparticles on TiO2/rGO Nanostructures for Enhanced Energy Harvesting and Environmental Remediation. Nanomaterials 2022, 13, 65. [Google Scholar] [CrossRef]
- Babyszko, A.; Wanag, A.; Kusiak-Nejman, E.; Morawski, A.W. Effect of Calcination Temperature of SiO2/TiO2 Photocatalysts on UV-VIS and VIS Removal Efficiency of Color Contaminants. Catalysts 2023, 13, 186. [Google Scholar] [CrossRef]
- Huang, H.; Kong, Q.; Yue, X.; Wang, K.; Wei, Z.; Chang, Y. Fabrication and Photocatalytic Activity of Single Crystalline TiO2 Hierarchically Structured Microspheres. Catalysts 2023, 13, 201. [Google Scholar] [CrossRef]
- Acosta-Silva, Y.J.; Lugo-Arredondo, M.I.; Gallardo-Hernández, S.; Garcia-Trejo, J.F.; Matsumoto, Y.; Rivas, S.; Feregrino-Pérez, A.A.; Godínez, L.A.; Méndez-López, A. Comparison of Photocatalytic Activity: Impact of Hydrophilic Properties on TiO2 and ZrO2 Thin Films. Inorganics 2024, 12, 320. [Google Scholar] [CrossRef]


Disclaimer/Publisher’s Note: The statements, opinions and data contained in all publications are solely those of the individual author(s) and contributor(s) and not of MDPI and/or the editor(s). MDPI and/or the editor(s) disclaim responsibility for any injury to people or property resulting from any ideas, methods, instructions or products referred to in the content. |
© 2025 by the authors. Licensee MDPI, Basel, Switzerland. This article is an open access article distributed under the terms and conditions of the Creative Commons Attribution (CC BY) license (https://creativecommons.org/licenses/by/4.0/).