Abstract
Modification of zeolitic structures through the incorporation of transition metal oxides has proven to be a promising approach for heterogeneous catalysis. In the present study, *BEA zeolite was modified using the incipient wetness impregnation method with varying amounts (10, 20, and 40 wt.%) of iron(III) oxide to investigate its structural and physicochemical properties. Characterization techniques such as XRD, UV–Vis DRS, FT–IR, Raman spectroscopy, SEM/EDS, TEM/EDS, and SAED, as well as textural and thermal analyses, were employed to assess the main changes. Different iron species were detected, including isolated iron(III) and well-dispersed Fe2O3 nanoparticles coating the zeolite surface. Under the synthesis conditions, increased Fe2O3 loading promoted hematite nanocrystal growth and the formation of the α-Fe2O3 phase, as demonstrated by XRD, Raman, and SAED analyses. Key observations included the preservation of the zeolite framework, high relative crystallinity (ranging from 70% to 85%), and a band gap of approximately 2.0 eV. Furthermore, a general increase in mesoporosity and external surface area was observed, along with a reduction in the number of acidic sites. This decrease may be attributed to restricted accessibility of the probe molecule (pyridine) to Brønsted sites due to micropore blockage in *BEA. These results demonstrate that the adopted synthesis method effectively produced α-Fe2O3/BEA catalysts, with no other crystalline phases of iron(III) oxide detected.
1. Introduction
The development of new catalytic materials with enhanced selectivity, thereby minimizing the formation of toxic by-products and improved structural stability for ease of recovery, remains a critical focus in catalysis research [1,2,3]. Zeolites have demonstrated considerable promise as alternatives for a wide range of heterogeneous catalytic applications, including petroleum cracking, methanol-to-gasoline conversion, ion exchange in detergents, and alcohol dehydration processes [4,5,6,7,8,9]. This wide range of applications arises from their unique structural, physical and chemical properties. Zeolites consist of a three-dimensional crystalline structure formed by TO4 tetrahedra (where T = Si, Al, B, Ga, Fe, etc.) connected by oxygen atoms, resulting in a framework with well-defined cavities and channels [10]. Accordingly, they exhibit high surface area, excellent adsorption capacity, acidic sites, chemical resistance under high-temperature conditions, shape, reactant, and product selectivity that are related to their characteristics [10].
Several studies have explored new applications and improvements for these materials [11,12,13]. One notable approach is the post-synthesis structural modification of zeolites, which enhances their catalytic performance [14]. Among zeolitic materials, the *BEA zeolite stands out due to its intrinsic characteristics, making it an attractive support for the modification of pure zeolite phases. The *BEA zeolite structure has a three-dimensional crystalline system with relatively large pores, high Si/Al ratio (from 11 up to 100), large surface area, and excellent thermal/hydrothermal stability (up to ~760 °C) [15,16]. Furthermore, the acidity, ion-exchange characteristics, and adsorption capacity of this solid catalyst establish it as an option for heterogeneous catalysis [17,18,19,20].
Among various modifications of *BEA zeolites, metal incorporation has been widely explored in the literature [21,22]. For instance, through in situ synthesis, elements such as iron can be introduced, imparting new chemical and physical properties, including redox activity [23] and enhanced mesoporosity. These elements may be stabilized within the zeolite framework, preventing leaching and contributing to shape selectivity via molecular sieving, thereby aiding in the degradation of organic pollutants and gases [24,25,26,27,28,29].
Iron(III) oxide (α-Fe2O3 or hematite), is one of the four polymorphs of Fe2O3. It is the most ancient and widely distributed form of iron oxide, occurring in rocks and soils and valued as both an ore and a pigment [30,31]. Finely divided, it appears blood-red but can also be gray or black when coarsely crystalline [30,32]. This oxide adopts a corundum-type structure, with a hexagonal unit cell (a = b = 5.0317 Å, c = 13.737 Å), or alternatively a rhombohedral unit cell (a = 5.427 Å, α = 55.3°) [30,31]. Its structure consists of FeO6 octahedra, where Fe(III) cations occupy two-thirds of the octahedral sites within a lattice of O2− anions in a hexagonal close-packed (hcp) arrangement [30,31,33]. Thermodynamically, α-Fe2O3 is extremely stable and represents the final transformation product of other iron oxides.
Inserting iron(III) oxide on *BEA zeolite improves catalyst performance by enhancing metal oxide dispersion, limiting sintering/leaching, increasing hydrophobicity and stability, and extending lifetime [24,34,35,36]. The designed meso- and microporous structure of *BEA allows larger molecules to access iron-induced acidic sites, aiding in pollutant degradation. Iron(III) oxide may be incorporated into the *BEA matrix, forming isolated iron species as shown by TPR-H2 (reduction peaks indicate different iron phases and strong support interaction) [35]. UV-Vis DRS confirms iron(III) in both tetrahedral and octahedral sites, with iron(III) oligomers present [24,37,38]. Fe-modified zeolites also generate active sites, which foster reactive α-oxygen species during activation, boosting oxidation reactivity but possibly reducing acidity [39,40,41,42]. In addition, iron(III)-modified zeolites have been studied for N2O decomposition, oxidation of organic gases, and photocatalytic applications, often showing good pollutant removal efficiency [43,44,45,46,47]. Most cited examples incorporate less than 10% iron during *BEA zeolite synthesis, but few studies specifically examine *BEA as a support for single-phase α-Fe2O3 nanoparticles.
In this investigation, a commercial *BEA zeolite was subjected to modification via the incipient impregnation method utilizing an iron(III) precursor. This procedure was implemented to facilitate the formation of the α-Fe2O3 phase upon the zeolite surface. Subsequent to the incorporation of iron(III) oxide, thorough characterization of the material’s structural and physicochemical properties was conducted. These measures aimed to provide a foundation for the prospective application in fields such as heterogeneous catalysis.
2. Results and Discussion
2.1. Elemental Analysis for Fe2O3 Content
Table 1 shows the UV–Vis spectroscopy results for the percentage of iron(III) oxide in the catalysts. The Fe2O3 percentages calculated by the classical iron determination method were close to the target values expected from the incipient impregnation process. The small variations observed can be attributed to the surface chemistry of the support during impregnation [48]. Aluminosilicate supports such as zeolites contain numerous hydroxyl groups that act as anchoring sites for the incorporation of active phase precursors. In this process, the surface charge is influenced by the pH of the medium and the isoelectric point of the support [48]. For example, zeolite HBEA has an isoelectric point near pH 4 [49,50]. Efficient impregnation requires the surface charge to promote binding between the active phase precursors and oppositely charged ionic sites on the support. Because the incipient impregnation process uses only small volumes of water, just enough to fill the pore volume of the zeolitic structure [36,51], the resulting solution had a pH approximately 2.0, which is below the isoelectric point. Consequently, the zeolite surface acquired predominantly negative charges, favoring the anchoring of Fe(III) ions from the Fe(NO3)3·9H2O solution. Nonetheless, due to the hydrophilic nature of zeolitic matrices, the degree of hydration of the zeolite must be considered when calculating the required amount of active phase (i.e., the quantity X in g of active phase per g of support) to avoid discrepancies between the theoretical and actual supported contents [48]. Even after calcination, HBEA zeolite retains some water within its framework (known as constitutional water), which is an inherent part of the zeolitic structure. Thus, the variations are consistent with the hydration level of the zeolite during impregnation. For simplicity, nominal Fe2O3 values are used in all notations.

Table 1.
Theoretical and actual loadings (%) of iron(III) oxide (Fe2O3) in the materials.
2.2. Powder X-Ray Diffraction (XRD)
The XRD patterns obtained from catalyst analysis are illustrated in Figure 1, demonstrating retention of the characteristic peaks associated with the HBEA zeolite structure at 2θ values of 7.7° and 22.5°, which correspond to the (101) and (311) planes of the polymorph A structure [52]. Furthermore, distinctive peaks indicative of α-Fe2O3 in its rhombohedral crystallographic phase (JCPDS No. 33-0664) were identified at 24.2° (012), 33.2° (104), 35.8° (110), 40.9° (113), 49.6° (024), 54.2° (116), 62.7° (214), and 64.1° (300) [24,30,45,53]. These peaks appeared in both the 20% Fe2O3/HBEA and 40% Fe2O3/HBEA catalysts, exhibiting increased intensity proportional to the increasing iron(III) oxide loading on the zeolite surface. Conversely, the 10% Fe2O3/HBEA catalyst did not show distinct peaks corresponding to hematite, likely due to enhanced dispersion of nanoparticles across the support. Comparable results have been reported in literature for loadings up to 10 wt.% [41,42,54].
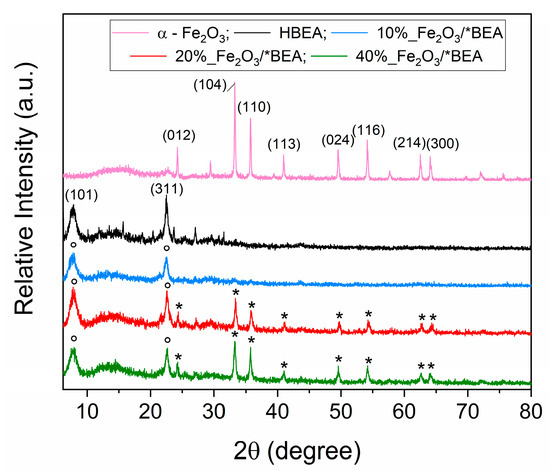
Figure 1.
XRD of the catalysts, in which (*) indicates the peaks related to the crystal planes of α-Fe2O3 and (°) to the crystal planes of the HBEA zeolite.
A decrease in the intensity of the HBEA zeolite peaks was also observed, signifying a decline in the support’s crystallinity (Table 2). This phenomenon was particularly evident in the 10% and 40% Fe2O3/HBEA catalysts, and it aligns with the relative crystallinity values presented in Table 2. This decrease in crystallinity is presumably linked to interactions between the support and the acidic aqueous solution formed during the incipient impregnation process, which may have imposed minor structural damage upon the zeolite framework [29,55]. The crystallite domain sizes resulting from iron(III) oxide impregnation within the zeolitic matrix (Table 2) are consistent with literature benchmarks, generally ranging from 4 to 38 nm [24,45,54,56]. As observed, the average domain size slightly increased with higher iron(III) oxide loading, a trend attributed to the precursor’s role in crystalline domain formation.
Table 2.
Relative crystallinity, crystal domain (D) and band gap of the materials.
2.3. Diffuse Reflectance Spectroscopy (DRS) in the UV-Vis Region
Figure 2 presents the UV-Vis DRS spectra, which displays similar features for all catalysts. Specifically, there is a band near 207 nm and two main bands with maxima at 346 nm and 496 nm, as determined by deconvolution. These bands are consistent with findings from previous research on iron-containing HBEA zeolites [24,28,29,34,39,57]. The absorption observed corresponds to isolated Fe(III) species in either tetrahedral or octahedral coordination (wavelengths under 300 nm), oligomeric Fe(III)xOy groups (between 300 and 400 nm), and larger aggregates of Fe2O3 nanoparticles (above 400 nm). This indicates that the impregnation process creates multiple forms of iron(III) species on the surface of HBEA zeolite during its modification. Deconvoluted DRS spectra estimate approximately 43% of the iron(III) is present as isolated, 40% as oligomeric species, and 16% as Fe2O3 in each supported Fe2O3/*BEA catalyst. These distributions align with results from Fe/BEA samples synthesized via direct method (isomorphous substitution) [39]. However, Pérez-Ramírez et al. [39] caution that quantifying these species using DRS sub-band areas requires care, as the absorption coefficients for various charge-transfer transitions of iron(III) species within *BEA zeolites are not known. Additionally, this approach is influenced by experimental conditions such as particle size, sample cup packing density, and light source alignment, all of which can impact spectral intensity. Therefore, these findings should be considered only as semiquantitative estimates.
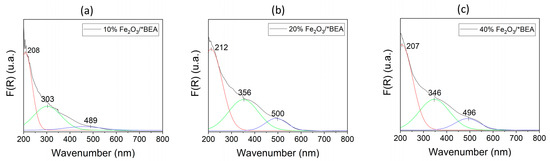
Figure 2.
Experimental (black) and deconvoluted (colors) DRS/UV-Vis of: (a) 10% Fe2O3/*BEA, (b) 20% Fe2O3/*BEA, and (c) 40% Fe2O3/*BEA catalysts.
Furthermore, the band gap values for each material were calculated (Figure S1) and are summarized in Table 2. The measured band gap values correspond with those previously reported in the literature for supported α-Fe2O3 species, falling within the range of 1.8 to 2.2 eV [56,58]. In comparison, pure hematite typically exhibits a band gap between 2.0 and 2.2 eV. These figures are notable because iron(III) oxide, as a semiconductor, can absorb electromagnetic radiation across a wider wavelength spectrum (ultraviolet and visible) than species such as TiO2, which has a band gap of 3.0 to 3.2 eV and predominantly absorbs in the ultraviolet region. This property makes Fe2O3 highly suitable for advanced oxidation processes (AOPs), including photocatalysis. Therefore, these supported iron(III) oxide catalysts are promising candidates for chemical processes (e.g., Fenton and Photo-Fenton), which have demonstrated efficacy in degrading organic molecules [24,44,45,59,60].
2.4. Infrared Spectroscopy
Figure 3 shows the infrared spectra of the supported materials in comparison with iron(III) oxide and the HBEA zeolite structures. The characteristic bands of α-Fe2O3 appear at: 475 and 549 cm−1, corresponding to the stretching vibrations of the (Fe–O–Fe) bond; at 819 and 1081 cm−1 to the vibrations of the (Fe=O) bond; the band at 1384 cm−1 may be attributed to some impurities from the synthesis (e.g., nitrates). Additionally, the band at 1629 cm−1 corresponds to the bending mode of the (H–O–H) bond, whereas the band at 3431 cm−1 is assigned to the stretching of the (H–O–H) bond of water molecules [30,58,61,62]. These bands are also present in the α-Fe2O3/*BEA catalysts, indicating that the hematite structure was successfully impregnated onto the zeolitic support. An increase in the intensity of the bands at 475 and 549 cm−1 is observed as the loading of Fe2O3 increased.
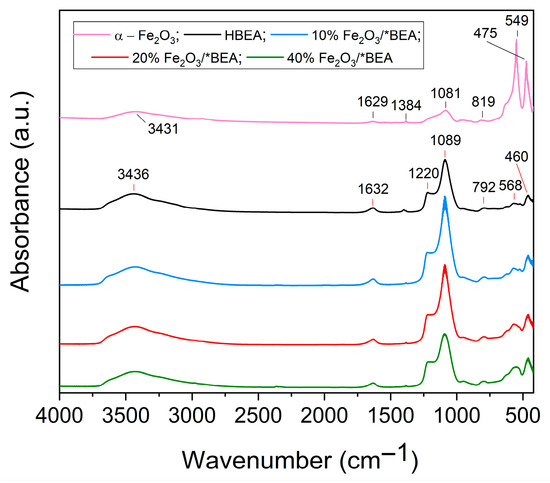
Figure 3.
FT-IR spectra of α-Fe2O3, HBEA and the supported Fe2O3 catalysts.
The absorptions of HBEA zeolite were also examined after the impregnation and calcination of iron(III) oxide. The main bands are observed at: 3436 cm−1, associated with the presence of water in the structure; 1632 cm−1, corresponding to the out-of-plane vibrations of the H–O–H water bond; 1220 cm−1, assigned to the asymmetric stretching vibrations between the TO4 tetrahedra (T = Al, Si); 1089 cm−1, corresponding to the asymmetric stretching between the internal T–O bonds of the structure; 792 cm−1, attributed to the symmetric stretching vibration of the Si–O–Si bond; and 568 and 460 cm−1, corresponding to the vibrations of the six-membered rings, which have a density of fewer than 17 tetrahedral atoms per 1000 Å3, a characteristic feature of the HBEA zeolite [17,54,63]. The comparison between the main bands of HBEA zeolite and those of the supported materials revealed only minor shifts from the parent zeolite (Table S1). Thus, it can be inferred that there is an interaction between the impregnated iron(III) oxide and the surface of the zeolitic structure, although it is not strong enough to alter the bulk structure of the *BEA zeolite.
2.5. Raman Spectroscopy
Figure 4 shows the Raman shift spectra of the catalysts and the HBEA support. There are seven active vibrational modes characteristic of iron(III) oxide in the form of hematite (226, 243, 293, 410, 496, 613, and 814 cm−1) [30,64,65], five of which are observed in the solid catalysts: two A1g modes (224 and 498 cm−1) and three Eg modes (292, 410, and 611 cm−1). Because iron atoms are heavier than oxygen, the vibrational modes between 200 and 300 cm−1 correspond to the symmetric stretching (224 cm−1) and bending (292 cm−1) vibrations of the Fe(III) cations along the c-axis. The vibrational modes between 400 and 650 cm−1 correspond to the vibrations of the oxygen atoms: 410 cm−1 to the symmetric stretching of the oxygen atoms relative to each cation in the plane perpendicular to the c-axis; 498 cm−1 to the symmetric stretching of the oxygen atoms in the Fe–O bond; and 611 cm−1 to the symmetric bending of oxygen in the Fe–O bond. These observations suggest that the crystal symmetry of the α-Fe2O3 species belongs to the space group [53,64,65].
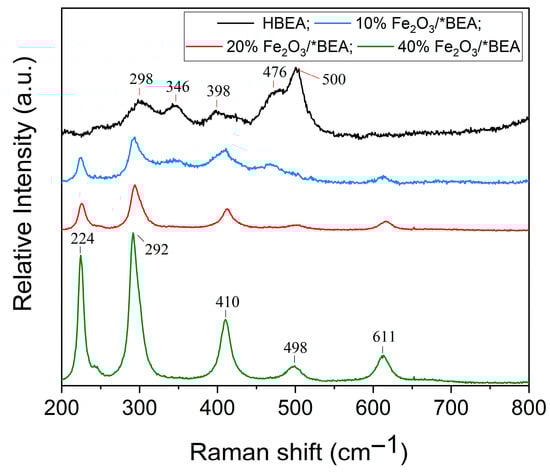
Figure 4.
Raman spectra of HBEA and the supported Fe2O3 catalysts.
The Raman spectrum of HBEA shows the vibrational modes of the oxygen atoms in the TO4 tetrahedra that constitute the zeolitic structure. The bands at 298 and 346 cm−1 correspond to the interlayer vibrations of the five-membered rings; 398 cm−1 to the interlayer vibrations of the six-membered rings; and 476 and 500 cm−1 to the interlayer vibrations of the four-membered rings, which indicate the characteristic signals of the HBEA structure [66].
The spectrum of the 10% Fe2O3/*BEA catalyst closely resembles that of HBEA, although the typical α-Fe2O3 bands are still present. As the hematite loading increases (20 and 40 wt.%), the Fe2O3 bands become more clearly defined in the spectra. The more pronounced bands are also related to the intensity of Raman scattering, which is proportional to the number density and average interaction of the species present in the catalyst structure [65]. Furthermore, the broadening of the bands observed for the 10 wt.% catalyst, compared with those for the 20 and 40 wt.% catalysts, is attributed to the insertion of the rhombohedral phase of α-Fe2O3. The higher iron(III) oxide content promotes greater crystallinity and, consequently, a better resolution of its characteristic bands [53]. It is worth noting that some HBEA bands may overlap with the characteristic α-Fe2O3 bands in the catalyst spectra (regions of 292–298 cm−1, 398–410 cm−1, and 476–500 cm−1). These results are consistent with the FT-IR findings, which confirm the presence of α-Fe2O3 species in all synthesized catalysts.
2.6. Scanning Electron Microscopy Coupled with Energy Dispersive X-Ray (SEM/EDS)
SEM micrographs of the HBEA support and the Fe2O3/*BEA catalysts are presented in Figure 5a–d and Figure S2, which also include the corresponding EDS spectra. The micrograph of the HBEA support (Figure 5a) shows clusters of morphologically uniform crystalline structures resembling rounded grains with surface roughness and an average particle size of approximately 60 nm. These features are consistent with SEM data reported in the literature for this type of zeolitic material [12,16,67,68,69]. EDS analysis confirms the presence of aluminum and oxygen, along with a dominant silicon signal that agrees with the Si/Al ratio of 12.5 characteristic of HBEA.
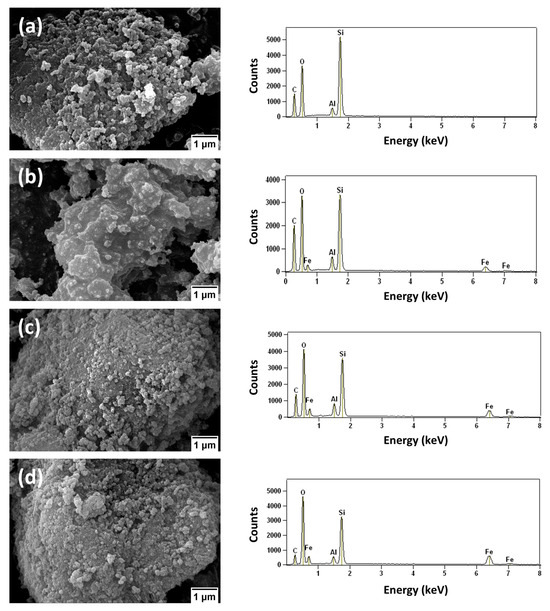
Figure 5.
SEM images of: (a) HBEA, (b) 10% Fe2O3/*BEA, (c) 20% Fe2O3/*BEA, and (d) 40% Fe2O3/*BEA catalysts.
The SEM micrograph of the 10% Fe2O3/*BEA catalyst (Figure 5b), when compared with the pure HBEA support, appears less defined. This may be attributed to surface modifications induced by iron(III) oxide, which forms rough, agglomerated clusters with an average particle size of approximately 33 nm. Similar observations have been reported [27,68]. The EDS spectrum of the 10% catalyst shows the presence of iron peaks, a slight increase in oxygen intensity, and the persistence of aluminum and silicon signals, confirming the successful impregnation of the iron precursor. SEM images of the 20% and 40% Fe2O3/*BEA catalysts (Figure 5c,d) show similar patterns to the 10% catalyst, but with more evident surface agglomeration. Some particles exhibit morphologies resembling rhombohedral and plate-like hematite (α-Fe2O3) nanoparticles [70]. The average particle sizes are approximately 39 nm and 45 nm for the 20% and 40% catalysts, respectively, which align with values reported in previous studies [39,68,69]. The formation of these larger clusters is likely influenced by the increased iron loading and the synthesis conditions. During calcination, the exothermic formation of iron(III) oxide, combined with the high temperature (550 °C), may lead to localized overheating, thereby promoting the aggregation of oxide species on the catalyst surface. The literature also suggests that in pure α-Fe2O3 systems, larger particles often result from the aggregation of smaller ones [71,72]. EDS spectral analysis further supports this trend, showing increased iron and oxygen peak intensities with higher catalyst loading. These findings corroborate the results obtained from complementary characterization techniques, such as XRD, FT-IR, and Raman spectroscopy, confirming the successful incorporation of iron(III) oxide species onto the catalyst surface.
2.7. Transmission Electron Microscopy Coupled with Energy Dispersive X-Ray Spectroscopy (TEM/EDS)
Transmission electron micrographs of the HBEA support and the Fe2O3/*BEA catalysts are presented in Figure 6a–d and Figure S3, which also include the corresponding EDS spectra. The image of the HBEA support (Figure 6a) shows features typical of a polycrystalline material, composed of packed nanocrystals with rounded shapes and uniformly aligned lattice fringes that correspond to the zeolitic planes of the structure [73,74]. The EDS spectrum confirms the presence of aluminum, oxygen, and a dominant silicon signal, consistent with the HBEA composition and its Si/Al ratio of 12.5.
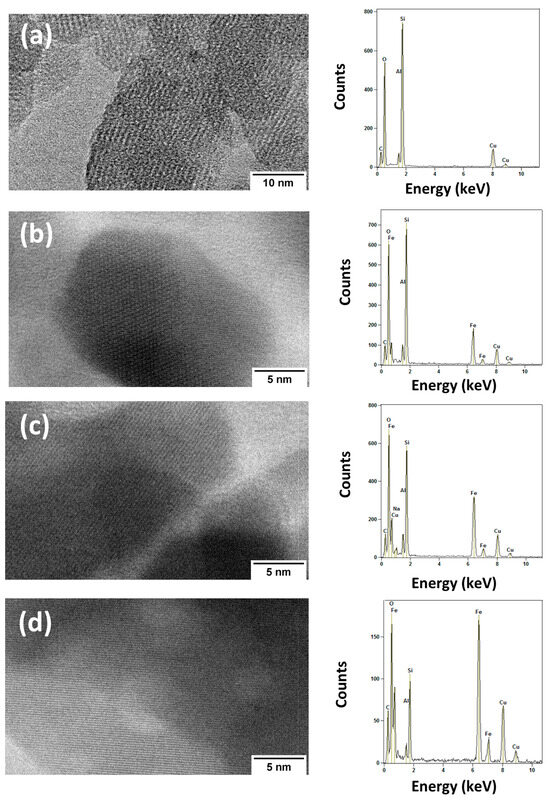
Figure 6.
TEM images of: (a) HBEA, (b) 10% Fe2O3/*BEA, (c) 20% Fe2O3/*BEA, and (d) 40% Fe2O3/*BEA catalysts.
When comparing the TEM images of HBEA and the 10% Fe2O3/*BEA catalyst (Figure 6b), the nanocrystal shapes appear similar, likely due to the low iron loading and the high dispersion of iron(III) oxide within the catalytic material [68]. In addition to the sharp lattice fringes, darker regions observed in Figure 6b indicate the presence of iron, as confirmed by EDS analysis. The characteristic peaks of aluminum, silicon, and oxygen are maintained, with oxygen showing a higher intensity compared to the pure HBEA structure. These results confirm both the successful impregnation of iron(III) species and the preservation of the zeolitic framework [28,68].
A comparison of Figure 6a–c, corresponding to catalysts with 10%, 20%, and 40% Fe2O3/*HBEA, reveals a progressive increase in surface coverage by iron(III) species (visible as darker regions) with higher iron loading. Although the distribution of iron(III) species becomes more extensive with increased content, they still appear as nanoparticle clusters without a clearly defined morphology. These clusters exhibit lattice fringes similar to those in the 10% catalyst and are likely formed during the calcination step of the synthesis process, as discussed for SEM images. This structural evolution contributes to enhanced mesoporosity within the material. The EDS spectra of the 20% and 40% Fe2O3/*BEA catalysts, in comparison with both the HBEA and the 10% supported catalyst, further confirm the retention of the zeolitic structure, as evidenced by consistent silicon, aluminum, and oxygen peaks [28,68,74]. Iron peaks were detected in all catalyst samples, with increasing intensity alongside the oxygen peak, correlating with higher iron(III) oxide loading. These findings are consistent with those obtained from characterization techniques, such as elemental analysis, XRD, FT-IR, Raman, and SEM.
Selected Area Electron Diffraction (SAED) patterns (Figure 7a–d) were analyzed to complement TEM data, showing how Fe2O3 loading affects catalyst structure. The HBEA sample’s SAED pattern features low-intensity concentric rings matching the (224) and (235) planes of *BEA zeolite, according to IZA Database (BEA) of zeolite structures (Figure 7a). In the 10% Fe2O3/*BEA sample (Figure 7b), poorly defined rings indicate high dispersion of ultrafine hematite nanoparticles, with measured spacings aligning to α-Fe2O3 planes (211), (202), and (110) (COD ID hematite: 1546383), though their low intensity reflects small, partially disordered particles, a result consistent with XRD data. By contrast, the 20% and 40% Fe2O3/*BEA samples (Figure 7c,d) display sharper, brighter rings corresponding to both *BEA and α-Fe2O3 planes, indicating larger Fe2O3 crystallites as iron loading increases, in agreement with XRD (crystal sizes growing from 19 to 28 nm).
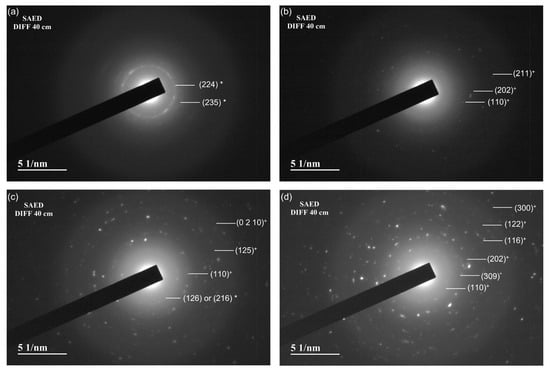
Figure 7.
SAED images obtained from TEM: (a) HBEA, (b) 10% Fe2O3/*BEA, (c) 20% Fe2O3/*BEA, and (d) 40% Fe2O3/*BEA. The planes marked with an asterisk (*) were assigned to HBEA zeolite, and the planes marked with a cross (+) were assigned to hematite.
Overall, increased Fe2O3 promotes hematite crystal growth and phase definition while maintaining *BEA framework integrity, as seen by persistent zeolite reflections in SAED. Relevant plane calculations are listed in Table S2.
2.8. Textural Properties of the Catalysts
Table 3 and Figure S4 present the results obtained by the N2 adsorption/desorption isotherms of the catalysts. HBEA zeolite displays a predominantly type I(a) isotherm, according to the IUPAC classification [75] corresponding to materials with the presence of micropores due to the formation of a monolayer at low relative pressures. However, due to the presence of hysteresis, this material also has type IV(a) characteristics, indicating the presence of secondary mesopores.
Table 3.
Main textural properties of the catalysts.
The nitrogen sorption isotherms of α-Fe2O3 exhibits a combination of type II and IV(a) curves with a hysteresis loop, which is one of the main characteristics of mesoporous materials. The observed type II isotherm is typical of macroporous material with low BET area, in which the adsorbed quantity tends to infinity when p/p0 approximates to 1, corresponding to physical adsorption in multiple overlapping layers of macro or mesoporous materials. The observed hysteresis loop corresponds to type H3, which is associated with non-rigid aggregates where adsorption and desorption occur within narrow slit-like pores [75].
The isotherms of the catalysts show characteristics like support, i.e., a combination of types I(a) and IV(a). Generally, there is a decrease in the specific surface area of the support (HBEA) when the loading of Fe2O3 increases. However, 40% Fe2O3 does not follow this trend. This decrease may indicate a reasonable overlayer distribution of the iron(III) oxide nanoparticles on the surface of the HBEA zeolite [54]. The decreasing microporous area of the catalysts is also indicative that an overlayer of Fe2O3 forms on the HBEA surface and blocks the microporous accessibility. The increase in the BET specific surface area for 40% Fe2O3/*BEA is coherent with this, since at high loadings the surface of the zeolite forms aggregates of larger clusters of iron(III) oxide that starts to effectively contribute to the total area of the material, increasing the BET area. This was also observed for Nb2O5 supported on *BEA [76,77]. In addition, these results agree with the images obtained by SEM and TEM, which together with the values obtained in Table 3 match with others reported in the literature for impregnation and ion exchange processes in similar systems [28,41,42,54].
2.9. Acidity of the Catalysts
Figure 8 and Table 4 display the results for the study of the acidity of the catalysts, on which the pyridine probe molecule was adsorbed. Pyridine is a weakly basic molecule (pKb = 8.25) and has an average kinetic diameter of approximately 5.9 Å [78]. It coordinates with the Lewis acid sites (LAS), interacts by hydrogen bonding (HB) at weaker sites and via protonation at Brønsted acid sites (BAS) of one catalyst. FT-IR analysis allows the qualitative identification of the different types of acid sites whereas through thermogravimetric analysis their quantification [3,19,39,79,80,81].
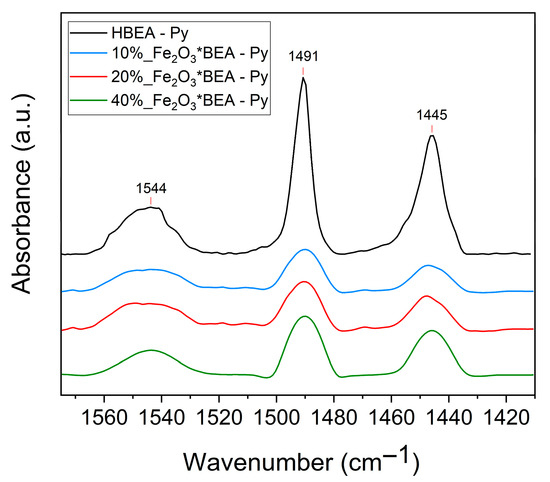
Figure 8.
FT-IR spectra of pyridine adsorbed on the catalysts.
Table 4.
Total quantity of adsorbed pyridine (NPy) on the catalysts obtained by Py-TPD (TG/DTG) analysis. The error is ±0.02 mmol/g.
The FT-IR spectra of adsorbed pyridine show the bands at 1544 cm−1 (Brønsted sites); 1445 cm−1 (Lewis sites), and 1491 cm−1 (a combination of Brønsted and Lewis sites). No bands from the hydrogen bonding interaction-pyridine were observed. The observed bands are more intense as the quantity of impregnated iron(III) oxide increases on HBEA, but they are less intense than the parent HBEA. This is confirmed by the quantification of the total acid sites (Table 4).
The number of acid sites decreases as the amount of Fe2O3 increases (approximately 25 to 30% fewer sites), except for 10% Fe2O3/*BEA. A similar reduction has been reported for catalysts containing 10–25 wt.% Nb2O5 on HBEA [77]. This decline is likely due to the formation of an overlayer that restricts access to the zeolite’s Brønsted acid sites located within its pores. Pyridine molecules are known to preferentially react with stronger Brønsted acid sites, owing to their more negative associated free energy [80]. The observed effects may be attributed to a loss of *BEA zeolite crystallinity upon α-Fe2O3 loading, which, together with blockage of micropore entrances in HBEA, prevents pyridine from accessing many Brønsted sites. In the case of 10% Fe2O3/*BEA, high dispersion and smaller crystalline domains seem to mitigate these impacts. This interpretation is supported by XRD, SEM, and TEM analyses, which reveal the formation of larger iron(III) oxide nanocrystals at higher loadings. It should also be noted that iron oxides exhibit significantly lower acidity toward pyridine, as demonstrated by magnetite nanoparticles (total acid sites of 0.19 mmol/g) [81]. Consequently, an increase in Lewis acidity can be expected with greater deposition of iron(III) oxide on these materials.
3. Materials and Methods
3.1. Materials
Zeolite *BEA (CP814E, lot 2493-65), in ammoniacal form (NH4BEA) was obtained from Zeolyst International (Conshohocken, PA, USA) with the following characteristics: SiO2/Al2O3 molar ratio = 25, surface area = 680 m2/g, and 0.05 wt.% of Na2O; Iron(III) nitrate nonahydrate (Fe(NO3)3·9H2O, 99.5%, Vetec, São Paulo, Brazil); Ammonium hydroxide (NH3(aq), 30%, Vetec); Potassium hydroxide (KOH, 99.5%, Sigma-Aldrich, St. Louis, MA, USA); Sodium hydrogenocarbonate (NaHCO3, 99.9%, JT Baker, Radnor, PA, USA); Silver nitrate (AgNO3, 99.9%, Sigma-Aldrich, USA); Nitric acid (HNO3, 70%, Merk, São Paulo, Brazil); Hydroxylamine monohydrochloride (NH2OH·HCl, 99%, Sigma-Aldrich, USA); o-phenanthroline (C12H8N2, 99%, Sigma-Aldrich, USA); hydrofluoric acid (HF, 40%, Vetec, Brazil); Sulfuric acid (H2SO4, 95%, Dinâmica, São Bernardo, Brazil); Potassium bromide (KBr, 99.5%, Merck, Rahway, NJ, USA); Anhydrous pyridine (C5H5N, 99.8%, Sigma-Aldrich, USA); Nitrogen (N2, 99.998%, White Martins, São Paulo, Brazil).
3.2. Synthesis of the Catalysts
The synthesis of iron(III) oxide supported on *BEA zeolite was carried out using the incipient wetness impregnation method [36] applying the equation: V = Vp × m, where Vp is the total pore volume of the support (HBEA), m is the mass of the support to be impregnated, and V is the volume of precursor solution to be added. First, the ammoniacal *BEA zeolite was calcined at 550 °C for 8 h to obtain the zeolite in its protonic form (HBEA). For the synthesis of the 10 wt.% catalyst, for example, an appropriate mass (1.12 g) of the active phase precursor Fe(NO3)3·9H2O was dissolved in a predetermined volume of deionized water (2.0 mL), according to the required impregnation mass (2.0 g of HBEA). This volume was withdrawn using a pipette and added dropwise to the support (HBEA) in a round-bottom flask under ultrasonic agitation, with manual assistance using a spatula. The impregnated support was then placed in a rotary evaporator and subjected to controlled drying to remove the solvent. This procedure was carried out at 80 °C for 4 h. Then, each prepared catalyst was heat-treated in a muffle furnace under a static air atmosphere at 550 °C for 8 h (Figure 9). Catalysts were synthesized with iron(III) oxide loadings of 10, 20, and 40 wt.% (~1.12; 2.24, and 4.48 g of the iron(III) precursor).
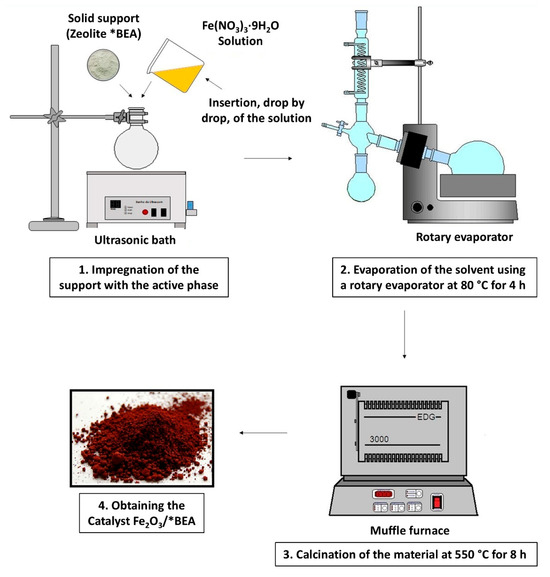
Figure 9.
Diagram of the incipient impregnation process used in catalyst synthesis.
3.3. Catalyst Characterizations
3.3.1. Elemental Analysis of Iron
The total iron content of the catalysts was determined using the UV-Vis spectrophotometric method, with a UV-Vis-NIR spectrophotometer (Varian, model Cary 5000, Macquarie Park, Australia). This analysis required the preparation of an analytical curve from a standard solution, following the classical method using the reduction in Fe(III) with hydroxylamine hydrochloride and complexation with o-phenanthroline [82,83]. Full details of this procedure are provided in the Supplementary Material of this article.
3.3.2. Powder XRD
XRD of the powders were obtained with a diffractometer (Bruker, model D8 Focus, Berlin, Germany), which uses radiation from a copper tube (Kα = 1.5418 Å), operating at 40 kV and 30 mA. The scanning of the crystallographic planes was performed at a speed of 1° min−1, with an increment of 0.02°, in the 2θ working range, from 5 to 80°. The calculations for determining the average size (Dhkl) of the crystallites were based on the selection of the characteristic peak of highest intensity, using the Scherrer Equation (1) [48].
where K is a constant, dependent on the particle shape (for spherical particles, K = 0.94); λ is the wavelength of electromagnetic radiation (λCu = 0.15418 nm); θ is the angle between the beam and the normal to the reflected surface (in radians), at which the diffraction peak occurs; and β (2θ) is the width of the peak at half height (in radians).
The percentage of crystallinity of the catalysts (C%) was obtained using Equation (2), which compares the sum of the intensities (areas) of the main diffraction peaks with the sum of the intensities of the corresponding diffraction peaks of the standard sample (HBEA zeolite) [48].
3.3.3. Ultraviolet–Visible Diffuse Reflectance Spectroscopy (UV-Vis DRS)
The catalysts, in their solid powder form, were analyzed using a Varian Cary 5000 spectrophotometer (Macquarie Park, Australia) equipped with a diffuse reflectance accessory. The band gap was calculated from the obtained spectra. It is directly related to the optical properties of the materials under study and provides an approximation of the true band gap value. This calculation was performed using the expression proposed by Tauc and collaborators [84] and applied to the Kubelka-Munk function [56,85], Equation (3):
where h is Planck’s constant; ν is the absorption frequency; α is the absorption coefficient; A is a proportionality constant; Eg is the band gap energy (eV); and for the samples analyzed, n = 1/2, a characteristic value for a semiconductor material.
3.3.4. Fourier Transform Infrared Spectroscopy (FT-IR)
The infrared spectra of the catalysts were obtained using an FT-spectrometer (Thermo Scientific, model Nicolet 6700, equipped with an MCT detector, Waltham, MA, USA). A total of 256 scans, with a resolution of 4 cm−1, were performed. Pellets were prepared for analysis using a 2 wt.% dilution (catalyst: KBr) and a pressure of 10 tons/min.
3.3.5. Measurements of the Raman Spectra
The spectra were acquired in the solid phase (powder form) using a high-resolution Raman spectrometer (Horiba Scientific LabRAM HR Evolution, Palaiseau, France) covering UV-Vis-NIR (220–2200 nm), without polarization. The analyses were performed with 64 acquisitions, each with an acquisition time of 5 s, a spectral resolution of 2 cm−1, and a 50× objective lens, along with a He/Ne laser (9 mW power and λ = 633 nm). No pretreatment was applied to the samples.
3.3.6. Scanning Electron Microscopy Coupled with Energy Dispersive X-Ray Spectrometer (SEM/EDS)
Scanning electron micrographs and qualitative elemental identification of the catalysts were obtained using a scanning electron microscope (SEM, Jeol model JSM-6610, Tokyo, Japan) coupled with an EDS spectrometer (Thermo Scientific NSS Spectral Imaging Energy Dispersive X-ray Spectroscopy, Tokyo, Japan). Analyses were performed at magnifications of up to 15,000×, a working distance of 1–10 µm, and a voltage range of 8.0–15.0 kV. The solid samples were prepared by carbon-coating the catalysts on a sample holder (stub) using a Jeol model JEE-420 (Tokyo, Japan). A thin layer of gold (Au) was then deposited on the samples using a Denton Vacuum Desk V model. These procedures enhance conductivity and facilitate adequate microscopic analysis. Particle size calculations were made using ImageJ (version 2.21.) image processing software.
3.3.7. Transmission Electron Microscopy Coupled with Energy Dispersive X-Ray Spectrometer (TEM/EDS)
Transmission electron micrographs and qualitative elemental identification of the catalysts were obtained using a transmission electron microscope (TEM, Jeol model JEM-2100, Tokyo, Japan) coupled with an EDS spectrometer (Thermo Scientific NSS Spectral Imaging Energy Dispersive X-ray Spectroscopy, Tokyo, Japan). Analyses were performed with a working distance of 5–200 nm and a voltage of up to 200 kV. Sample preparation was carried out in a manner like that used for SEM imaging and was processed using ImageJ.
3.3.8. N2 Sorption on the Catalysts
The textural characteristics of each catalyst were studied using a gaseous N2 physisorption system at low temperature, in a surface analyzer (Micromeritics, model ASAP 2020C, Norcross, GA, USA). First, the material was degassed by heating under reduced pressure for 4 h at 300 °C, with a limit pressure of 10 µmHg. In the second stage, N2 gas was flowed through the sample at −196 °C, facilitating its physisorption by the material. The resulting isotherm data were used to calculate the specific surface area, microporous area, and mesoporous area using the Brunauer–Emmett–Teller (BET), t-plot, and Barrett-Joyner-Halenda (BJH) methods, respectively.
3.3.9. Acidity Measurements of the Catalysts
First, the adsorption of pyridine on the catalysts was conducted using the following procedure. Approximately 15 mg of each catalyst was placed in aluminum crucibles and inserted into a glass tube connected to a tubular furnace (Thermolyne, model F21100, Dubuque, IA, USA). The samples were heated under a flow of 100 mL min−1 N2 gas for 1 h at 300 °C to remove any adsorbed water molecules. The system was then allowed to cool to 150 °C, and gaseous pyridine (Py) (liquid Py vapor carried by an N2 stream) was passed over the catalysts for 1 h. During this step, Py chemically binds to the acidic sites of the catalysts. The temperature was then maintained at 150 °C, the Py flow was blocked, and pure N2 gas was passed through the system for an additional 1 h to remove any physisorbed pyridine from the materials. After the system cooled, the samples were immediately analyzed using temperature programmed desorption (Py-TPD) and FT-IR. The Py-TPD experiment was followed by TG/DTG using approximately 10 mg of the catalysts and α-Al2O3 as the reference in separate platinum crucibles. These crucibles were heated to 700 °C at a rate of 10 °C min−1 in an N2 atmosphere with a flow rate of 100 mL min−1. A thermal analyzer (TA Instruments, model SDT 2960, New Castle, DE, USA) and TA Analysis software (version 4.7a) were used for the analysis. The quantification of the number of mmol of adsorbed pyridine per gram of material (nPy) was performed by comparing the mass loss of each sample with and without adsorbed pyridine. Details of the calculation procedure have been published previously [81].
4. Conclusions
This study presents the synthesis and characterization of iron(III) nitrate-impregnated *BEA zeolite catalysts, which, after calcination at 550 °C, yielded X% Fe2O3/*BEA (X = 10, 20, and 40 wt.%). Analyses using elemental analysis, XRD, UV–Vis DRS, FT–IR, Raman spectroscopy, SEM/EDS, TEM/EDS, and SAED revealed the structure of the catalysts in comparison with the *BEA support. Different iron(III) species were detected, including isolated Fe(III) species, and mainly larger but well-dispersed Fe2O3 nanoparticles coating the zeolite surface. In all cases, the original *BEA structure was largely preserved. The results of XRD, Raman, TEM/EDS, and SAED confirmed that the only crystalline phase of iron(III) oxide formed was hematite (α-Fe2O3), indicating that the synthesis method was effective in producing α-Fe2O3/*BEA catalysts. These catalysts showed semiconductor properties with approximately 2.0 eV band gaps, contained iron(III) oxide aggregates, and exhibited increased mesoporosity due to Fe2O3 aggregation. Acidity measurements by Py-TPD generally showed a reduction in total acid sites (Brønsted and Lewis) compared to the parent zeolite. The decrease in acid sites may be attributed to partial loss of *BEA zeolite crystallinity upon α-Fe2O3 loading, which, together with micropore blockage in HBEA, prevents pyridine from accessing many Brønsted sites. Nonetheless, the formation of additional Lewis sites can be expected with iron(III) oxide loading, since an overlayer of oxide nanocrystallites covers the zeolite surface. Thus, these features indicate that the α-Fe2O3/*BEA catalysts show promising potential for future application in various chemical reactions.
Supplementary Materials
The following supporting information can be downloaded at https://www.mdpi.com/article/10.3390/inorganics13120383/s1, S1: Procedure for the determination of Fe(III) in the catalysts; Table S1: Comparison of the main wavenumbers identified in the FT-IR spectra of the catalysts corresponding to HBEA vibrations; Figure S1: Curves used for band gap calculations of the catalysts: 10%, 20%, and 40% Fe2O3/*BEA; Figure S2: SEM images of: (A) HBEA, (B) 10% Fe2O3/*BEA, (C) 20% Fe2O3/*BEA, and (D) 40% Fe2O3/*BEA; Figure S3: TEM images of: (A) HBEA, (B) 10% Fe2O3/*BEA, (C) 20% Fe2O3/*BEA, and (D) 40% Fe2O3/*BEA; Figure S4: Adsorption/desorption isotherms of N2 adsorption (−196 °C) of: (a) HBEA, (a) 10% Fe2O3/*BEA, (b) 20% Fe2O3/*BEA, (c) 40% Fe2O3/*BEA, (d) Fe2O3, and (e) HBEA; Table S2: Comparison of interatomic distances (d) in the (h, k, l) planes obtained from SAED images with those from the crystallographic patterns of hematite (COD database, ID 1546383) and *BEA zeolite (IZA-SC Database of Zeolite Structures, Code: BEA). References [86,87,88] are cited in the supplementary materials.
Author Contributions
G.M.d.S.: conceptualization, data curation, formal analysis, investigation, methodology, writing—review and editing. M.F.P.: data curation, formal analysis, investigation, writing—review and editing. J.O.C.d.F.: data curation, formal analysis, investigation, writing—review and editing. S.C.L.D.: conceptualization, formal analysis, funding acquisition, investigation, methodology, project administration, writing—review and editing. J.A.D.: conceptualization, funding acquisition, investigation, methodology, project administration, writing—original draft, writing—review and editing. All authors have read and agreed to the published version of the manuscript.
Funding
Conselho Nacional de Desenvolvimento Científico e Tecnológico, CNPq (Grants 308693/2022-1 and 305397/2025-7); Coordenação de Aperfeiçoamento de Pessoal de Nível Superior, CAPES (Grant 001) for research and graduate student scholarships; Decanato de Pesquisa e Inovação (DPI) and Instituto de Química (IQ) from Universidade de Brasília (DPI/IQ/UnB); Fundação de Apoio à Pesquisa do Distrito Federal (FAPDF) (Grants 00193-000001176/2021-65 and 00193-00001144/2021-60); Fundação de Empreendimentos Científicos e Tecnológicos (FINATEC); Financiadora de Estudos e Projetos, FINEP/CTPetro/CTInfra; Petrobras.
Institutional Review Board Statement
Not applicable.
Informed Consent Statement
Not applicable.
Data Availability Statement
The original contributions presented in this study are included in the article/Supplementary Material. Further inquiries can be directed to the corresponding authors.
Acknowledgments
We are grateful to Richieli Vieira (commercial development coordinator, PQ Silicas Brazil) for providing *BEA zeolite (CP814E*). In addition, we would like to thank Tatiane Oliveira dos Santos from Laboratório Multiusuário de Microscopia de Alta Resolução (LabMic) at IF/UFG-Brazil for Raman and SEM/TEM/EDX measurements.
Conflicts of Interest
The authors declare no conflicts of interest. The company Petrobras had no role in the design of the study; in the collection, analyses, or interpretation of data; in the writing of the manuscript; or in the decision to publish the results.
References
- Luque, R.; Burange, A.S. Heterogeneous Catalysis; American Chemical Society: Washington, DC, USA, 2022. [Google Scholar]
- Na, K. Synthesis and Application of Zeolite Catalysts. Catalysts 2021, 11, 685. [Google Scholar] [CrossRef]
- Falcão, E.S.M.; Valadares, D.S.; dos Santos, G.M.; de Mendonça, E.S.D.T.; Santos, M.M.; Dias, S.C.L.; Dias, J.A. Preparation of 12-Tungstophosphoric Acid Embedded in a Silica Matrix and Its Effect on the Activity of 1-Propanol Dehydration. ACS Omega 2025, 10, 16277–16290. [Google Scholar] [CrossRef] [PubMed]
- Sheldon, R.A.; Arends, I.; Hanefeld, U. Green Chemistry and Catalysis; Wiley-VCH Verlag GmbH & Co. KGaA: Weinheim, Germany, 2007. [Google Scholar]
- Yilmaz, B.; Müller, U. Catalytic Applications of Zeolites in Chemical Industry. Top. Catal. 2009, 55, 888–895. [Google Scholar] [CrossRef]
- Khaleque, A.; Alam, M.M.; Hoque, M.; Mondal, S.; Haider, J.B.; Xu, B.; Moni, M.A. Zeolite synthesis from low-cost materials and environmental applications: A review. Environ. Adv. 2020, 2, 100019. [Google Scholar] [CrossRef]
- Hou, X.; Qiu, Y.; Zhang, X.; Liu, G. Analysis of reaction pathways for n-pentane cracking over zeolites to produce light olefins. J. Chem. Eng. 2017, 307, 372–381. [Google Scholar] [CrossRef]
- Sammoury, H.; Toufaily, J.; Cherry, K.; Hamieh, T.; Pouilloux, Y.; Pinard, L. Desilication of *BEA zeolites using different alkaline media: Impact on catalytic cracking of n-hexane. Microporous Mesoporous Mater. 2018, 267, 150–163. [Google Scholar] [CrossRef]
- Bjørgen, M.; Joensen, F.; Holm, M.S.; Olsbye, U.; Lillerud, K.P.; Svelle, S. Methanol to gasoline over zeolite H-ZSM-5: Improved catalyst performance by treatment with NaOH. Appl. Catal. A Gen. 2008, 345, 43–50. [Google Scholar] [CrossRef]
- Guisnet, M.; Ribeiro, F.R. Zeólitos: Um Nanomundo ao Serviço da Catálise; Fundação Calouste Gulbenkian: Lisboa, Portugal, 2004. [Google Scholar]
- Sebakhy, K.O.; Vitale, G.; Pereira-Almao, P. Production of Highly Dispersed Ni within Nickel Silicate Materials with the MFI Structure for the Selective Hydrogenation of Olefins. Ind. Eng. Chem. Res. 2019, 58, 8597–8611. [Google Scholar] [CrossRef]
- Jia, N.; Han, H.; Yang, T.; Zhang, M.; Liu, Z. Synthesis of Dimethyl Terephthalate from Terephthalic Acid Esterification over the Zeolite Catalysts. Inorganics 2025, 13, 184. [Google Scholar] [CrossRef]
- Bai, R.; Song, Y.; Li, Y.; Yu, J. Creating hierarchical pores in zeolite catalysts. Trends Chem. 2019, 1, 601–611. [Google Scholar] [CrossRef]
- Niwa, M.; Katada, N.; Okumura, K. Characterization and Design of Zeolite Catalysts: Solid Acidity, Shape Selectivity and Loading Properties; Springer: Berlin/Heidelberg, Germany, 2010. [Google Scholar]
- Shangbin, L.; Jinfu, W.; Longja, M.; Tseng-Chang, T.; Ikai, W. On the thermal stability of zeolite beta. J. Catal. 1991, 132, 432–439. [Google Scholar] [CrossRef]
- Jon, H.; Lu, B.; Oumi, Y.; Itabashi, K.; Sano, T. Synthesis and thermal stability of beta zeolite using ammonium fluoride. Microporous Mesoporous Mater. 2006, 89, 88–95. [Google Scholar] [CrossRef]
- Quintero, M.; Perez, M.; Meléndez, H.; Rondon, J.; Imbert, F. Síntesis y caracterización de la zeolita Beta. Av. Quim. 2012, 7, 223–226. Available online: http://www.redalyc.org/articulo.oa?id=93325703010 (accessed on 20 March 2025).
- Sazama, P.; Tabor, E.; Klein, P.; Wichterlova, B.; Sklenak, S.; Mokrzycki, L.; Dedecek, J. Al-rich beta zeolites. Distribution of Al atoms in the framework and related protonic and metal-ion species. J. Catal. 2016, 333, 102–114. [Google Scholar] [CrossRef]
- Corma, A. Inorganic solid acids and their use in acid-catalyzed hydrocarbon reactions. Chem. Rev. 1995, 95, 559–614. [Google Scholar] [CrossRef]
- Martínez-Franco, R.; Paris, C.; Martínez-Armero, M.E.; Martínez, C.; Moliner, M.; Corma, A. High-silica nanocrystalline Beta zeolites: Efficient synthesis and catalytic application. Chem. Sci. 2016, 7, 102–108. [Google Scholar] [CrossRef]
- Pornsetmetakul, P.; Coumans, F.J.; van de Poll, R.C.; Liutkova, A.; Suttipat, D.; Mezari, B.; Hensen, E.J. Post-synthesis metal (Sn, Zr, Hf) modification of BEA zeolite: Combined Lewis and Bronsted acidity for cascade catalysis. Chin. J. Catal. 2023, 55, 200–215. [Google Scholar] [CrossRef]
- Gac, W.; Zawadzki, W.; Słowik, G.; Grudziński, W.; Dzwigaj, S. BEA zeolite supported Ce-promoted nickel catalysts for CO2 methanation. Catal. Today 2024, 437, 114728. [Google Scholar] [CrossRef]
- Zheng, X.; Jiao, Y.; Chai, F.; Qu, F.; Umar, A.; Wu, X. Template-free growth of well-crystalline α-Fe2O3 nanopeanuts with enhanced visible-light driven photocatalytic properties. J. Colloid Interface Sci. 2015, 457, 345–352. [Google Scholar] [CrossRef]
- Yang, X.; Cheng, X.; Elzatahry, A.A.; Chen, J.; Alghamdi, A.; Deng, Y. Recyclable Fenton-like catalyst based on zeolite Y supported ultrafine, highly-dispersed Fe2O3 nanoparticles for removal of organics under mild conditions. Chin. Chem. Lett. 2019, 30, 324–330. [Google Scholar] [CrossRef]
- Liu, N.; Zhang, R.; Chen, B.; Li, Y.; Li, Y. Comparative study on the direct decomposition of nitrous oxide over M (Fe, Co, Cu)–BEA zeolites. J. Catal. 2012, 294, 99–112. [Google Scholar] [CrossRef]
- Ogura, M.; Itabashi, K.; Dedecek, J.; Onkawa, T.; Shimada, Y.; Kawakami, K.; Okubo, T. Stabilization of bare divalent Fe(II) cations in Al-rich beta zeolites for superior NO adsorption. J. Catal. 2014, 315, 1–5. [Google Scholar] [CrossRef]
- Martín, N.; Vennestrøm, P.N.; Thøgersen, J.R.; Moliner, M.; Corma, A. Fe-Containing Zeolites for NH3-SCR of NOx: Effect of Structure, Synthesis Procedure, and Chemical Composition on Catalytic Performance and Stability. Chem.—A Eur. J. 2017, 23, 13404–13414. [Google Scholar] [CrossRef]
- Campisi, S.; Palliggiano, S.; Gervasini, A.; Evangelisti, C. Finely iron-dispersed particles on β zeolite from solvated iron atoms: Promising catalysts for NH3-SCO. J. Phys. Chem. C 2019, 123, 11723–11733. [Google Scholar] [CrossRef]
- Liu, B.; Chen, Z.; Huang, J.; Xia, Q.; Wu, Y.; Chen, H.; Fang, Y. Development of iron encapsulated hollow beta zeolites for ammonia selective catalytic reduction. Ind. Eng. Chem. Res. 2019, 58, 2914–2923. [Google Scholar] [CrossRef]
- Cornell, R.M.; Schwertmann, U. The Iron Oxides—Structure, Properties, Reactions, Occurences and Uses, 2nd ed.; Wiley-VCH Verlag GmbH & Co. KGaA: Weinheim, Germany, 2003. [Google Scholar]
- Li, Y.; Shen, W. Morphology-dependent nanocatalysts: Rod-shaped oxides. Chem. Soc. Rev. 2014, 43, 1543–1574. [Google Scholar] [CrossRef]
- Greenwood, N.N.; Earnshaw, A. Chemistry of the Elements; Pergamon Press: Oxford, UK, 1994. [Google Scholar]
- Oliveira, L.C.; Fabris, J.D.; Pereira, M.C. Óxidos de ferro e suas aplicações em processos catalíticos: Uma revisão. Qui. Nova 2013, 36, 123–130. [Google Scholar] [CrossRef]
- Pariente, J.P.; Sánchez-Sánchez, M. (Eds.) Structure and Reactivity of Metals in Zeolite Materials; Springer International Publishing: Cham, Switzerland, 2018. [Google Scholar] [CrossRef]
- Longati, A.A.; Ferreira, W.C.; Quintão, C.M.F.; Maloncy, M.L.; Batista, M.S. Conversão Química de NO e CO sobre Catalisadores à Base de Óxidos de Cobalto ou de Ferro. Qui. Nova 2014, 37, 221–225. [Google Scholar] [CrossRef]
- Pinna, F. Supported metal catalysts preparation. Catal. Today 1998, 41, 129–137. [Google Scholar] [CrossRef]
- Sazama, P.; Sathu, N.K.; Tabor, E.; Wichterlová, B.; Sklenák, Š.; Sobalík, Z. Structure and critical function of Fe and acid sites in Fe-ZSM-5 in propane oxidative dehydrogenation with N2O and N2O decomposition. J. Catal. 2013, 299, 188–203. [Google Scholar] [CrossRef]
- Starokon, E.V.; Parfenov, M.V.; Arzumanov, S.S.; Pirutko, L.V.; Stepanov, A.G.; Panov, G.I. Oxidation of methane to methanol on the surface of FeZSM-5 zeolite. J. Catal. 2013, 300, 47–54. [Google Scholar] [CrossRef]
- Pérez-Ramírez, J.; Groen, J.C.; Brückner, A.; Kumar, M.S.; Bentrup, U.; Debbagh, M.N.; Villaescusa, L.A. Evolution of isomorphously substituted iron zeolites during activation: Comparison of Fe-beta and Fe-ZSM-5. J. Catal. 2005, 232, 318–334. [Google Scholar] [CrossRef]
- Jíša, K.; Nováková, J.; Schwarze, M.; Vondrová, A.; Sklenák, S.; Sobalik, Z. Role of the Fe-zeolite structure and iron state in the N2O decomposition: Comparison of Fe-FER, Fe-BEA, and Fe-MFI catalysts. J. Catal. 2009, 262, 27–34. [Google Scholar] [CrossRef]
- Ma, L.; Chang, H.; Yang, S.; Chen, L.; Fu, L.; Li, J. Relations between iron sites and performance of Fe/HBEA catalysts prepared by two different methods for NH3-SCR. Chem. Eng. J. 2012, 209, 652–660. [Google Scholar] [CrossRef]
- Ma, L.; Li, J.; Arandiyan, H.; Shi, W.; Liu, C.; Fu, L. Influence of calcination temperature on Fe/HBEA catalyst for the selective catalytic reduction of NOx with NH3. Catal. Today 2012, 184, 145–152. [Google Scholar] [CrossRef]
- Xiao, P.; Wang, Y.; Nishitoba, T.; Kondo, J.N.; Yokoi, T. Selective oxidation of methane to methanol with H2O2 over an Fe-MFI zeolite catalyst using sulfolane solvent. Chem. Commun. 2019, 55, 2896–2899. [Google Scholar] [CrossRef]
- Jaafar, N.F.; Jalil, A.A.; Triwahyono, S.; Muhid, M.N.M.; Sapawe, N.; Satar, M.A.H.; Asaari, H. Photodecolorization of methyl orange over α-Fe2O3-supported HY catalysts: The effects of catalyst preparation and dealumination. Chem. Eng. J. 2012, 191, 112–122. [Google Scholar] [CrossRef]
- Oliveira, J.S.D.; Mazutti, M.A.; Urquieta-González, E.A.; Foletto, E.L.; Jahn, S.L. Preparation of mesoporous Fe2O3-supported ZSM-5 zeolites by carbon-templating and their evaluation as photo-Fenton catalysts to degrade organic pollutant. Mat. Res. 2016, 19, 1399–1406. [Google Scholar] [CrossRef]
- Rao, W.; You, C.; Jiang, Y.; Guo, X.; Li, D.; Xu, X.; Lin, K. Iron-doped hierarchically porous Fe-ZSM-5 zeolite with 3D continuous pore architecture for catalytical degradations. Mater. Chem. Phys. 2021, 271, 124704. [Google Scholar] [CrossRef]
- Russo, A.V.; Merlo, B.G.; Jacobo, S.E. Adsorption and catalytic degradation of Tartrazine in aqueous medium by a Fe-modified zeolite. Clean. Eng. Technol. 2021, 4, 100211. [Google Scholar] [CrossRef]
- Chorkendorff, I.; Niemantsverdriet, J.W. Concepts of Modern Catalysis and Kinetics; Wiley-VCH Verlag GmbH & Co. KGaA: Weinheim, Germany, 2003. [Google Scholar]
- Liu, X.; Mäki-Arvela, P.; Aho, A.; Vajglova, Z.; Gun’ko, V.M.; Heinmaa, I.; Murzin, D.Y. Zeta potential of beta zeolites: Influence of structure, acidity, pH, temperature and concentration. Molecules 2018, 23, 946. [Google Scholar] [CrossRef] [PubMed]
- Tavolaro, P.; Tavolaro, A.; Martino, G. Influence of zeolite PZC and pH on the immobilization of cytochrome c: A preliminary study regarding the preparation of new biomaterials. Colloids Surf. B 2009, 70, 98–107. [Google Scholar] [CrossRef]
- Moulijn, J.A.; van Leeuwen, P.W.; van Santen, R.A. (Eds.) Catalysis: An Integrated Approach to Homogeneous, Heterogeneous and Industrial Catalysis; Elsevier: Amsterdam, The Netherlands, 1993; Volume 79. [Google Scholar]
- Freitas, E.F.; Araujo, A.A.; Paiva, M.F.; Dias, S.C.L.; Dias, J.A. Comparative acidity of BEA and Y zeolite composites with 12-tungstophosphoric and 12-tungstosilicic acids. Mol. Catal. 2018, 458, 152–160. [Google Scholar] [CrossRef]
- Najjar, S.; Talaga, D.; Coffinier, Y.; Szunerits, S.; Boukherroub, R.; Servant, L.; Bonhommeau, S. Characterization of single transition metal oxide nanorods by combining atomic force microscopy and polarized micro-Raman spectroscopy. Chem. Phys. Lett. 2011, 514, 128–133. [Google Scholar] [CrossRef]
- Boroń, P.; Chmielarz, L.; Gurgul, J.; Łątka, K.; Gil, B.; Krafft, J.M.; Dzwigaj, S. The influence of the preparation procedures on the catalytic activity of Fe-BEA zeolites in SCR of NO with ammonia and N2O decomposition. Catal. Today 2014, 235, 210–225. [Google Scholar] [CrossRef]
- Silaghi, M.C.; Chizallet, C.; Raybaud, P. Challenges on molecular aspects of dealumination and desilication of zeolites. Microporous Mesoporous Mater. 2014, 191, 82–96. [Google Scholar] [CrossRef]
- Sayed, F.N.; Polshettiwar, V. Facile and sustainable synthesis of shaped iron oxide nanoparticles: Effect of iron precursor salts on the shapes of iron oxides. Sci. Rep. 2015, 5, 9733. [Google Scholar] [CrossRef]
- Kou, Y.; Luo, P.; Xiao, L.; Xin, Y.; Zhang, G.; Hu, Y.; Hao, G. The positive correlation between the dispersion and catalytic performance of Fe2O3 nanoparticles in nano-Fe2O3–ultrafine AP energetic composites supported by solid UV-vis spectroscopy. Dalton Trans. 2023, 52, 12796–12807. [Google Scholar] [CrossRef]
- Parhizkar, J.; Habibi, M.H. Synthesis, characterization and photocatalytic properties of Iron oxide nanoparticles synthesized by sol-gel autocombustion with ultrasonic irradiation. Nanochem. Res. 2017, 2, 166–171. [Google Scholar] [CrossRef]
- Neamţu, M.; Catrinescu, C.; Kettrup, A. Effect of dealumination of iron(III) –exchanged Y zeolites on oxidation of Reactive Yellow 84 azo dye in the presence of hydrogen peroxide. Appl. Catal. B 2004, 51, 149–157. [Google Scholar] [CrossRef]
- Rache, M.L.; García, A.R.; Zea, H.R.; Silva, A.M.; Madeira, L.M.; Ramírez, J.H. Azo-dye orange II degradation by the heterogeneous Fenton-like process using a zeolite Y-Fe catalyst—Kinetics with a model based on the Fermi’s equation. Appl. Catal. B 2014, 146, 192–200. [Google Scholar] [CrossRef]
- Campos, E.A.; Pinto, D.V.B.S.; Oliveira, J.I.S.D.; Mattos, E.D.C.; Dutra, R.D.C.L. Synthesis, characterization and applications of iron oxide nanoparticles-a short review. J. Aerosp. Technol. Manag. 2015, 7, 267–276. [Google Scholar] [CrossRef]
- Dehbi, A.; Dehmani, Y.; Omari, H.; Lammini, A.; Elazhari, K.; Abdallaoui, A. Hematite iron oxide nanoparticles (α-Fe2O3): Synthesis and modelling adsorption of malachite green. J. Environ. Chem. Eng. 2020, 8, 103394. [Google Scholar] [CrossRef]
- Kim, J.; Jentys, A.; Maier, S.M.; Lercher, J.A. Characterization of Fe-exchanged BEA zeolite under NH3 selective catalytic reduction conditions. J. Phys. Chem. C 2013, 117, 986–993. [Google Scholar] [CrossRef]
- De Faria, D.L.; Venâncio Silva, S.; de Oliveira, M.T. Raman microspectroscopy of some iron oxides and oxyhydroxides. J. Raman Spectrosc. 1997, 28, 873–878. [Google Scholar] [CrossRef]
- Jubb, A.M.; Allen, H.C. Vibrational spectroscopic characterization of hematite, maghemite, and magnetite thin films produced by vapor deposition. ACS Appl. Mater. Interfaces 2010, 2, 2804–2812. [Google Scholar] [CrossRef]
- Mihailova, B.; Valtchev, V.; Mintova, S.; Faust, A.C.; Petkov, N.; Bein, T. Interlayer stacking disorder in zeolite beta family: A Raman spectroscopic study. Phys. Chem. Chem. Phys. 2005, 7, 2756–2763. [Google Scholar] [CrossRef] [PubMed]
- Bárcia, P.S.; Silva, J.A.; Rodrigues, A.E. Adsorption equilibrium and kinetics of branched hexane isomers in pellets of BETA zeolite. Microporous Mesoporous Mater. 2005, 79, 145–163. [Google Scholar] [CrossRef]
- Bandala, E.R.; Sadek, R.; Gurgul, J.; Łątka, K.; Zimowska, M.; Valentin, L.; Dzwigaj, S. Assessment of the capability of Fe and Al modified BEA zeolites to promote advanced oxidation processes in aqueous phase. Chem. Engin. J. 2021, 409, 127379. [Google Scholar] [CrossRef]
- Zhang, H.; Xie, B.; Meng, X.; Müller, U.; Yilmaz, B.; Feyen, M.; Xiao, F.S. Rational synthesis of Beta zeolite with improved quality by decreasing crystallization temperature in organotemplate-free route. Microporous Mesoporous Mater. 2013, 180, 123–129. [Google Scholar] [CrossRef]
- Tadic, M.; Kopanja, L.; Panjan, M.; Lazovic, J.; Tadic, B.V.; Stanojevic, B.; Motte, L. Rhombohedron and plate-like hematite (α-Fe2O3) nanoparticles: Synthesis, structure, morphology, magnetic properties and potential biomedical applications for MRI. Mater. Res. Bull. 2021, 133, 111055. [Google Scholar] [CrossRef]
- da Silva, C.P.; da Guarda Souza, M.O.; Huaman, N.R.C.; Neves, I.R.; Brandão, S.T. Rapid and sustainable synthesis of iron (III) oxide nanoparticles with photocatalytic properties using microwave heating. Appl. Catal. A Gen. 2025, 708, 120551. [Google Scholar] [CrossRef]
- Aslam, M.; Qamar, M.T.; Rehman, A.U.; Soomro, M.T.; Ali, S.; Ismail, I.M.I.; Hameed, A. The evaluation of the photocatalytic activity of magnetic and non-magnetic polymorphs of Fe2O3 in natural sunlight exposure: A comparison of photocatalytic activity. Appl. Surf. Sci. 2018, 451, 128–140. [Google Scholar] [CrossRef]
- Petushkov, A.; Merilis, G.; Larsen, S.C. From nanoparticles to hierarchical structures: Controlling the morphology of zeolite beta. Microporous Mesoporous Mater. 2011, 143, 97–103. [Google Scholar] [CrossRef]
- Escola, J.M.; Serrano, D.P.; Sanz, R.; Garcia, R.A.; Peral, A.; Moreno, I.; Linares, M.J.C.T. Synthesis of hierarchical Beta zeolite with uniform mesopores: Effect on its catalytic activity for veratrole acylation. Catal. Today 2018, 304, 89–96. [Google Scholar] [CrossRef]
- Thommes, M.; Kaneko, K.; Neimark, A.V.; Olivier, J.P.; Rodriguez-Reinoso, F.; Rouquerol, J.; Sing, K.S.W. Physisorption of Gases, with Special Reference to the Evaluation of Surface Area and Pore Size Distribution (IUPAC Technical Report). Pure Appl. Chem. 2015, 87, 1051–1069. [Google Scholar] [CrossRef]
- da Silva Valadares, D.; de Carvalho, W.H.R.; Fonseca, A.L.F.; Machado, G.d.F.; Silva, M.R.; Campos, P.T.A.; Dias, J.A.; Dias, S.C.L. Different Routes for the Hierarchization of *BEA Zeolite, Followed by Impregnation with Niobium and Application in Ethanol and 1-Propanol Dehydration. Catalysts 2025, 15, 340. [Google Scholar] [CrossRef]
- Valadares, D.S.; Clemente, M.C.H.; de Freitas, E.F.; Martins, G.A.V.; Dias, J.A.; Dias, S.C.L. Niobium on BEA Dealuminated Zeolite for High Selectivity Dehydration Reactions of Ethanol and Xylose into Diethyl Ether and Furfural. Nanomaterials 2020, 10, 1269. [Google Scholar] [CrossRef]
- Drago, R.S.; Dias, S.C.; Torrealba, M.; de Lima, L. Calorimetric and spectroscopic investigation of the acidity of HZSM-5. J. Am. Chem. Soc. 1997, 119, 4444–4452. [Google Scholar] [CrossRef]
- Parry, E.P. An infrared study of pyridine adsorbed on acidic solids. Characterization of surface acidity. J. Catal. 1963, 2, 371–379. [Google Scholar] [CrossRef]
- Valadares, D.d.S.; de França, J.O.C.; Fernandes, R.C.; Dezaneti, L.M.; Loureiro Dias, S.C.; Dias, J.A. Liquid Phase Calorimetric Method as a Tool for Acid Strength Measurements and Application to a Variety of Sustainable Catalysts. Chemistry 2023, 5, 1138–1170. [Google Scholar] [CrossRef]
- de Mendonça, E.S.D.T.; de Faria, A.C.B.; Dias, S.C.L.; Aragón, F.F.; Mantilla, J.C.; Coaquira, J.A.; Dias, J.A. Effects of silica coating on the magnetic properties of magnetite nanoparticles. Surf. Interfaces 2019, 14, 34–43. [Google Scholar] [CrossRef]
- Jeffery, G.H.; Basset, J.; Mendham, J.; Denney, R.C. Textbook of Quantitative Chemical Analysis, 5th ed.; Longman Group: London, UK, 1989. [Google Scholar]
- Breitkreitz, M.C.; Souza, A.M.D.; Poppi, R.J. Experimento didático de quimiometria para planejamento de experimentos: Avaliação das condições experimentais na determinação espectrofotométrica de ferro II com o-fenantrolina. Um tutorial, parte III. Quí. Nova 2014, 37, 564–573. [Google Scholar] [CrossRef]
- Tauc, J.; Grigorovici, R.; Vancu, A. Optical properties and electronic structure of amorphous germanium. Phys. Status Solidi B 1966, 15, 627–637. [Google Scholar] [CrossRef]
- Shimadzu Corporation. Measurements of Band Gap in Compound Semiconductors–Band Gap Determination from Diffuse Reflectance Spectra. Applications News—Spectrophotometric analysis, Nº. A428. Available online: https://www.ssi.shimadzu.com/literature/literature1338.html (accessed on 30 March 2025).
- Baerlocher, C.; McCusker, L.B.; Gies, H.; Marler, B. Database of Disordered Zeolite Structures. Available online: http://www.iza-structure.org/databases/ (accessed on 25 October 2025).
- El Mendili, Y.; Bardeau, J.-F.; Randrianantoandro, N.; Grasset, F.; Greneche, J.-M. Insights into the Mechanism Related to the Phase Transition from α-Fe2O3 to γ-Fe2O3 Nanoparticles Induced by Thermal Treatment and Laser Irradiation. J. Phys. Chem C 2012, 116, 23785–23792. [Google Scholar] [CrossRef]
- Vaitkus, A.; Merkys, A.; Sander, T.; Quirós, M.; Thiessen, P.A.; Bolton, E.E.; Gražulis, S. A workflow for deriving chemical entities from crystallographic data and its application to the Crystallography Open Database. J. Cheminform. 2023, 15, 123. [Google Scholar] [CrossRef]
Disclaimer/Publisher’s Note: The statements, opinions and data contained in all publications are solely those of the individual author(s) and contributor(s) and not of MDPI and/or the editor(s). MDPI and/or the editor(s) disclaim responsibility for any injury to people or property resulting from any ideas, methods, instructions or products referred to in the content. |
© 2025 by the authors. Licensee MDPI, Basel, Switzerland. This article is an open access article distributed under the terms and conditions of the Creative Commons Attribution (CC BY) license (https://creativecommons.org/licenses/by/4.0/).