
The Electrochemical Performance of Co3O4 Electrodes with Platinum Nanoparticles for Chlorine Evolution


Abstract
1. Introduction
2. Results and Discussion
2.1. Crystallinity Analysis
2.2. Raman Spectroscopy Analysis
2.3. FTIR Spectrum Studies
2.4. Microstructure and Composition Analysis
2.5. Textural and Structural Characterization
2.6. Electrochemical Characterization Analysis
2.7. Time-Dependent Chlorine Evolution
- The sample exhibited the highest charge transfer efficiency with minimal AC resistance and consequently the highest flat band potential (as presented in Figure 8).
3. Experimental
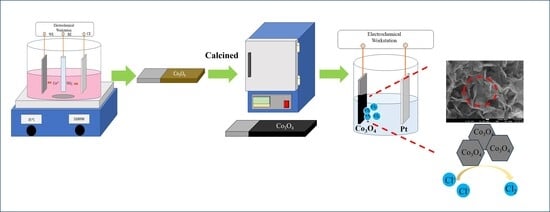
3.1. Materials
3.2. Co3O4 Electrode Fabrication
3.3. Material Characterization
3.4. Electrical Property Measurements
3.5. Chlorine Evolution Measurement
4. Conclusions
Author Contributions
Funding
Institutional Review Board Statement
Informed Consent Statement
Data Availability Statement
Acknowledgments
Conflicts of Interest
Appendix A

References
- Greenwood, N.N.; Earnshaw, A. Chemistry of the Elements; Elsevier: Amsterdam, The Netherlands, 2012. [Google Scholar]
- Moreno-Hernandez, I.A.; Brunschwig, B.S.; Lewis, N.S. Crystalline nickel, cobalt, and manganese antimonates as electrocatalysts for the chlorine evolution reaction. Energy Environ. Sci. 2019, 12, 1241–1248. [Google Scholar] [CrossRef]
- Nasirpouri, F.; Alipour, K.; Daneshvar, F.; Sanaeian, M.-R. Electrodeposition of anticorrosion nanocoatings. In Corrosion Protection at the Nanoscale; Elsevier: Amsterdam, The Netherlands, 2020; pp. 473–497. [Google Scholar]
- Jo, H.-G.; Kim, K.-H.; Ahn, H.-J. Well-dispersed Pt/RuO2-decorated mesoporous N-doped carbon as a hybrid electrocatalyst for Li–O2 batteries. RSC Adv. 2021, 11, 12209–12217. [Google Scholar] [CrossRef] [PubMed]
- Hu, J.; Xu, H.; Feng, X.; Lei, L.; He, Y.; Zhang, X. Neodymium-Doped IrO2 Electrocatalysts Supported on Titanium Plates for Enhanced Chlorine Evolution Reaction Performance. ChemElectroChem 2021, 8, 1204–1210. [Google Scholar] [CrossRef]
- Clayton, J.A.; Walton, R.I. Development of New Mixed-Metal Ruthenium and Iridium Oxides as Electrocatalysts for Oxygen Evolution: Part II: Mechanistic understanding and practical considerations. Johns. Matthey Technol. Rev. 2022, 66, 406–417. [Google Scholar] [CrossRef]
- Cheng, W.; Liu, Y.; Wu, L.; Chen, R.; Wang, J.; Chang, S.; Ma, F.; Li, Y.; Ni, H. RuO2/IrO2 nanoparticles decorated TiO2 nanotube arrays for improved activity towards chlorine evolution reaction. Catal. Today 2022, 400, 26–34. [Google Scholar] [CrossRef]
- Palma-Goyes, R.; Vazquez-Arenas, J.; Ostos, C.; Torres-Palma, R.; González, I. The effects of ZrO2 on the electrocatalysis to yield active chlorine species on Sb2O5-doped Ti/RuO2 anodes. J. Electrochem. Soc. 2016, 163, H818. [Google Scholar] [CrossRef]
- Ren, Q.; Feng, Z.; Mo, S.; Huang, C.; Li, S.; Zhang, W.; Chen, L.; Fu, M.; Wu, J.; Ye, D. 1D-Co3O4, 2D-Co3O4, 3D-Co3O4 for catalytic oxidation of toluene. Catal. Today 2019, 332, 160–167. [Google Scholar] [CrossRef]
- Jiang, S.; Suo, H.; Zhang, T.; Liao, C.; Wang, Y.; Zhao, Q.; Lai, W. Recent advances in seawater electrolysis. Catalysts 2022, 12, 123. [Google Scholar] [CrossRef]
- Bae, J.; Shin, D.; Jeong, H.; Kim, B.-S.; Han, J.W.; Lee, H. Highly water-resistant La-doped Co3O4 catalyst for CO oxidation. ACS Catal. 2019, 9, 10093–10100. [Google Scholar] [CrossRef]
- Dissanayake, S.; Wasalathanthri, N.; Amin, A.S.; He, J.; Poges, S.; Rathnayake, D.; Suib, S.L. Mesoporous Co3O4 catalysts for VOC elimination: Oxidation of 2-propanol. Appl. Catal. A Gen. 2020, 590, 117366. [Google Scholar] [CrossRef]
- Anele, A.; Obare, S.; Wei, J. Recent trends and advances of Co3O4 nanoparticles in environmental remediation of bacteria in wastewater. Nanomaterials 2022, 12, 1129. [Google Scholar] [CrossRef]
- Nikoloski, A.N.; Barmi, M.J. Novel lead–cobalt composite anodes for copper electrowinning. Hydrometallurgy 2013, 137, 45–52. [Google Scholar] [CrossRef]
- Nikoloski, A.N.; Barmi, J.M. Dimensionally Stable Lead-Cobalt Oxide Coated Composite Anodes. Australian Patent 2013901230, 15 April 2013. [Google Scholar]
- D’Aloya, A.; Nikoloski, A.N. An electrochemical investigation of the formation of CoSx and its effect on the anodic dissolution of iron in ammoniacal-carbonate solutions. Hydrometallurgy 2013, 131, 99–106. [Google Scholar] [CrossRef]
- Barmi, M.J.; Nikoloski, A.N. Electrodeposition of lead–cobalt composite coatings electrocatalytic for oxygen evolution and the properties of composite coated anodes for copper electrowinning. Hydrometallurgy 2012, 129, 59–66. [Google Scholar] [CrossRef]
- Nikoloski, A.; Nicol, M. Addition of cobalt to lead anodes used for oxygen evolution—A literature review. Miner. Process. Extr. Metall. Rev. 2009, 31, 30–57. [Google Scholar] [CrossRef]
- Yang, G.; Cheng, Q.; Liao, F.; Mao, L.; Zhao, X.; Chen, L. Two-dimensional porous CeO2@ Co3 O4 sheet-like heterostructures for high-performance aqueous hybrid supercapacitors. Dalton Trans. 2022, 51, 18296–18307. [Google Scholar] [CrossRef]
- Zhu, X.; Wang, P.; Wang, Z.; Liu, Y.; Zheng, Z.; Zhang, Q.; Zhang, X.; Dai, Y.; Whangbo, M.-H.; Huang, B. Co3O4 nanobelt arrays assembled with ultrathin nanosheets as highly efficient and stable electrocatalysts for the chlorine evolution reaction. J. Mater. Chem. A 2018, 6, 12718–12723. [Google Scholar] [CrossRef]
- Ganguli, S.; Koppisetti, H.V.; Ghosh, S.; Biswas, T.; Mahalingam, V. Paradoxical Observance of “Intrinsic” and “Geometric” Oxygen Evolution Electrocatalysis in Phase-Tuned Cobalt Oxide/Hydroxide Nanoparticles. ACS Appl. Nano Mater. 2019, 2, 7957–7968. [Google Scholar] [CrossRef]
- Han, J.-L.; Meng, Q.-F.; Gao, S.-L. Facile synthesis of Co3O4 hexagonal plates by flux method. J. Cryst. Growth 2018, 482, 23–29. [Google Scholar] [CrossRef]
- Li, K.; Chen, C.; Bian, X.; Sun, T.; Jia, J. Electrolytic nitrate reduction using Co3O4 rod-like and sheet-like cathodes with the control of (220) facet exposure and Co2+/Co3+ ratio. Electrochim. Acta 2020, 362, 137121. [Google Scholar] [CrossRef]
- Zhang, R.; Pan, L.; Guo, B.; Huang, Z.-F.; Chen, Z.; Wang, L.; Zhang, X.; Guo, Z.; Xu, W.; Loh, K.P. Tracking the role of defect types in Co3O4 structural evolution and active motifs during oxygen evolution reaction. J. Am. Chem. Soc. 2023, 145, 2271–2281. [Google Scholar] [CrossRef]
- Wang, Z.; Yuan, Q.; Li, Y.; Zhou, X.; Liu, X.; Yang, H.; Zhang, Z.; Duan, D.; Liu, S. 3D-Graphite Felt Self-loaded Rich Co3O4 Nanoparticle Electrodes for Chlorine Evolution Reaction at Low Concentration Chloride Ion. Catal. Lett. 2024, 154, 886–898. [Google Scholar] [CrossRef]
- Zhang, X.; Wu, D.; Liu, X.; Qiu, Y.; Liu, Z.; Xie, H.; Duan, J.; Hou, B. Efficient electrocatalytic chlorine evolution under neutral seawater conditions enabled by highly dispersed Co3O4 catalysts on porous carbon. Appl. Catal. B Environ. 2023, 330, 122594. [Google Scholar] [CrossRef]
- He, Y.; Tao, X.; Li, Z.; Gao, G.; Zhuang, J.; He, L.; Li, Y.; Wang, Y.; Sun, D.; Xie, A. The Mg-Co3O4 coating on indium tin oxide film with improved electrochromic and energy storage properties by sol-gel spin coating. Ceram. Int. 2023, 49, 32237–32245. [Google Scholar] [CrossRef]
- Roniboss, A.; Sindhu, S.; Kennedy, L.J.; Arockiasamy, S. Synthesis and thermal properties of two novel cobalt (II) Schiff’s base complexes as precursors for coating cobalt oxide (Co3O4) thin film by a Plasma Enhanced Metallo-Organic Chemical Vapour Deposition. J. Mol. Struct. 2023, 1272, 134189. [Google Scholar] [CrossRef]
- Azevedo Neto, N.F.; Angelico, J.C.; da Silva Pelissari, M.R.; Camargo, L.P.; Simões, R.P.; Dall’Antonia, L.H.; Dias da Silva, J.H. Reactive sputtering deposition of Co3O4 films and an evaluation of its use as an electrochemical sensor for ascorbic acid. J. Mater. Sci. Mater. Electron. 2022, 33, 19678–19692. [Google Scholar] [CrossRef]
- Yuan, C.; Li, M.; Wang, M.; Dan, Y.; Lin, T.; Cao, H.; Zhang, M.; Zhao, P.; Yang, H. Electrochemical development and enhancement of latent fingerprints on stainless steel via electrochromic effect of electrodeposited Co3O4 films. Electrochim. Acta 2021, 370, 137771. [Google Scholar] [CrossRef]
- Chen, D.; Kang, Z.; Li, W. One-step electrodeposition to fabricate superhydrophobic coating and its reversible wettability transformation. Mater. Res. Express 2019, 7, 016404. [Google Scholar] [CrossRef]
- Bchiri, Y.; Souissi, R.; Bouricha, B.; Bouguila, N.; Kraini, M.; Vázquez-Vázquez, C.; López-Quintela, M.; Alaya, S. S/In molar ratio effect on the photoconductivity of the sprayed β-In 2 S 3 thin films. J. Mater. Sci. Mater. Electron. 2021, 32, 27995–28006. [Google Scholar] [CrossRef]
- Saha, S.; Johnson, M.; Altayaran, F.; Wang, Y.; Wang, D.; Zhang, Q. Electrodeposition fabrication of chalcogenide thin films for photovoltaic applications. Electrochem 2020, 1, 286–321. [Google Scholar] [CrossRef]
- Janotti, A.; Varley, J.; Rinke, P.; Umezawa, N.; Kresse, G.; Van de Walle, C. Hybrid functional studies of the oxygen vacancy in TiO2. Phys. Rev. B 2010, 81, 085212. [Google Scholar] [CrossRef]
- Zhang, Q.; Yang, P.; Zhang, H.; Zhao, J.; Shi, H.; Huang, Y.; Yang, H. Oxygen vacancies in Co3O4 promote CO2 photoreduction. Appl. Catal. B Environ. 2022, 300, 120729. [Google Scholar] [CrossRef]
- Wu, J.; Tao, Y.; Zhang, C.; Zhu, Q.; Zhang, D.; Li, G. Activation of chloride by oxygen vacancies-enriched TiO2 photoanode for efficient photoelectrochemical treatment of persistent organic pollutants and simultaneous H2 generation. J. Hazard. Mater. 2023, 443, 130363. [Google Scholar] [CrossRef]
- Diallo, A.; Beye, A.; Doyle, T.B.; Park, E.; Maaza, M. Green synthesis of Co3O4 nanoparticles via Aspalathus linearis: Physical properties. Green Chem. Lett. Rev. 2015, 8, 30–36. [Google Scholar] [CrossRef]
- Zhang, B.; Tian, Y.; Zhang, J.; Cai, W. The role of oxygen vacancy in fluorine-doped SnO2 films. Phys. B Condens. Matter 2011, 406, 1822–1826. [Google Scholar] [CrossRef]
- Jiang, Y.; Chen, W.-F.; Koshy, P.; Sorrell, C.C. Enhanced photocatalytic performance of nanostructured TiO2 thin films through combined effects of polymer conjugation and Mo-doping. J. Mater. Sci. 2019, 54, 5266–5279. [Google Scholar] [CrossRef]
- Lin, H.; Long, J.; Gu, Q.; Zhang, W.; Ruan, R.; Li, Z.; Wang, X. In situ IR study of surface hydroxyl species of dehydrated TiO2: Towards understanding pivotal surface processes of TiO2 photocatalytic oxidation of toluene. Phys. Chem. Chem. Phys. 2012, 14, 9468–9474. [Google Scholar] [CrossRef]
- Ding, Q.; Dou, Y.; Liao, Y.; Huang, S.; Wang, R.; Min, W.; Chen, X.; Wu, C.; Yuan, D.; Liu, H.K. Oxygen Vacancy-Rich Ultrathin Co3O4 Nanosheets as Nanofillers in Solid-Polymer Electrolyte for High-Performance Lithium Metal Batteries. Catalysts 2023, 13, 711. [Google Scholar] [CrossRef]
- Wong, C.P.P.; Lai, C.W.; Lee, K.M.; Pan, G.T.; Huang, C.M.; Juan, J.C.; Yang, T.C.K. Enhancement of discharge capacity and energy density by oxygen vacancies in nickel doped SrTiO3 as cathode for rechargeable alkaline zinc battery. Electrochim. Acta 2022, 404, 139705. [Google Scholar] [CrossRef]
- Kruk, M.; Jaroniec, M. Gas adsorption characterization of ordered organic− inorganic nanocomposite materials. Chem. Mater. 2001, 13, 3169–3183. [Google Scholar] [CrossRef]
- Ramírez-Campillo, R.; Meylan, C.; Alvarez, C.; Henríquez-Olguín, C.; Martínez, C.; Cañas-Jamett, R.; Andrade, D.C.; Izquierdo, M. Effects of in-season low-volume high-intensity plyometric training on explosive actions and endurance of young soccer players. J. Strength Cond. Res. 2014, 28, 1335–1342. [Google Scholar] [CrossRef] [PubMed]
- Tsai, Y.-C.; Yang, W.-D.; Lee, K.-C.; Huang, C.-M. An effective electrodeposition mode for porous MnO2/Ni foam composite for asymmetric supercapacitors. Materials 2016, 9, 246. [Google Scholar] [CrossRef] [PubMed]
- Hao, P.; Zhao, Z.; Tian, J.; Li, H.; Sang, Y.; Yu, G.; Cai, H.; Liu, H.; Wong, C.; Umar, A. Hierarchical porous carbon aerogel derived from bagasse for high performance supercapacitor electrode. Nanoscale 2014, 6, 12120–12129. [Google Scholar] [CrossRef]
- Mirseyed, S.F.; Jafarzadeh, K.; Rostamian, A.; Semnani, A.; Abbasi, H.M.; Ostadhassan, M. A novel approach to the role of iridium and titanium oxide in deactivation mechanisms of a Ti/(36 RuO2-xIrO2-(64-x) TiO2) coating in sodium chloride solution. Corros. Sci. 2022, 206, 110481. [Google Scholar] [CrossRef]
- Ko, Y.-J.; Han, M.H.; Lim, C.; Yu, S.-H.; Choi, C.H.; Min, B.K.; Choi, J.-Y.; Lee, W.H.; Oh, H.-S. Unveiling the role of Ni in Ru-Ni oxide for oxygen evolution: Lattice oxygen participation enhanced by structural distortion. J. Energy Chem. 2023, 77, 54–61. [Google Scholar] [CrossRef]
- Erusappan, E.; Pan, G.-T.; Chung, H.-Y.; Chong, S.; Thiripuranthagan, S.; Yang, T.C.-K.; Huang, C.-M. Hierarchical nickel–cobalt oxide and glucose-based carbon electrodes for asymmetric supercapacitor with high energy density. J. Taiwan Inst. Chem. Eng. 2020, 112, 330–336. [Google Scholar] [CrossRef]
- Wang, Z.; Jin, X.; Chen, F.; Kuang, X.; Min, J.; Duan, H.; Li, J.; Chen, J. Oxygen vacancy induced interaction between Pt and TiO2 to improve the oxygen reduction performance. J. Colloid Interface Sci. 2023, 650, 901–912. [Google Scholar] [CrossRef]
- Li, X.; Li, P.; Wei, F.; Wang, X.; Han, W.; Yue, J. Effect of oxygen vacancies on the electronic structure and electrochemical performance of MnMoO4: Computational simulation and experimental verification. New J. Chem. 2022, 46, 1665–1676. [Google Scholar] [CrossRef]
- Zeng, J.; Xie, H.; Liu, Z.; Liu, X.; Zhou, G.; Jiang, Y. Oxygen vacancy induced MnO2 catalysts for efficient toluene catalytic oxidation. Catal. Sci. Technol. 2021, 11, 6708–6723. [Google Scholar] [CrossRef]


| Samples | Phase a | Crystallite Size b (nm) | Lattice Parameters c | Unit Cell Volume (Å3) |
|---|---|---|---|---|
| a = b = c (Å) | ||||
| a | Cubic Co3O4 (100%) | 34.91 | 8.08569 | 528.6288 |
| b | Cubic Co3O4 (100%) | 29.64 | 8.08479 | 528.4536 |
| c | Cubic Co3O4 (100%) | 20.35 | 8.08401 | 528.2990 |
| d | Cubic Co3O4 (100%) | 28.66 | 8.07998 | 527.5103 |
| e | Cubic Co3O4 (100%) | 22.23 | 8.07177 | 525.9039 |
| f | Cubic Co3O4 (100%) | 21.87 | 8.06302 | 524.1951 |
| g | Cubic Co3O4 (100%) | 19.02 | 8.05866 | 523.3457 |
| h | Cubic Co3O4 (100%) | 33.65 | 8.07405 | 526.3490 |
| i | Cubic Co3O4 (100%) | 28.64 | 8.07175 | 525.8992 |
| j | Cubic Co3O4 (100%) | 22.23 | 8.06815 | 525.1967 |
| k | Cubic Co3O4 (100%) | 18.15 | 8.06160 | 523.9177 |
| l | Cubic Co3O4 (100%) | 17.78 | 8.05979 | 523.5662 |
| m | Cubic Co3O4 (100%) | 17.50 | 8.05685 | 522.9931 |
| n | Cubic Co3O4 (100%) | 17.08 | 8.05214 | 522.0765 |
| Sample | Atomic Ratios of Co:O:Pt | Normalized Atomic Ratios of Co:O:Pt |
|---|---|---|
| a | 17.4:82.6:0.0 | 1.0:4.7:0.0 |
| b | 33.5:66.5:0.0 | 1.0:2.0:0.0 |
| c | 40.5:59.5:0.0 | 1.0:1.5:0.0 |
| d | 56.8:43.2:0.0 | 1.0:0.8:0.0 |
| e | 59.2:40.8:0.0 | 1.0:0.7:0.0 |
| f | 60.7:39.3:0.0 | 1.0:0.6:0.0 |
| g | 69.9:30.1:0.0 | 1.0:0.4:0.0 |
| h | 22.7:71.2:6.0 | 1.0:3.1:0.26 |
| i | 21.7:74.7:3.5 | 1.0:3.4:0.16 |
| j | 36.9:60.4:2.7 | 1.0:1.6:0.07 |
| k | 34.1:63.3:2.7 | 1.0:1.9:0.08 |
| l | 49.9:46.2:3.9 | 1.0:0.9:0.08 |
| m | 64.2:31.6:4.2 | 1.0:0.5:0.07 |
| n | 69.4:27.1:3.5 | 1.0:0.4:0.05 |
| Sample | Specific Surface Area from BET (m2/g) | Pore Volume (cm3/g) | Pore Size (nm) |
|---|---|---|---|
| b | 50 | 0.16 | 26 |
| e | 53 | 0.25 | 20 |
| g | 72 | 0.46 | 25 |
| h | 80 | 0.48 | 16 |
| l | 166 | 0.70 | 15 |
| n | 175 | 0.73 | 13 |
| Sample | Carrier Density (cm−3) a | (V) | JMAX (mA/cm2) b | Conduction Type |
|---|---|---|---|---|
| a | 5.77 × 10¹⁴ | 1.65 | 21.63 | p |
| b | 6.42 × 10¹⁴ | 1.70 | 25.09 | p |
| c | 8.87× 10¹⁴ | 1.75 | 31.16 | p |
| d | 6.66 × 10¹⁴ | 1.80 | 35.18 | p |
| e | 6.87 × 10¹⁴ | 1.83 | 39.61 | p |
| f | 6.87 × 10¹⁴ | 1.86 | 37.39 | p |
| g | 7.20 × 10¹⁴ | 1.90 | 41.92 | p |
| h | 6.60 × 10¹⁴ | 1.68 | 24.96 | p |
| i | 7.62 × 10¹⁴ | 1.72 | 29.43 | p |
| j | 7.89 × 10¹⁴ | 1.77 | 41.8 | p |
| k | 8.77 × 10¹⁴ | 1.82 | 52.98 | p |
| l | 8.87 × 10¹⁴ | 1.90 | 59.44 | p |
| m | 9.16 × 10¹⁴ | 1.92 | 68.28 | p |
| n | 9.60 × 10¹⁴ | 1.95 | 102.66 | p |
| Sample ID | Co(CH3COO)2·4H2O Concentration (Mole) | Na2SO4 Concentration (Mole) | Platinum Coating Through Plasma Sputtering | pH Value | Constant Voltage Mode (V) | Deposition Time (min) | ||
|---|---|---|---|---|---|---|---|---|
| Voltage (kV) | Current (mA) | Time (min) | ||||||
| a | 0.02 | 0.01 | - | - | - | 7 | 5 | 10 |
| b | 0.02 | 0.02 | - | - | - | 7 | 5 | 10 |
| c | 0.02 | 0.04 | - | - | - | 7 | 5 | 10 |
| d | 0.02 | 0.02 | - | - | - | 7 | 5 | 20 |
| e | 0.02 | 0.02 | - | - | - | 7 | 5 | 30 |
| f | 0.02 | 0.02 | - | - | - | 7 | 5 | 40 |
| g | 0.02 | 0.02 | - | - | - | 7 | 5 | 50 |
| h | 0.02 | 0.01 | 30 | 8 | 3 | 7 | 5 | 10 |
| i | 0.02 | 0.02 | 30 | 8 | 3 | 7 | 5 | 10 |
| j | 0.02 | 0.04 | 30 | 8 | 3 | 7 | 5 | 10 |
| k | 0.02 | 0.02 | 30 | 8 | 3 | 7 | 5 | 20 |
| l | 0.02 | 0.02 | 30 | 8 | 3 | 7 | 5 | 30 |
| m | 0.02 | 0.02 | 30 | 8 | 3 | 7 | 5 | 40 |
| n | 0.02 | 0.02 | 30 | 8 | 3 | 7 | 5 | 50 |
Disclaimer/Publisher’s Note: The statements, opinions and data contained in all publications are solely those of the individual author(s) and contributor(s) and not of MDPI and/or the editor(s). MDPI and/or the editor(s) disclaim responsibility for any injury to people or property resulting from any ideas, methods, instructions or products referred to in the content. |
© 2025 by the authors. Licensee MDPI, Basel, Switzerland. This article is an open access article distributed under the terms and conditions of the Creative Commons Attribution (CC BY) license (https://creativecommons.org/licenses/by/4.0/).
Share and Cite
Pan, G.-T.; Nikoloski, A.N. The Electrochemical Performance of Co3O4 Electrodes with Platinum Nanoparticles for Chlorine Evolution. Inorganics 2025, 13, 355. https://doi.org/10.3390/inorganics13110355
Pan G-T, Nikoloski AN. The Electrochemical Performance of Co3O4 Electrodes with Platinum Nanoparticles for Chlorine Evolution. Inorganics. 2025; 13(11):355. https://doi.org/10.3390/inorganics13110355
Chicago/Turabian StylePan, Guan-Ting, and Aleksandar N. Nikoloski. 2025. "The Electrochemical Performance of Co3O4 Electrodes with Platinum Nanoparticles for Chlorine Evolution" Inorganics 13, no. 11: 355. https://doi.org/10.3390/inorganics13110355
APA StylePan, G.-T., & Nikoloski, A. N. (2025). The Electrochemical Performance of Co3O4 Electrodes with Platinum Nanoparticles for Chlorine Evolution. Inorganics, 13(11), 355. https://doi.org/10.3390/inorganics13110355