Deformation Measurements of Helicopter Rotor Blades Using a Photogrammetric System

Abstract
:1. Introduction
2. Experimental Setup
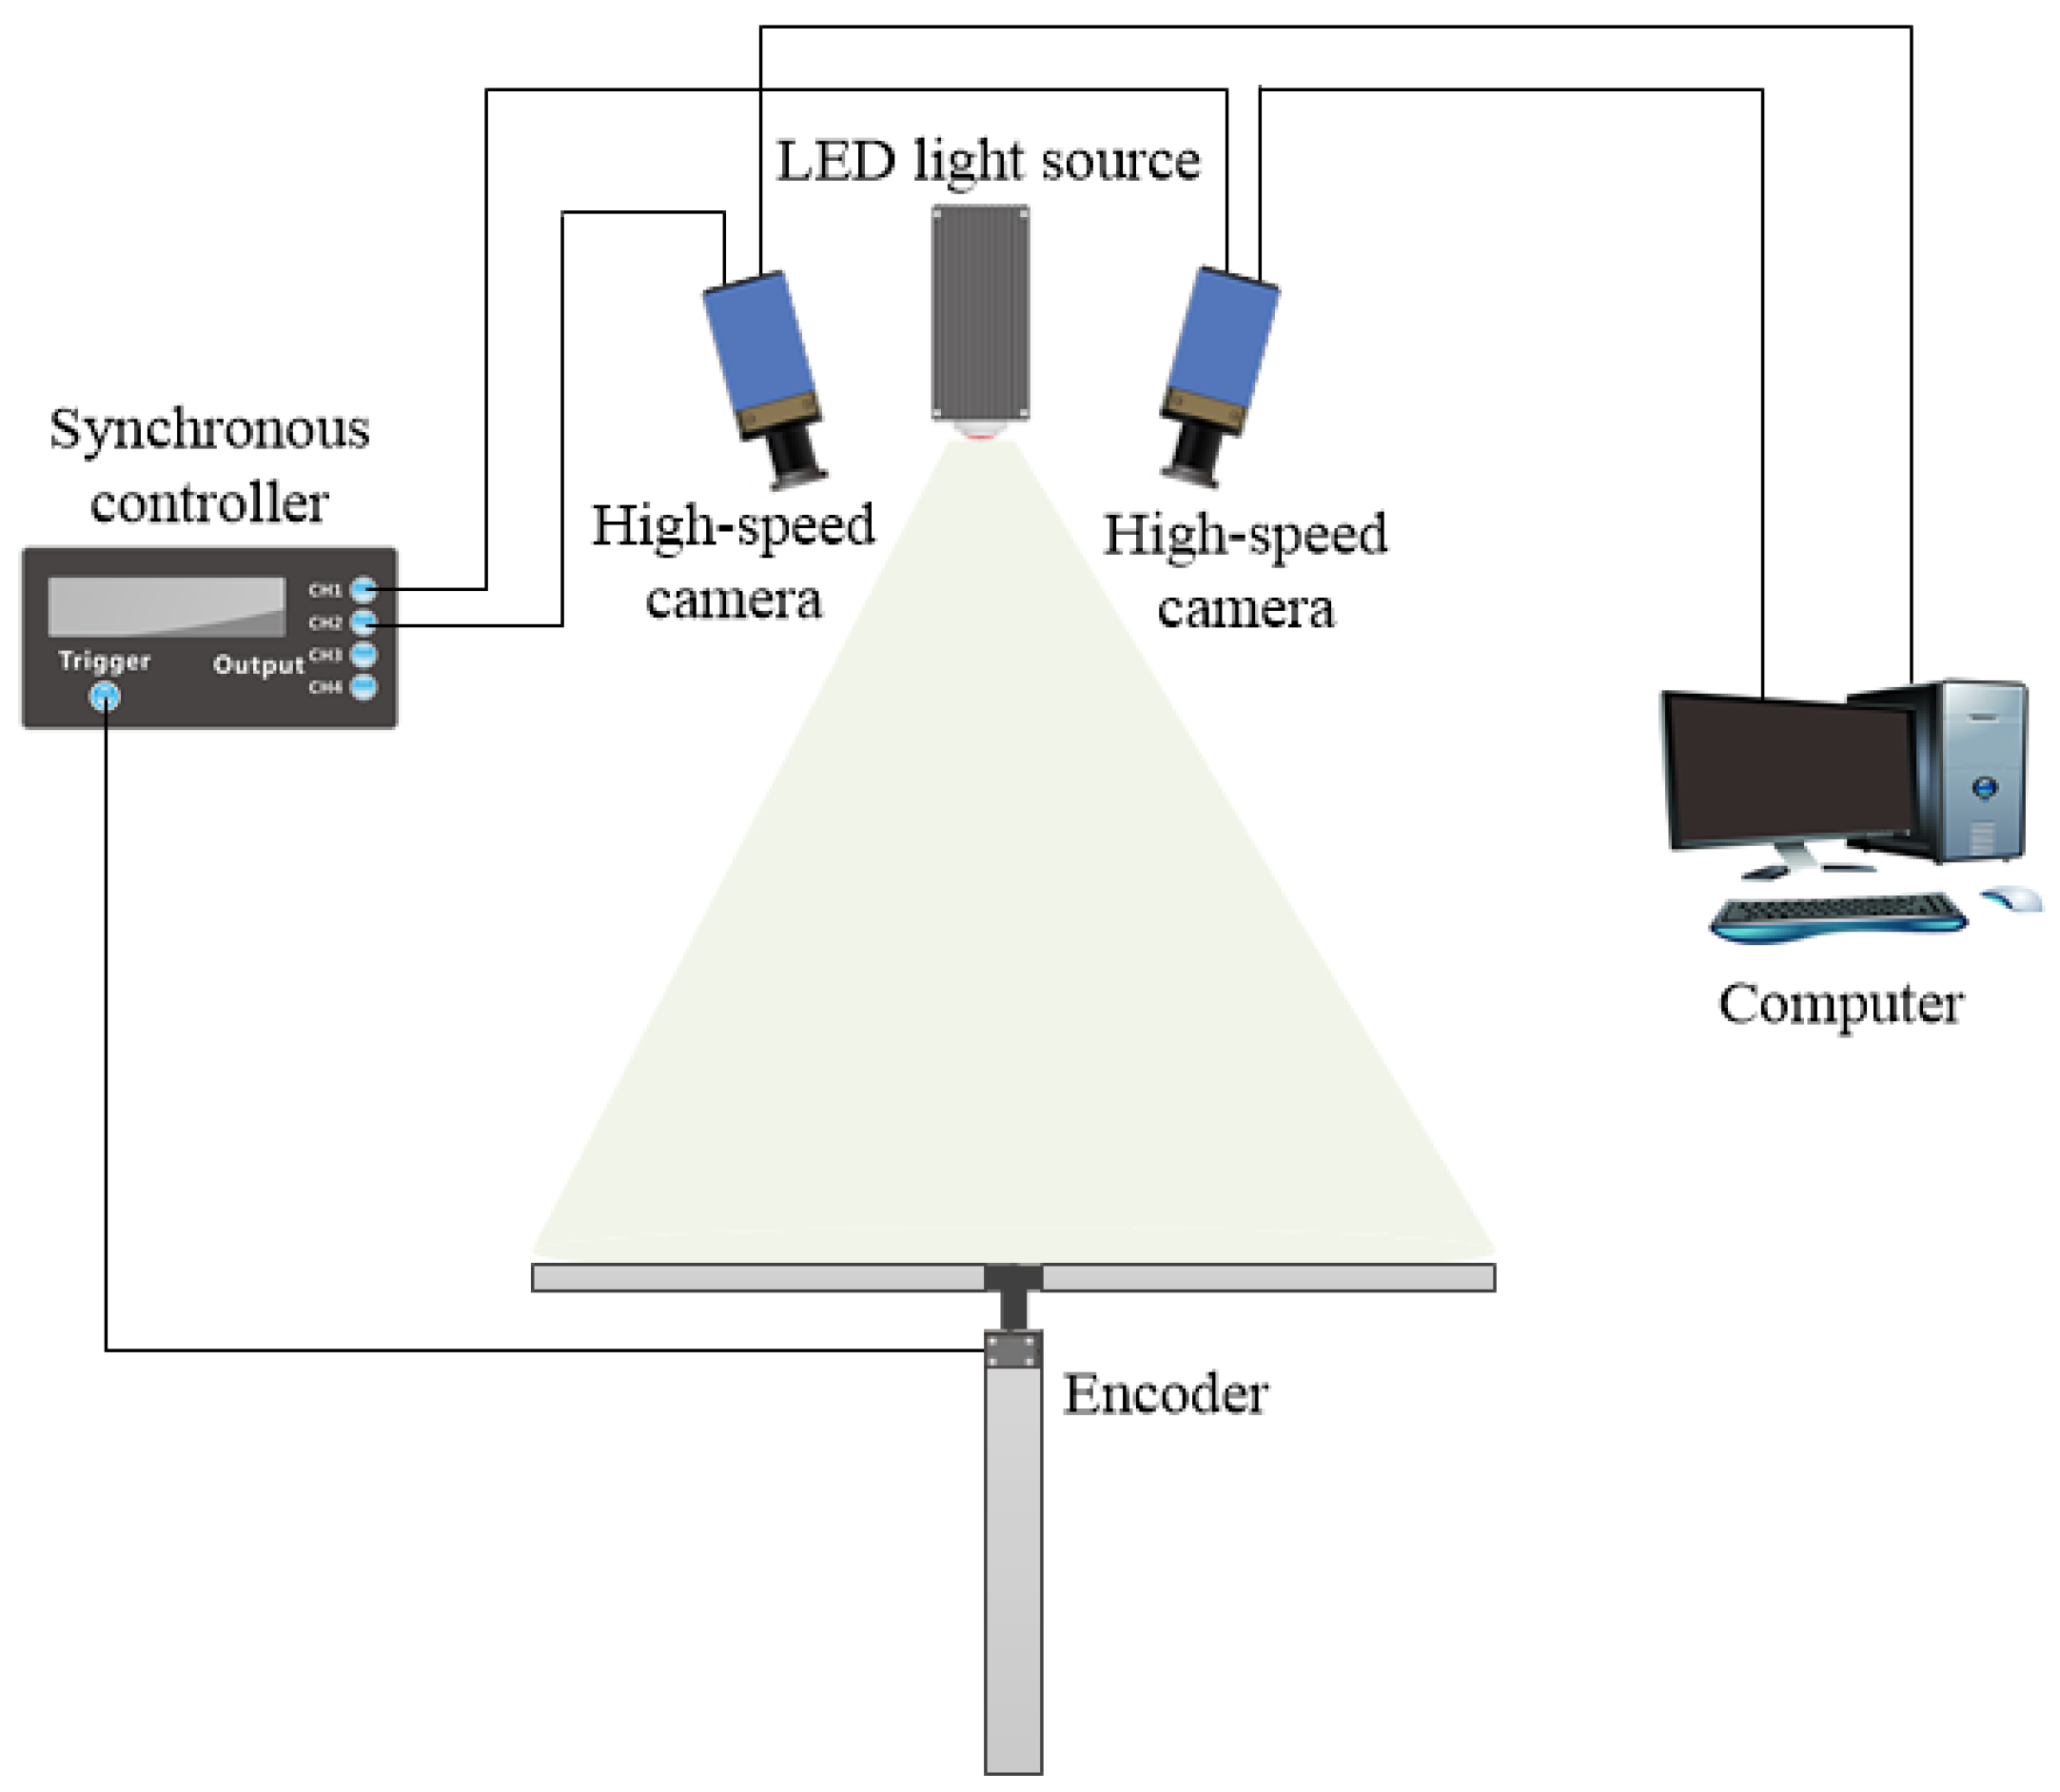
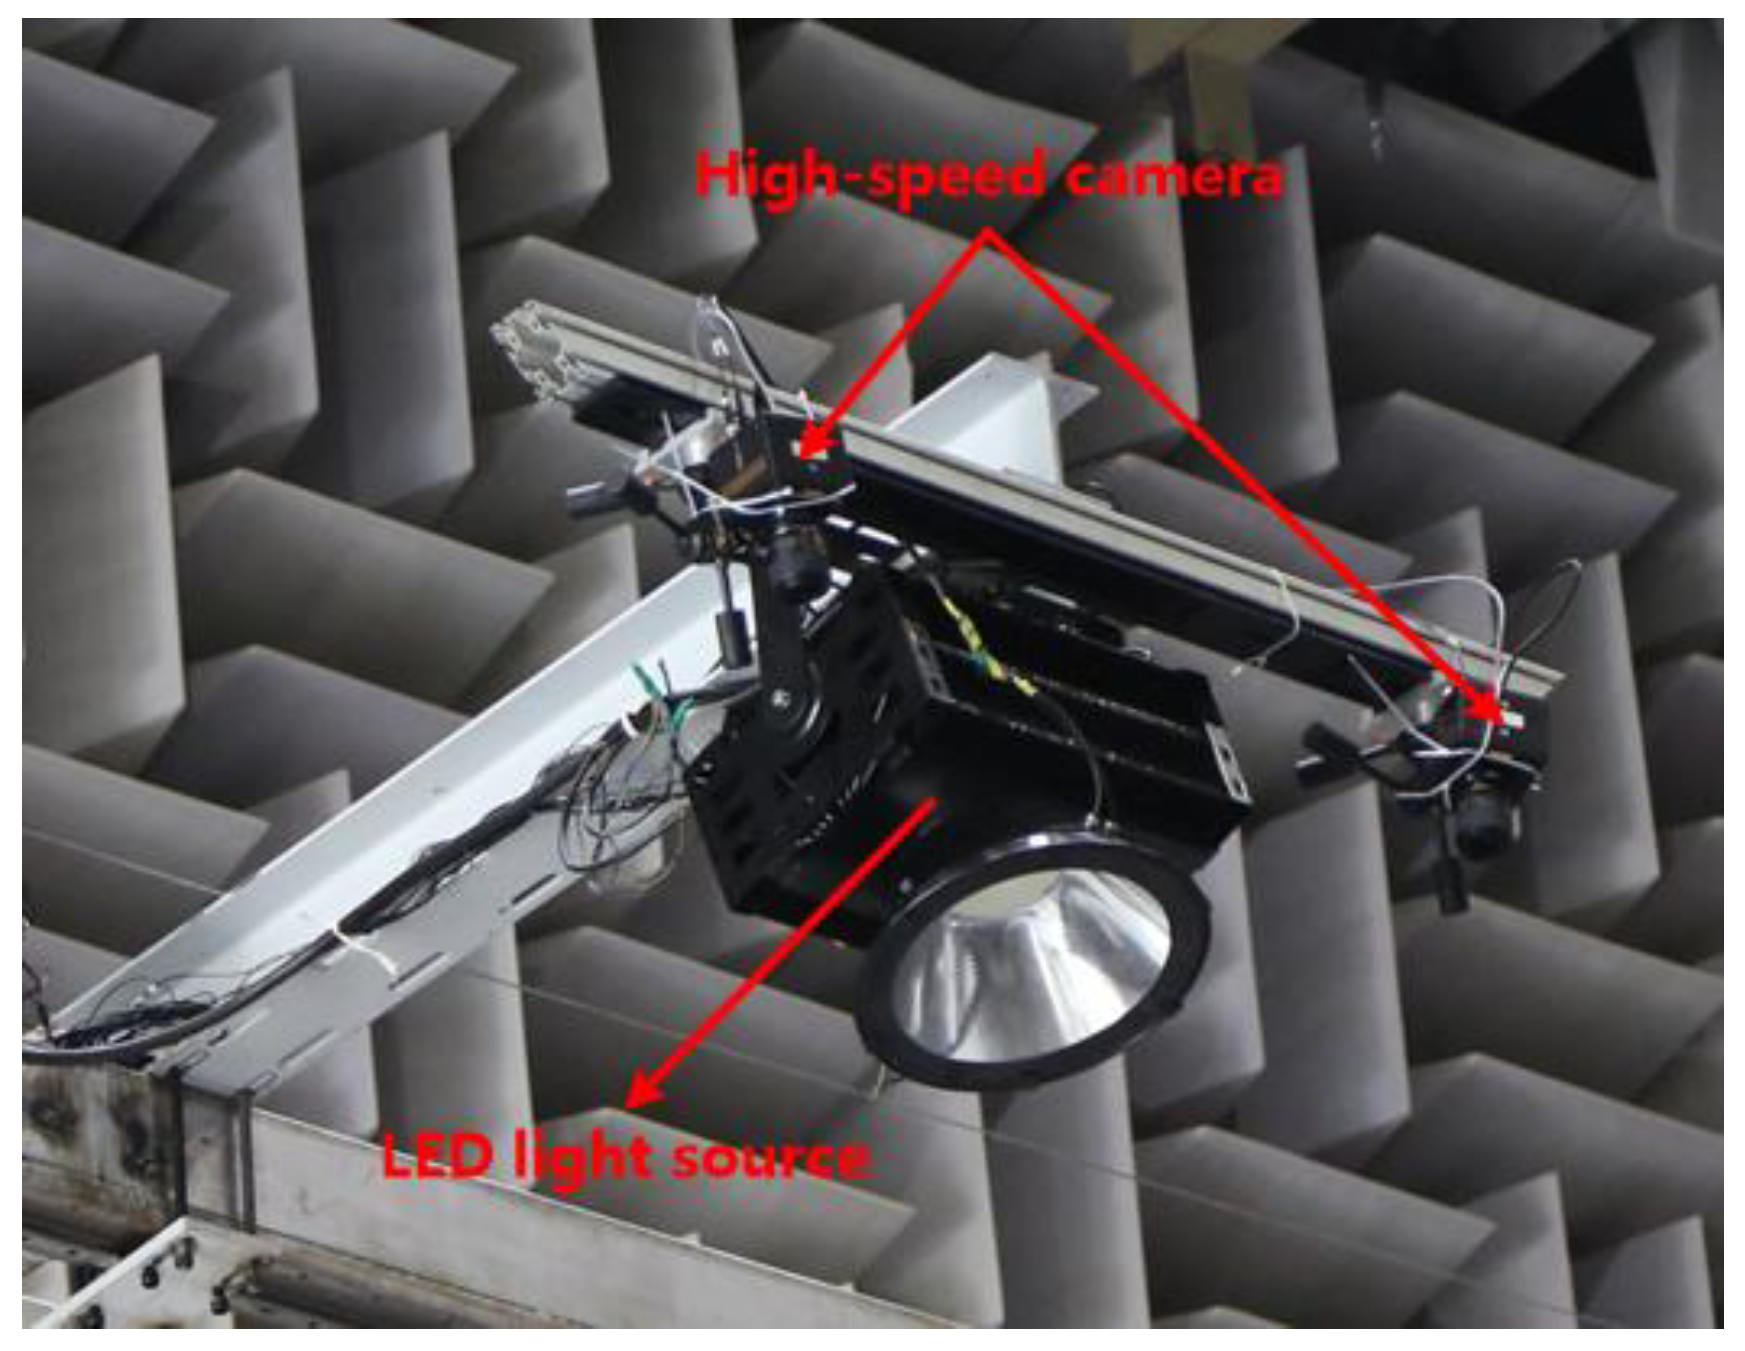
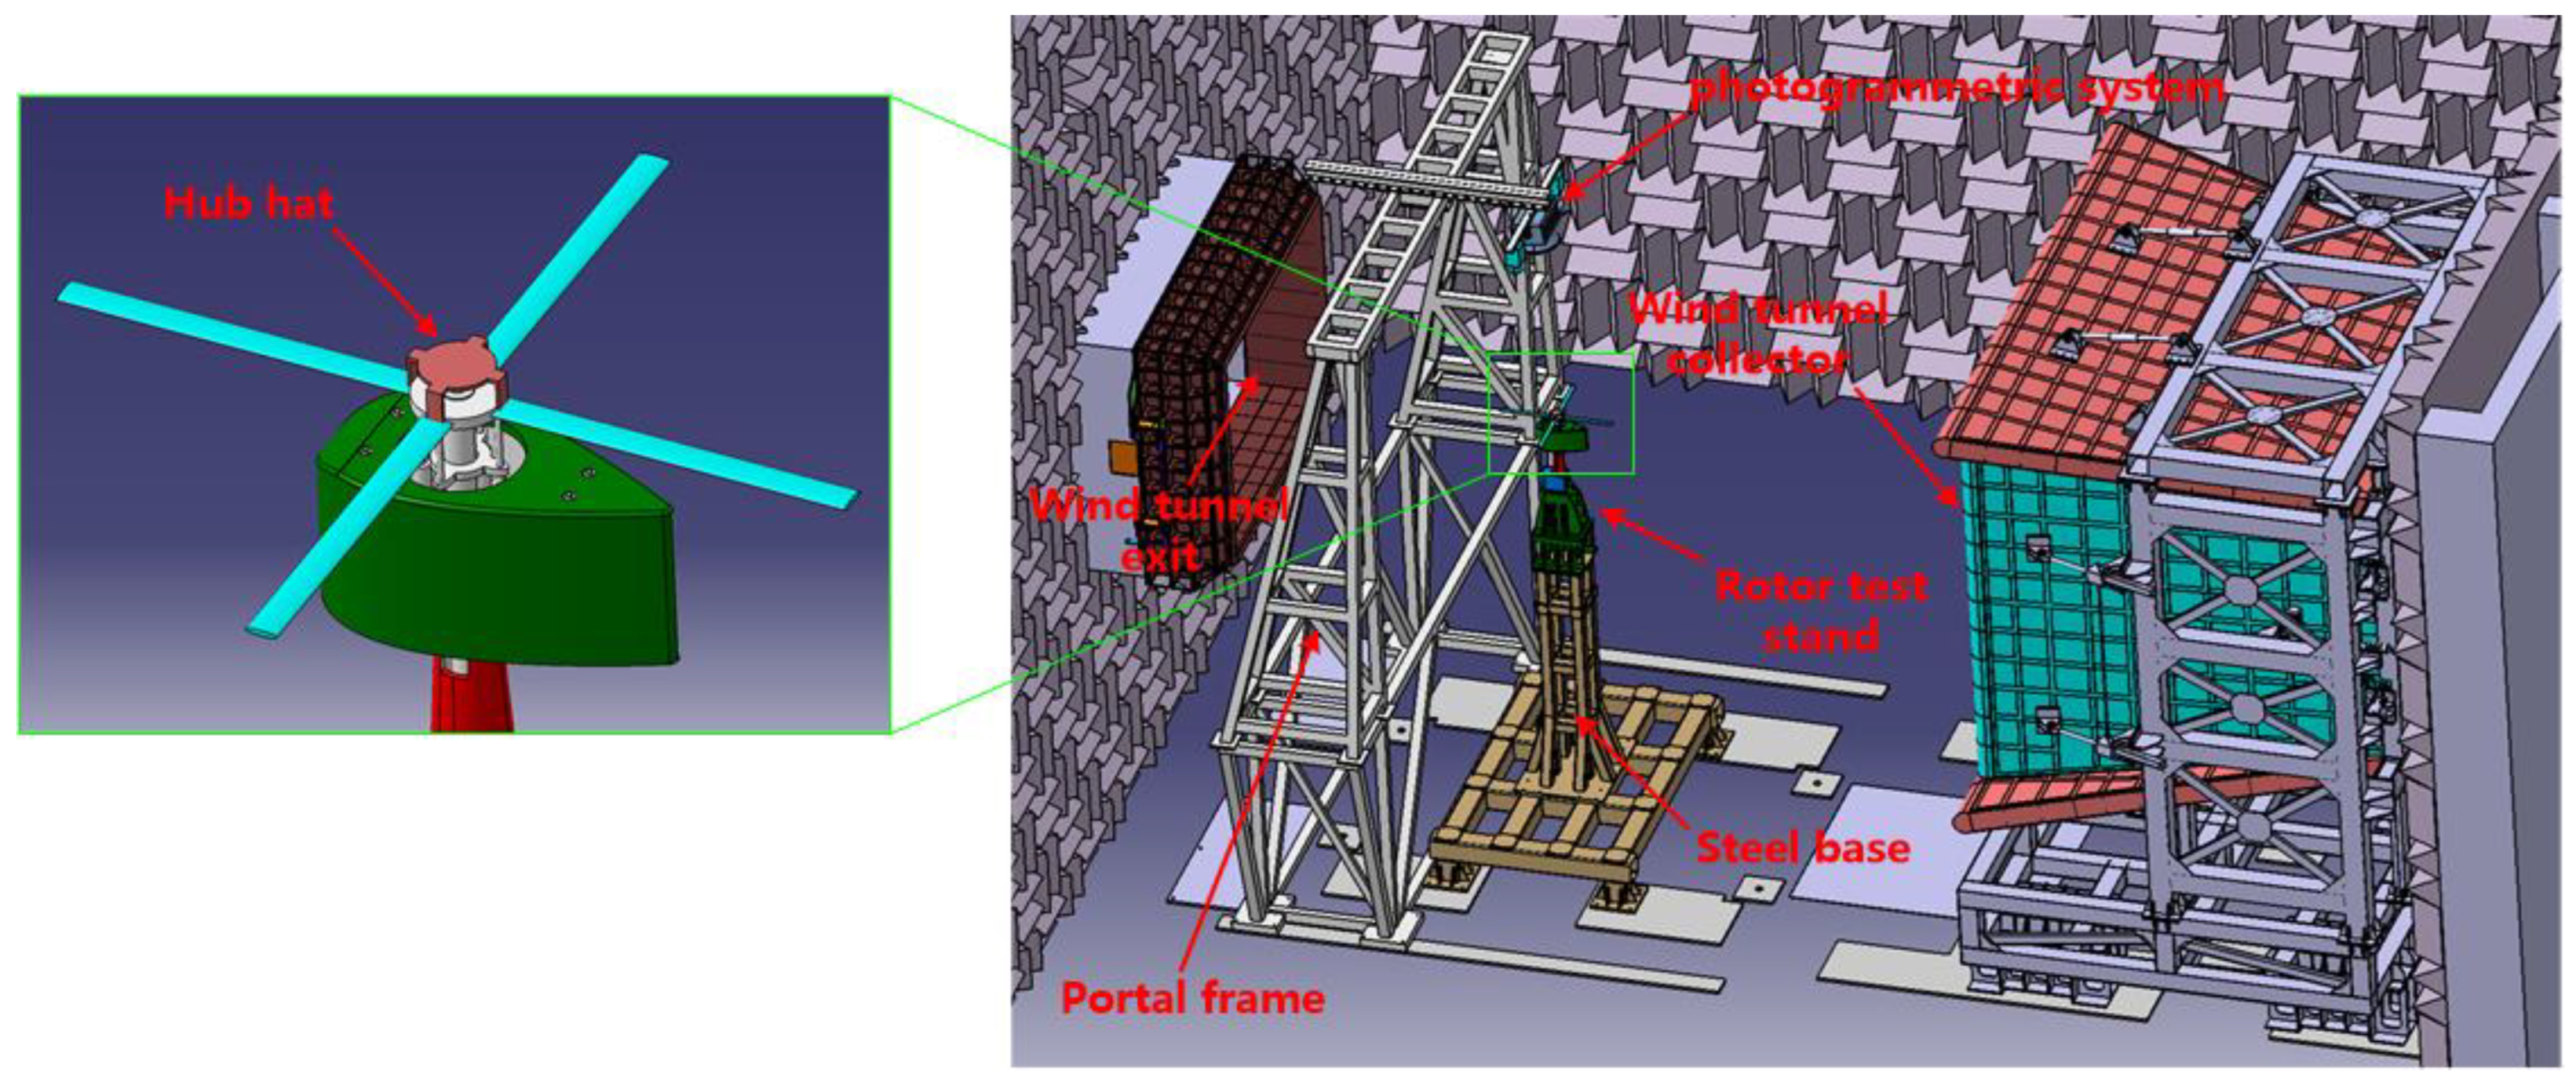
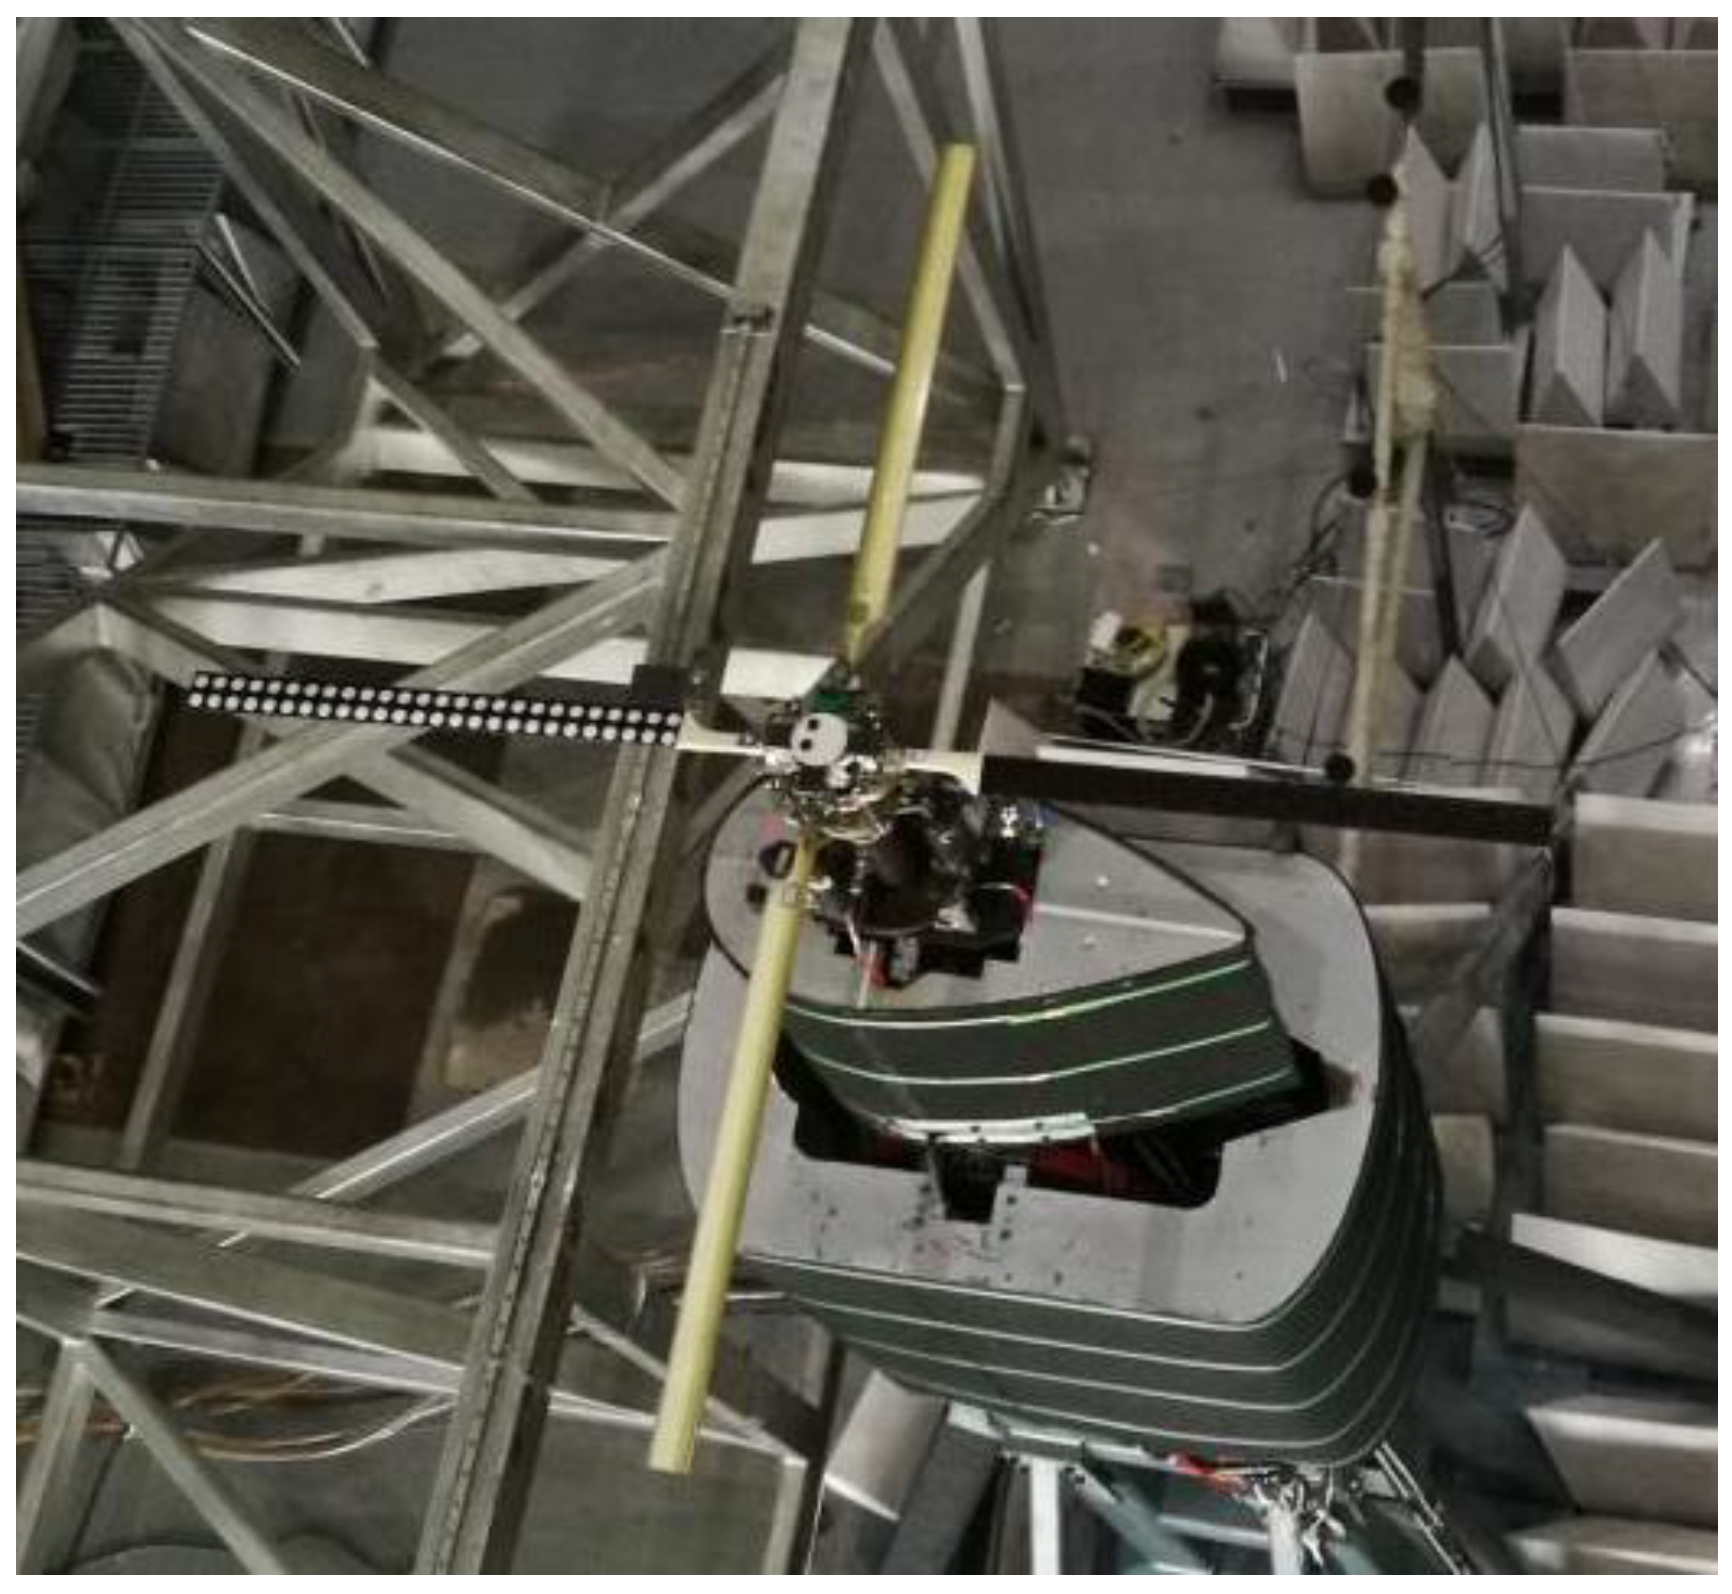
2.1. Experimental Facilities
2.2. Photogrammetric System
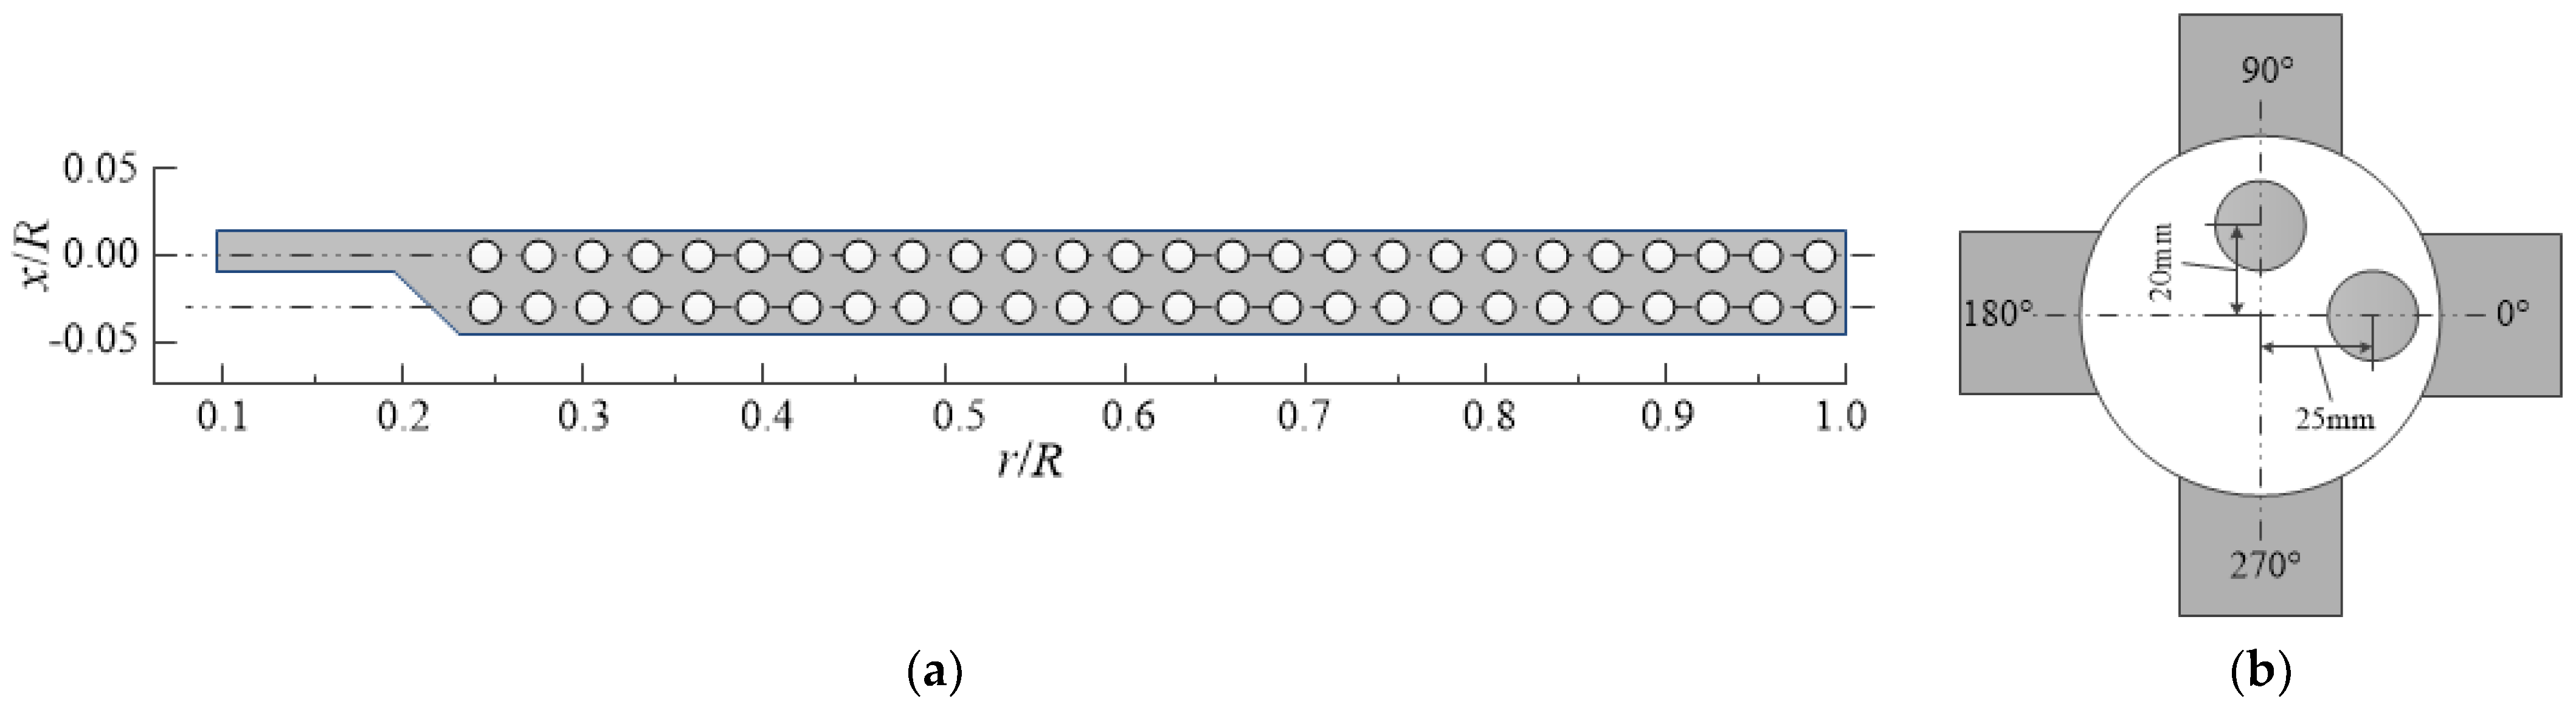
2.3. Retro-Reflective Targets
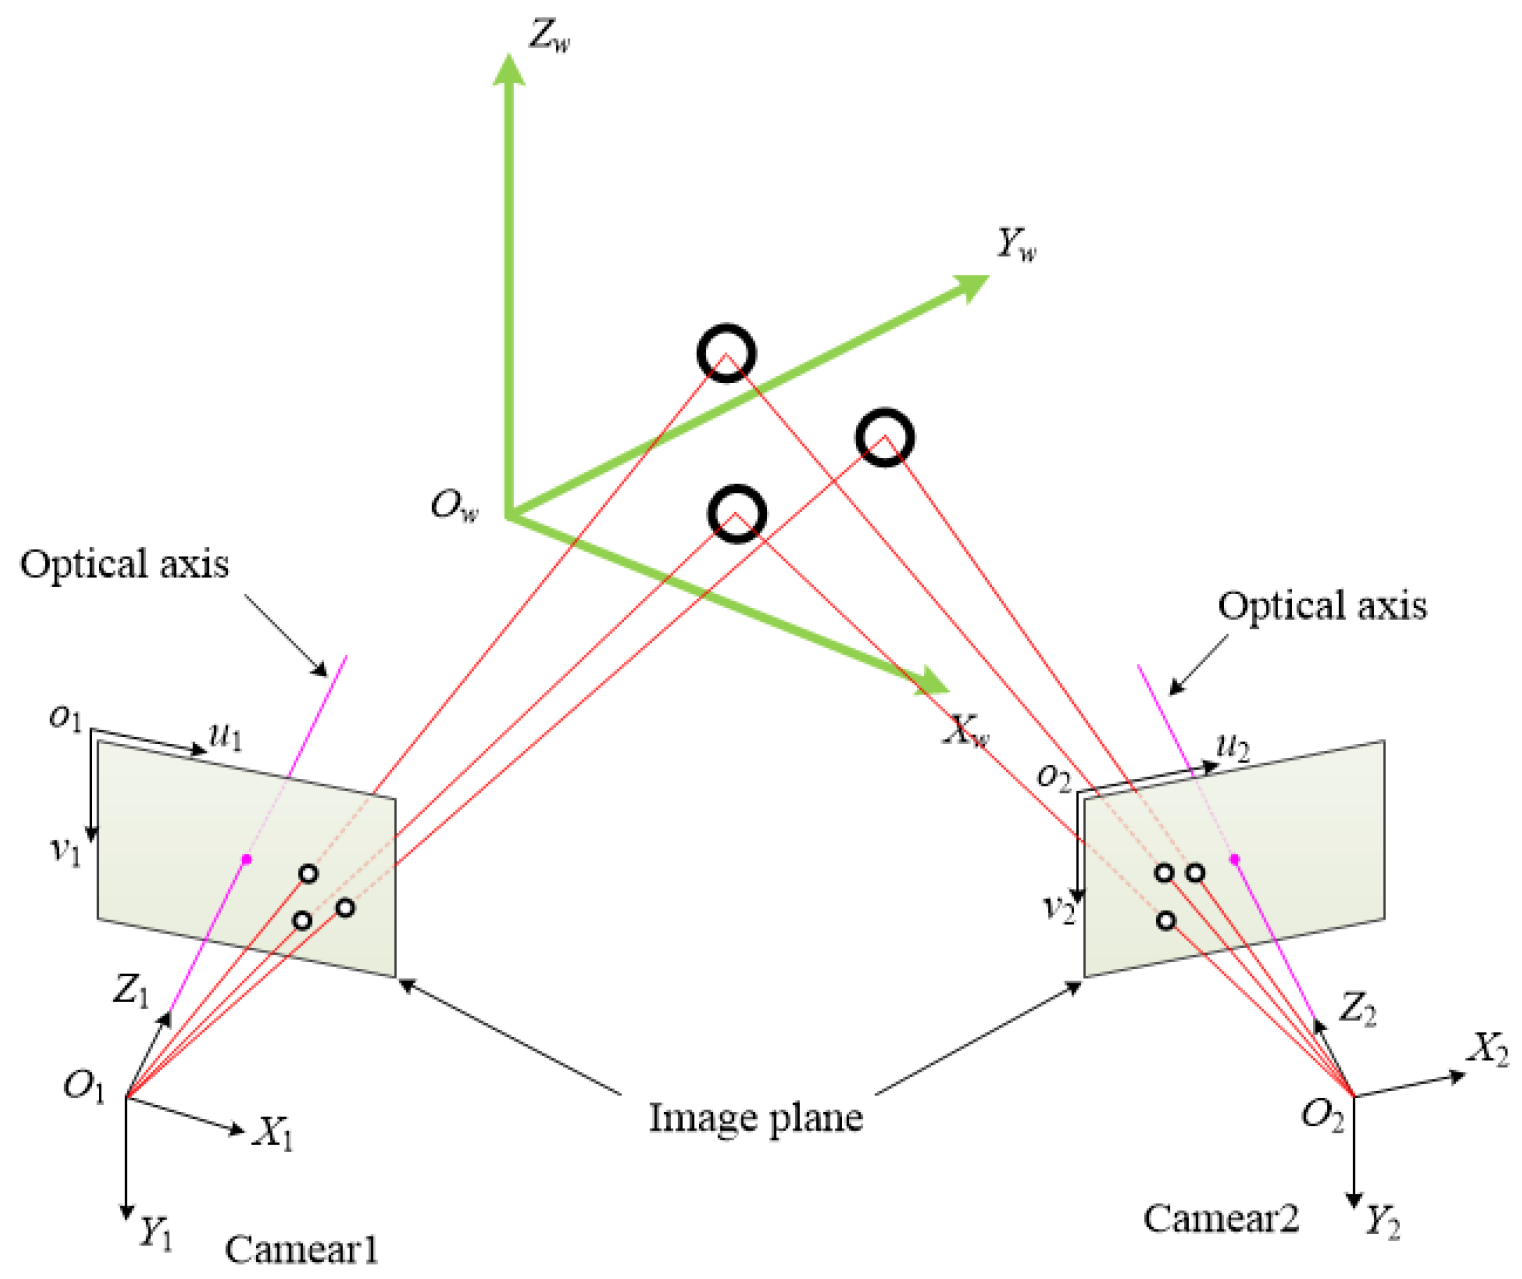
3. Photogrammetry
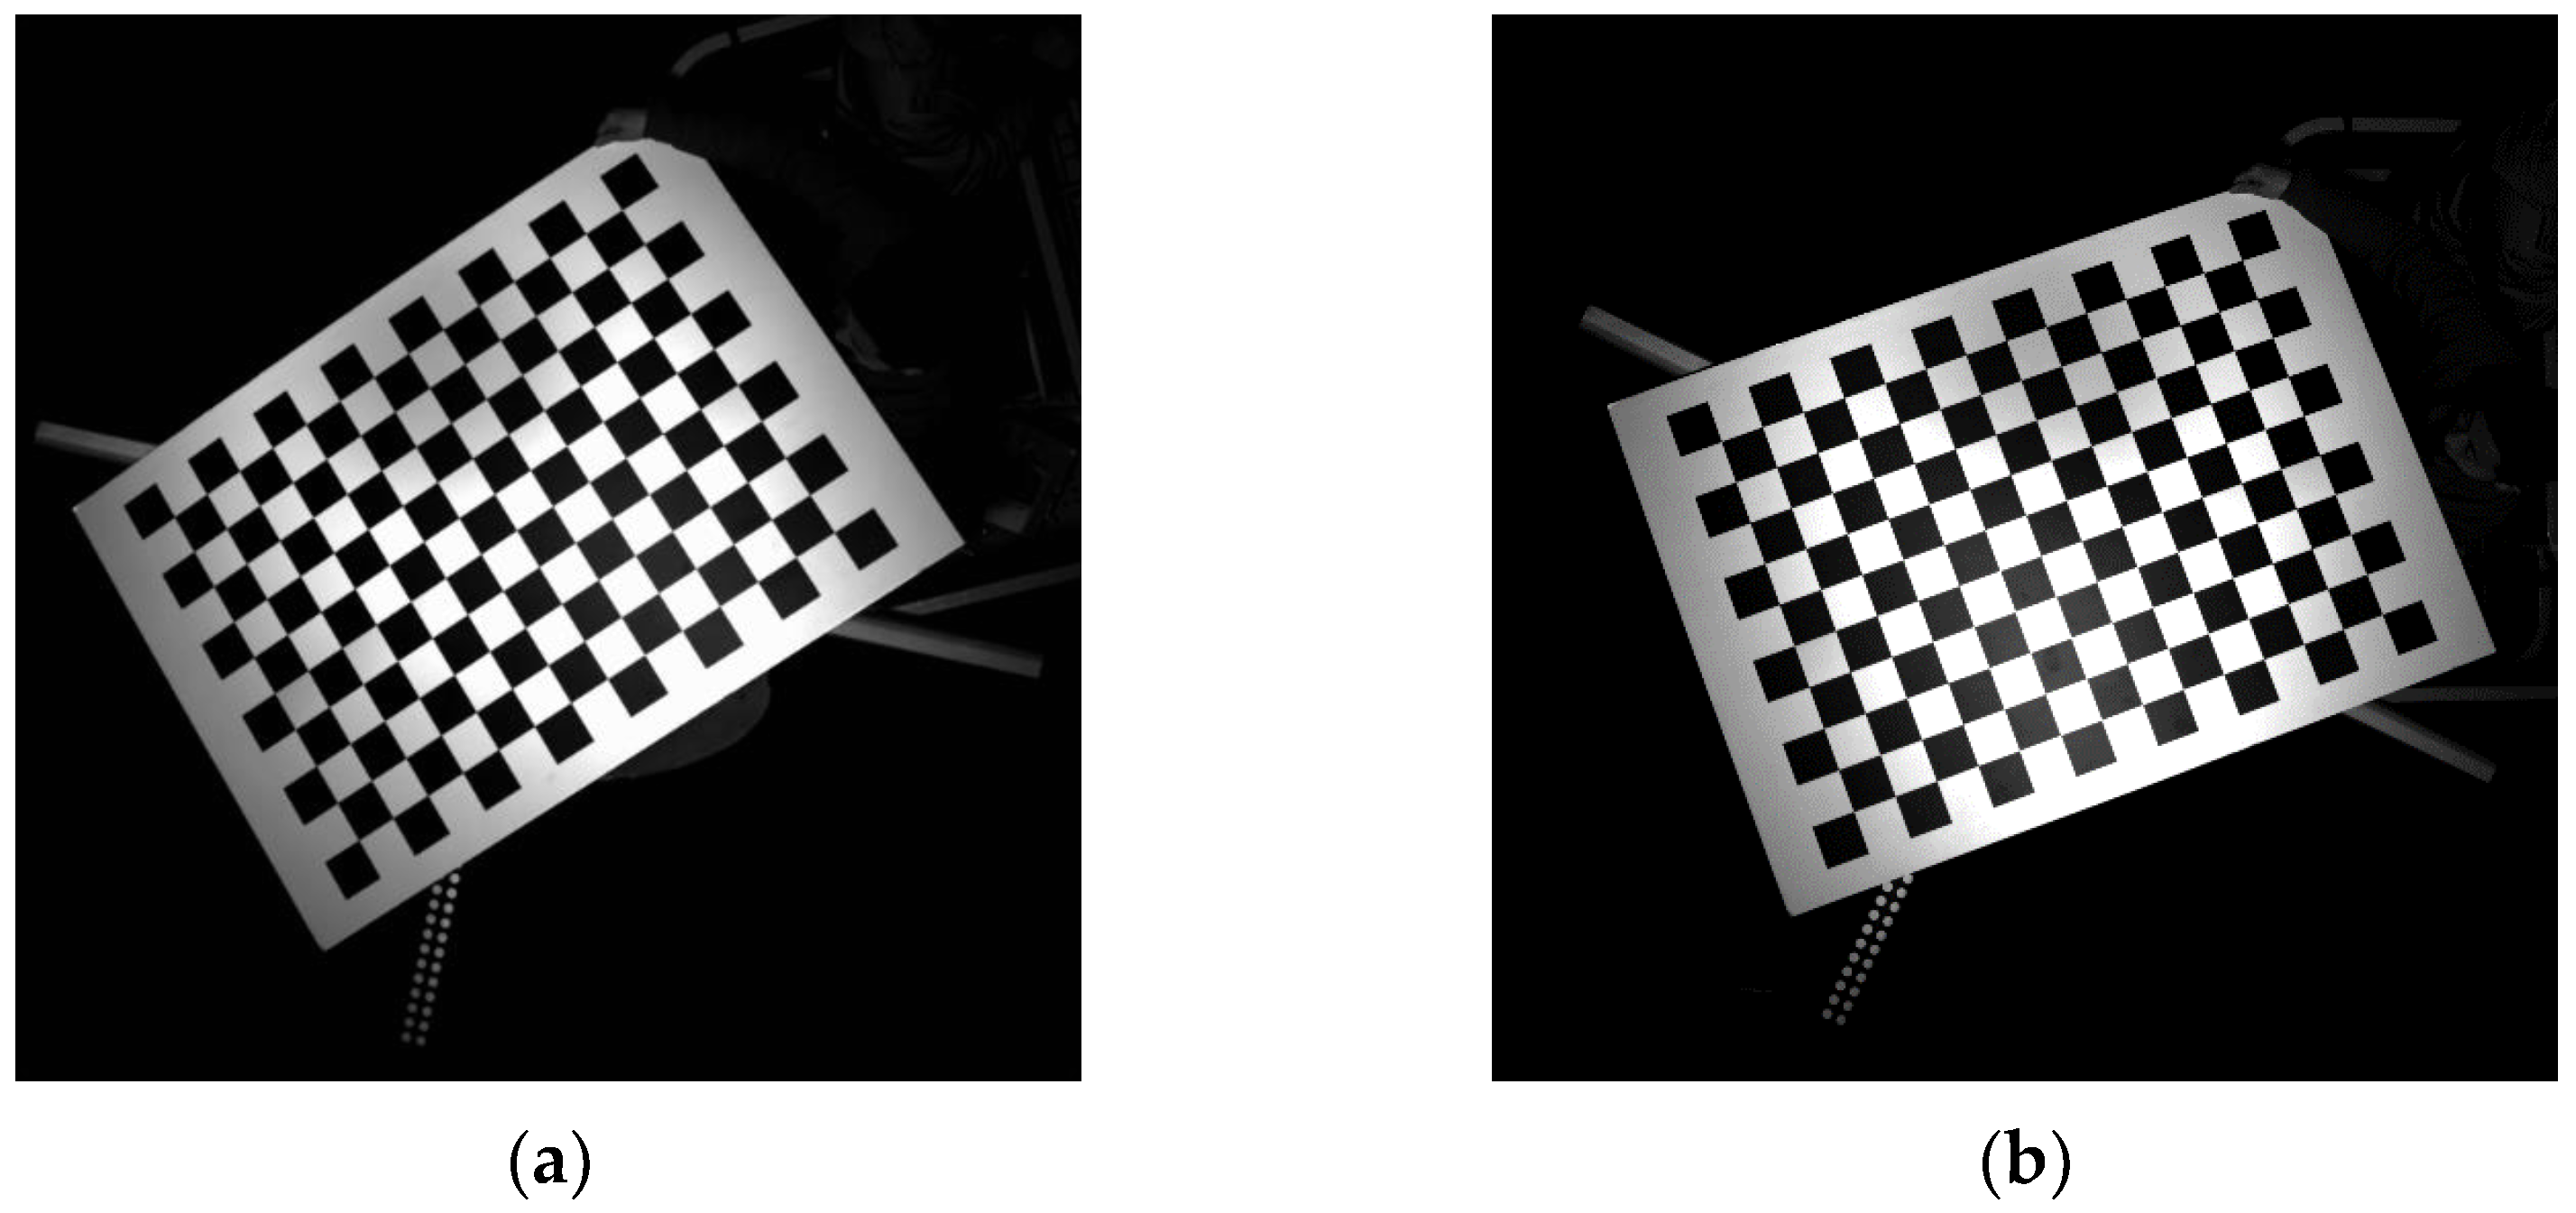
3.1. Calibration
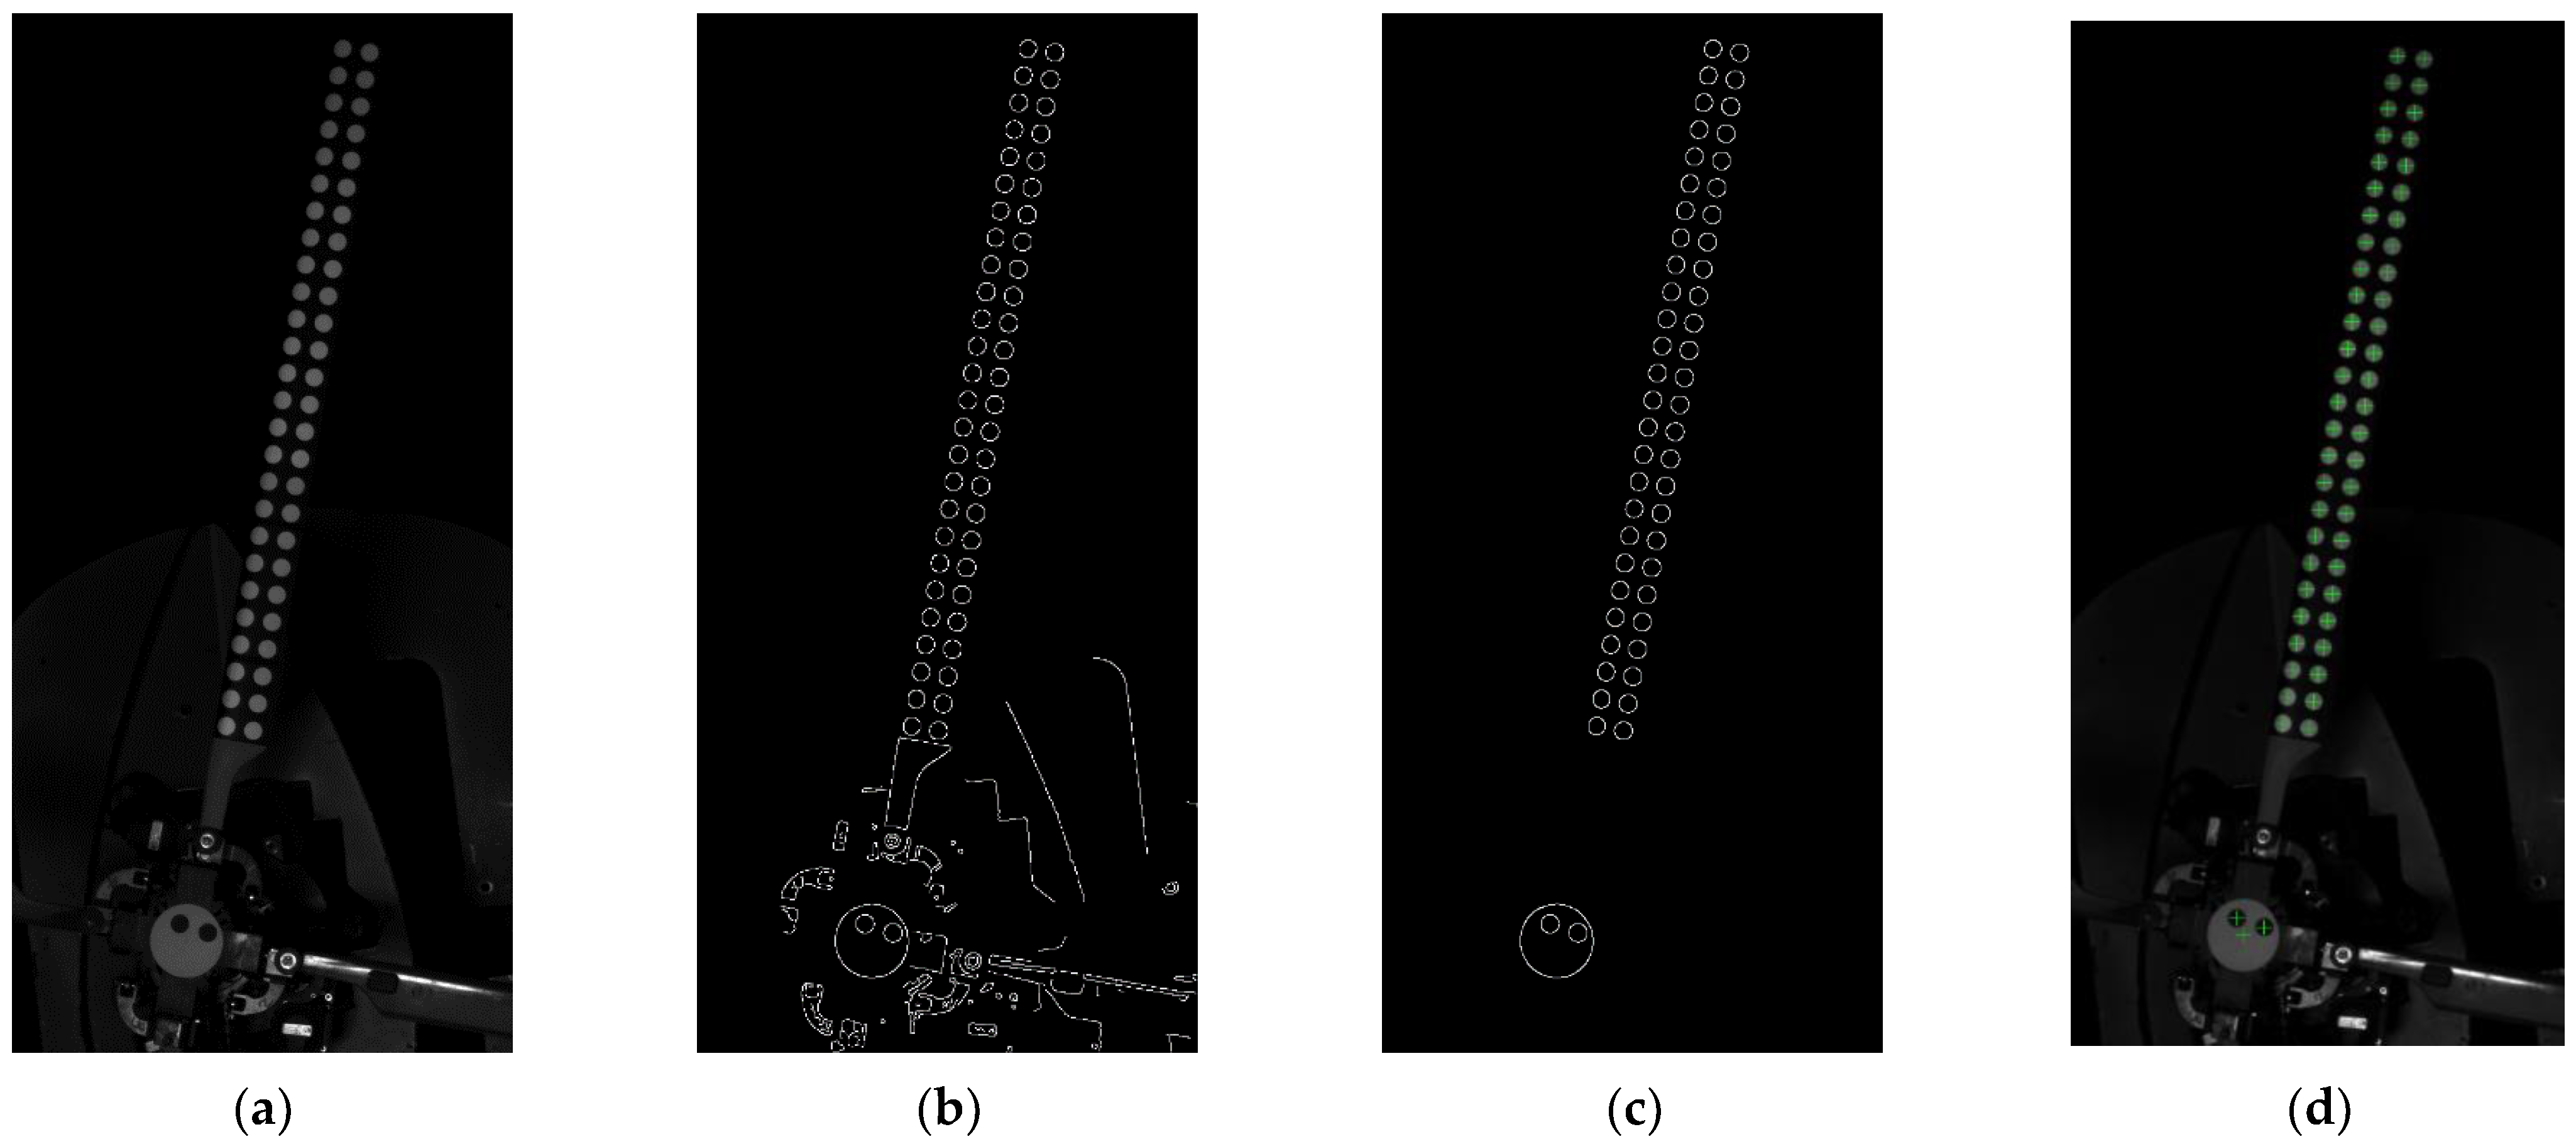
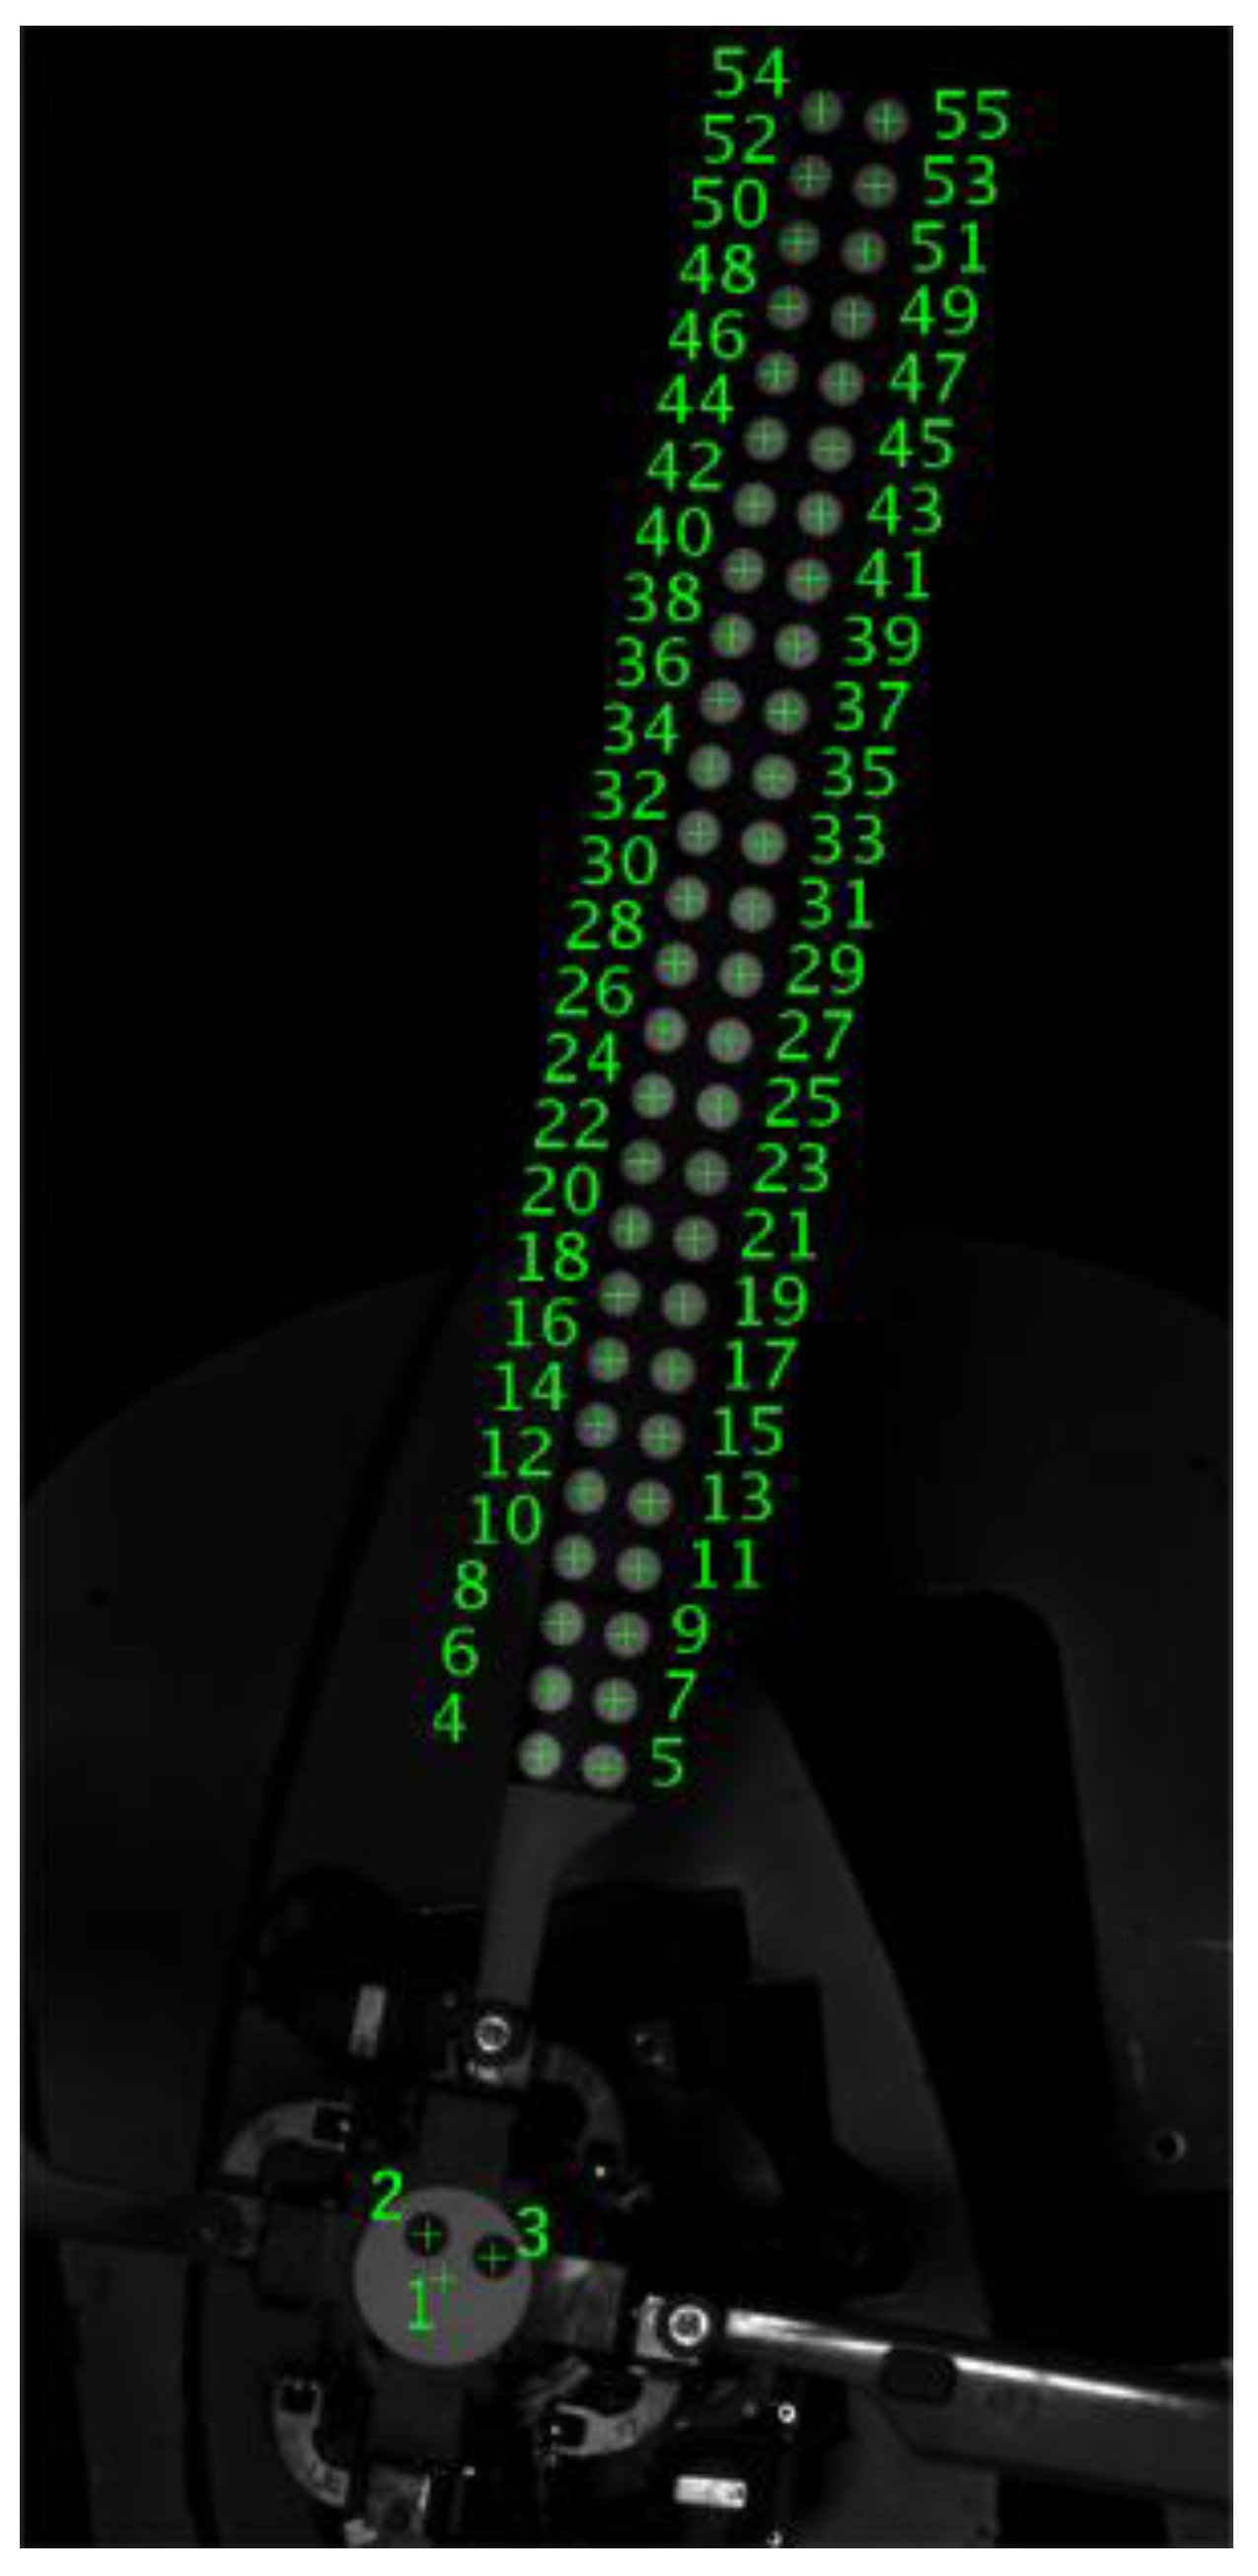
3.2. Target Detection, Location and Recognition
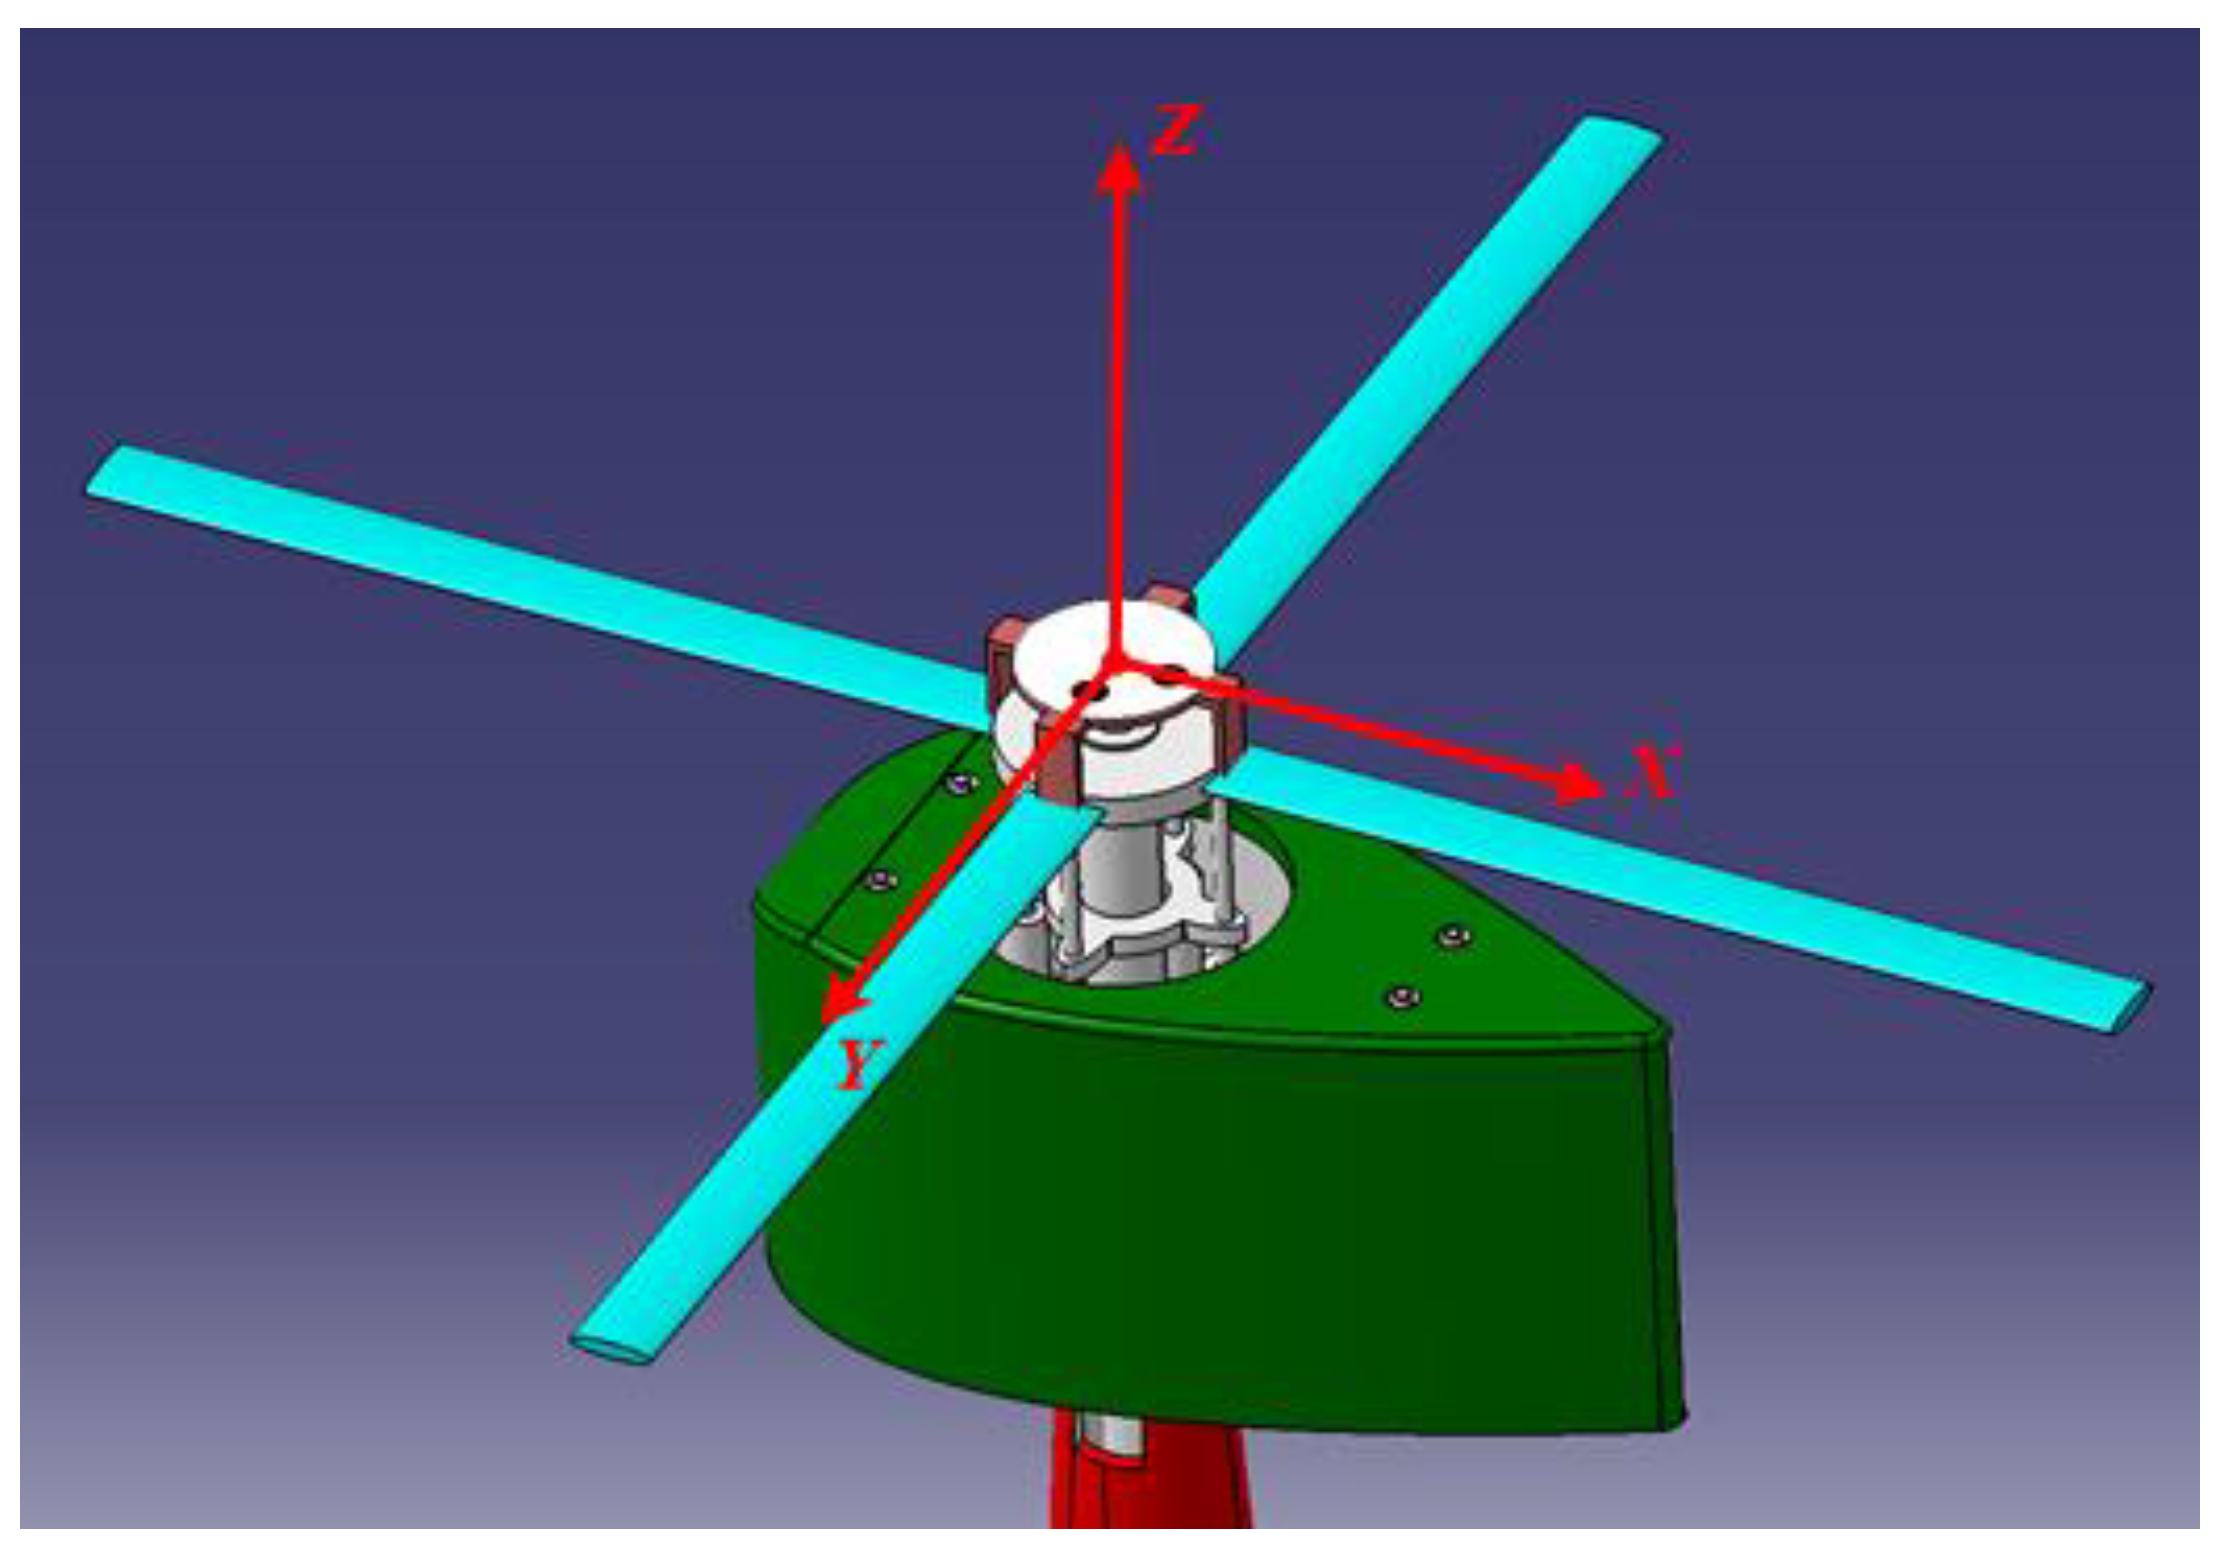
3.3. Rotor Coordinate System
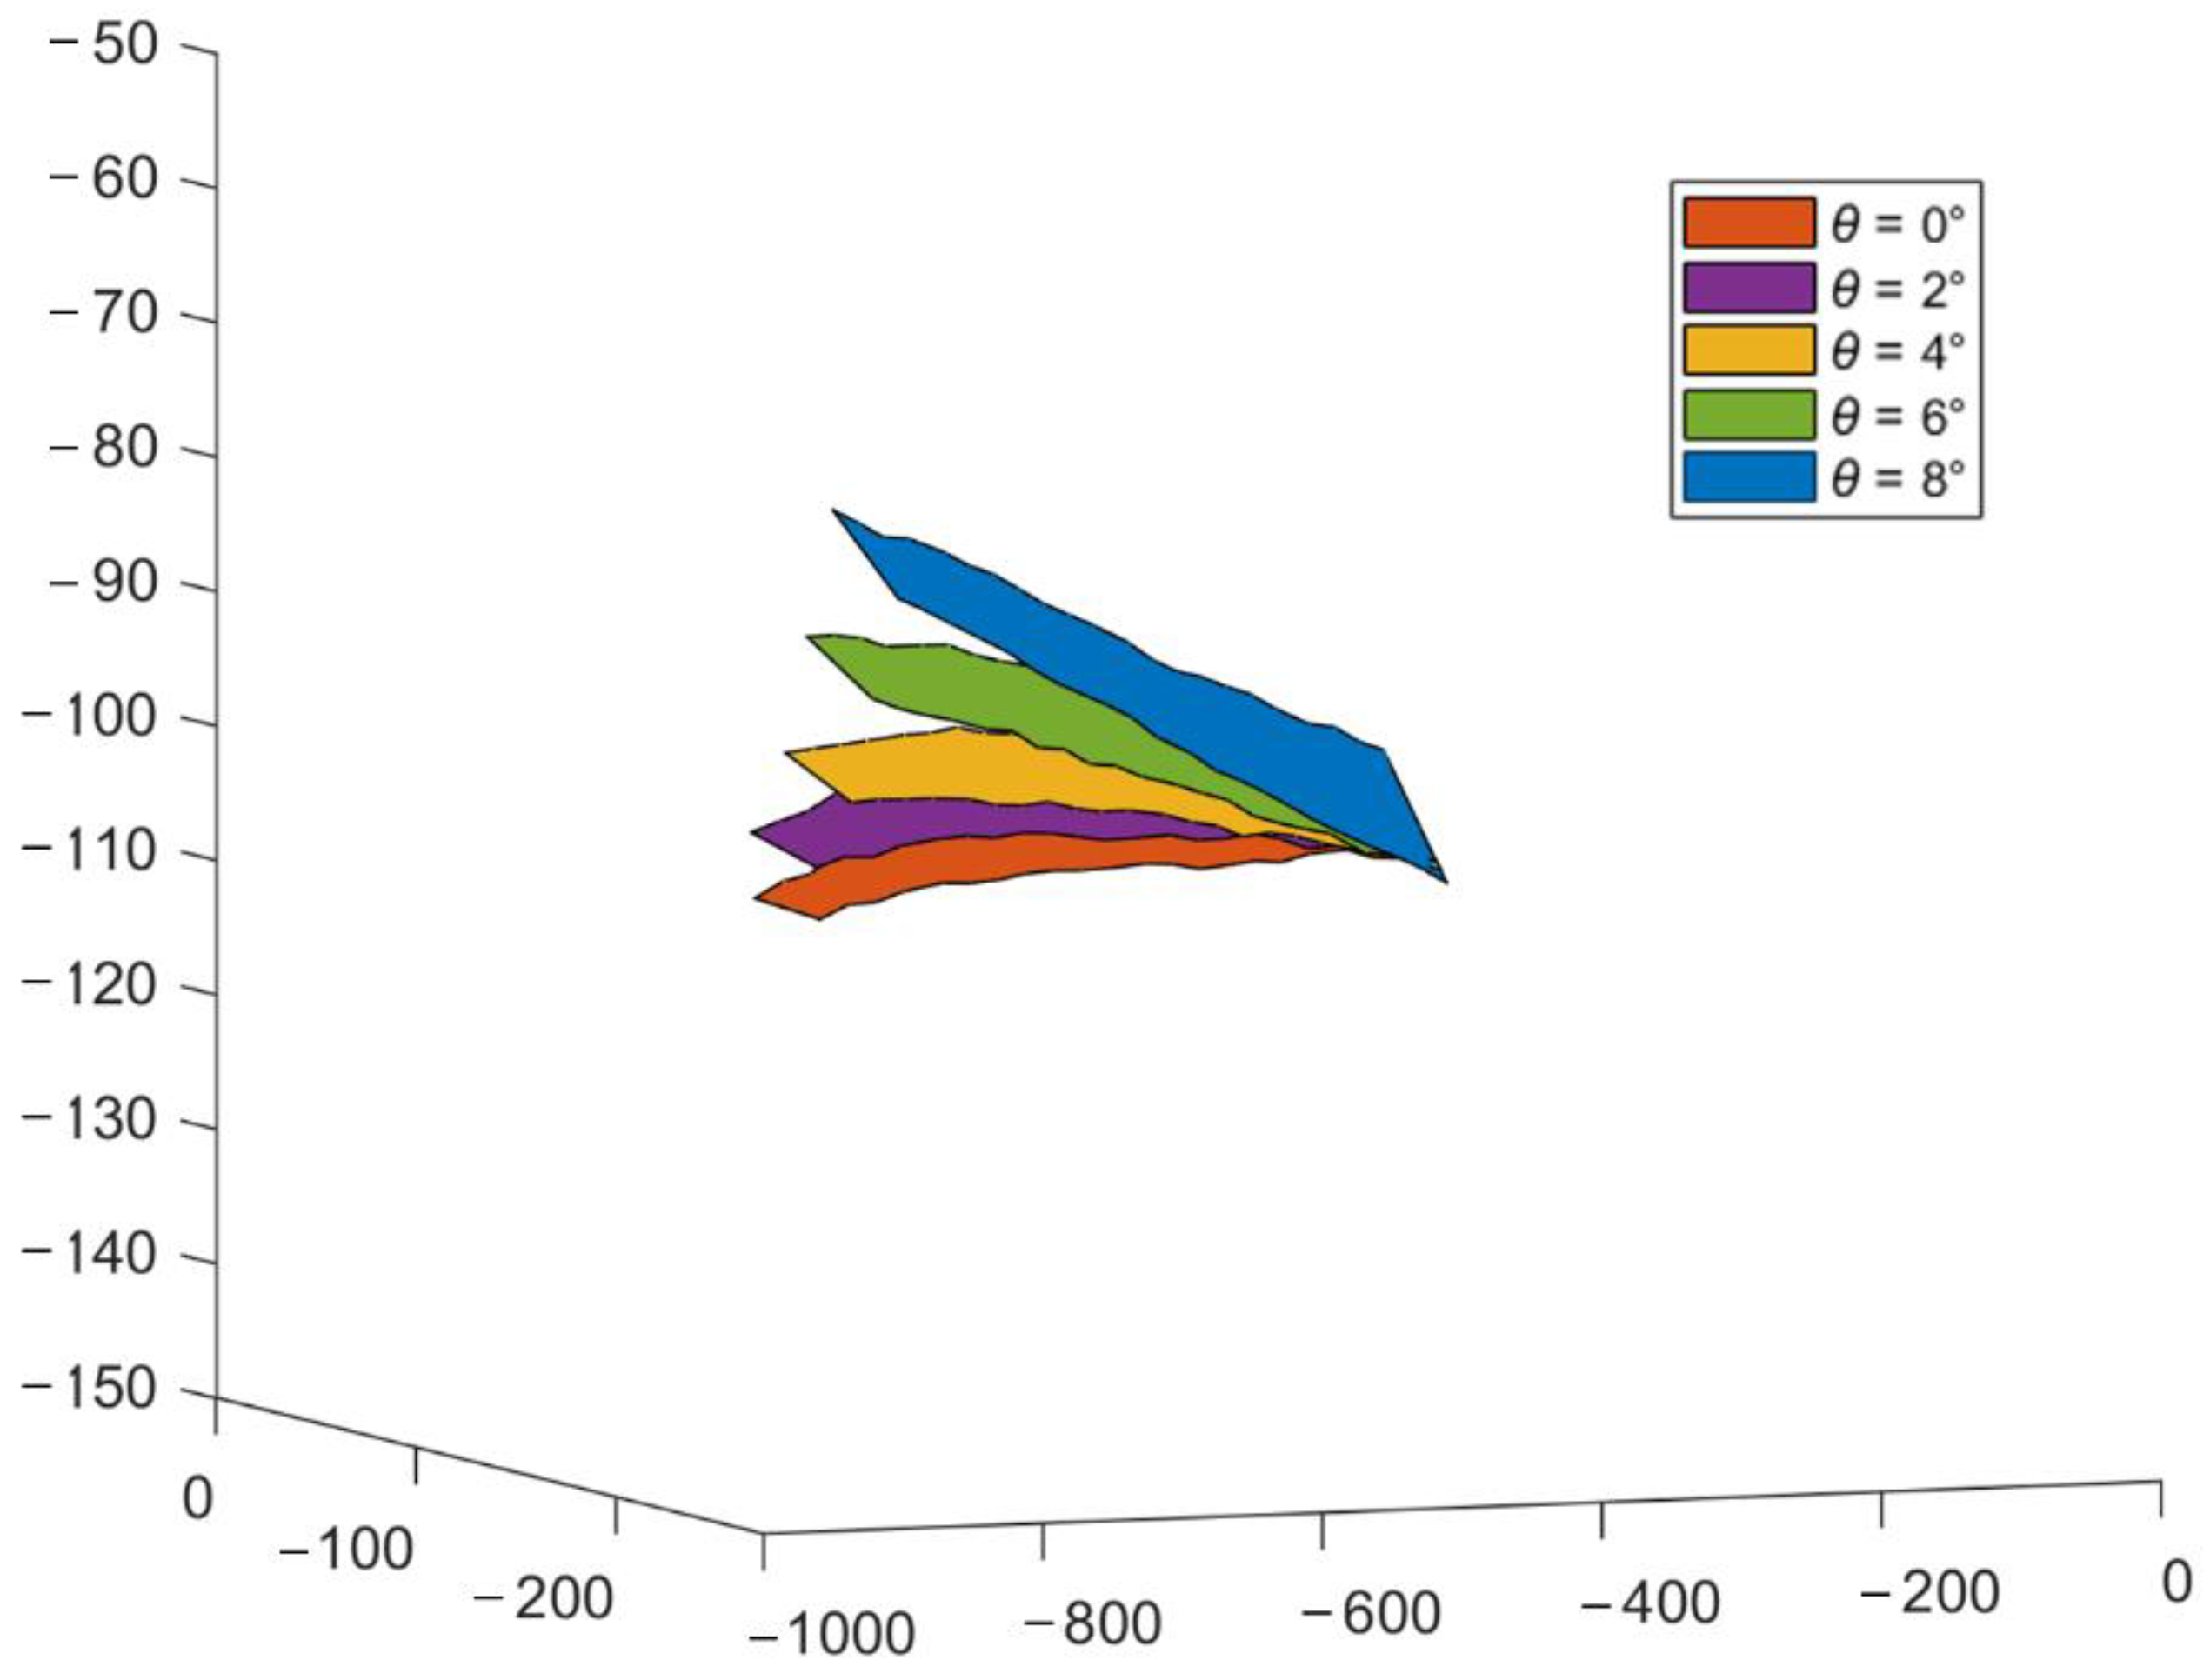
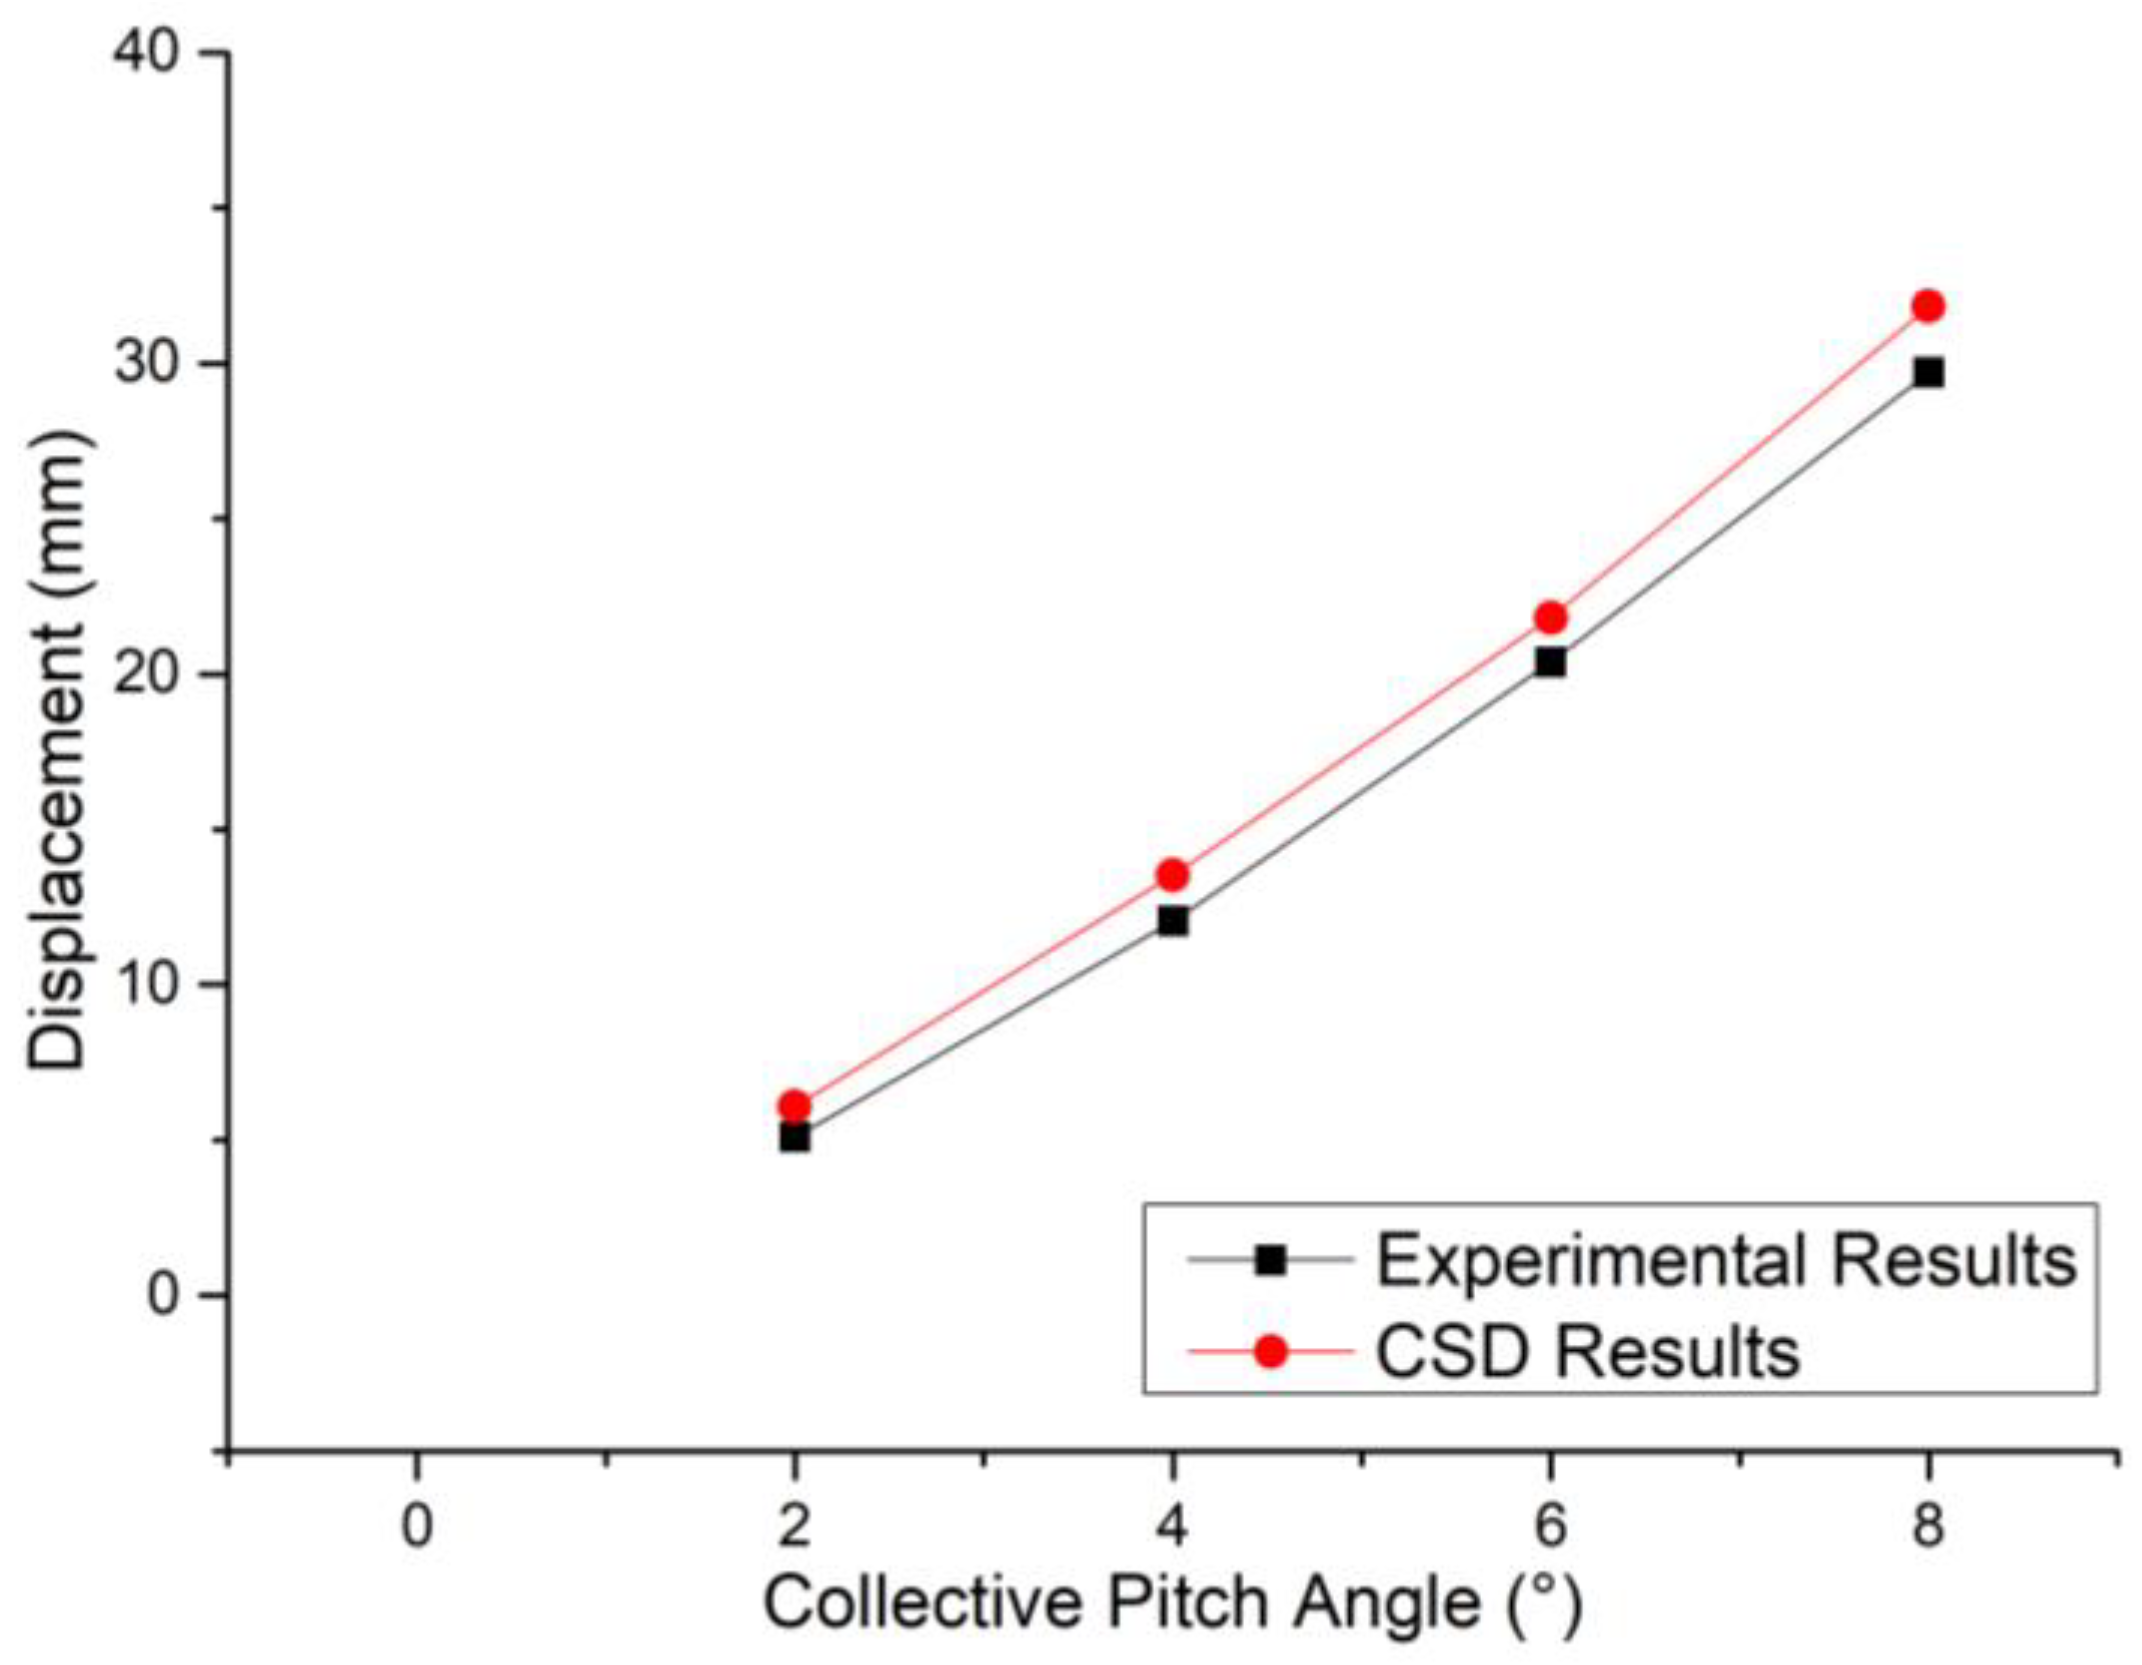
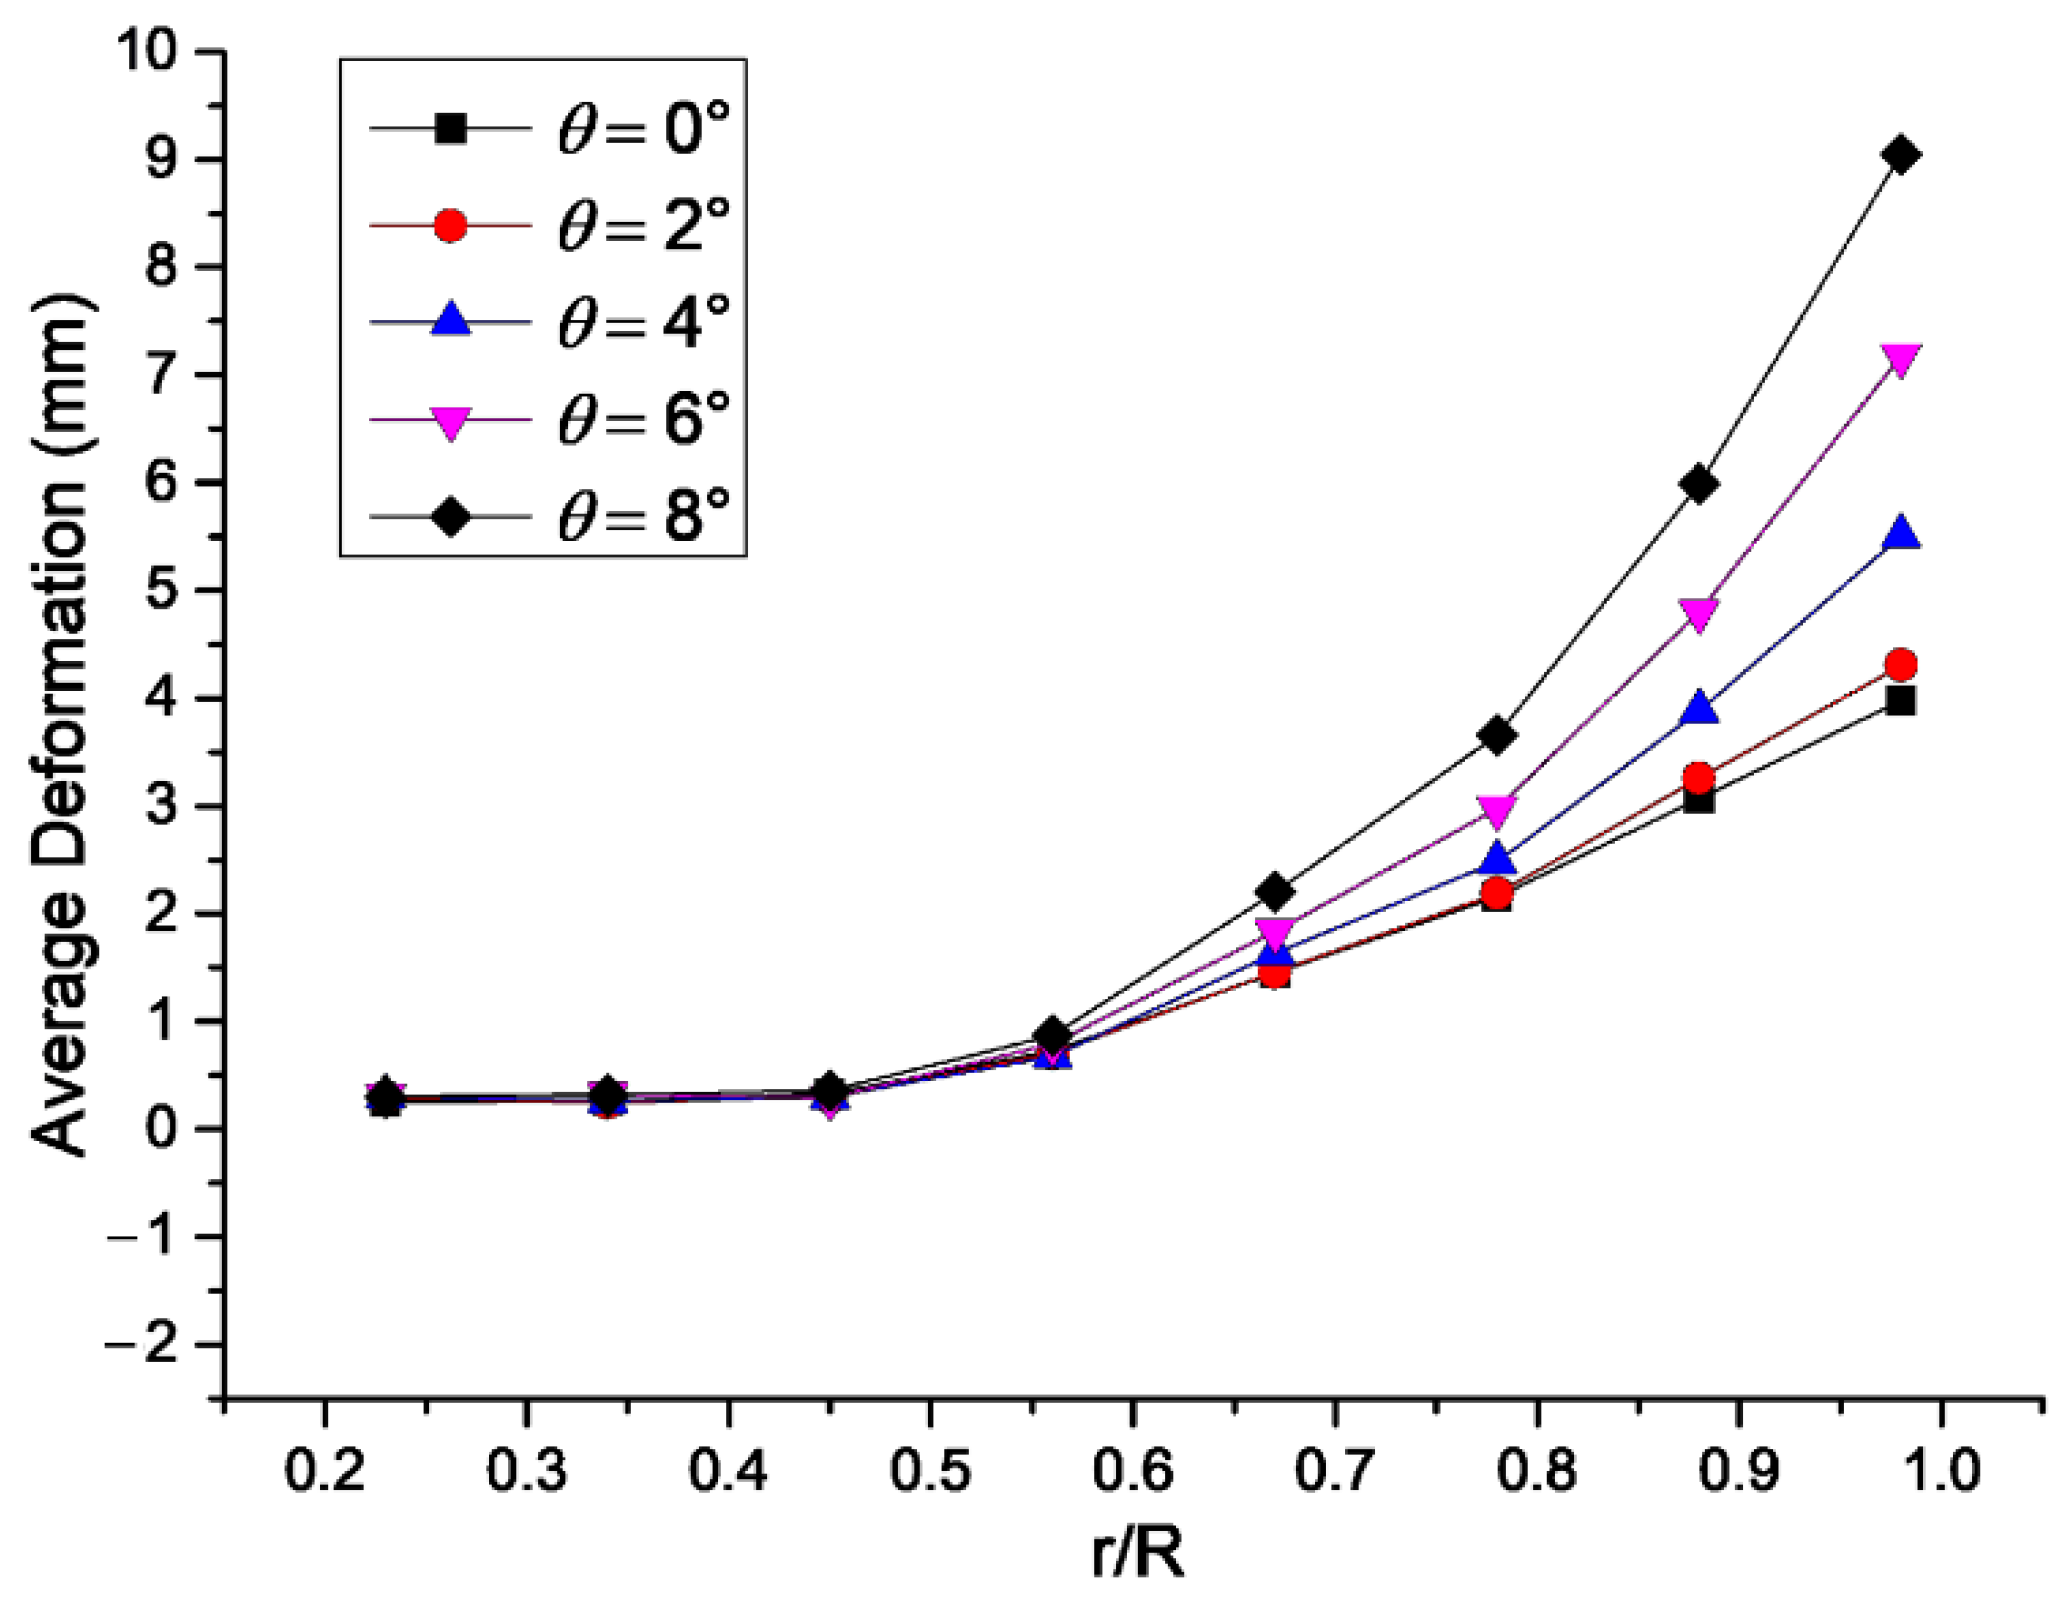
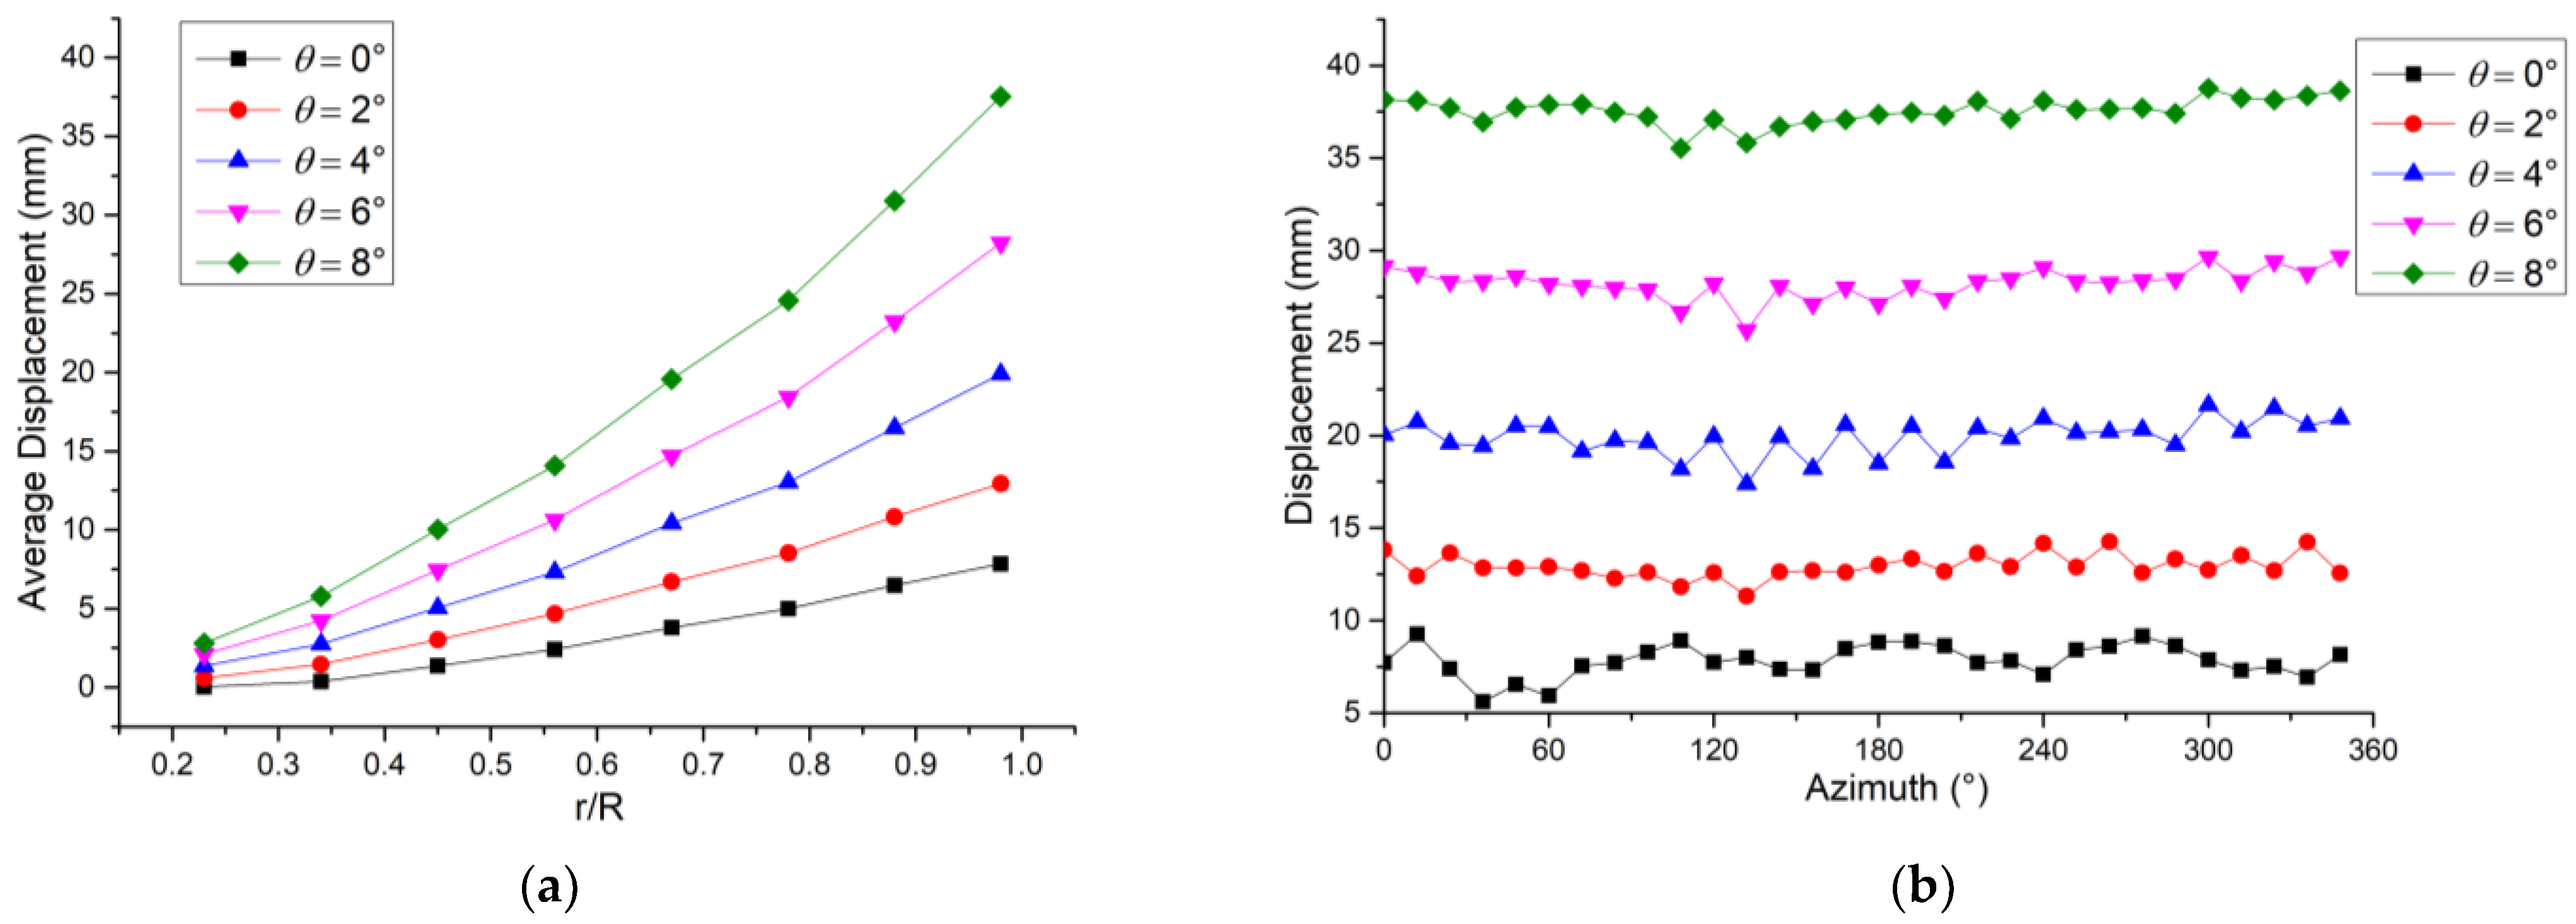
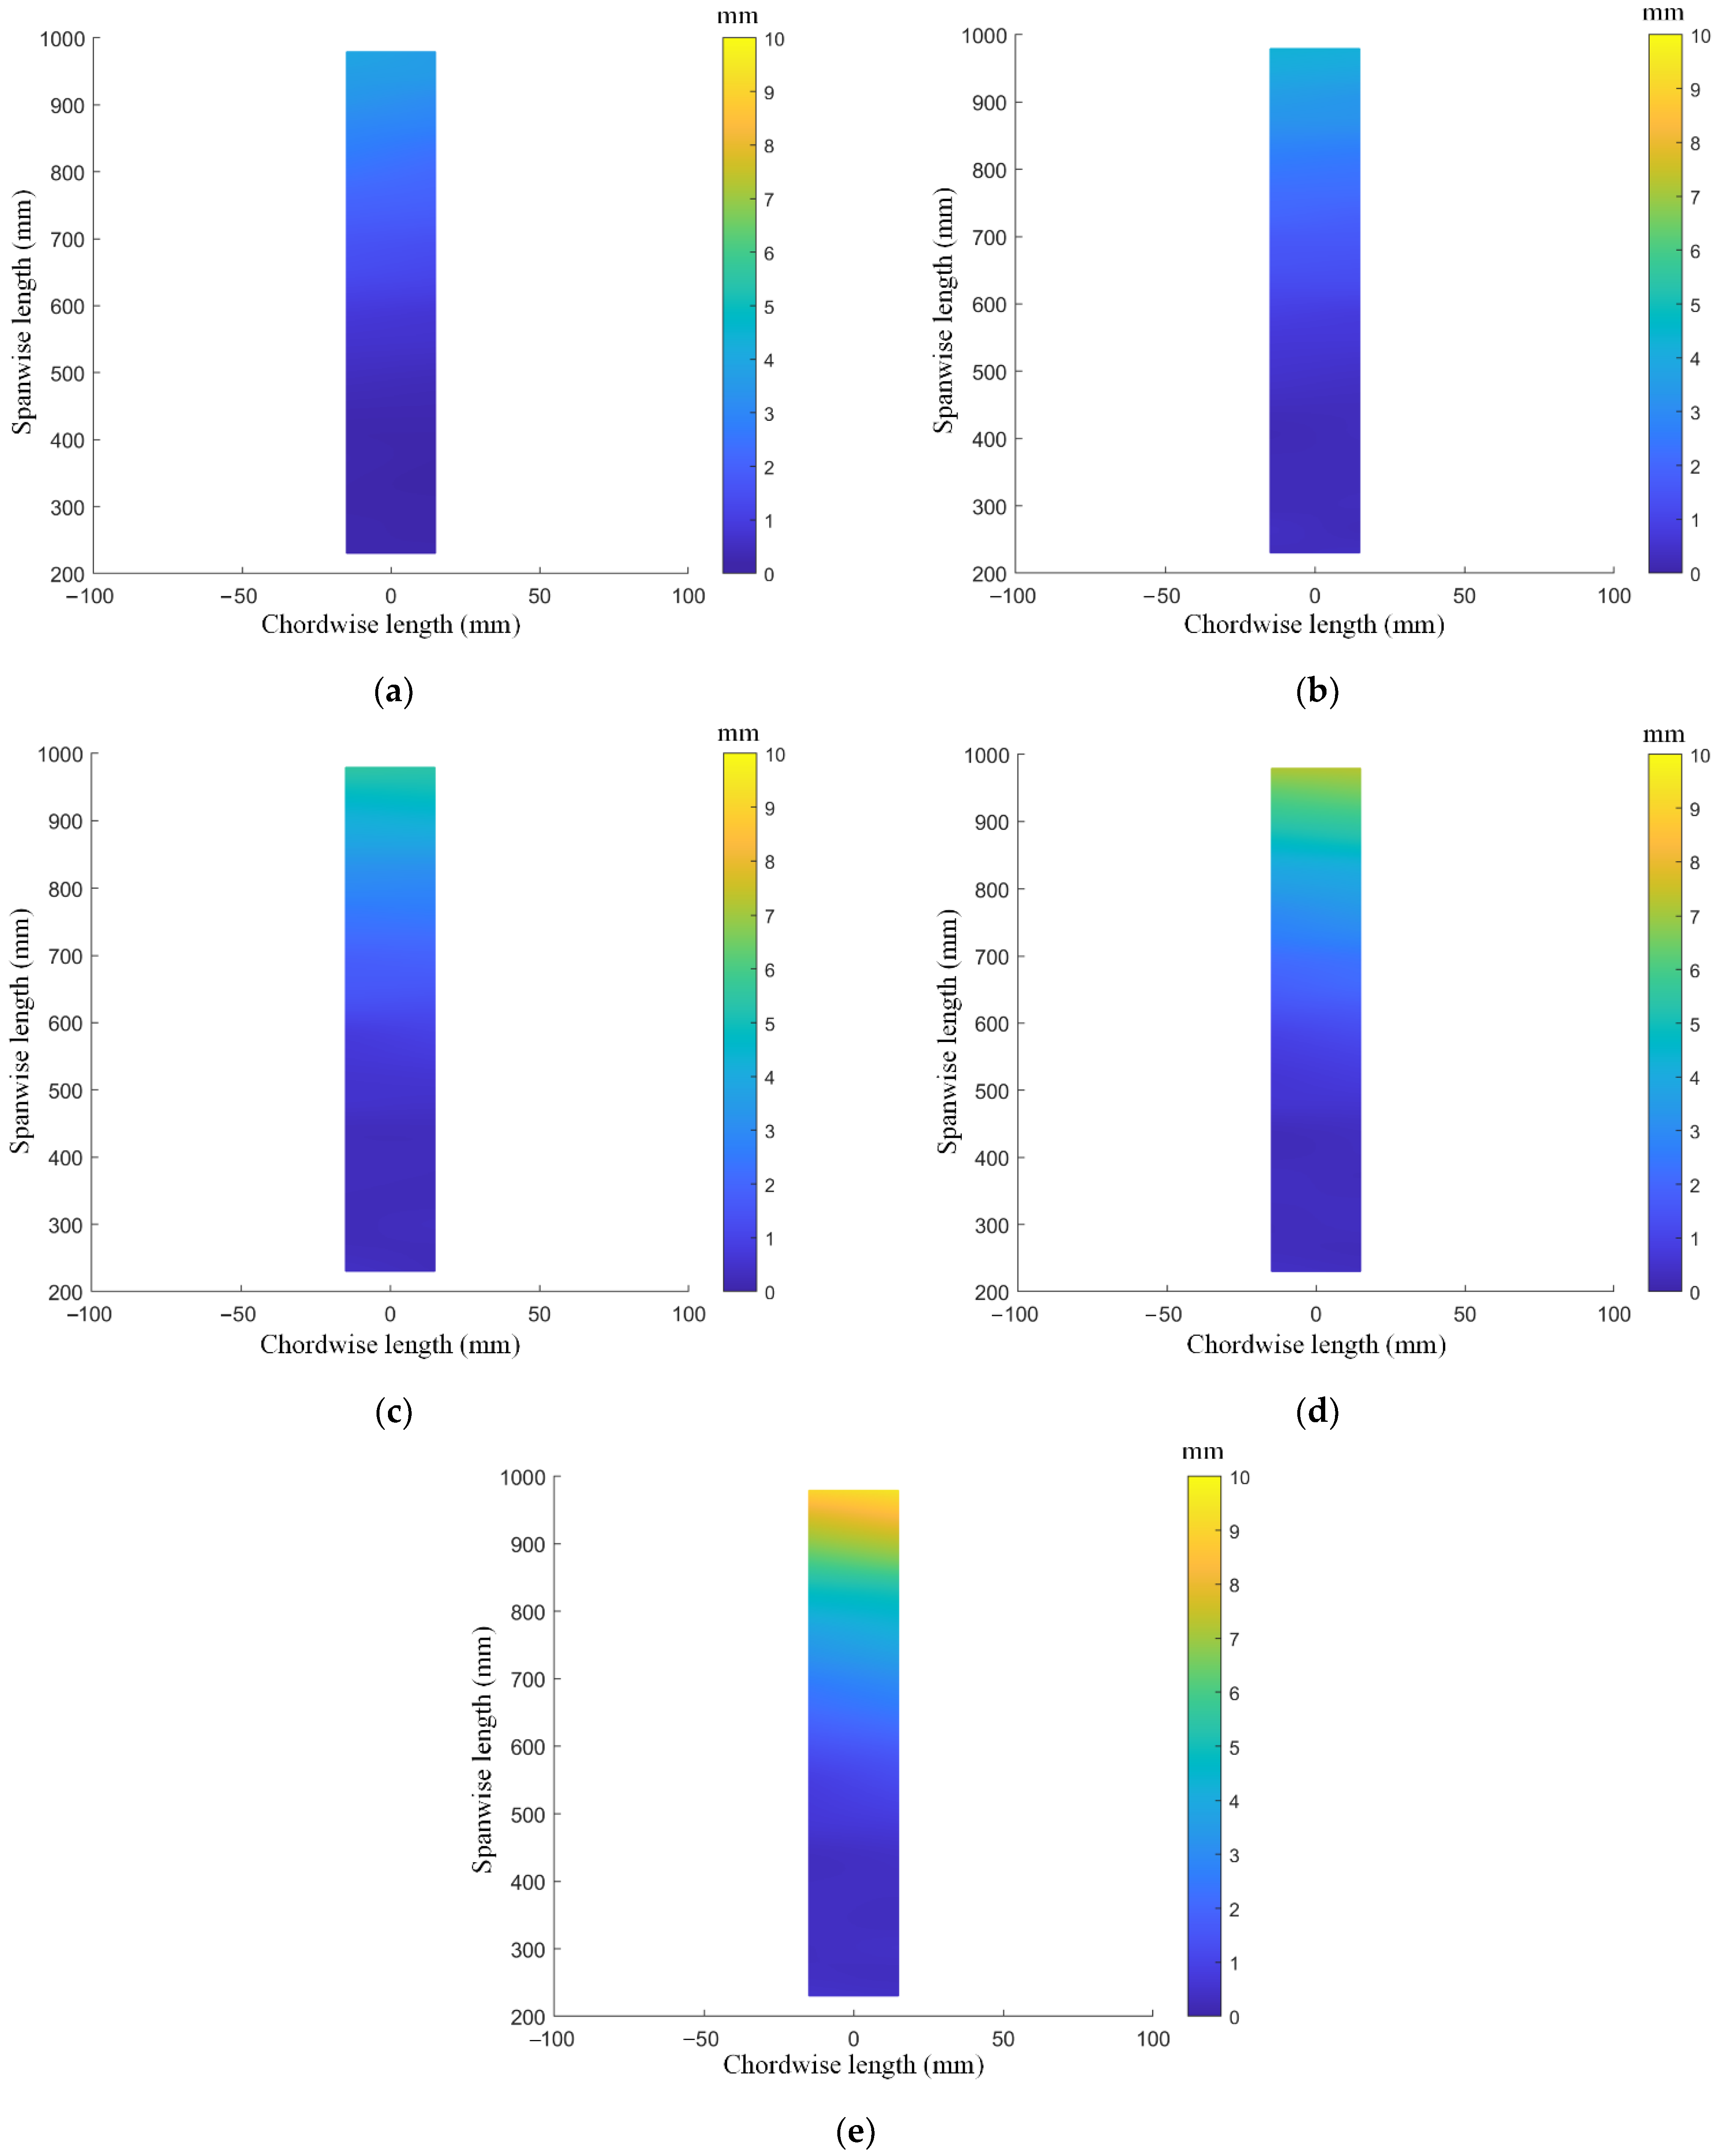
4. Results and Discussion
5. Conclusions
Author Contributions
Funding
Data Availability Statement
Conflicts of Interest
References
- Tourjansky, N.; Szechenyi, E. The measurement of blade deflections—A new implementation of the strain pattern analysis. In Proceedings of the European Rotorcraft Forum, Avignon, France, 15–17 September 1992; ONERA—The French Aerospace Laboratory: Palaiseau, France, 1992. [Google Scholar]
- Kufeld, R.M.; Balough, D.L.; Cross, J.L.; Studebaker, K.F.; Jennison, C.D.; Bousman, W.G. Flight testing the UH-60A airloads aircraft. In Proceedings of the Annual Forum of the American Helicopter Society, Washington, DC, USA, 11–13 May 1994. [Google Scholar]
- Schmidt, T.; Tyson, J.; Galanulis, K. Full-field dynamic displacement and strain measurement using advanced 3D image correlation photogrammetry: Part I. Exp. Tech. 2003, 27, 47–50. [Google Scholar] [CrossRef]
- Fleming, G.A.; Gorton, S.A. Measurement of rotorcraft blade deformation using projection moire interferometry. Shock Vib. 2000, 7, 149–166. [Google Scholar] [CrossRef]
- Fleming, G.A.; Soto, H.L.; South, B.W. Projection moire interferometry for rotorcraft applications: Deformation measurements of active twist rotor blades. In Proceedings of the American Helicopter Society 58th Annual Forum, Montreal, QC, Canada, 11–13 June 2002. [Google Scholar]
- Sekula, M. The development and hover test application of a projection moire interferometry blade displacement measurement system. In Proceedings of the American Helicopter Society Annual Forum, Fort Worth, TX, USA, 1–3 May 2012. [Google Scholar]
- Schneider, O.; Wall, B.G.V.D.; Pengel, K. HART II blade motion measured by stereo pattern recognition. In Proceedings of the American Helicopter Society Forum, Phoenix, AZ, USA, 6–8 May 2003. [Google Scholar]
- Schneider, O.; Wall, B.G.V.D. Final analysis of HART II blade deflection measurements. In Proceedings of the European Rotorcraft Forum, Friedrichshafen, Germany, 16–18 September 2003. [Google Scholar]
- Schneider, O. Analysis of SPR measurements from HART II. Aerosp. Sci. Technol. 2005, 9, 409–420. [Google Scholar] [CrossRef]
- Olson, L.E.; Abrego, A.I.; Barrows, D.A.; Burner, A.W. Blade deflection measurements of a full-scale UH-60A rotor system. In Proceedings of the American Helicopter Society Aeromechanics Specialist Conference, San Francisco, CA, USA, 20–22 January 2010. [Google Scholar]
- Abrego, A.I.; Olson, L.E.; Romander, E.A.; Barrows, D.A.; Burner, A.W. Blade displacement measurement technique applied to a full-scale rotor test. In Proceedings of the American Helicopter Society Annual Forum, Fort Worth, TX, USA, 1–3 May 2012. [Google Scholar]
- Romander, E.; Meyn, L.; Norman, T.R.; Barrows, D.; Burner, A. Blade motion correlation for the full-scale UH-60A airloads rotor. In Proceedings of the AHS 5th Decennial Aeromechanics Specialists Conference, San Francisco, CA, USA, 22–24 January 2014. [Google Scholar]
- Abrego, A.; Meyn, L.; Burner, A.; Barrows, D. Summary of full-scale blade displacement measurements of the UH-60A airloads rotor. In Proceedings of the AHS Technical Meeting on Aeromechanics Design for Vertical Lift, San Francisco, CA, USA, 20–22 January 2016. [Google Scholar]
- Straub, F.K.; Anand, V.R.; Lau, B.H.; Birchette, T.S. Wind tunnel test of the SMART active flap rotor. J. Am. Helicopter Soc. 2018, 63, 1–16. [Google Scholar] [CrossRef]
- Zuo, C.; Ma, J.; Yue, T.; Song, J.; Shi, Z. Blade displacement measurements of helicopter rotor based on stereo vision. In Proceedings of the 18th International Symposium on Flow Visualization, Zurich, Switzerland, 26–29 June 2018. [Google Scholar]
- Zuo, C.; Ma, J.; Yue, T.; Song, J.; Wang, X. Displacement and deformation measurements of helicopter rotor blades based on binocular stereo vision. J. Exp. Fluid Mech. 2020, 34, 87–95. [Google Scholar]
- Bernardini, G.; Serafini, J.; Enei, C.; Mattioni, L.; Ficuciello, C.; Vezzari, V. Structural characterization of rotor blades through photogrammetry. Meas. Sci. Technol. 2016, 27, 065401. [Google Scholar] [CrossRef]
- Sirohi, J.; Lawson, M.S. Measurement of helicopter rotor blade deformation using digital image correlation. Opt. Eng. 2012, 51, 043603. [Google Scholar] [CrossRef]
- Sicard, J.; Sirohi, J. Measurement of the deformation of an extremely flexible rotor blade using digital image correlation. Meas. Sci. Technol. 2013, 24, 065203. [Google Scholar] [CrossRef]
- Boden, F.; Stasicki, B.; Szypula, M.; Ruzicka, P.; Tvrdik, Z.; Ludwikowski, K. In-flight measurements of propeller blade deformation on a VUT100 cobra aeroplane using a co-rotating camera system. Meas. Sci. Technol. 2016, 27, 074013. [Google Scholar] [CrossRef]
- Uehara, D.; Sirohi, J. Full-field optical deformation measurement and operational modal analysis of a flexible rotor blade. Mech. Syst. Signal Processing 2019, 133, 106265. [Google Scholar] [CrossRef]
- Wei, B.; Liang, J.; Hu, H.; Ren, M.; Yi, H.; Li, J. A videogrammetric system for measuring the full-field blade deformation of a heavy-duty helicopter’s Rotating Rotor. Rev. Sci. Instrum. 2018, 89, 115111. [Google Scholar] [CrossRef] [PubMed]
- Sousa, P.J.; Barros, F.; Tavares, P.J.; Moreira, P.M. Displacement measurement and shape acquisition of an rc helicopter blade using digital image correlation. Procedia Struct. Integr. 2017, 5, 1253–1259. [Google Scholar] [CrossRef]
- Sousa, P.J.; Barros, F.; Tavares, P.J.; Moreira, P.M. Digital image correlation displacement measurement of a rotating RC helicopter blade. Eng. Fail. Anal. 2018, 90, 371–379. [Google Scholar] [CrossRef]


| Calibration Parameters | Camera 1 | Camera 2 |
|---|---|---|
| Equivalent focal length (fx, fy) | (3481.902, 3481.744) | (3474.916, 3474.299) |
| Principal point (x0, y0) | (1022.782, 1040.829) | (1020.625, 1004.494) |
| skewness coefficient γ | 0 | 0 |
| Radial Distortion Coefficients (k1, k2) | (−0.099, 0.107) | (−0.096, 0.058) |
| Rotation matrix R | ||
| Translation vector T | (0 0 0) | (−1043.223 114.493 119.592) |
| θ (°) | Accuracy of Hub Targets (mm) | Accuracy of Blade Targets (mm) |
|---|---|---|
| 0 | 0.125 | 0.204 |
| 2 | 0.131 | 0.251 |
| 4 | 0.143 | 0.231 |
| 6 | 0.148 | 0.205 |
| 8 | 0.116 | 0.233 |
| Average | 0.132 | 0.224 |
Publisher’s Note: MDPI stays neutral with regard to jurisdictional claims in published maps and institutional affiliations. |
© 2022 by the authors. Licensee MDPI, Basel, Switzerland. This article is an open access article distributed under the terms and conditions of the Creative Commons Attribution (CC BY) license (https://creativecommons.org/licenses/by/4.0/).
Share and Cite
Zuo, C.; Ma, J.; Wei, C.; Yue, T.; Song, J. Deformation Measurements of Helicopter Rotor Blades Using a Photogrammetric System. Photonics 2022, 9, 466. https://doi.org/10.3390/photonics9070466
Zuo C, Ma J, Wei C, Yue T, Song J. Deformation Measurements of Helicopter Rotor Blades Using a Photogrammetric System. Photonics. 2022; 9(7):466. https://doi.org/10.3390/photonics9070466
Chicago/Turabian StyleZuo, Chenglin, Jun Ma, Chunhua Wei, Tingrui Yue, and Jin Song. 2022. "Deformation Measurements of Helicopter Rotor Blades Using a Photogrammetric System" Photonics 9, no. 7: 466. https://doi.org/10.3390/photonics9070466
APA StyleZuo, C., Ma, J., Wei, C., Yue, T., & Song, J. (2022). Deformation Measurements of Helicopter Rotor Blades Using a Photogrammetric System. Photonics, 9(7), 466. https://doi.org/10.3390/photonics9070466