1. Introduction
Complex dynamical systems display a broad variety of behaviours depending on parameters and initial conditions. When the dynamical equations are unknown, we face the fundamental challenge of characterizing and distinguishing different dynamical regimes by identifying temporal structures in the dynamical observations, specifically those robust to observational or experimental noise. In [
1], Bandt and Pompe introduced the technique of permutation entropy (PE) analysis as the Shannon entropy of the probabilities of ordinal patterns generated by a ‘digitized’ time series of any dynamical observable. This technique has proved powerful across a variety of applications, particularly in allowing for a general and robust characterization metric for dynamical systems (see Ref. [
2] for a review).
It has been recently appreciated that these patterns (also known as words) themselves pertain to temporal structures in the dynamics: as we argue below, by construction, words reveal ‘approximate dynamical symmetries’. Specifically, Bandt [
3,
4] introduced techniques that grouped words to highlight some intuitive approximate symmetries, which proved useful to classify sleep stages from EEG and weather time series. A further shift in focus came from realizing that changes in approximate dynamical symmetries could serve as early-warning-signals of dynamical transitions. Such techniques were used to forecast extreme events and transitions in the dynamics of lasers with optical feedback [
5,
6]. In Gunther et al. [
7], analysis of the approximate rotational and mirror symmetry properties of a bi-stable Duffing oscillator was shown both to distinguish different kinds of dynamical regimes and to anticipate changes in dynamical regimes.
Previous analyses used such approximate symmetry measures derived from natural theoretical intuition (rotation, mirror, reversibility, up-down scaling, …). In this work, we start from experimental observations of the dynamics of a semiconductor laser with external optical feedback (also known as a photonic neuron), which serves as a ‘minimal model’ experimental system. We consider the system dynamics and its temporal transitions to find those symmetries that empirically are most visible at these transitions. These define new approximate temporal symmetries (the TARDYS quantifiers discussed below). We then test these new quantifiers to study the output power of a Raman fiber laser and its dynamical transitions, and we find that these new quantifiers capture the symmetries lost at these transitions. This allows the obverse of usual analysis–we use these new approximate symmetry metrics motivated by an experimental device to analyze well-known theoretical chaotic systems, such as the logistic map, and find that these new measures are, in fact, able to predict sudden transitions in their dynamics. This confirms the value of studying these approximate dynamical symmetries and suggests that much remains to be understood about the power of such analyses. We finally combine the TARDYS quantifiers with PE as a new visual method to classify complex dynamics and distinguish families of chaos.
2. Time-Series Analysis of a Photonic Neuron
A semiconductor laser with external optical feedback is also known as a photonic neuron, as it replicates features of the spiking dynamics of biological neurons [
8,
9,
10] such as excitability or the statistics of inter-spike-intervals. This well-studied dynamical system shows a wide range of regular and chaotic behavior [
11,
12,
13], including transitions between regions of different approximate symmetries in the chaotic regime [
5]. Photonic neurons are experimentally easy to control and have been used to explore general complex dynamics as well as to mimic biological neurons for neuromorphic applications [
14,
15,
16]. The dynamics of photonic neurons are hence intrinsically interesting and also generic, hence they serve as a paradigmatic experimental test bed to explore a wide variety of chaotic and less-controllable natural systems.
Our particular photonic neuron is a semiconductor laser with external optical feedback under periodic modulation of its pump current (a 650 nm-wavelength laser with an external cavity of 70 cm (see Ref. [
12] for details). Feedback to the laser can make it deliver irregular, apparently random, and sudden optical dropouts in its output power. These are known as low-frequency fluctuations (LFFs) and arise due to nonlinear light–matter interactions in the laser, time delay due to external feedback, and intrinsic noise in the laser. Since we drive the photonic neuron periodically with a sinusoidal modulation on top of a DC bias current, this maps the system to other complex dynamical systems under an external periodic forcing, which can lead to entrainment and synchronization among other phenomena [
13]. This architecture has also been studied to understand how excitable systems respond to external signals to encode information [
17,
18].
During the experiments, we record the output intensity of the laser with a photo-detector connected to a 1 GHz oscilloscope and analyze the inter-spike intervals (ISI) to study temporal correlations among consecutive events. The range of modulation amplitudes goes from to . This allows to see varied dynamics, but preventing the modulation to control the dynamics. The time series recorded contain between 72,000 ISIs, with an average ns and a standard deviation ns (for low modulation amplitude), to 207,000 ISIs, with an average ns and a standard deviation ns (for high modulation amplitude).
We then proceed by using the Bandt and Pompe ordinal patterns approach [
1] comparing
D consecutive inter-spike intervals (ISIs) to transform our observations into populations of patterns or words. The words depend on their relative magnitude: for
consecutive ISIs, if
, the word is 01, if
, the word is 10; for
consecutive ISIs, the shortest interval is assigned a 0, the longest a 2, and the intermediate a 1, such that if
, the word is 012, if
, the word is 120, and so on. There are
possible words of dimension
D. The entropy of the population distribution of patterns and other properties allow to distinguish stochasticity from determinism, quantify the memory of the system, and can reveal its dynamical symmetries [
2].
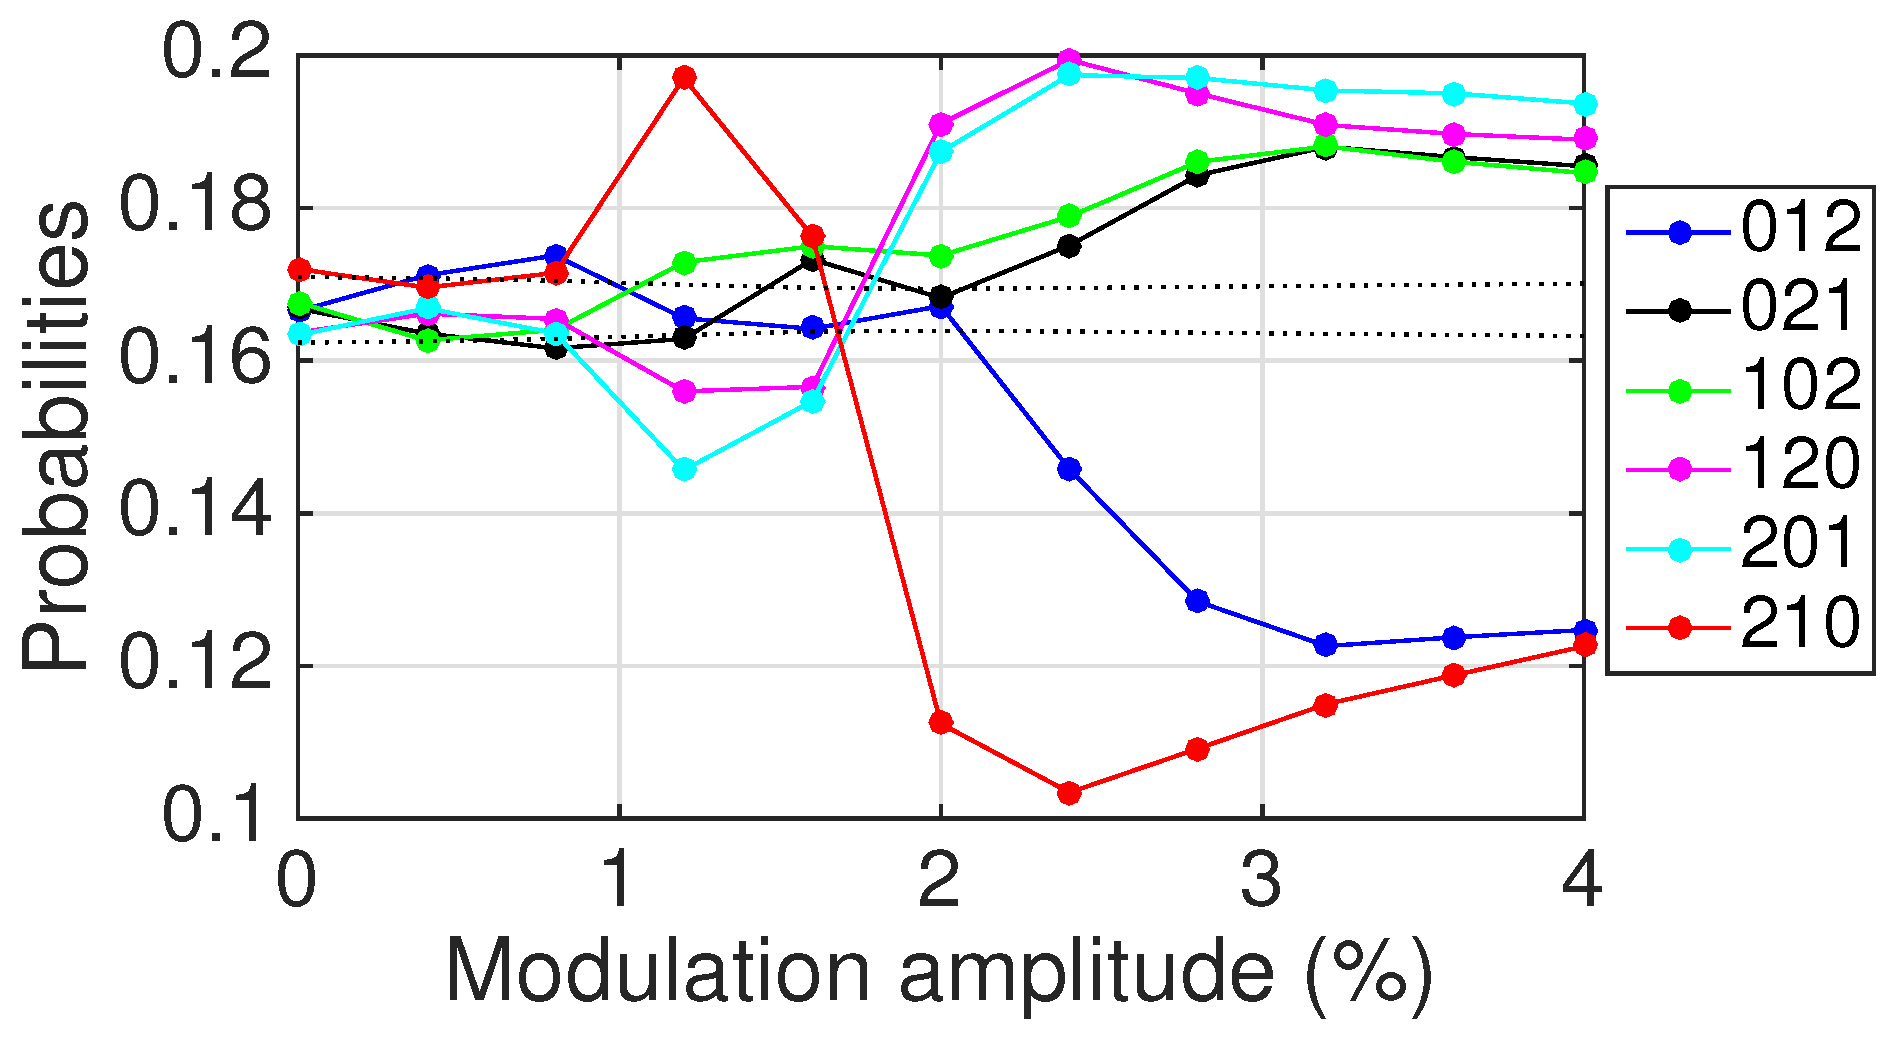
Figure 1 shows the probabilities of various word populations for the photonic neuron (details in caption) as a function of the modulation amplitude. Different dynamical regimes are reflected in the different hierarchies for the words probabilities. For weak modulation, the dynamics are compatible with a stochastic process (
). For intermediate modulation amplitudes, the dynamics are deterministic (dotted lines indicate the region that is compatible with a stochastic process), and the behavior presents a hierarchy of words where 210 is more likely. For stronger modulation, the photonic neuron transitions to a different deterministic dynamical regime, where the words 210 and 012 are now less likely and the clusters 120–201 and 102–021 are more likely. These three different dynamical regimes correlate with differences in the statistics of the ISIs [
19]. That the system presents clusters of words is empirical evidence of dynamical constraints or internal global symmetries. We now define new approximate temporal symmetries resulting from grouping word populations and comparing their relative sizes as follows.
3. TARDYS Quantifiers
Inspection of
Figure 1 reveals the following relationships among word probabilities.
It is worth remarking that for the regions where the dynamics are so chaotic as to be compatible with a stochastic process, where , these quantifiers are not informative even when . It is when these probabilities deviate substantially far from (outside the region defined by the dotted lines) when these measures are relevant. Thus, we can conclude that deterministic chaotic behavior is dominated by those symmetries.
4. TARDYS Quantifiers of a Photonic Neuron under Periodic Forcing
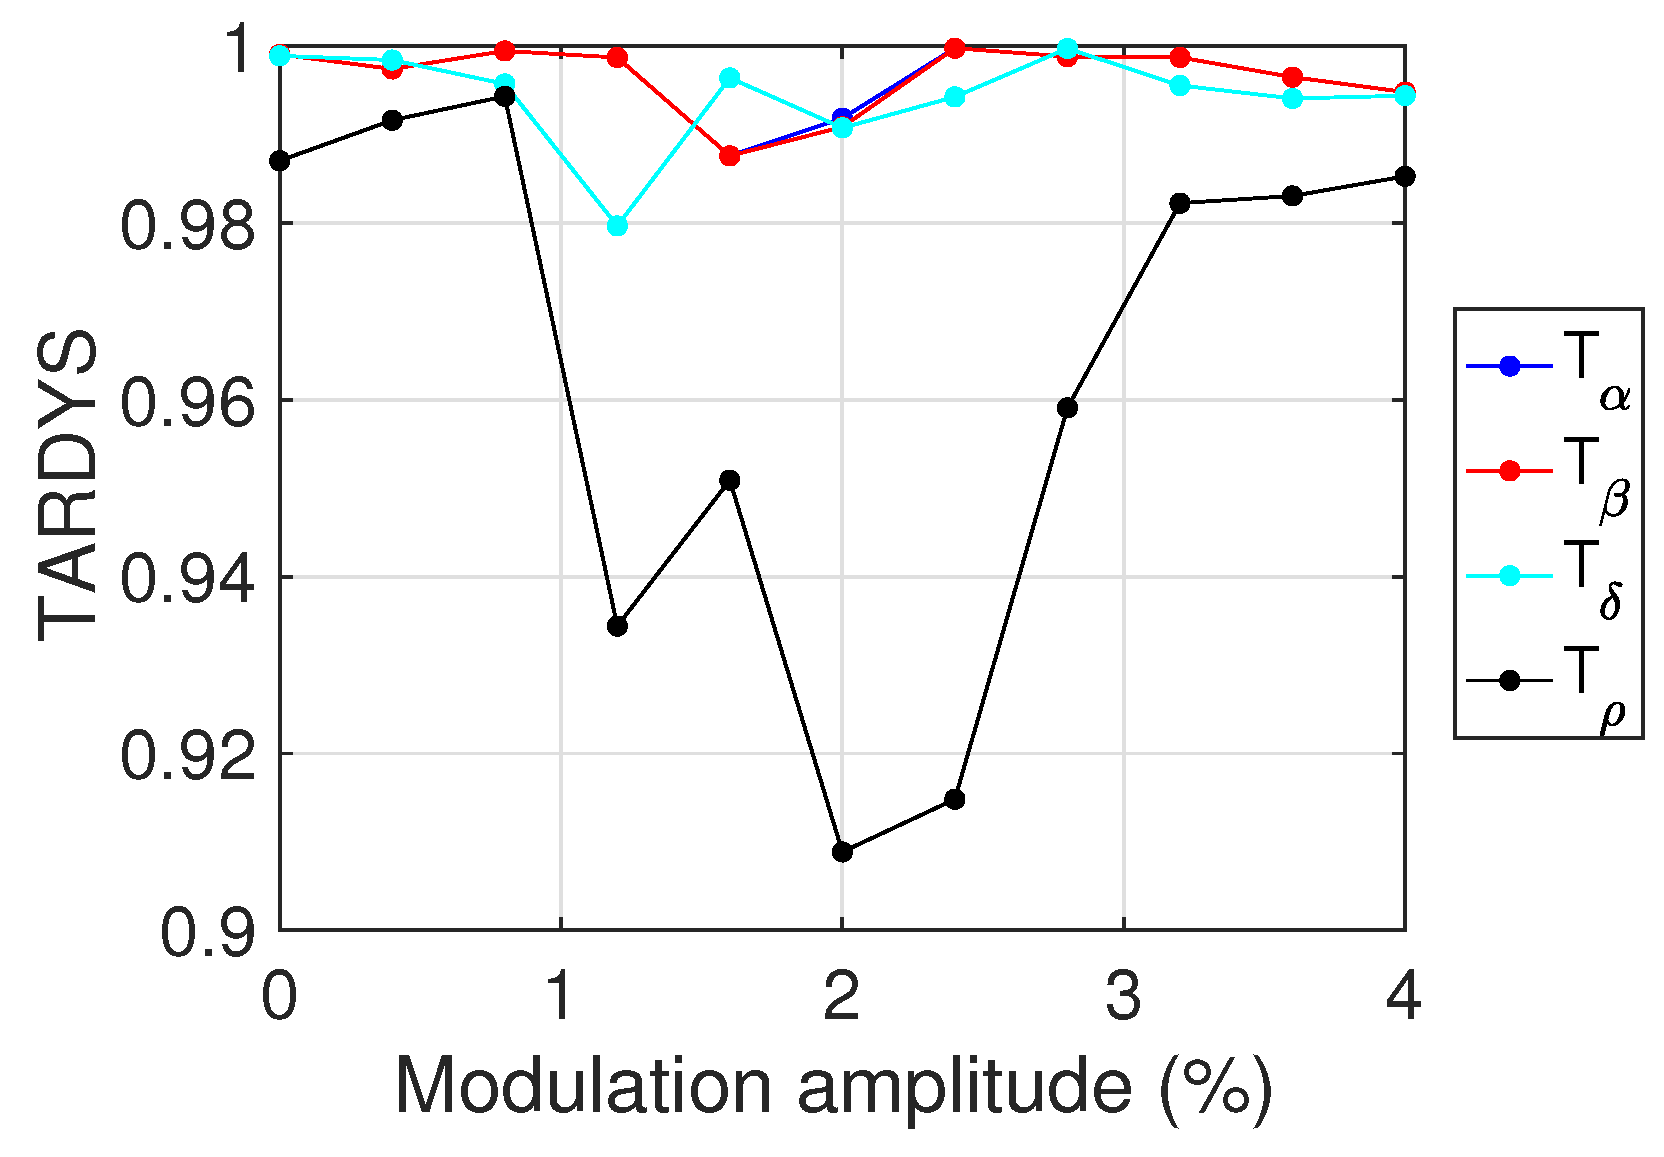
We apply these TARDYS quantifiers to our photonic neuron (see
Figure 2) and confirm that our construction is valid, that indeed the symmetries
,
, and
are strongly visible in the dynamics, albeit with minor variations as we change the control parameter (modulation amplitude). We also see that
captures dynamical transitions: reversibility decreases for intermediate modulation amplitudes (1–3%), while for steady dynamical regimes (for low and high modulation amplitudes), the dynamics of the system are considerably reversible. Further, since
for a purely stochastic process, the symmetries defined by Equations (
2) and (
5) imply that
, even though the system might present no deterministic behavior. Comparing
Figure 1 and
Figure 2, we see that the TARDYS are not useful in allowing us to make conclusions about the dynamics for a modulation amplitude between 0 and
but does prove so for modulation amplitudes between
and
.
For this range of dynamics, the TARDYS quantifiers indeed track the change in underlying symmetries: as we traverse the photonic neuron’s deterministic range between an amplitude of and , we see a change at an amplitude of , indicating a transition from stochastic-like to deterministic behavior. Another transition in dynamics occurs at an amplitude of . Looking at the TARDYS for these regions, we see that, in spite of the different dynamical behavior, the approximate symmetries of the system are manifest throughout the range of modulation amplitudes (). Thus, we see that the external periodic forcing does not change these symmetries.
5. Raman Fiber Laser
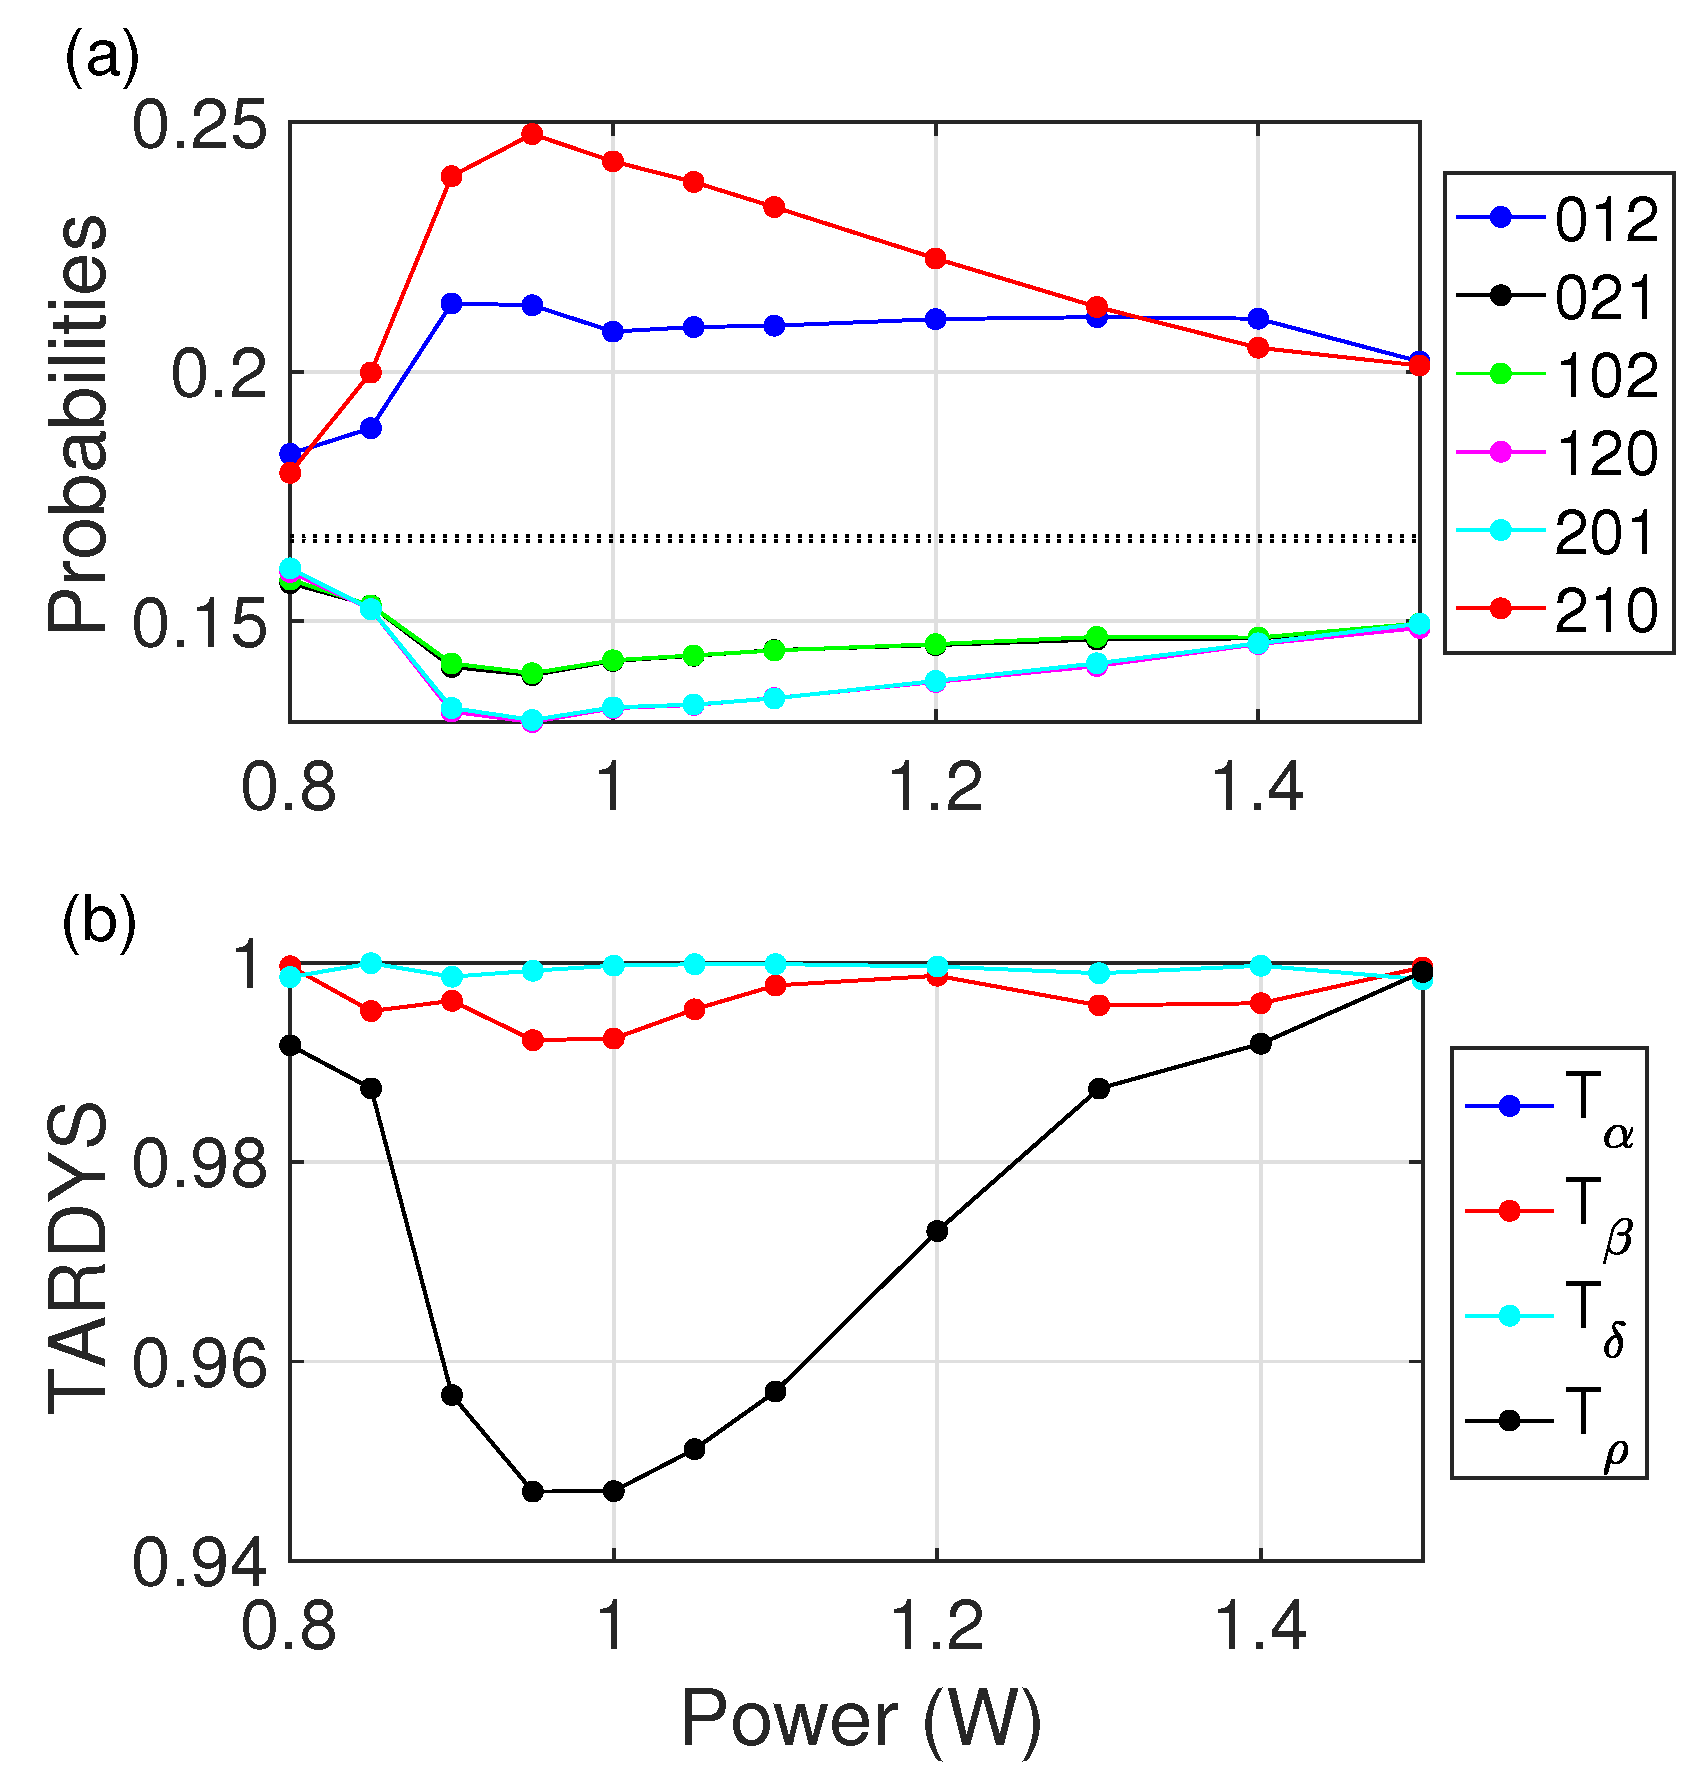
We now turn to apply the TARDYS measures to a different experimental photonic systems with complex dynamics, specifically a quasi-cw Raman fiber laser formed using 1 km of normal dispersion fiber placed between two fiber Bragg gratings acting as cavity mirrors. At
W, the system experiences a transition from laminar to turbulent dynamics (see Ref. [
20] for details). The probability distribution for ordinal patterns (see
Figure 3a) is far from the dotted lines that indicate a stochastic process, suggesting some deterministic structure. Since the words here are computed using peaks of the laser output intensity, we are simultaneously considering temporal and intensity in these dynamical symmetries. We find that despite two very different regimes (laminar/turbulent),
throughout the whole control parameter space studied (see
Figure 3b).
again captures the transition from laminar to turbulent: for the laminar regime (
W), reversibility is strongly manifested, but it drops right at the transition and remains low as the turbulent regime builds up. This symmetry
increases again when the system is in a fully developed turbulent regime. While reversibility decreases in the transition, the time–intensity symmetry captured by
is strong throughout the process, and
and
are not just high but are equal.
We can thus infer that these TARDYS quantifiers derived from approximate dynamical symmetries of experimental data from photonic neurons are not only good measures to classify the dynamics of other physical systems, but they are also useful in detecting dynamical transitions. This is particularly clear in how reversibility
(in
Figure 3) decreases at the laminar–turbulent transition, similar to the transition for the photonic neuron.
and
also act as indicators of dynamical transitions in both systems, but to a lesser extent. Intriguingly, these results implying a reduction of reversibility at the laminar–turbulent transition are consistent with previous work [
21] that showed that new frequencies appear at this transition, indicating more constraints in the dynamics, which arguably corresponds to more ‘approximate symmetries’ or increased deterministic behavior.
6. Symmetry Constraints in the Logistic Map
After this, we apply the TARDYS quantifiers to theoretical systems to examine if these experimentally identified measures are useful in other (non-photonic) complex systems. We start with the paradigmatic logistic map, a well-studied dynamical system that displays regular-through-chaotic dynamics and is an iterative map defined by:
with the control parameter
. Other than the periodic windows, the system can be understood to have four main dynamical regions, each with different hidden symmetries, as discussed in [
22]: since this iterative map never presents the word 210, we must have that
for any value of
r. The different chaotic regions and their constraints, therefore, are:
In region I (
), the probabilities
and
. This implies that
and
, making
. The system shows all three symmetries from Equations (
2) and (
5). The dynamics are time-reversible and space–time invariant (where
at time
i maps to spatial locations).
In region II (), we have two constraints: and . This imposes that , and therefore, . Additionally, , so the system is not time-reversible () and is no longer space–time invariant ().
In region III (
), the less-restrictive constraint is
This then implies that , , but both of them can be written using only .
For region IV (), we did not find any constraints on the probabilities of the words other than .
The dynamical restrictions imposed by the symmetries are reflected in
,
,
, and
, as described before.
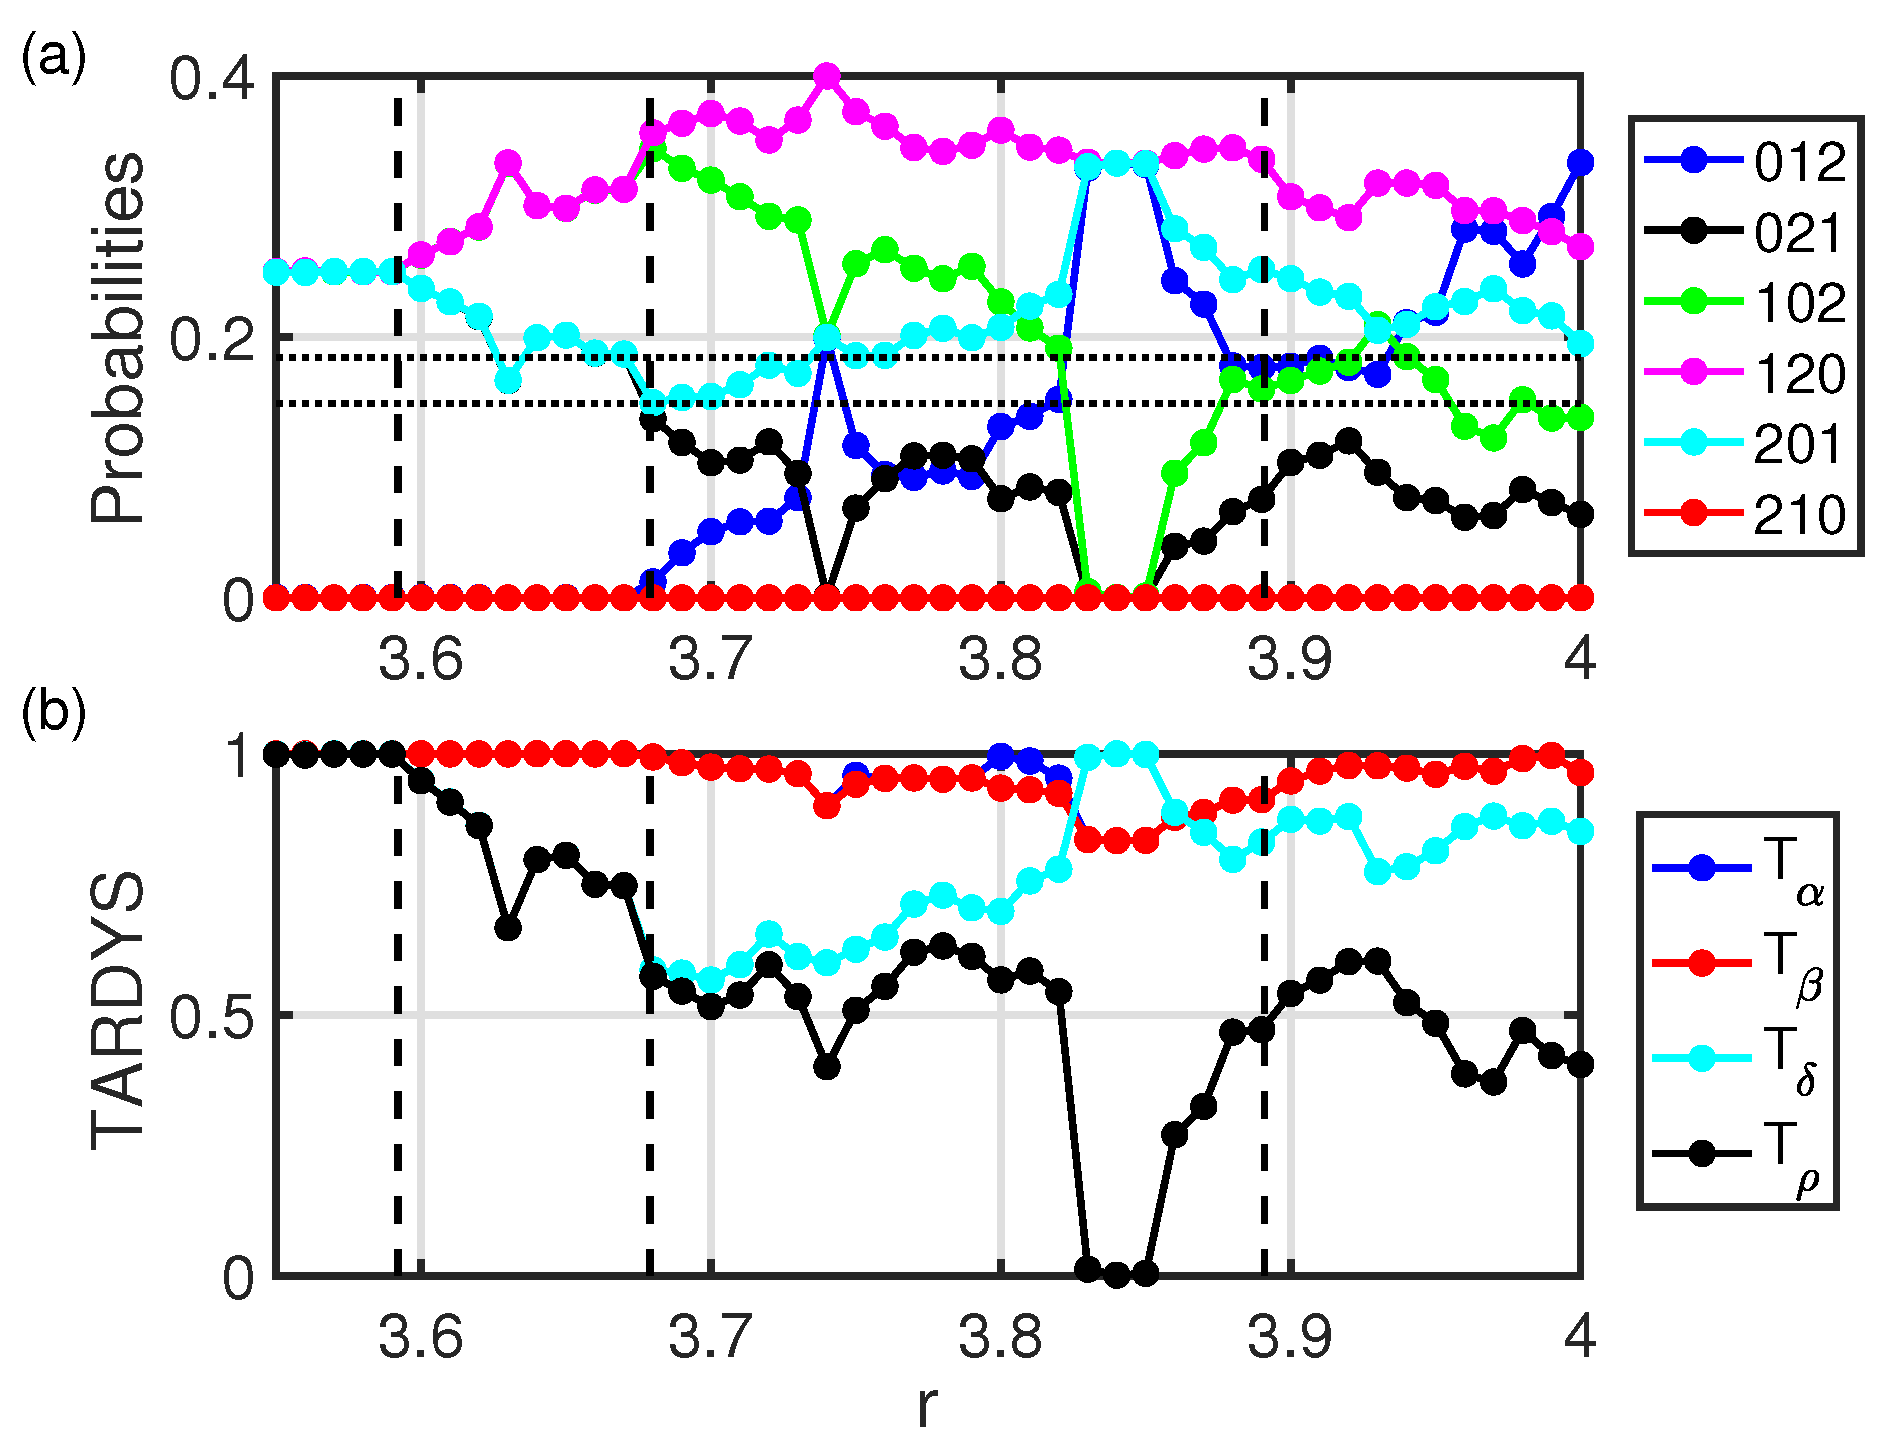
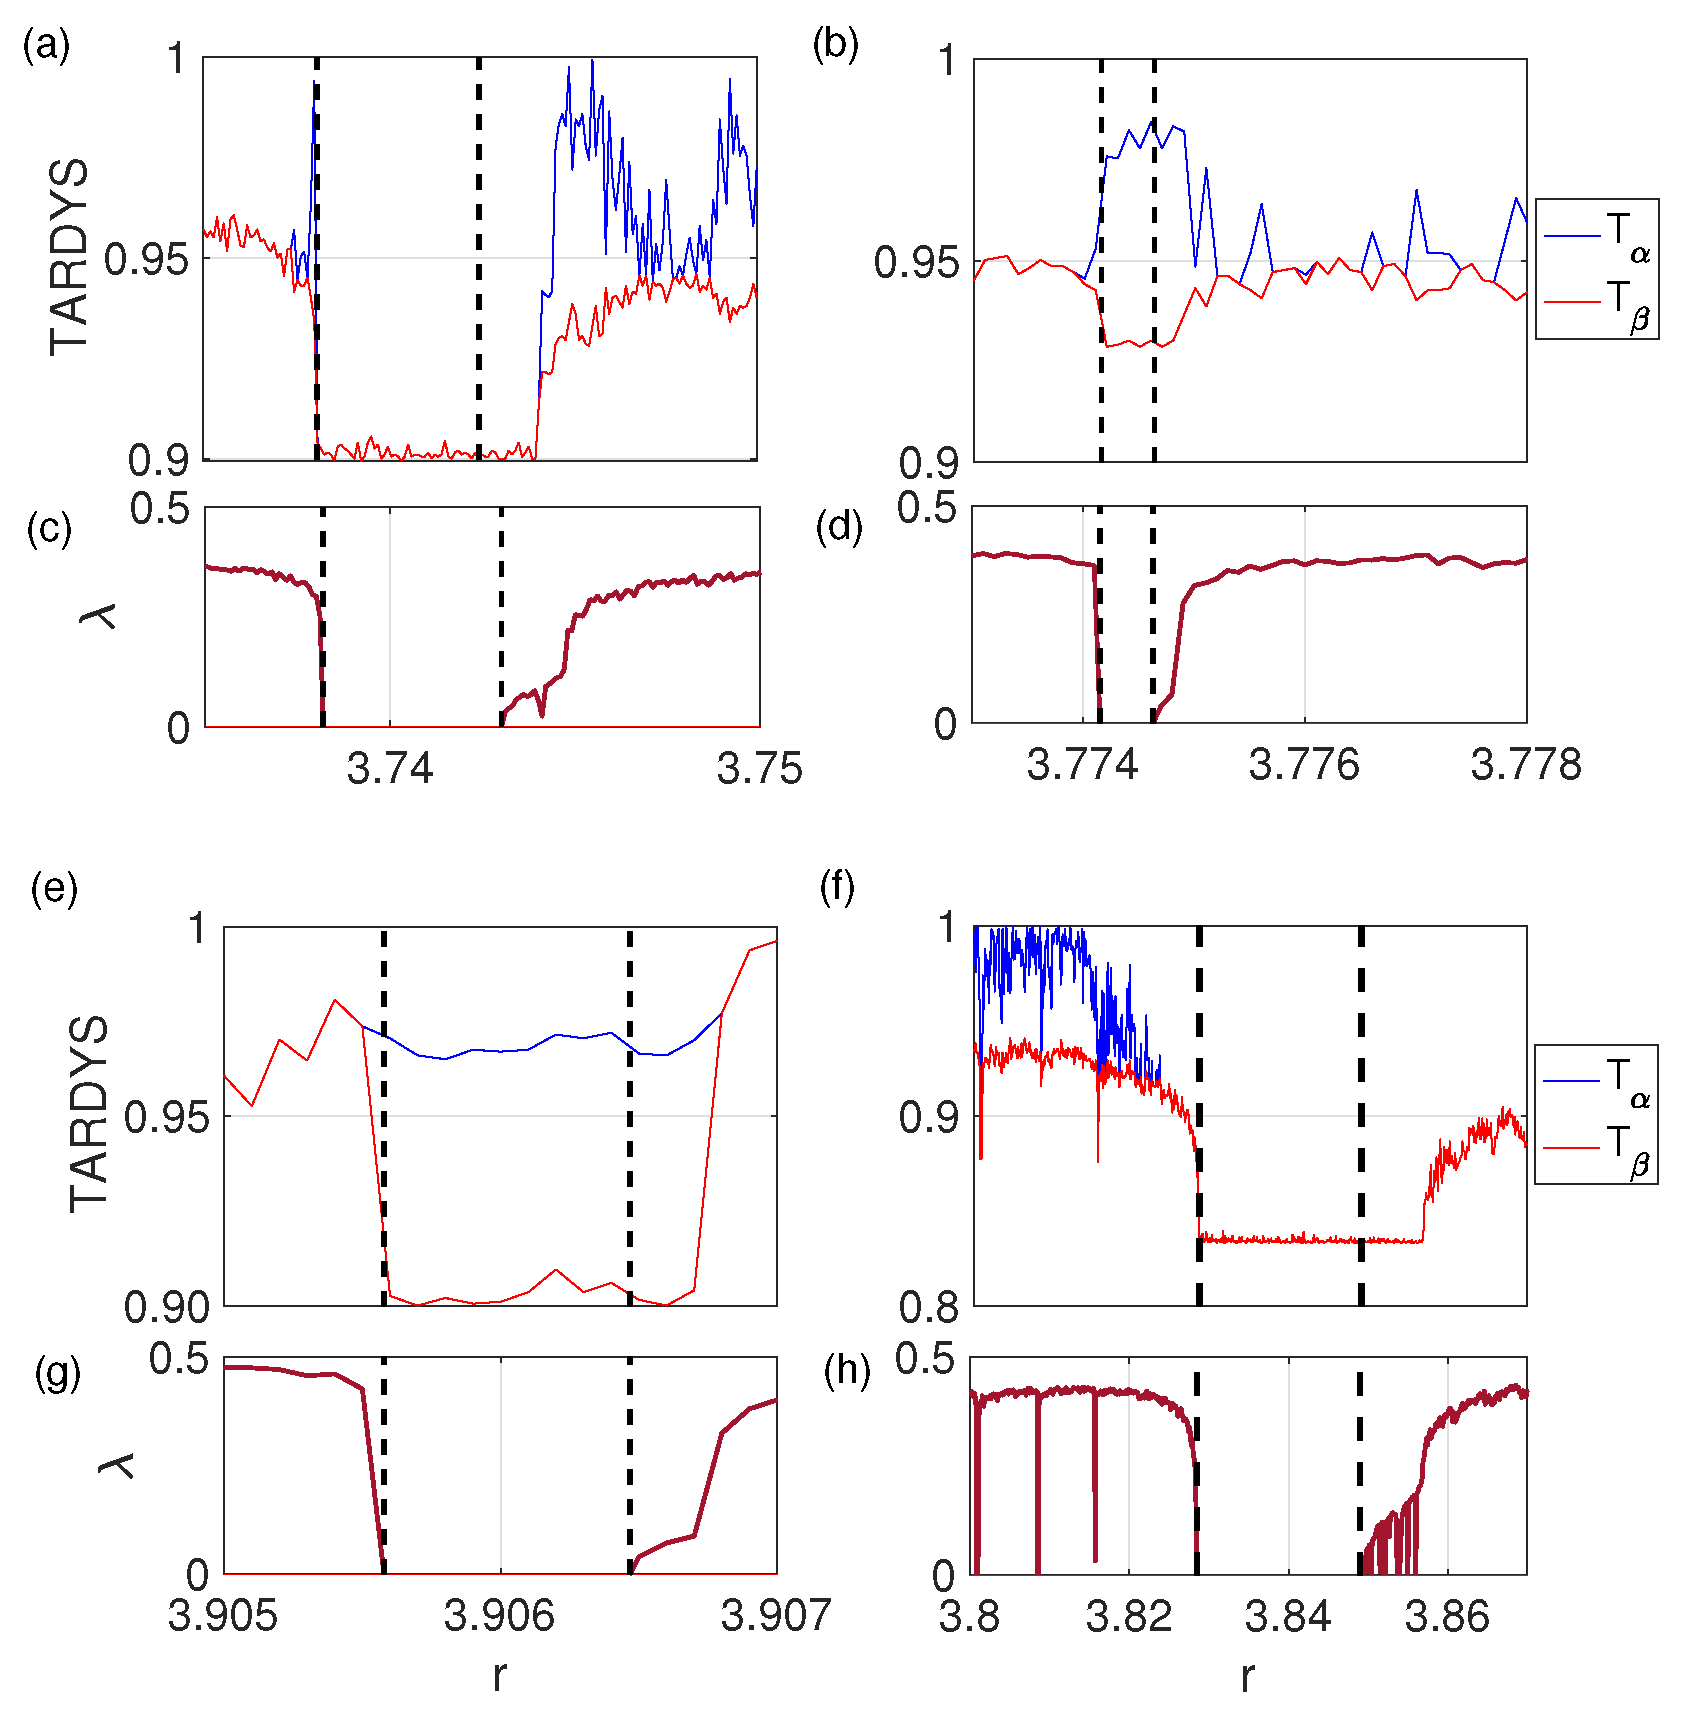
Figure 4 shows (a) the word population probabilities for the logistic map and (b) the four TARDYS quantifiers. The figure also indicates the four dynamical regions of the logistic map with vertical dashed lines. Remarkably, the TARDYS detect the transitions from one kind of chaotic dynamics to another. In particular, as expected from the constraints, all symmetries are fully satisfied in region I, despite it being a chaotic region. At the transition between regions I and II,
and
start to deviate from unity, although they maintain
.
and
are still fully satisfied in region II. The transition between regions II and III is captured by the decrease of symmetries
and
.
An important insight here is that the symmetries
and
are the same for all parameters except at the onset of regularity. Right before and/or after the windows of periodicity of the logistic map, the broken symmetry is visible in that
is non-zero. This transition in the approximate symmetry may thus potentially serve as a precursor signal of chaos-to-regular transitions.
Figure 5 shows the detail of four transitions to regularity anticipated by
. Although this phenomenon has been observed in most of the chaos–regularity transitions we have examined, it does not do so always. In particular,
does not anticipate the exit from regularity back into chaos at
(
Figure 5f). This power of forecasting through
has also been found in other non-invertible iterative maps such as the sine map or Ricker’s map (see
Appendix A).
7. TARDYS Versus Permutation Entropy
It has been previously shown that combining two complexity quantifiers can reveal more information of a complex dynamical system than just one quantifier alone. For example, Vignat and Bercher [
23] combined the use of Shannon entropy with the Fisher Information Measure (FIM) to extract detailed information about the complex dynamics invisible to either metric. Acero-Blyshak et al. (work in preparation [
24]) have shown that different combinations of words of dimension
extract hidden approximate symmetries in different iterative maps. These approximate symmetries, when parametrically plotted against the PE as a function of a control parameter, show transitions between dynamical regimes and otherwise hidden dynamical families defined by approximate symmetries and their changes. In [
22,
25], the authors used a combination of Permutation Entropy (PE) and Fisher Information Measure computed with words. The 2D landscape created as these are plotted versus a control parameter showed patterns allowing the classification of different kinds of chaos present in dynamical systems.
Inspired by these, and to test how our new metrics might provide more insight into characterizing chaos, we consider the parameteric variation of TARDYS quantifiers with PE.
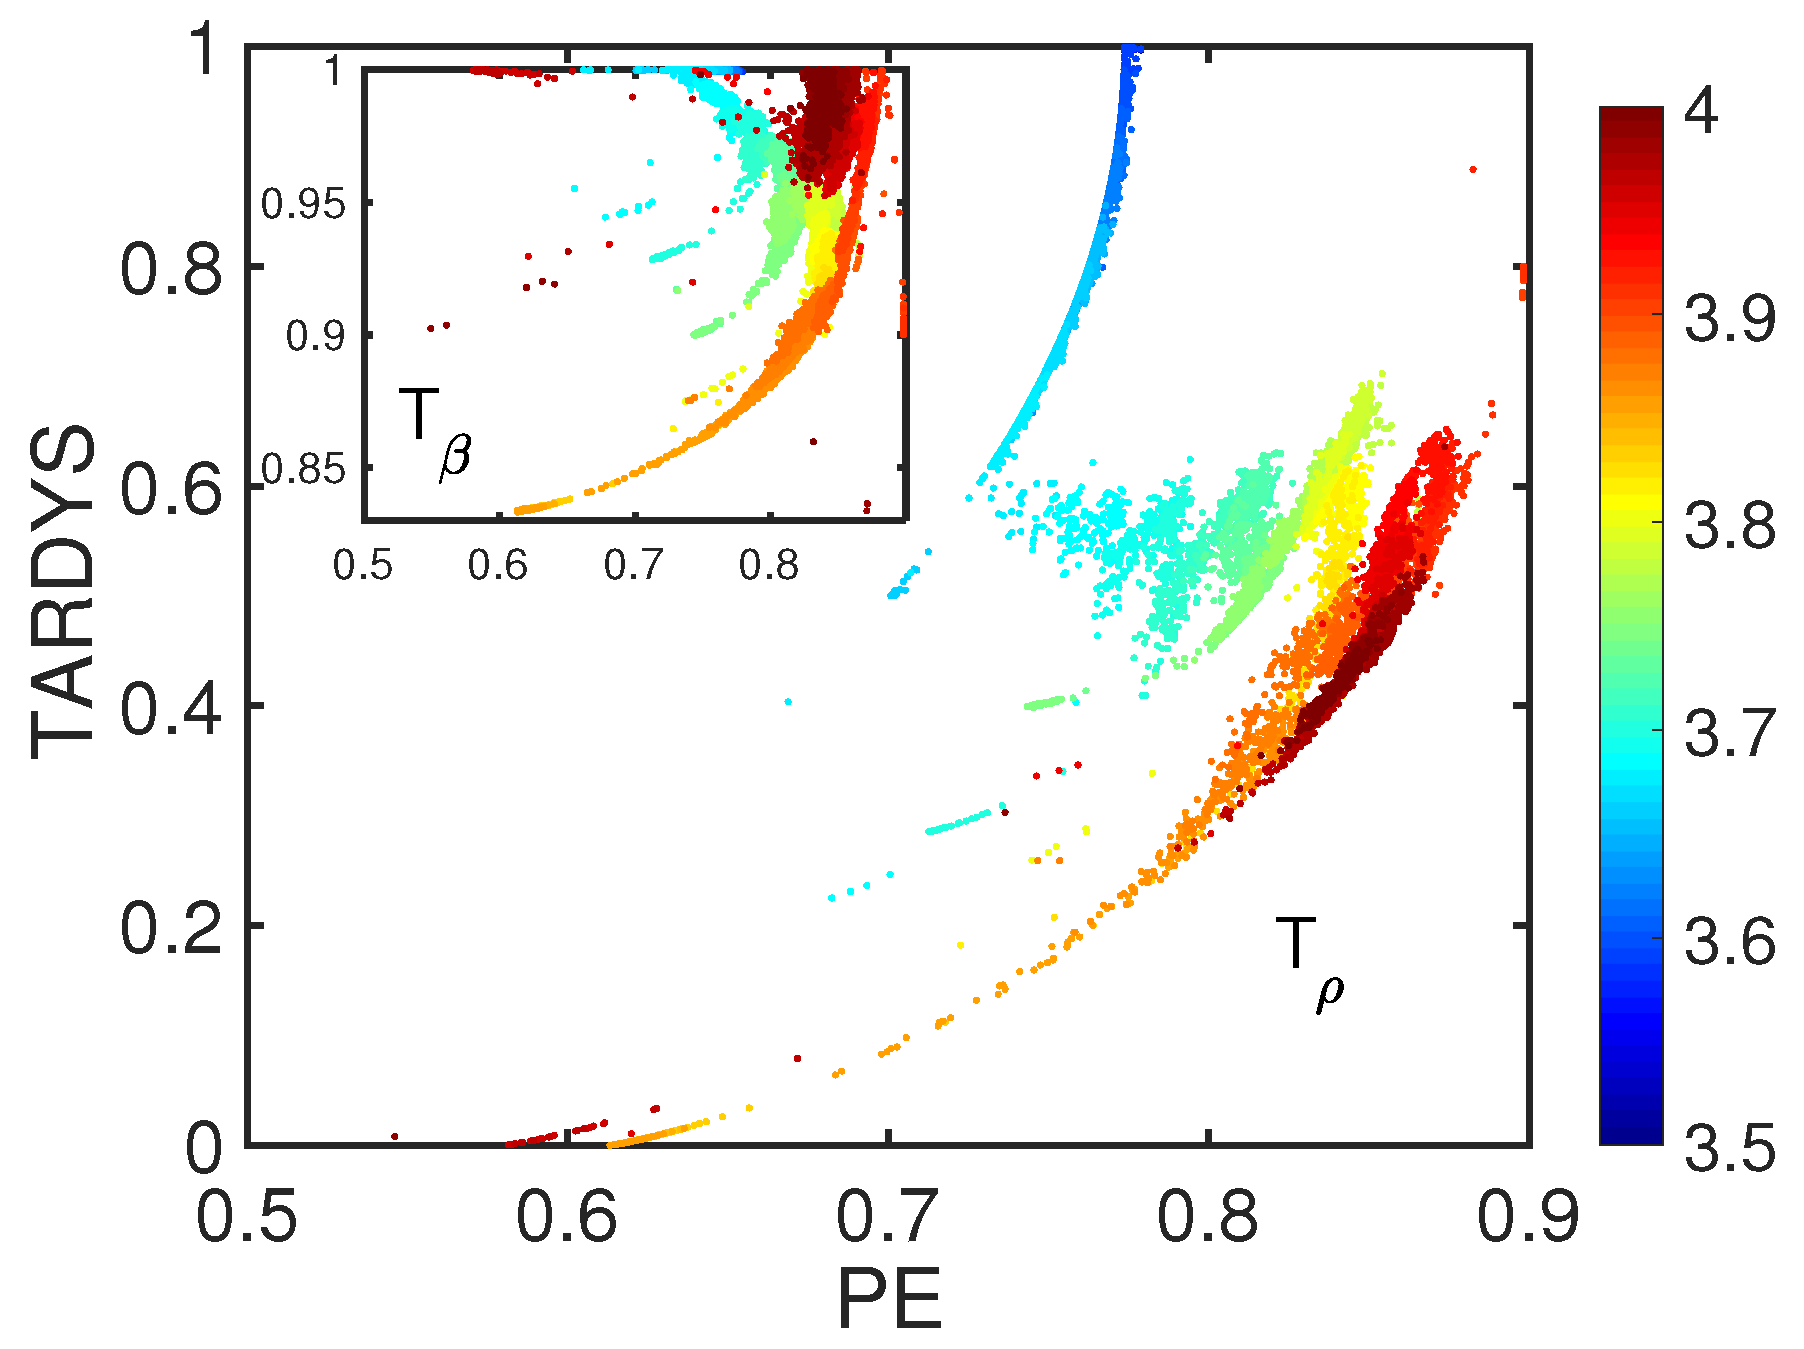
Figure 6 shows reversibility
(and
as well, but on a smaller scale) plotted versus PE. This TARDYS-PE plane shows the evolution of the logistic map as
r is varied, going from more-structured to less-structured dynamics as it moves in the 2D plane. The system starts with high reversibility and intermediate PE. As
r increases, reversibility decreases significantly, while PE does so only slightly. Then, the system stays as an almost constant reversibility, although with some oscillations, while PE increases considerably. The long arms escaping to the bottom-left are especially interesting, as they move to lower entropy but also lower reversibility. These indicate the routes to regularity and back, and, in particular, the transitions between different regions indicate different kinds of chaos, even when characteristics such as Lyapunov exponents and PE do not change much. This trend is repeated for every window of periodicity and has been found in other chaotic maps (see
Appendix A).
The clear similarity between TARDYS-PE 2D landscapes and those for FIM-PE found in
Figure 3 of [
22] show that these approximate symmetry quantifiers extracted from experimental observations constitute just as powerful a technique to classify and distinguish different kinds of chaos and regularity. More intriguingly, it also indicates that properties extracted by the Fisher Information Measure (a local gradient quantifier) are somehow related to those extracted by the approximate symmetry
.
This analysis shows that using approximate dynamical symmetries is a powerful tool to characterize chaos and classify it into different dynamical families. In this particular case, TARDYS symmetries capture the complex dynamics of the logistic (and other non-invertible) map(s), but other symmetries could be more relevant for other chaotic systems.
8. Conclusions
In this work, we have explored the approximate dynamical symmetries of a photonic neuron to characterize its dynamics. Based on those symmetries, we have introduced TARDYS quantifiers as a set of measures of global temporal symmetries. The TARDYS, although based on the dynamics of a photonic neuron, can be extrapolated to other complex systems: they are informative in other photonic systems as well as in theoretical iterative maps such as the logistic and others, where they are able to provide signals of transitions from chaos to periodicity. When combined with Permutation Entropy, TARDYS quantifiers serve as a good way to visually classify different families of complex dynamics on a 2D landscape, similar to what can be found by combining PE with the Fisher Information Measure.
Being able to anticipate transitions of dynamics or extreme events is a critical challenge: from earthquakes or heat waves, to epilepsy, or extinction events, nature presents many systems that display sudden extreme events or transitions of dynamical regimes. One approach to anticipate transitions uses the Lyapunov exponent
as an early warning signal [
26,
27]. Regrettably, in addition to this not always being conclusive, it requires a reconstruction of phase space, which imposes, on the one hand, a hard computational problem in propagating the differential equations, and on the other hand, an enormous challenge for experimental data (which is most of the time inaccessible). TARDYS
are simple to compute, well-adapted to experimental data, including being robust against noise, and have been seen to provide information about approximate dynamics symmetries that precede certain dynamical transitions. We note that this work has focused on approximate symmetries computed with words of dimension
. Higher dimensions could target other, more detailed, symmetries.
Thus, we foresee TARDYS as a powerful tool in predicting relevant transitions in complex dynamical systems, through the loss of symmetry, and to distinguish and characterize different types of chaos, through TARDYS quantifiers, but also through their combination with other complexity measures such as permutation entropy.
Author Contributions
Conceptualization, A.A.; Data curation, N.V.N.; Formal analysis, N.V.N. and A.A.; Funding acquisition, A.A.; Investigation, N.V.N. and A.A.; Methodology, N.V.N. and A.A.; Project administration, A.A.; Software, N.V.N.; Supervision, A.K.P. and A.A.; Validation, A.A.; Writing—original draft, A.A.; Writing—review and editing, N.V.N., A.K.P. and A.A. All authors have read and agreed to the published version of the manuscript.
Funding
Nhat V. Nguyen gratefully acknowledges financial support from Eastern Washington University via internal funds.
Data Availability Statement
The data presented in this study is available on request from the corresponding author.
Conflicts of Interest
The authors declare no conflict of interest.
Appendix A. Minimal Model to Describe the Photonic Neuron
In 2014, it was found that the photonic neuron could be simulated with a simple mathematical model: the iterative circle map modified with a second harmonic term [
12]. This minimal model mimicked the statistics of the inter-spike intervals. To test the validity of this model at the level of description of the approximate symmetries introduced here, we compute the TARDYS quantifiers for the modified circle map, described by:
where
indicates the
i-th spike,
is proportional to the ratio between the period of the forcing and the natural period of the oscillator,
K is proportional to the forcing amplitude,
represents the strength of a second harmonic component parameter, and
represents the strength of stochastic fluctuations,
.
Figure A1 shows the word probabilities and the TARDYS quantifiers using Equation (
A1). It indicates good qualitative agreement between the simulations and the experimental data from
Figure 2.
Figure A1.
(a) Word probabilities of the circle map model as a function of K. , , . (b) TARDYS quantifiers.
Figure A1.
(a) Word probabilities of the circle map model as a function of K. , , . (b) TARDYS quantifiers.
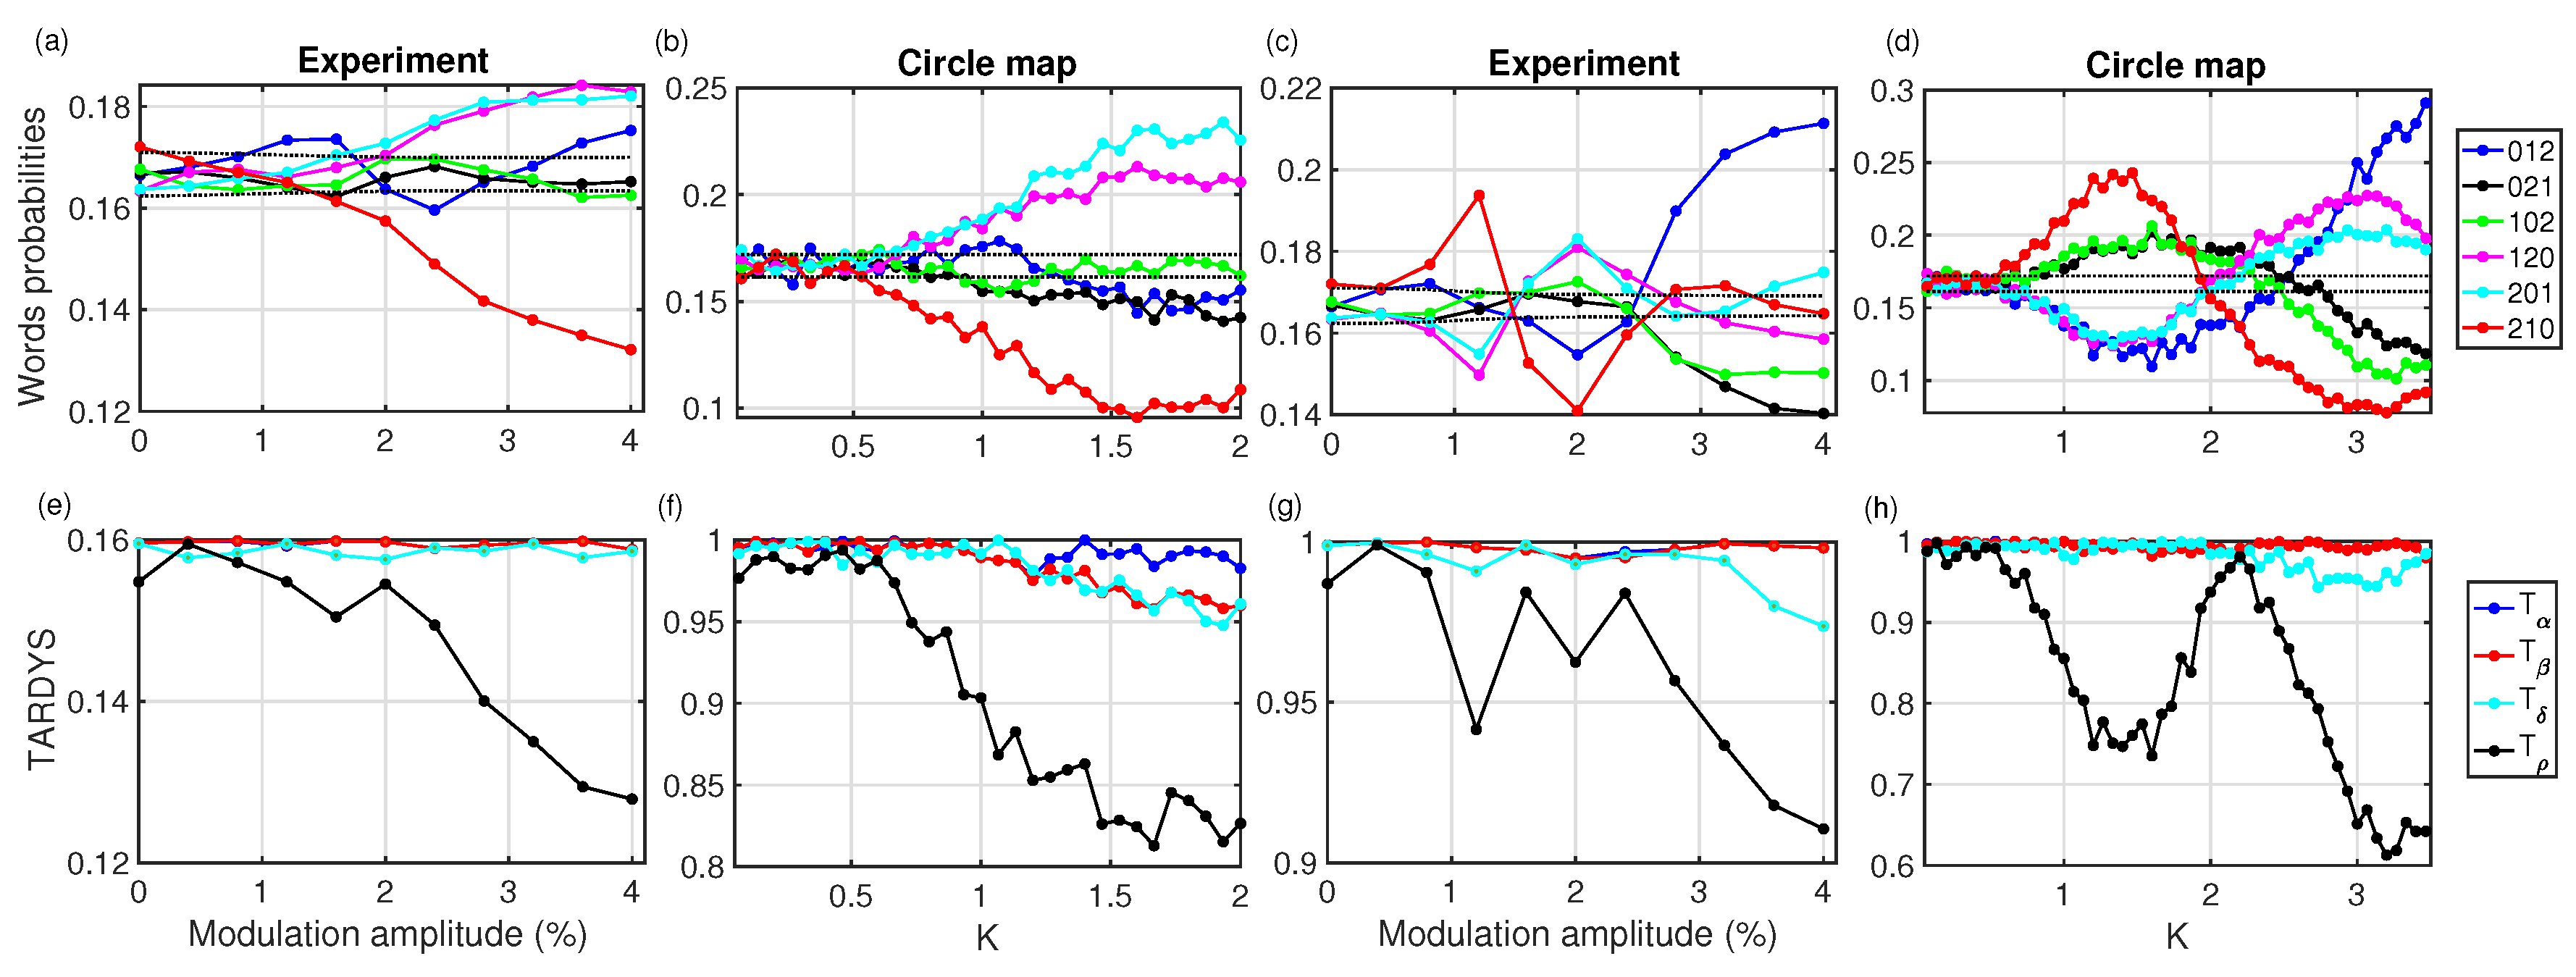
We perform experiments for different modulation frequencies (9 MHz <
f < 25 MHz), and we compute simulations with the modified-circle-map model to test its validity across parameters.
Figure A2 shows the word probabilities and the TARDYS for two additional frequencies as well as two different sets of simulation parameters. We can observe that this minimal model is a good proxy to replicate the dynamics of the photonic neuron and is also to capture the hidden symmetries in its dynamics.
Figure A2.
Experiments with photonic neurons for MHz (a,e) and MHz (c,g); and simulations using the circle-map model (b,d,f,h).
Figure A2.
Experiments with photonic neurons for MHz (a,e) and MHz (c,g); and simulations using the circle-map model (b,d,f,h).
It is worth pointing that, despite the range of frequencies and the different kinds of dynamics revealed by the word probabilities, the photonic neuron maintains internal dynamical symmetries, with . Reversibility computed with is sensitive to changes in the determinism of the dynamics.
Appendix B. Forecasting Power in Other Chaotic Maps
The behavior
, which allows forecasting of sharp transitions of dynamics, found for the logistic map is also found in other chaotic maps.
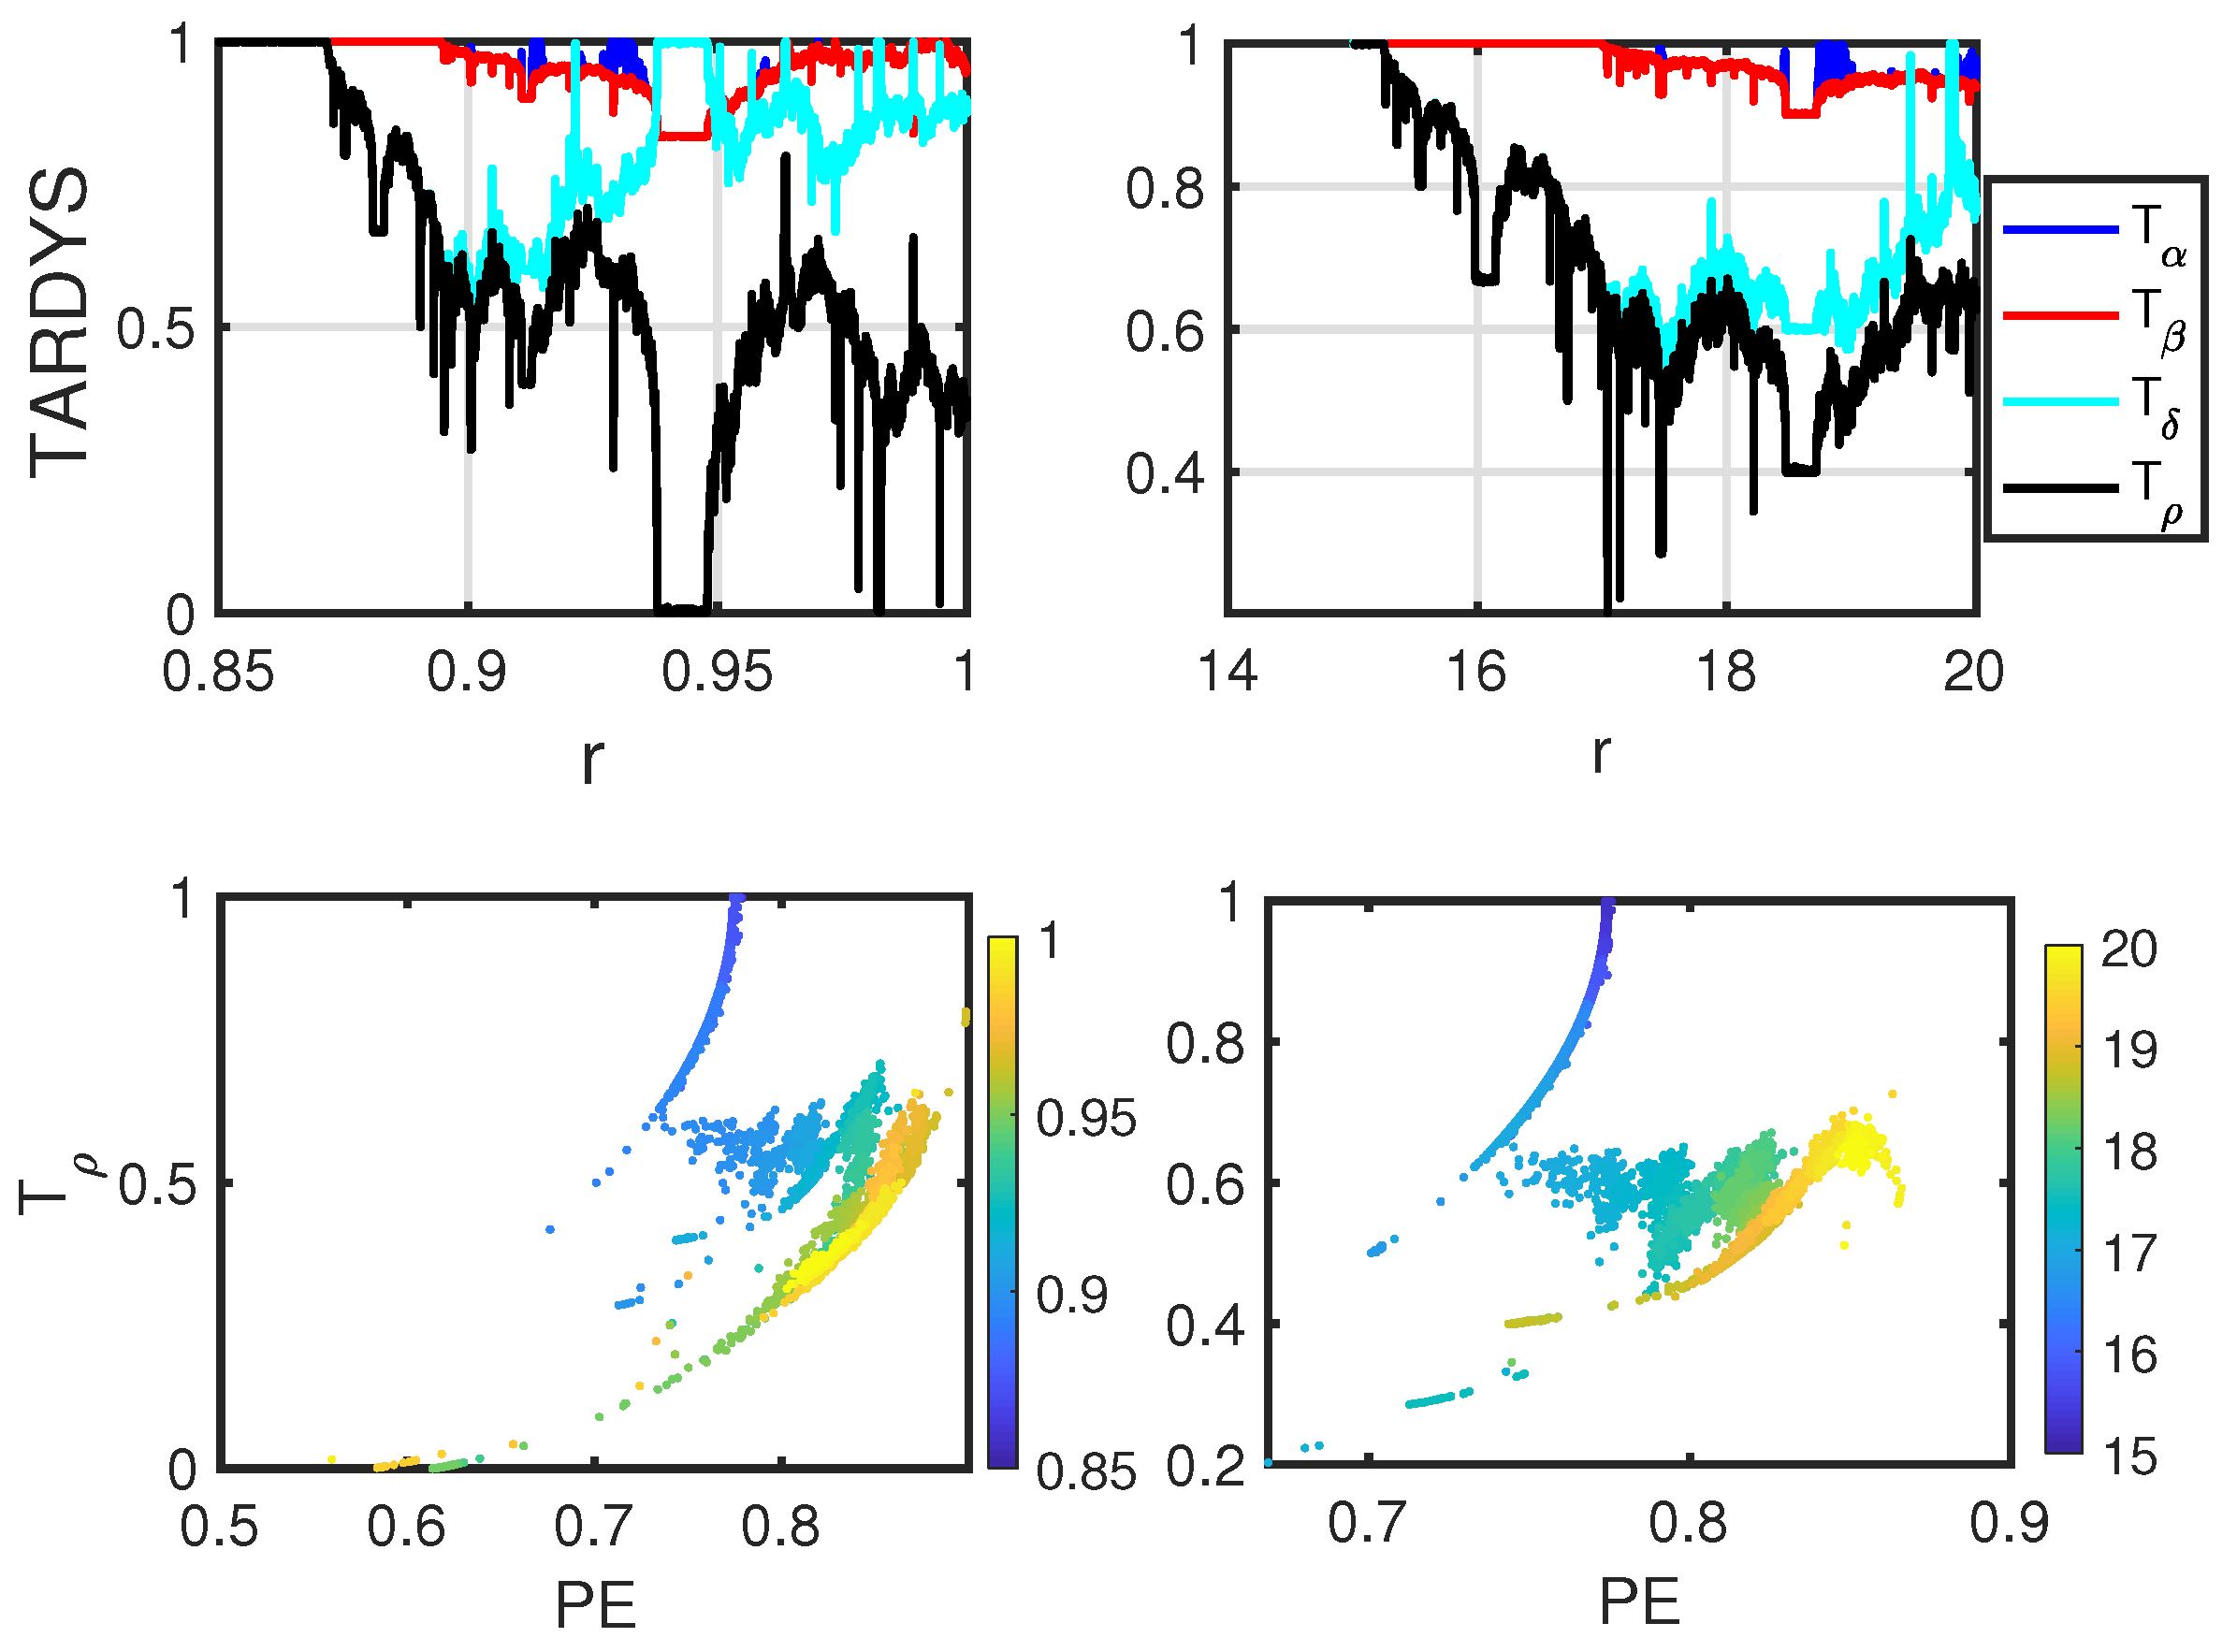
Figure A3 shows all four TARDYS quantifiers for the sine map (
) and Ricker’s map (
).
Figure A3 also shows the combination
vs.
, which presents the same 2D structure as found for the logistic map. This displays clear differences in the dynamics of the chaotic maps depending on the control parameter and is in agreement with the results found in [
25] for non-invertible maps.
Figure A3.
TARDYS quantifiers and versus PE for the sine map and Ricker’s population model.
Figure A3.
TARDYS quantifiers and versus PE for the sine map and Ricker’s population model.
References
- Bandt, C.; Pompe, B. Permutation Entropy: A Natural Complexity Measure for Time Series. Phys. Rev. Lett. 2002, 88, 174102. [Google Scholar] [CrossRef] [PubMed]
- Leyva, I.; Martínez, J.H.; Masoller, C.; Rosso, O.A.; Zanin, M. 20 years of ordinal patterns: Perspectives and challenges. EPL 2022, 138, 31001. [Google Scholar] [CrossRef]
- Bandt, C. A New Kind of Permutation Entropy Used to Classify Sleep Stages from Invisible EEG Microstructure. Entropy 2017, 19, 197. [Google Scholar] [CrossRef]
- Bandt, C. Small Order Patterns in Big Time Series: A Practical Guide. Entropy 2019, 21, 613. [Google Scholar] [CrossRef] [PubMed]
- Colet, M.; Aragoneses, A. Forecasting Events in the Complex Dynamics of a Semiconductor Laser with Optical Feedback. Sci. Rep. 2018, 8, 10741. [Google Scholar] [CrossRef]
- Aragoneses, A.; Ding, Y. Correlations preceding high-intensity events in the chaotic dynamics of a Raman fiber laser. Entropy 2019, 21, 151. [Google Scholar] [CrossRef]
- Gunther, I.; Pattanayak, A.; Aragoneses, A. Ordinal Patterns in the Duffing Oscillator: Analyzing Powers of Characterization. Entropy 2021, 31, 023104. [Google Scholar] [CrossRef]
- Quintero-Quiroz, C.; Sorrentino, T.; Aragoneses, A.; Torrent, M.C.; Masoller, C. Are the Spikes Emitted by a Semiconductor Laser with Feedback Similar to Neuronal Spikes? In Proceedings of the 19th International Conference on Transparent Optical Networks (ICTON), Girona, Spain, 2–7 July 2017; pp. 1–4. [Google Scholar]
- Chizhevsky, V.N.; Kulchitsky, V.A.; Kilin, S.Y. Artificial spiking neuron based on a single-photon avalanche diode and a microcavity laser. Appl. Phys. Lett. 2021, 119, 041107. [Google Scholar] [CrossRef]
- Bueno, J.; Brunner, D.; Soriano, M.C.; Fischer, I. Conditions for reservoir computing performance using semiconductor lasers with delayed optical feedback. Opt. Publ. Group 2017, 25, 2401–2412. [Google Scholar] [CrossRef]
- Eguia, M.C.; Mindlin, G.B. Semiconductor laser with optical feedback: From excitable to deterministic low-frequency fluctuations. Phys. Rev. Lett. E 1999, 60, 1551–1557. [Google Scholar] [CrossRef]
- Aragoneses, A.; Perrone, S.; Sorrentino, T.; Torrent, M.C.; Masoller, C. Unveiling the complex organization of recurrent patterns in spiking dynamical systems. Sci. Rep. 2014, 4, 4696. [Google Scholar] [CrossRef] [PubMed]
- Soriano, M.C.; García-Ojalvo, J.; Miraso, C.R.; Fisher, I. Complex photonics: Dynamics and applications of delay-coupled semiconductors lasers. Rev. Mod. Phys. 2013, 85, 421. [Google Scholar] [CrossRef]
- Feldmann, J.; Youngblood, N.; Wright, C.D.; Bhaskaran, H.; Pernice, W.H.P. All-optical spiking neurosynaptic networks with self-learning capabilities. Nature 2019, 569, 208–214. [Google Scholar] [CrossRef] [PubMed]
- Robertson, J.; Kirkland, P.; Alanis, J.A.; Hejda1, M.; Bueno, J.; Caterina, G.D.; Hurtado, A. Ultrafast neuromorphic photonic image processing with aVCSEL neuron. Sci. Rep. 2022, 12, 4874. [Google Scholar] [CrossRef]
- Shastri, B.J.; Tait, A.N.; de Lima, T.F.; Pernice, W.H.P.; Bhaskaran, H.; Wright, C.D.; Prucnal, P.R. Photonics for artificial intelligence and neuromorphic computing. Nat. Photonics 2021, 15, 102–114. [Google Scholar] [CrossRef]
- Marino, F.; Giacomelli, G. Pseudo-spatial coherence resonance in an excitable laser with long delayed feedback. Chaos 2017, 27, 114302. [Google Scholar] [CrossRef]
- Tiana-Alsina, J.; Quintero-Quiroz, C.; Masoller, C. Comparing the dynamics of periodically forced lasers and neurons. New J. Phys. 2019, 21, 103039. [Google Scholar] [CrossRef]
- Aragoneses, A.; Sorrentino, T.; Sandro, P.; Torrent, M.C.; Masoller, C. Experimental and numerical study of the symbolic dynamics of a modulated external-cavity semiconductor laser. Opt. Express 2014, 22, 4705–4713. [Google Scholar] [CrossRef]
- Turitsyna, E.G.; Smirnov, S.V.; Sugavanam, S.; Tarasov, N.; Shu, X.; Babin, S.A.; Podivilov, E.V.; Churkin, D.V.; Falkovich, G.E.; Turitsyn, S.K. The laminar–turbulent transition in a fibre laser. Nat. Photonics 2013, 7, 783. [Google Scholar] [CrossRef]
- Carpi, L.; Masoller, C. Persistence and stochastic periodicity in the intensity dynamics of a fiber laser during the transition to optical turbulence. Phys. Rev. A 2018, 97, 023842. [Google Scholar] [CrossRef]
- Spichak, D.; Aragoneses, A. Exploiting the impact of ordering patterns in the Fisher-Shannon complexity plane. Chaos Solitons Fractals 2022, 154, 111620. [Google Scholar] [CrossRef]
- Vignat, C.; Bercher, J.F. Analysis of signals in the Fisher–Shannon information plane. Phys. Lett. A 2003, 312, 27–33. [Google Scholar] [CrossRef]
- Acero-Blyshak, M.; Lyons, S.; Aragoneses, A.; Pattanayak, A.K. Approximate Symmetries and Families of Chaos.
- Spichak, D.; Kupetsky, A.; Aragoneses, A. Characterizing complexity of non-invertible chaotic maps in the Shannon–Fisher information plane with ordinal patterns. Chaos Solitons Fractals 2021, 142, 110492. [Google Scholar] [CrossRef]
- Guégan, D.; Leroux, J. Forecasting chaotic systems: The role of local Lyapunov exponents. Chaos Solitons Fractals 2009, 41, 2401–2404. [Google Scholar] [CrossRef]
- Zheng, L.; Liu, Z.; Shen, J.; Wu, C. Very short-term maximum Lyapunov exponent forecasting tool for distributed photovoltaic output. Appl. Energy 2018, 229, 1128–1139. [Google Scholar] [CrossRef]
| Publisher’s Note: MDPI stays neutral with regard to jurisdictional claims in published maps and institutional affiliations. |
© 2022 by the authors. Licensee MDPI, Basel, Switzerland. This article is an open access article distributed under the terms and conditions of the Creative Commons Attribution (CC BY) license (https://creativecommons.org/licenses/by/4.0/).


