Article

Modelling of Plasma Temperatures and Densities in Laser Ablation Plumes of Different Metals

York Plasma Institute, School of Physics, Engineering & Technology, University of York, York YO10 5DD, UK
*
Author to whom correspondence should be addressed.
Photonics 2022, 9(12), 937; https://doi.org/10.3390/photonics9120937
Submission received: 4 November 2022 / Revised: 28 November 2022 / Accepted: 1 December 2022 / Published: 4 December 2022
(This article belongs to the Special Issue Laser Ablation: From Fundamental Science to Applications)

Abstract

:
Laser ablation has many uses in industry, including laser drilling and thin-film deposition. However, the underpinning physics of laser ablation has not been fully elucidated. In particular, the differences in the behaviour of plasma plumes ablated from different materials, and which material properties are related to plume characteristics, require further study. This paper presents results from modelling the laser ablation of different photocatalytic materials using the 2D hydrodynamic laser ablation code POLLUX. The evolution of key parameters such as plasma density and temperature is investigated when the target material is changed from titanium to tantalum, zinc, copper, aluminium and gold. It was found that the atomic number of the material significantly affected the electron temperature and mass density of the subsequent plasma plume, with both parameters increasing with atomic number, whilst other parameters including the mass density, thermal conductivity and melting temperature did not affect the electron temperature or particle density of the plumes. These results provide insights for future laser ablation experiments where the aim is to change the target material, but keep the plume parameters as constant as possible.

1. Introduction

Laser ablation is a well-established technique seen in an ever-rising number of material processing applications. These include, but are not limited to, ablation of a solid material to create nanoparticles [1], removal of living human tissue during surgery [2], analytical chemistry techniques [3,4], and the deposition of functional thin films with the laser-ablated plasma plume [5]. Laser ablation is the process that occurs when surface material is removed using a high-power laser. In nanosecond pulsed laser ablation, a high-power, pulsed laser beam is focused onto a solid target, drastically raising the temperature of the material on the irradiated surface. This material vaporises then ionises into a plasma plume which expands and cools over time after the laser pulse finishes [6].
Despite its many industrial uses, some of the underpinning physics of the laser ablation process is still only poorly understood. Several studies have investigated the importance of laser absorption and plasma heating phenomena, such as photoionisation and inverse bremsstrahlung on the ablation behaviour [7,8,9]. Moreover, there has been a plenitude of literature published on the laser ablation of specific materials and laser conditions, such as modelling the laser ablation of a copper target in atmospheric argon gas [10], investigating the laser ablation of silicon for different pulse durations both theoretically and experimentally [11], and measuring the ablation depth of silver foil with femtosecond laser pulses [12]. The general concepts of nanosecond pulsed laser ablation have been well-established and there are detailed studies into specific conditions (such as the laser interaction with the target), where there is a decent match between experiments and modelling. However, there is far less work on how different material properties affect the properties of the plasma plume. In particular, an understanding of what material properties are linked to specific plume properties is largely missing. This is an issue, since in many applications, e.g., thin film deposition, the target material is often changed to create films with different functional properties but similar film characteristics such as thickness. Because of this, a change of material requires an empirical re-optimisation of the laser conditions.
One of the few examples that does look into the differences in plume properties for different materials is work from M.S. Qaisar and G.J. Pert [13], in which they used the numerical modelling software POLLUX to investigate the ablation of magnesium, copper and lead plasma plumes using lasers of different wavelength and compared the results with experimental data. They concluded that the surface temperature of each plume increased rapidly over the duration of the ablation process, with lead having the largest surface temperature values of the three, suggesting this was due to lead’s low thermal conductivity relative to copper and magnesium. They also concluded that materials with smaller atomic mass produced plume particles with larger axial velocities and expanded at the most rapid rate.
Since changing the target material will change several material properties at the same time, e.g., density, atomic number, and melting temperature, it is difficult to experimentally identify a clear link between individual material and plasma properties. Modelling is much better suited for such an investigation since it gives full control over material properties and is not limited to materials that actually exist. In other words, individual properties of materials can be changed, creating non-existing materials to directly establish a clear link between that property and the plasma plume. We intend to directly establish a direct relationship between individual material properties and plume properties. Once this knowledge is established for several parameters, it can be combined to provide a prediction of what real materials, with a range of different parameters, will look like. This is the topic of our work presented here.
Here we present modelling results of the nanosecond laser ablation of six different metal targets simulated using the hydrodynamic code POLLUX, focusing on identifying links between material properties and specific plasma plume characteristics. The material properties studied include the atomic number (and through this, the atomic mass), mass density, thermal conductivity and melting temperature, which were tested individually for their influence on parameters of the plume. The plume parameters which may be affected by the material properties include electron temperature, particle density and particle velocity. In regards to the choice of materials in this work, only metals were chosen because the code models the absorption of laser energy by the target via inverse bremsstrahlung (see Section 2). Titanium was chosen as a model target as it has shown to be a promising candidate for metal oxide and oxynitride thin films applied to photoelectrochemical processes for a hydrogen economy, with tantalum being a promising alternative [14]. Aluminium and gold were chosen as they are well studied materials with a low and high atomic number respectively. Finally, copper and zinc are of interest for applications of metal oxide thin films for transistors and solar cells [15,16,17,18,19].

2. Methodology

POLLUX is a 2D hydrodynamic code developed by G.J. Pert et al. [20,21,22,23] to model pulsed nanosecond laser ablation and the evolution of a plasma plume as it expands and travels over time. In addition to the work by Qaisar et al., mentioned before [13], POLLUX has been used for the study of laser ablation of copper [5] and silicon targets [24]. Laser interaction with the material target and laser interaction with the subsequent plasma plume are both included in POLLUX. A summary of the algorithm of the code in its latest version can be seen in Figure 1.
To model mass transport, POLLUX solves the three first-order differential equations of hydrodynamic flow by applying the flux corrected transport algorithm by J.P. Boris and D.L. Book [25]. Calculations assume azimuthal (cylindrical) symmetry around the z-axis with the target and region above the target surface represented by a 2-D ( z , r ) Eulerian mesh, where z defines the axis along the target surface normal, and r defines the radial coordinate orthogonal to z. POLLUX models the laser pulse as a Gaussian spatial and temporal profile. It simulates laser-target interactions, including the phase changes of the target during the laser ablation, using two models: nuclear and thermodynamic terms are modelled by the Chart-D equation of state (EoS) developed at Sandia National Laboratories [26], whereas electronic terms, including ionisation within the plume, are handled by the Thomas-Fermi model [27]. Finally, energy transport is handled using the Incomplete Cholesky-Conjugate Gradient (ICCG) method [28].
The method the POLLUX code uses to calculate inverse bremsstrahlung is outlined by G.J. Pert in [23]. The inverse bremsstrahlung coefficient, μ , is given by:
μ = b ρ 2 t 3 / 2 ,
where ρ is the mass density of the element or material, t is the temperature of the plasma plume, and b is an additional parameter dependent on other laser and material parameters:
b = ( 3 × 10 36 ) α Z i A 3 / 2 α Z i 3 A λ 2 ln Λ ,
where λ is the laser wavelength, Z i and A are the ion charge and mass numbers respectively, α = 1 + T i / Z i T e is the equilibration factor, and ln Λ denotes the Coulomb logarithm for transport as defined in [29,30].
In all simulations in this work, the pulse duration, laser fluence and focal spot diameter were kept constant at 16 ns, 100.5 J cm 2 and 100 μ m respectively.
For computational reasons, the background in which the plasma plume expands cannot be a true vacuum. POLLUX uses a background particle density of 10 7 of the solid density of the target material. The atomic mass of the background particles is assumed the same as the target to allow hydrodynamic effects, but otherwise the background is inert and cannot be ionised by the plasma plume. The effective background pressure is 22–35 Pa at room temperature, depending on the target material. The model assumes local-thermal equilibrium in the expanding plasma plume, which is a reasonable assumption for short timescales and expansion into a background gas [31,32].
As mentioned above, POLLUX models the nuclear and thermodynamic terms of the EoS of a material using the Chart-D EoS from Sandia National Labs. The Chart-D EoS requires a set of input parameters as shown in Table 1 for the elements investigated in this work. The parameters for Al, Au, Zn and Cu are taken from the original Chart-D database. For Ta and Ti, the parameters are found in literature.

3. Results & Discussion

3.1. Laser Ablation of Titanium

As a reference point, we used POLLUX to model the laser ablation of titanium plasma plumes. Figure 2 contains an example of a contour plot of the distribution of the electron temperature, T e , of a titanium plasma plume, modelled 5 ns after the laser pulse. In this work, time t = 0 is defined as the time at the end of the laser pulse. The vertical and horizontal axes in each plot are z, the distance normal to the target surface (axial distance), and r, the radial distance, respectively. In Figure 2, the plume has expanded approximately 800 μ m from the target surface and in the radial direction the plume has expanded to 600 μ m (the laser focus had a radius of 100 μ m). Temperatures in the plasma plume reach up to 6 eV in the middle of the plume. These plume sizes and electron temperatures are roughly in line with observations and modelling of plasma plumes under similar laser conditions, e.g., [5,13,24]. The modelled background gas density leads to unphysical predictions of increased density and temperature in the leading edge of the plume for times later than 25 ns. However, the plasma plume densities up until this point are much higher than the background density. Consequently, the hydrodynamic effects, which are the main source of error following the unphysically high background density assumptions in the POLLUX modelling, will be of minimal influence over these short time scales of 25 ns.
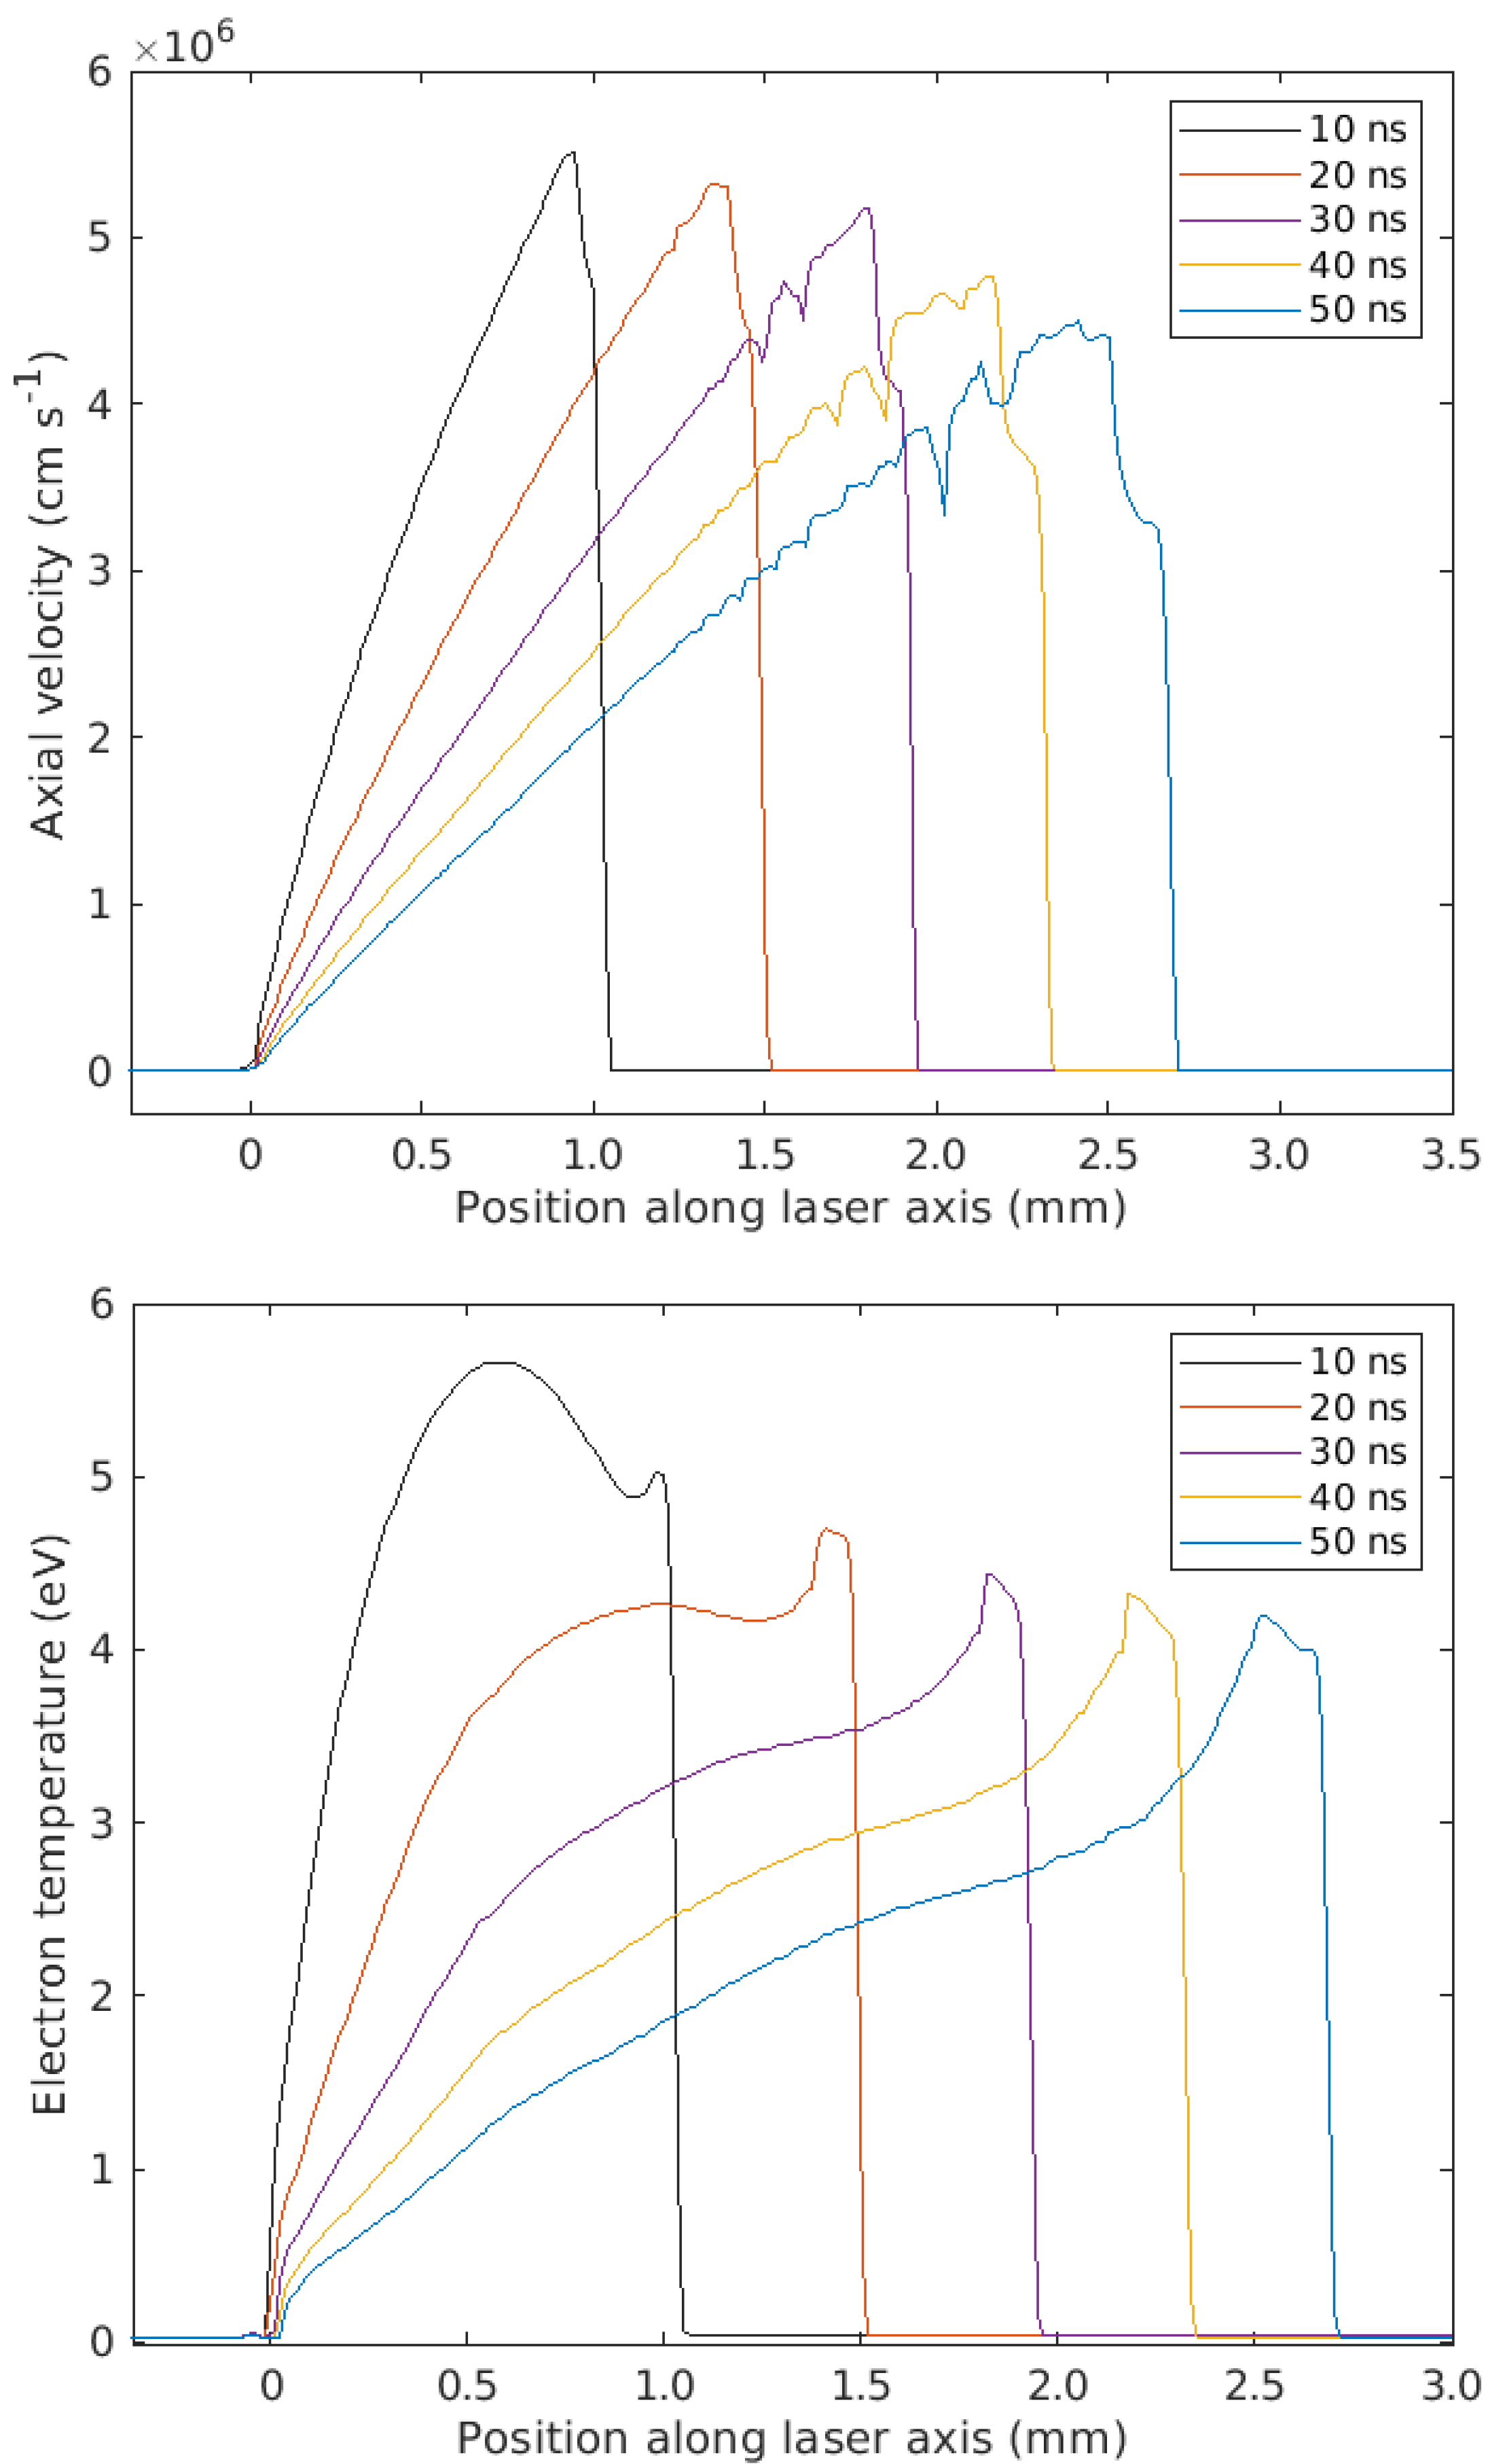
Figure 3 displays the spatial distribution of the axial velocity and electron temperature profiles of the titanium plasma plume along the laser axis. It can be observed that the ablated material moves away from the target surface with a velocity of approximately 5.5 × 10 6 cm s 1 , with the highest velocities at the leading edge of the plume. This is expected, as the material at the front of the plume will have greater kinetic energy. The electron temperature near the beginning of the plume expansion is approximately 5.5 eV . It can be seen from both plots that the axial length of the plasma plume increases over time, but at a slightly diminishing rate, possibly due to the resistance and viscosity due to the background gas. The peaks of the electron temperature and velocity in the respective plots also appear to reduce over time. These observations are qualitatively in line with many previous studies, e.g., [5,24]. However, since laser parameters (pulse duration, spot size, fluence) and material details are slightly different, it is impossible to qualitatively compare results, which is required to uncover the subtle differences between different materials.

3.2. Investigating the Effects of Material Properties on Titanium Plasma Plumes

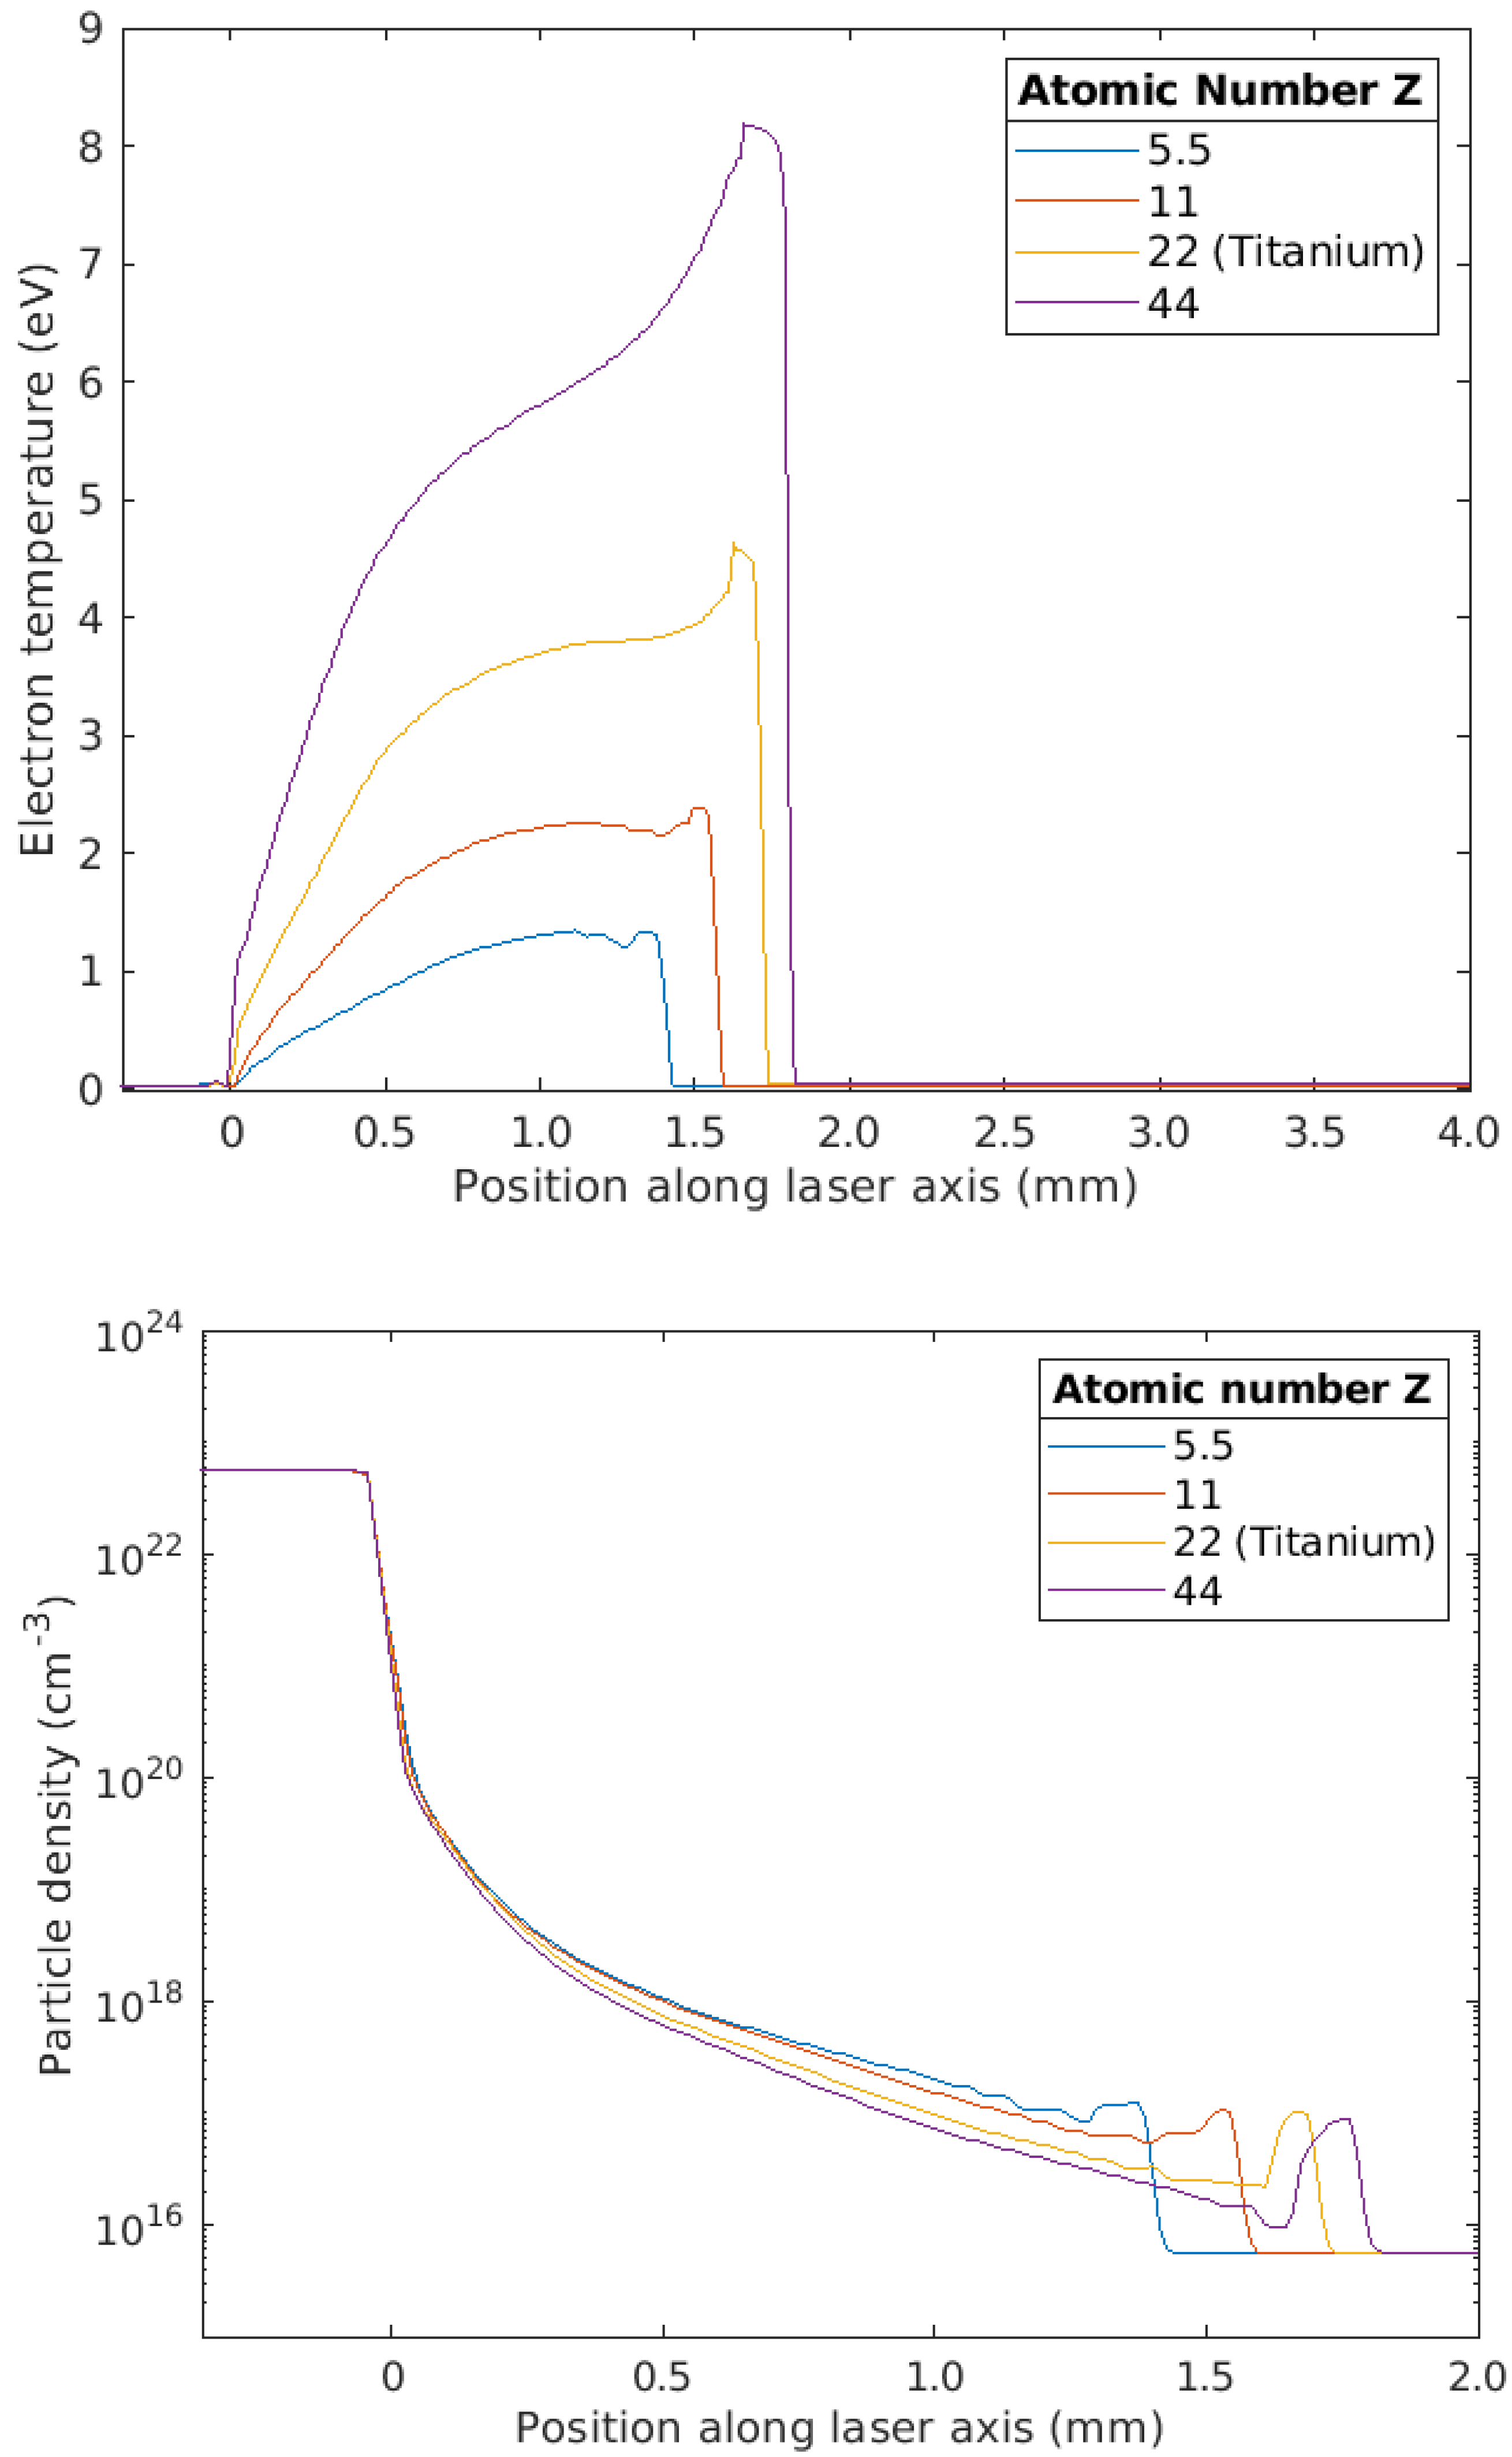
In order to truly identify which material parameters have an effect on the plasma plume behaviour, we varied different parameters for each simulation of titanium ablation, creating non-existing elements using the parameters for titanium as a benchmark. In each simulation, one parameter in the Chart-D EoS input for titanium was varied, whilst the other parameters were kept constant. First, the atomic number of titanium, Z, was varied in multiples of its actual atomic number (22), and the effects of this variation on the electron temperature and particle density of the plasma plume were studied and displayed in Figure 4. These results clearly dictate that the electron temperature and the length of the plasma plume increases with the atomic number of the material, and that the front of the plume has higher atomic density for lower atomic numbers.
The atomic number will have an effect on several processes within laser ablation, for instance in the material EoS which affects the material evaporation and ionisation state. Subsequently, the laser absorption through inverse bremsstrahlung will also be affected directly by a change in atomic number (see Equations (1) and (2)) and indirectly through changes in the plume properties e.g., the density ρ or ionisation stage Z i . Even though it is clear from Figure 4 that electron temperature increases and particle density decreases with atomic number, it is not a single process that determines this; it is a complex interplay between the different processes mentioned, resulting in the overall effects observed. Nevertheless, it is clear from these results that a change in atomic number changes the density and temperature of the plasma plume significantly.
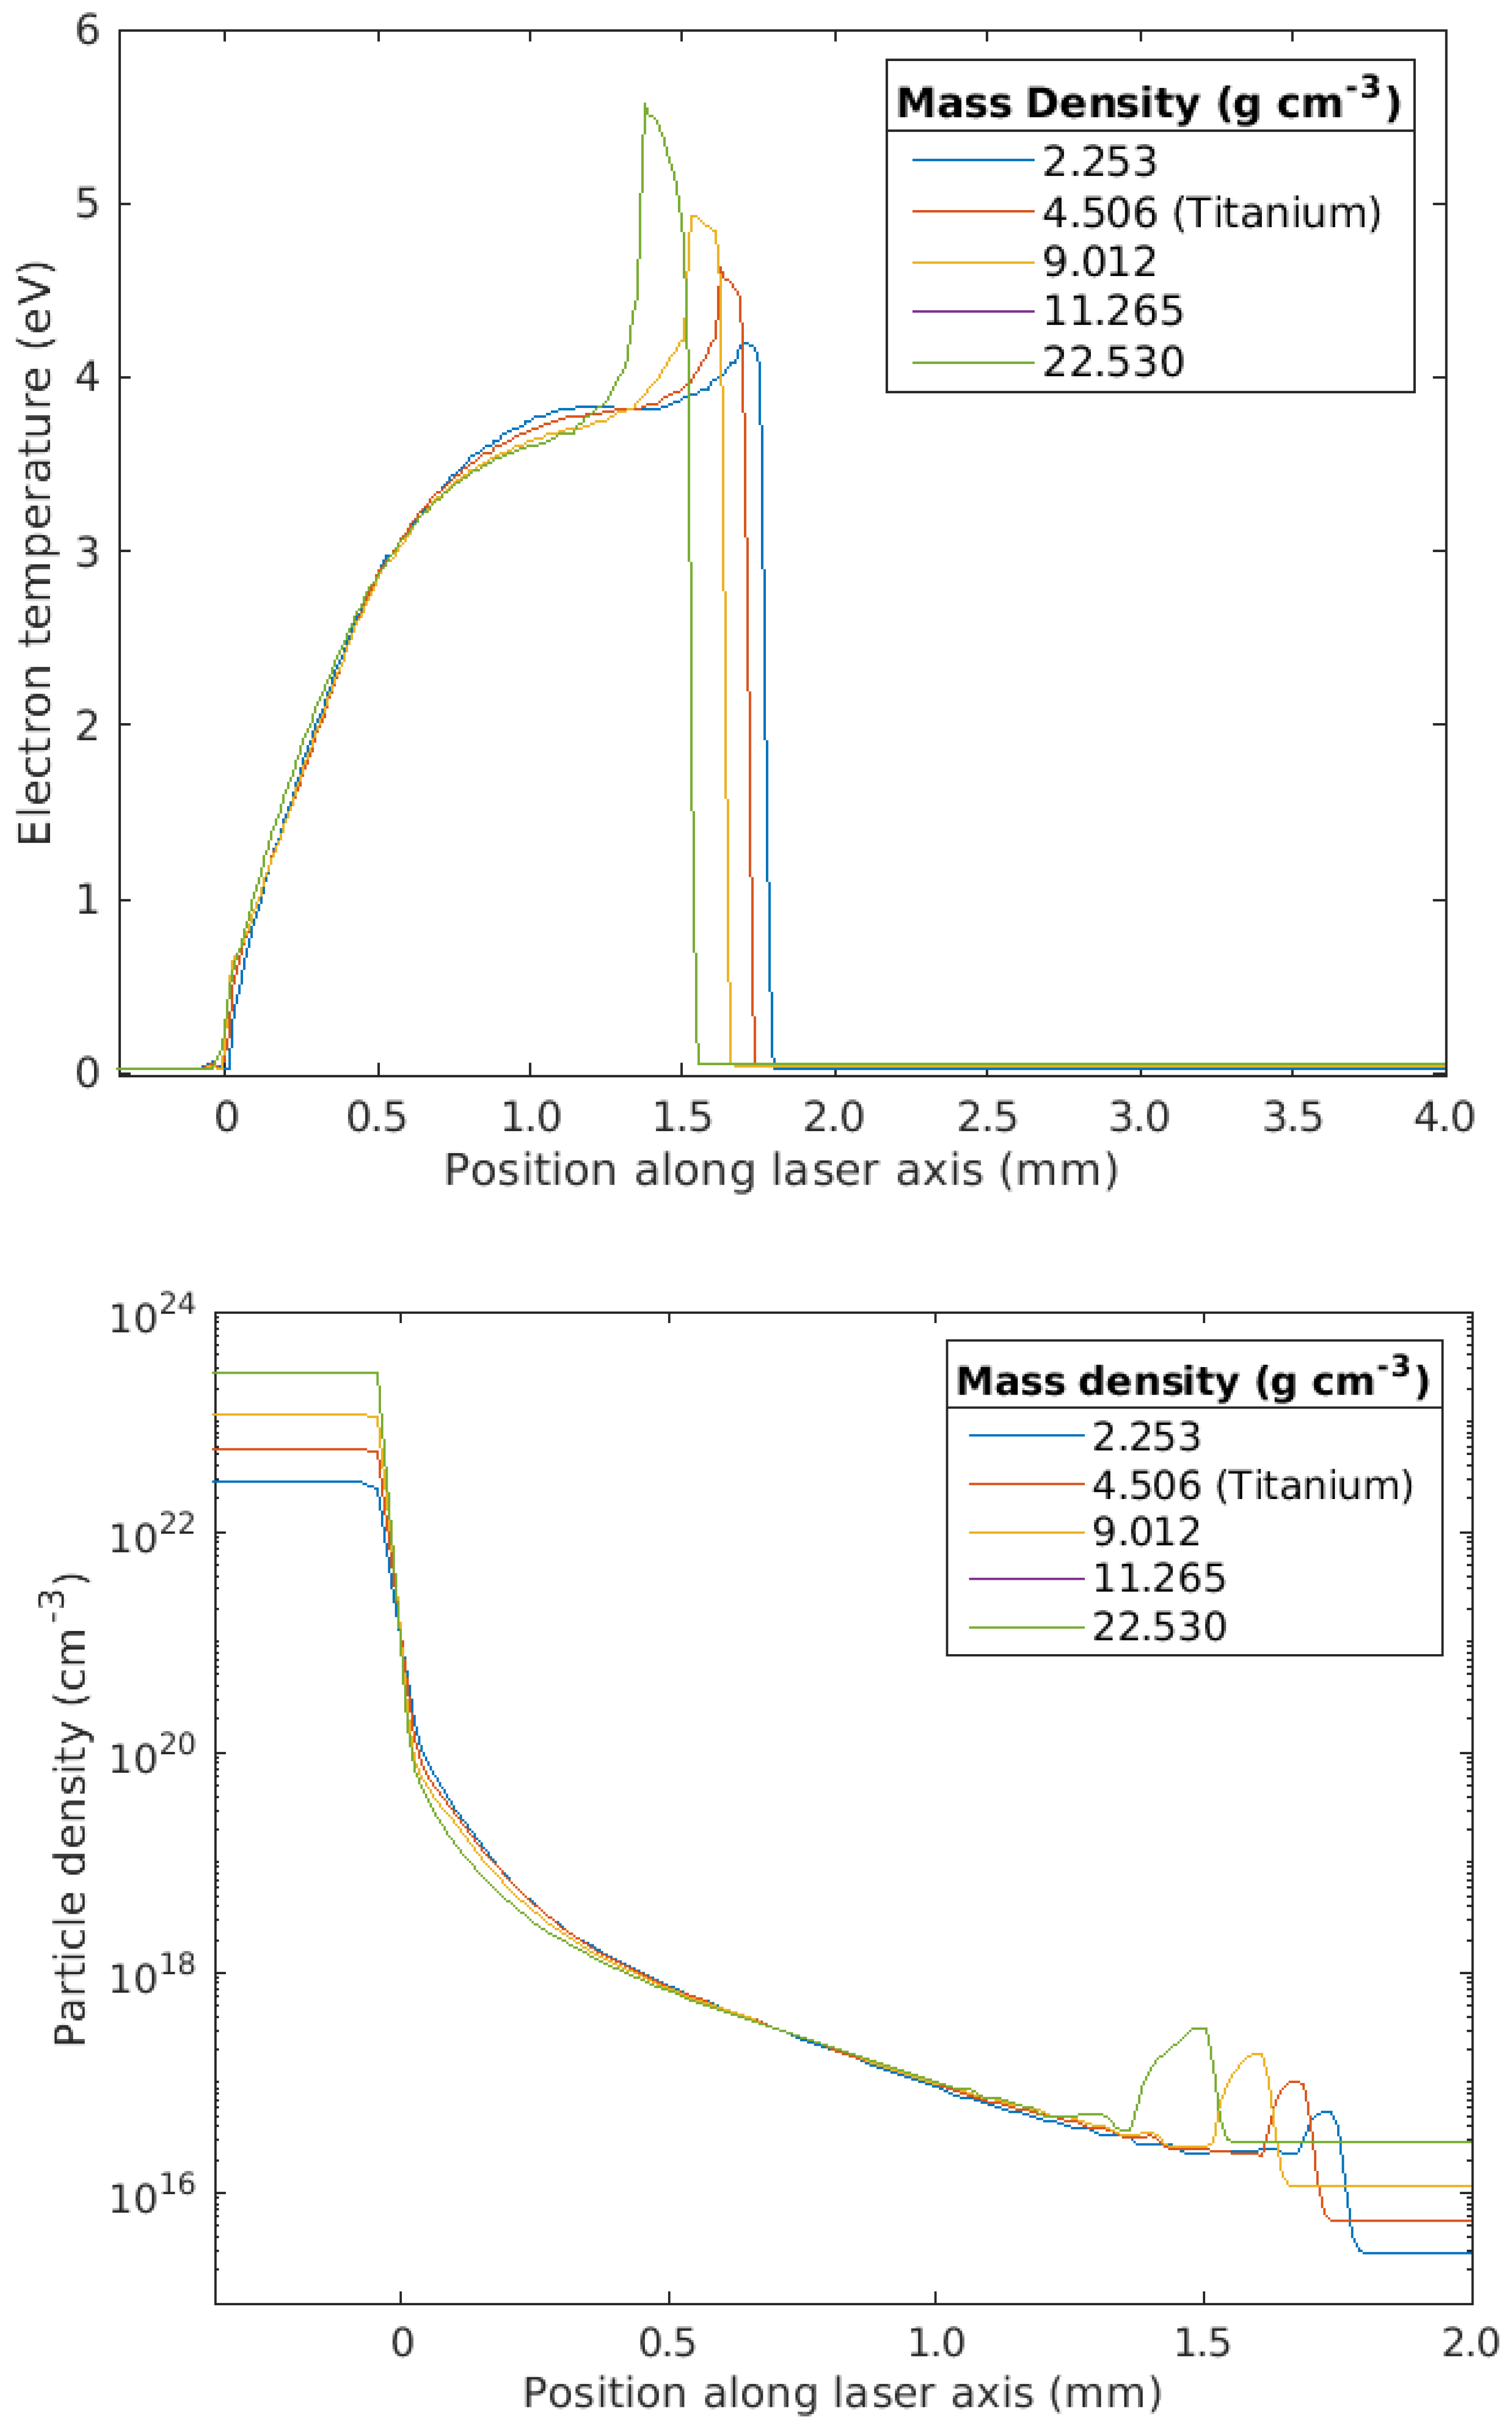
Following on from the investigations in which atomic number was varied, we performed further simulations in which the mass density, ρ , of titanium was modified in multiples of its actual value ( 4.506 g cm 3 ) whilst keeping the atomic number and other parameters constant, in order to investigate how the mass density of the target material contributed to the plume size and temperature. Figure 5 shows that for these investigations the peaks in electron temperature of the plume increased slightly with increasing target mass density. In addition, length of the plume (at the same time) is shorter as mass density increases.
However, the significance of these findings is debatable when the limitations of the model are considered. The peaks towards the front of the plume, as seen in Figure 5 (bottom), are artefacts of the code and the need to have a non-zero background density. The phenomena responsible for the peaks is known as the ’snowplough effect,’ in which resistance and viscosity from the background gas slows down the front of the plume as it expands into the background. As the target density is varied, the background gas density also varies. This means there is more background gas pressure for greater target densities, which increases the snowplough effect. The snowplough build-up gives a higher particle density, and therefore a bigger peak in Figure 5 (bottom). Subsequently, because of the higher plasma density, inverse bremsstrahlung absorption increases (Equation (1)), resulting in a hotter plasma at the position of the density peak, see Figure 5 (top). The varying background density also provides an explanation for why the plume becomes shorter with higher target density. The plume has a higher gas density to move through, so is slowed down more, resulting in shorter plumes.
Therefore, it seems that the observed changes in temperature and density in the plume front are related to the background density, which is a limitation of the code, rather than the target density, which was the purpose of the investigation. In addition, the temperatures and densities behind the plume front are very similar for all target densities. Therefore, it can be concluded that the target density has limited influence on the plume properties, certainly for positions away from the plume front.
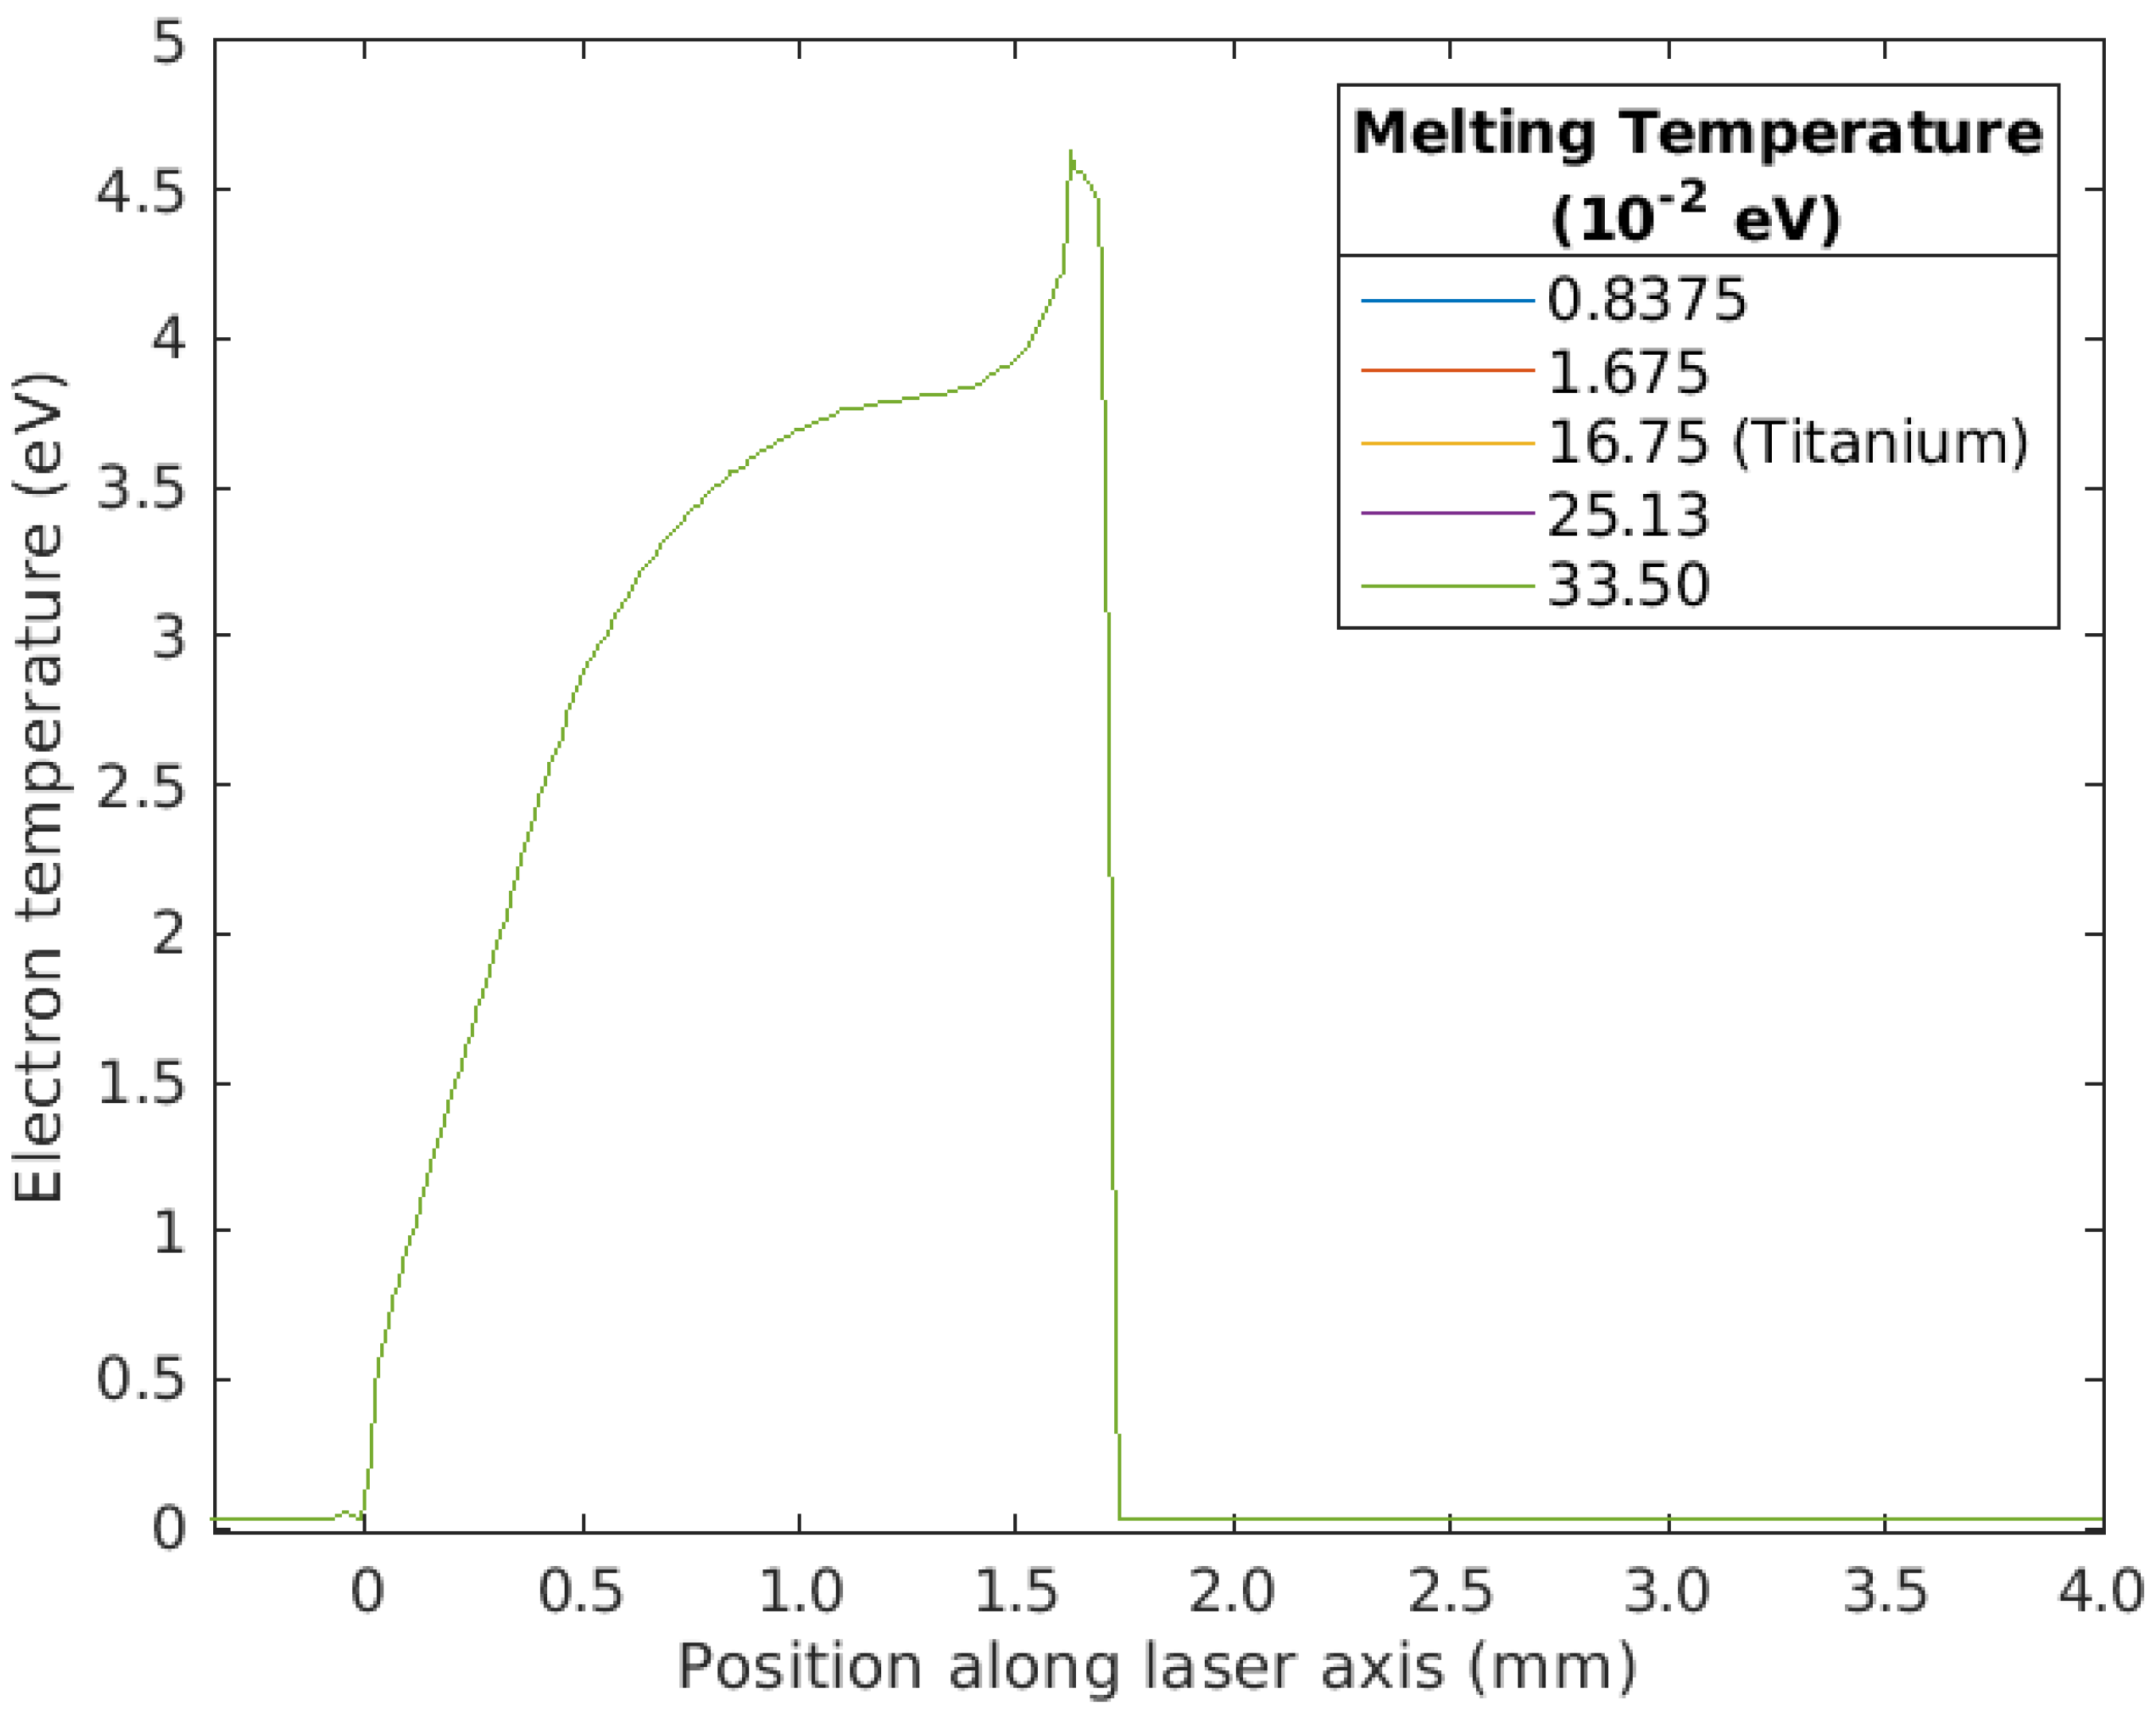
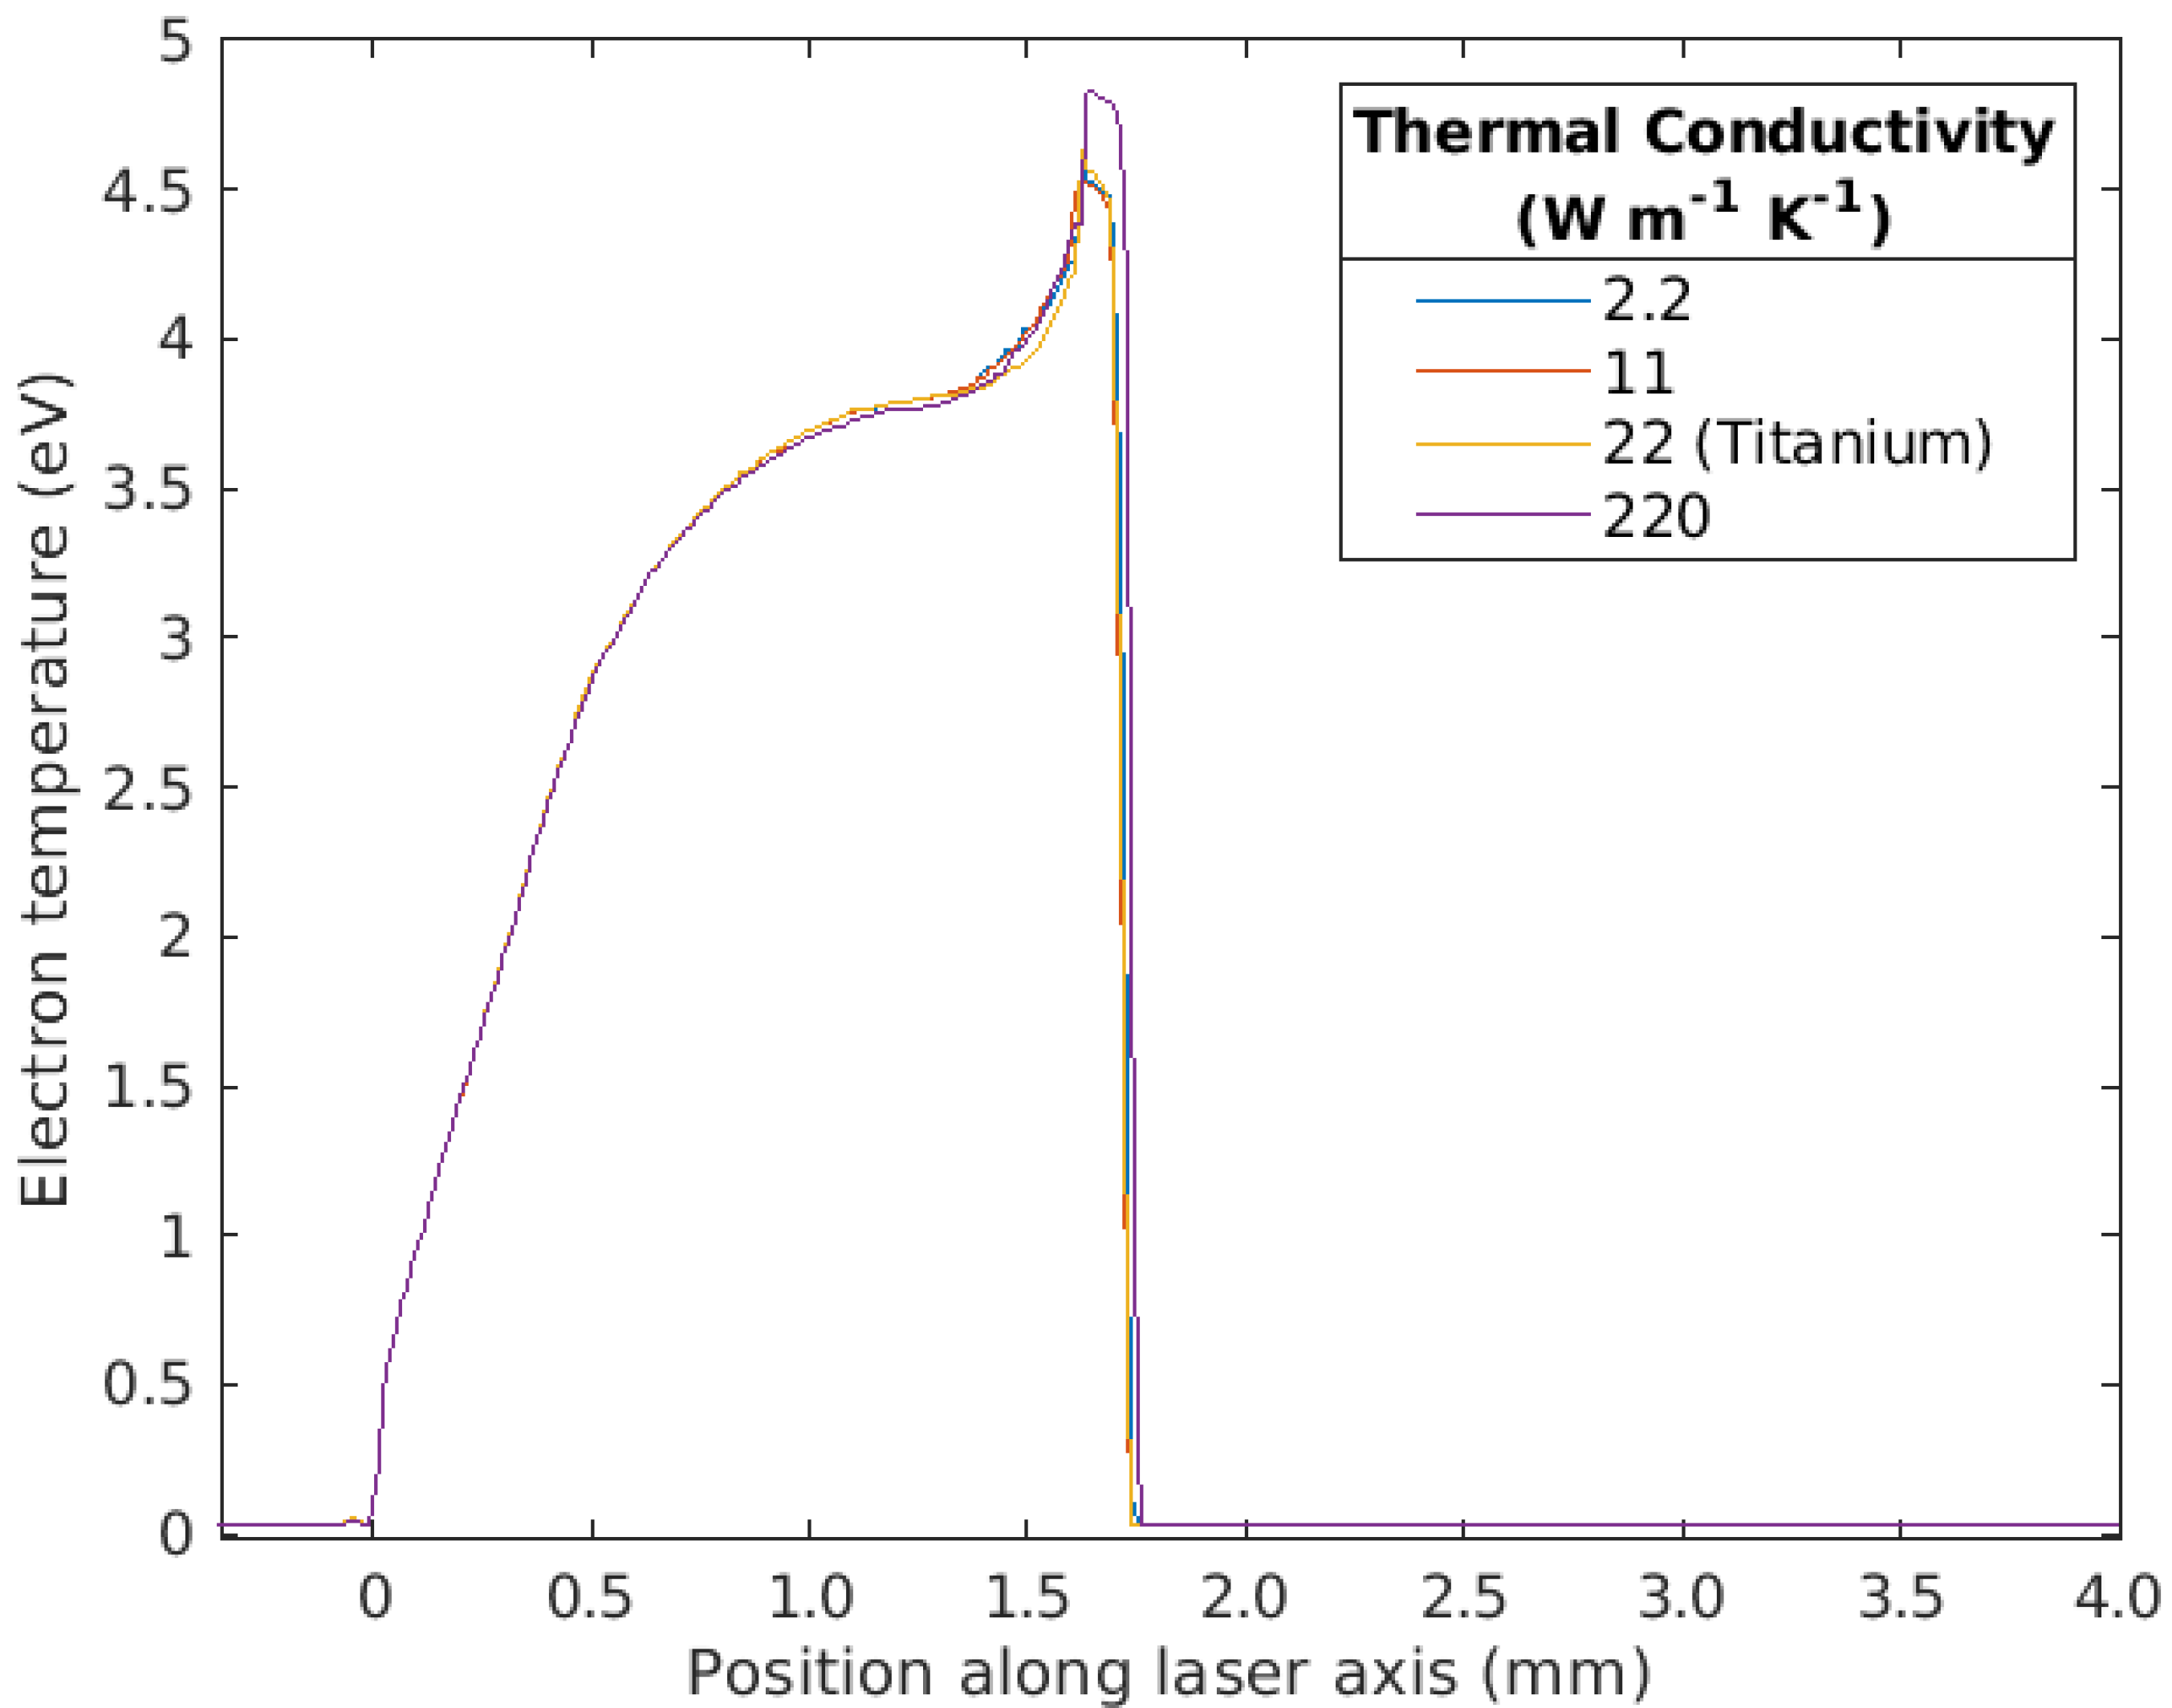
Two other material parameters were investigated for their effect on the behaviour of the plasma plume: the melting temperature and the thermal conductivity coefficient. Simulations were performed for each of them in a similar way to mass density and atomic number, with respective results presented in Figure 6 and Figure 7. Surprisingly, the melting temperature, Figure 6, was found to have negligible effect on the plasma plume properties, with the spatial distributions of the electron temperature of the individual plots overlapping almost completely with each other, despite the contrast in melting temperatures. For the variation in thermal conductivity, Figure 7, plumes were observed to remain a similar size. However, the electron temperature distribution within the plasma plume itself appeared to change slightly with flatter profiles for higher conductivity. This is to be expected, as materials with higher thermal conductivity allow for quicker redistribution of heat within their respective plasma plumes. The plasma density was shown not to vary with changes in either melting temperature nor thermal conductivity.
In conclusion, it was found that the change in atomic number had the largest effects on the plume properties with increasing temperature and decreasing density for increasing atomic number. Target density, thermal conductivity and melting temperature seemed to have much smaller, or negligible, effects on the plume development.

3.3. Comparison of Plasma Plumes from Different Materials

With the knowledge gained from investigating the effects of individual material parameters on plasma plumes, we then simulated the laser ablation of six real materials, as outlined in Section 2.
Figure 8 contains the simulated electron temperature of the six plasma plumes 25 ns after the laser pulse.
The peak temperatures of the plumes varied between 2.61–10.9 eV , with aluminium having the coolest peak and tantalum having the hottest. Moreover, the peak temperatures, and the shape of the temperature distribution, are strongly correlated to the atomic number variation in Figure 4, i.e., Al (Z = 13) has a peak around 2 eV, which is very close to the Z = 11 case in Figure 4, and Cu and Zn (Z = 29, 30 respectively) have peak temperatures of approximately 6 eV, which is exactly between the temperature of 4 eV for Z = 22 and 8 eV for Z = 44. It shows that the temperature profiles of the different elements are closely related to the atomic number of the target material. Similarly, Figure 9 contains the simulated particle density of the six plasma plumes 25 ns after the laser pulse, with the materials of smaller atomic number such as aluminium producing plumes with higher particle densities, showing direct correlation to results in Figure 4 (bottom), where only atomic number was changed.
Interestingly, Au, Ta (highest atomic number and mass density) and Al (lowest atomic number and mass density) have similar plume lengths that are shorter than the other elements. The investigations in Section 3.2 show opposing trends for plume length with atomic number and target mass density; plume length increases with atomic number and decreases with increasing mass density. The results in Figure 8 do not show a clear trend with either, indicating a more complex interplay between the two properties. It is again noted, that the change in target mass density also changes the background gas density, which can affect the plume expansion dynamics. Experimental verification of the results is needed to determine the accuracy of the plume length predictions from the model. Nevertheless, from these investigations, it is clear that atomic number has the biggest impact on the plasma plume, with increasing electron temperature and decreasing density with increasing atomic number. The mass density, melting temperature, and thermal conductivity coefficient of the material have only a very limited influence on the plume behaviour.

4. Conclusions

The laser ablation of different metals was modelled using the hydrodynamic code POLLUX. In particular, the material properties which contribute to the characteristics of the plasma plumes were investigated. This was carried out in two parts: first, titanium was modelled as a benchmark after which single material parameters were varied (creating non-existing “Ti-variant” materials) in order to investigate the link between these parameters and the plasma plume properties. Subsequently, the electron temperature and particle density of plumes of six real elements varying in atomic number and mass density was modelled to verify the links identified in the work on non-existing materials. The results from modelling the titanium-variants showed that the atomic number of the material, Z, affected the electron temperature and mass density of the subsequent plasma plume, with both parameters increasing with atomic number. Whilst the mass density, thermal conductivity and melting temperature appeared to have no effect on the electron temperature or particle density of the bulk of the plumes. These correlations were observed in the modelling of real elements, with the heavier elements with higher atomic number and mass density giving rise to hotter, denser plasma plumes. The length of the plume was not directly correlated to a single material parameter, there was an interplay between atomic number and mass density effects, with the heaviest and lightest elements producing shorter plumes compared to the elements with intermediate values for atomic number and mass density.
This study shows that the atomic number of the target material has the biggest influence on the temperature and density of the plasma plume, providing useful insights for experimental situations such as PLD where the aim is to change the target material, but keep the plume parameters as constant as possible.

Author Contributions

Conceptualization, M.H. and E.W.; methodology, M.H. and E.W.; software, M.H.; validation, M.H.; formal analysis, M.H.; investigation, M.H.; data curation, M.H.; writing—original draft preparation, M.H.; writing—review and editing, M.H. and E.W.; visualization, M.H.; supervision, E.W.; project administration, M.H. All authors have read and agreed to the published version of the manuscript.

Funding

This research received no external funding.

Data Availability Statement

Data is available on request from the authors.

Conflicts of Interest

The authors declare no conflict of interest.

References

  1. Becker, W.F. Metal nanoparticles generated by laser ablation. Nanostructured Mater. 1998, 10, 853–863. [Google Scholar] [CrossRef]
  2. Darwood, R.J. Randomized clinical trial comparing endovenous laser ablation with surgery for the treatment of primary great saphenous varicose veins. Br. J. Surg. 2008, 95, 294–301. [Google Scholar] [CrossRef] [PubMed]
  3. Vertes, A. Laser Ionization Mass Analysis; Vertes, A., Gijbels, R., Adams, F., Eds.; Wiley: New York, NY, USA, 1993. [Google Scholar]
  4. Radziemski, L.J. Laser-Induced Plasmas and Applications; Radziemski, L.J., Cremers, D.A., Eds.; Wiley: New York, NY, USA, 1989. [Google Scholar]
  5. Rajendiran, S.; Rossall, A.K.; Gibson, A.; Wagenaars, E. Modelling of laser ablation and reactive oxygen plasmas for pulsed laser deposition of zinc oxide. Surf. Coat. Technol. 2014, 260, 417–423. [Google Scholar] [CrossRef] [Green Version]
  6. Ashfold, M.N.; Claeyssens, F.; Fuge, G.M.; Henley, S.J. Pulsed laser ablation and deposition of thin films. Chem. Soc. Rev. 2003, 33, 23–31. [Google Scholar] [CrossRef] [PubMed] [Green Version]
  7. Autrique, D.; Alexiades, V.; Khanal, H. Hydrodynamic modelling of ns-laser ablation. Electron. J. Differ. Equat. 2013, 20. Available online: https://commons.erau.edu/cgi/viewcontent.cgi?article=1902&context=publication (accessed on 1 December 2022).
  8. Chen, Z.; Bogaerts, A. Laser ablation of Cu and plume expansion into 1 atm ambient gas. J. Appl. Phys. 2005, 97, 063305. [Google Scholar] [CrossRef] [Green Version]
  9. Sivakumaran, V.; Joshi, H.C.; Singh, R.K.; Kumar, A. Optical time of flight studies of lithium plasma in double pulse laser ablation: Evidence of inverse bremsstrahlung absorption. Phys. Plasmas 2014, 21, 063110. [Google Scholar] [CrossRef]
  10. Clair, G.; L’Hermite, D. 1D modelling of nanosecond laser ablation of copper samples in argon at P = 1 atm with a wavelength of 532 nm. J. Appl. Phys. 2011, 110, 083307. [Google Scholar] [CrossRef]
  11. Jeschke, H.O.; Garcia, M.E.; Lenzner, M.; Bonse, J.; Krüger, J.; Kautek, W. Laser ablation thresholds of silicon for different pulse durations: Theory and experiment. Appl. Surf. Sci. 2002, 197–198, 839–844. [Google Scholar] [CrossRef]
  12. Roberts, D.E.; du Plesis, A.; Botha, L.R. Femtosecond laser ablation of silver foil with single and double pulses. Appl. Surf. Sci. 2010, 256, 1784–1792. [Google Scholar] [CrossRef]
  13. Qaisar, M.S.; Pert, G.J. Laser ablation of Mg, Cu and Pb using infrared and ultraviolet low-fluence lasers. J. Appl. Phys. 2003, 94, 1468. [Google Scholar] [CrossRef]
  14. Honda, K.; Fujishima, A. Electrochemical photolysis of water at a semiconductor electrode. Nature 1972, 238, 37–38. [Google Scholar]
  15. Rajendiran, S.; Meehan, D.; Wagenaars, E. Plasma-enhanced pulsed laser deposition of copper and zinc oxide thin films. AIP Adv. 2020, 10, 065323. [Google Scholar] [CrossRef]
  16. Fortunato, E.; Barquinha, P.; Martins, R. Oxide semiconductor thin-film transistors: A review of recent advances. Adv. Mater. 2012, 24, 2495. [Google Scholar] [CrossRef] [PubMed]
  17. Wong, T.K.; Zhuk, S.; Masudy-Panah, S.; Dalapati, G.K. Current status and future prospects of copper oxide heterojunction solar cells. Materials 2020, 9, 271. [Google Scholar] [CrossRef]
  18. Özgür, Ü.; Alivov, Y.I.; Liu, C.; Teke, A.; Reshchikov, M. A comprehensive review of ZnO materials and devices. J. Appl. Phys. 2005, 98, 041301. [Google Scholar]
  19. Kumar, R.; Kumar, G.; Al-Dossary, O.; Umar, A. ZnO nanostructured thin films: Depositions, properties and applications—A review. Mater. Express 2015, 5, 3. [Google Scholar] [CrossRef]
  20. Pert, G.J. Models of laser-plasma ablation. J. Plasma Phys. 1986, 35, 43–74. [Google Scholar] [CrossRef]
  21. Pert, G.J. Models of laser-plasma ablation Part 2—Steady-state theory: Self-regulating flow. J. Plasma Phys. 1986, 36, 415–446. [Google Scholar] [CrossRef]
  22. Pert, G.J. Models of laser-plasma ablation Part 3—Steady-state theory: Deflagration flow. J. Plasma Phys. 1988, 39, 241–276. [Google Scholar] [CrossRef]
  23. Pert, G.J. Two-dimensional hydrodynamic models of laser-produced plasmas. J. Plasma Phys. 1989, 41, 263–280. [Google Scholar] [CrossRef]
  24. Liu, H.; Ashfold, M.N.; Meehan, D.N.; Wagenaars, E. Wavelength-dependent variations of the electron characteristics in laser-induced plasmas: A combined hydrodynamic and adiabatic expansion modelling and time-gated, optical emission imaging study. J. Appl. Phys. 2019, 125, 083304. [Google Scholar] [CrossRef] [Green Version]
  25. Boris, J.P.; Book, D.L. Flux-corrected transport. I. SHASTA, a fluid transport algorithm that works. J. Comp. Phys. 1987, 11, 38–69. [Google Scholar] [CrossRef]
  26. Thompson, S.L. Improvements in the Chart-D Radiation-Hydrodynamic Code I: Analytic Equations of State, Sandia Labs Report. 1970, SC-RR-70-28. Available online: https://www.osti.gov/biblio/4125539 (accessed on 1 December 2022).
  27. Latter, R. Temperature behavior of the Thomas-Fermi statistical model for atoms. Phys. Rev. 1955, 11, 1854. [Google Scholar] [CrossRef]
  28. Kershaw, D.S. The incomplete Cholesky—Conjugate gradient method for the iterative solution of systems of linear equations. J. Comp. Phys. 1978, 26, 43–65. [Google Scholar] [CrossRef]
  29. Pert, G.J. Inverse bremsstrahlung absorption in large radiation fields during binary collisions-classical theory. II. Integrated rate coefficients for Coulomb collisions. J. Phys. A Math. Gen. 1976, 9, 463–471. [Google Scholar] [CrossRef]
  30. Pert, G.J. Inverse bremsstrahlung absorption in large radiation fields during binary collisions-classical theory. II(b). summed rate coefficients for Coulomb collisions. J. Phys. A Math. Gen. 1976, 9, 1797–1800. [Google Scholar] [CrossRef]
  31. Hermann, J.; Grojo, D.; Axente, E.; Craciun, V. Local thermodynamic equilibrium in a laser-induced plasma evidenced by blackbody radiation. Spectrochim. Acta Part B 2018, 144, 82–86. [Google Scholar] [CrossRef] [Green Version]
  32. Cristoforetti, G.; Lorenzetti, G.; Legnaioli, S.; Palleschi, V. Investigation on the role of air in the dynamical evolution and thermodynamic state of a laser-induced aluminium plasma by spatial- and time-resolved spectroscopy. Spectrochim. Acta Part B 2010, 65, 787–796. [Google Scholar] [CrossRef]
  33. Royal Society of Chemistry. Periodic Table. Available online: Rsc.org/periodic-table (accessed on 1 December 2022).
  34. Zhang, J.; Zhao, Y.; Hixson, R.S.; Gray, G.T., III; Wang, L.; Utsumi, W.; Hiroyuki, S.; Takanori, H. Thermal equations of state for titanium obtained by high pressure—Temperature diffraction studies. Phys. Rev. B. 2008, 78, 054119. [Google Scholar] [CrossRef]
  35. Katahara, K.W. Pressure derivatives of the elastic moduli of niobium and tantalum. J. Appl. Phys. 1976, 47, 434–439. [Google Scholar] [CrossRef]
  36. Kerley, G.I. Equations of State for Titanium and Ti6A14V Alloy; Sandia Report; Sandia National Laboratories: Albuquerque, NM, USA, 2003. [Google Scholar]
  37. Greeff, C.W.; Johnson, J.D. New Sesame Equation of State for Tantalum; Los Alamos Report; Los Alamos National Lab.: Santa Fe, NM, USA, 2000; Volume 78, p. LA-13681-MS. [Google Scholar]
  38. Kittel, C. Introduction to Solid State Physics, 8th ed.; John Wiley & Sons: Hoboken, NJ, USA, 2004. [Google Scholar]
  39. Desai, P.D. Thermodynamic properties of Aluminium. Int. J. Thermophys. 1987, 8, 621–638. [Google Scholar] [CrossRef]
  40. Arblaster, J.W. Thermodynamic Properties of Gold. J. Phase Equilib. Diffus. 2016, 37, 229–245. [Google Scholar] [CrossRef]
  41. McCreary, J.R.; Thorn, R.J. Enthalpy of sublimation of Zinc and Cadmium. J. Chem. Phys. 1969, 50, 3725. [Google Scholar] [CrossRef]
  42. Arblaster, J.W. Thermodynamic Properties of Copper. J. Phase Equilib. Diffus. 2015, 36, 422–444. [Google Scholar] [CrossRef]
  43. Desai, P.D. Thermodynamic Properties of Titanium. Int. J. Thermophys. 1987, 8, 781–794. [Google Scholar] [CrossRef]
  44. Arblaster, J.W. Thermodynamic Properties of Tantalum. J. Phase Equilib. Diffus. 2018, 39, 255–272. [Google Scholar] [CrossRef]
  45. Properties of Chemical Elements. Available online: Material-properties.org/properties-of-chemical-elements/ (accessed on 1 December 2022).
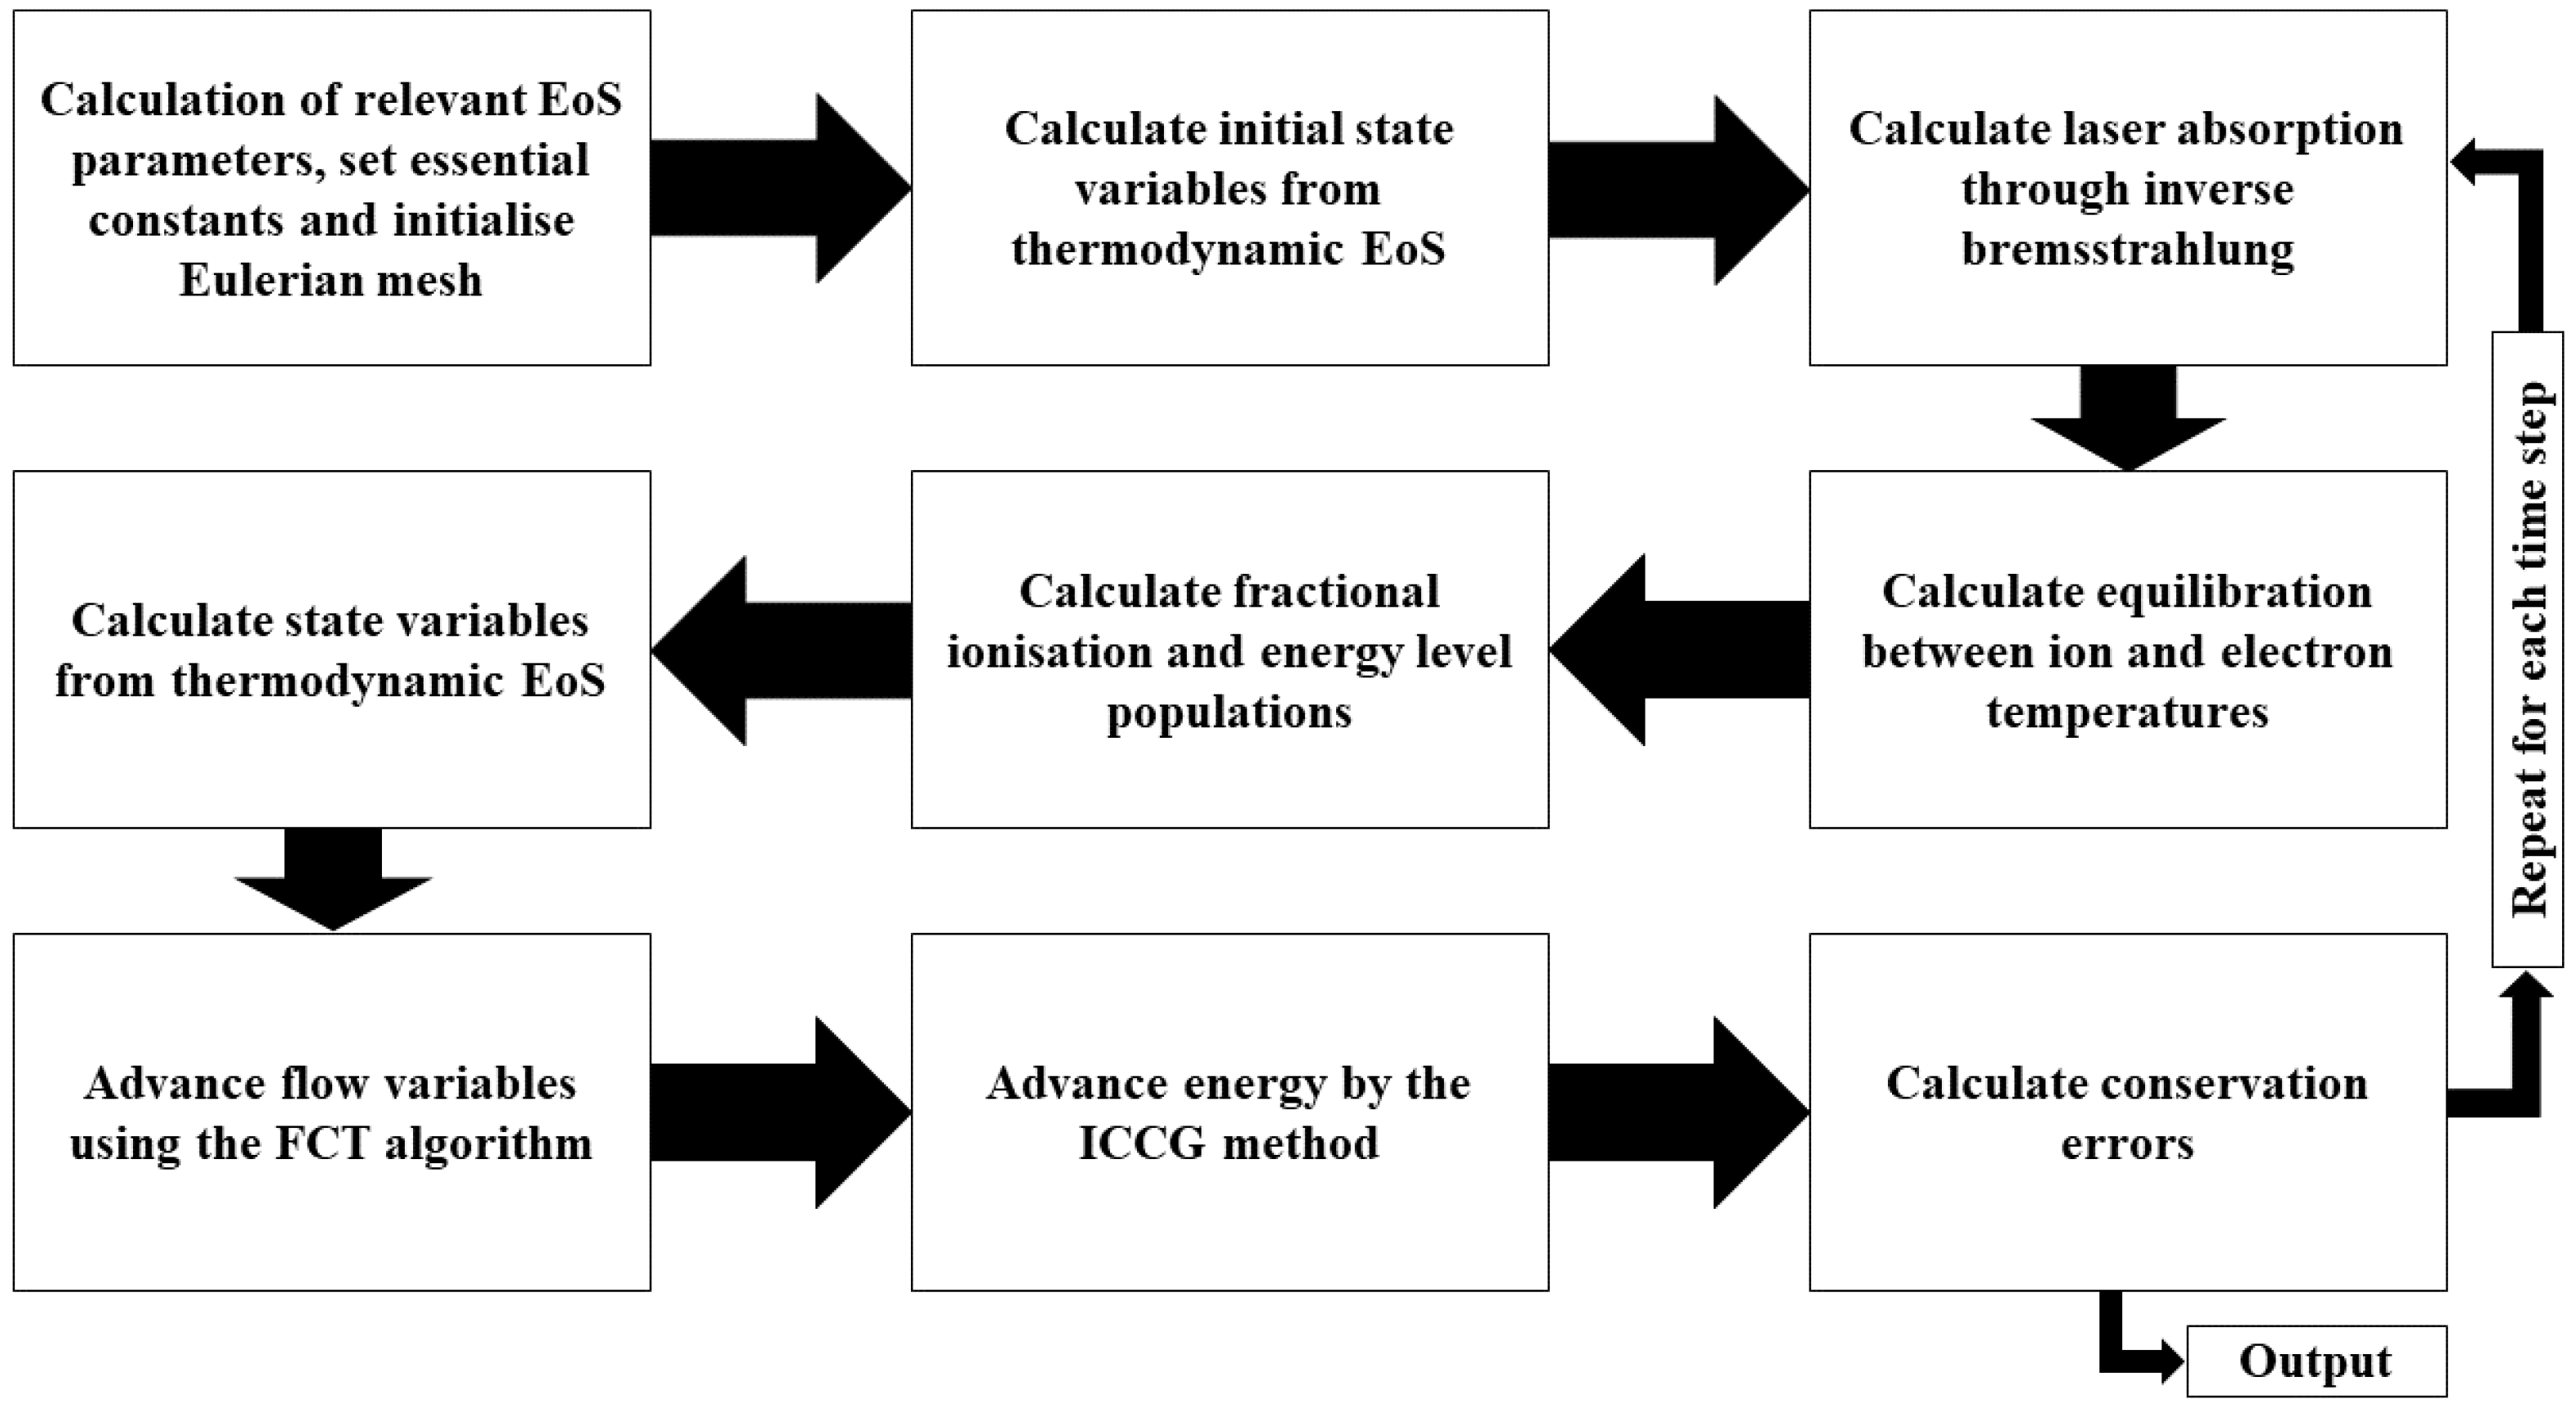
Figure 1. Flowchart summarising the POLLUX algorithm.
Photonics 09 00937 g001
Figure 2. Results of the laser ablation simulation showing the distribution of the electron temperature in an ablated titanium plasma plume calculated at 5 ns after the laser pulse. The laser fluence was 100.5 J cm 2 and the laser focus was 100 μ m.
Photonics 09 00937 g002
Figure 3. Spatial distribution of the simulated axial velocity (top) and electron temperature (bottom) profiles of a titanium plasma plume for different times after the start of the 16 ns laser pulse. The laser fluence was 100.5 J cm 2 and the laser focus was 100 μ m.
Photonics 09 00937 g003
Figure 4. 1D plot comparing the spatial distribution of the electron temperature (top) and the particle density (bottom) of an ablated titanium plasma plume with varied atomic number 25 ns after the laser pulse. The default atomic number of titanium is 22. The laser fluence was 100.5 J cm 2 and the laser focus was 100 μ m.
Photonics 09 00937 g004
Figure 5. 1D plot comparing the spatial distribution of the electron temperature (top) and the particle density (bottom) of an ablated titanium plasma plume with varied mass density 25 ns after the laser pulse. The default mass density of titanium is 4.506 g cm 3 . The laser fluence was 100.5 J cm 2 and the laser focus was 100 μ m.
Photonics 09 00937 g005
Figure 6. Comparison of the spatial distribution of the electron temperature of an ablated titanium plasma plume with varied melting temperature 25 ns after the laser pulse. The default melting temperature of titanium is 1.675 meV . The laser fluence was 100.5 J cm 2 and the laser focus was 100 μ m. The curves overlap with each other completely. As such, only the last curve (corresponding to 33.50 × 10 2 eV ) is visible in the figure.
Photonics 09 00937 g006
Figure 7. Comparison of the spatial distribution of the electron temperature of an ablated titanium plasma plume with varied thermal conductivity coefficient 25 ns after the laser pulse. The default thermal conductivity of titanium is 22 W m 1 K 1 . The laser fluence was 100.5 J cm 2 and the laser focus was 100 μ m.
Photonics 09 00937 g007
Figure 8. The spatial distribution of the electron temperature of plasma plumes from six different materials, 25 ns after the laser pulse. The laser fluence was 100.5 J cm 2 and the laser focus was 100 μ m.
Photonics 09 00937 g008
Figure 9. The spatial distribution of the particle density of plasma plumes from six different materials, 25 ns after the laser pulse. The laser fluence was 100.5 J cm 2 and the laser focus was 100 μ m.
Photonics 09 00937 g009
Table 1. Constructed tabular Chart-D EoS for Al, Au, Zn, Cu, Ti and Ta.
Chart-D VariableAluminium, AlGold, AuZinc, ZnCopper, CuTitanium, TiTantalum, Ta
Mass density ( g cm 3 )2.700 [33]19.30 [33]7.140 [33]8.940 [33]4.506 [33]16.40 [33]
Bulk modulus ( Ba ) 7.03 × 10 11 [33] 2.17 × 10 12 [33] 7.20 × 10 11 [33] 1.37 × 10 12 [33] 1.14 × 10 12 [34] 1.91 × 10 12 [35]
Gruneisen coefficient2.060 [26]3.054 [26]1.390 [26]2.020 [26]1.184 [36]1.590 [37]
Debye temperature ( eV ) 3.69 × 10 2 [38] 1.47 × 10 2 [38] 4.40 × 10 2 [38] 5.03 × 10 2 [38] 3.62 × 10 2 [38] 3.45 × 10 2 [38]
Enthalpy of sublimation ( ergs   g 1 ) 1.22 × 10 11 [39] 1.87 × 10 10 [40] 1.99 × 10 10 [41] 5.30 × 10 10 [42] 9.87 × 10 10 [43] 4.32 × 10 10 [44]
Melting temperature ( eV ) 1.17 × 10 1 [33] 1.15 × 10 1 [33] 5.97 × 10 2 [33] 1.17 × 10 1 [33] 1.68 × 10 1 [33] 2.84 × 10 1 [33]
Thermal conductivity coefficient ( ergs   cm 1   eV 1 ) 2.73 × 10 11 [45] 3.71 × 10 11 [45] 1.35 × 10 11 [45] 4.65 × 10 11 [45] 2.55 × 10 10 [45] 1.97 × 10 10 [45]
Atomic number137930292273
Publisher’s Note: MDPI stays neutral with regard to jurisdictional claims in published maps and institutional affiliations.