Letter

Free Electron Laser Measurement of Liquid Carbon Reflectivity in the Extreme Ultraviolet

1
Department of Chemistry, University of California, Berkeley, CA 94720, USA
2
Chemical Sciences Division, Lawrence Berkeley National Lab, Berkeley, CA 94720, USA
3
Elettra Sincrotrone Trieste SCpA, Basovizza, 34149 Trieste, Italy
4
Molecular Foundry, Lawrence Berkeley National Lab, Berkeley, CA 94720, USA
*
Authors to whom correspondence should be addressed.
Photonics 2020, 7(2), 35; https://doi.org/10.3390/photonics7020035
Submission received: 13 April 2020 / Revised: 16 May 2020 / Accepted: 21 May 2020 / Published: 23 May 2020
(This article belongs to the Section Lasers, Light Sources and Sensors)

Abstract

:
Ultrafast time-resolved extreme ultraviolet (EUV) reflectivity measurements of optically pumped amorphous carbon (a-C) have been performed with the FERMI free electron laser (FEL). This work extends the energy range used in previous reflectivity studies and adds polarization dependence. The EUV probe is known to be sensitive to lattice dynamics, since in this range the reflectivity is essentially unaffected by the photo-excited surface plasma. The exploitation of both s- and p-polarized EUV radiation permits variation of the penetration depth of the probe; a significant increase in the characteristic time is observed upon increasing the probing depth (1 vs. 5 ps) due to hydrodynamic expansion and consequent destruction of the excited region, implying that there is only a short window during which the probed region is in the isochoric regime. A weak wavelength dependence of the reflectivity is found, consistent with previous measurements and implying a maximum electronic temperature of 0.8 eV ± 0.4.

1. Introduction

Ultrafast laser irradiation has become a standard way to induce phase transitions in condensed matter [1,2]. Depending on the material studied and the power of the laser, ultrafast melting, sublimation, or production of extreme states such as warm dense matter or plasmas can be effected [3,4,5,6]. Laser-driven excited states typically exist for only a few picoseconds before the excited region of the sample starts to equilibrate with the bulk, leading to extensive thermal expansion, which destroys the sample in cases such as the present. Thus, it is necessary to probe many identical samples, as is the case in this study, employing ultrafast probing and sample rastering in order to study the system before its destruction by thermal expansion [7].
Here, we detail ultrafast free electron laser (FEL) probing of laser-excited amorphous carbon(a-C) in the extreme ultraviolet (EUV) wavelength range of 21–42 nm over delay times of up to 15 ps and using both s- and p-polarized light. The goal is to elucidate the nature of highly excited carbon, as it has a particularly interesting predicted phase diagram, with unresolved questions as to whether a liquid state actually exists, if there are multiple liquid states, or if it is just a highly-driven plasma state [8,9,10,11,12].
Carbon under extreme thermodynamic conditions was first studied by Bundy, employing flash heating to induce ultrafast melting in graphite [13]. Others have performed ultrafast optical pump-optical probe reflection measurements for both graphite and diamond, wherein evidence of ultrafast metallization ascribed to a solid-liquid transition was presented [14]. However, an optical probe is inherently complicated by the effects of the plasma generated by the optical pump, e.g., photo-excited electrons can strongly affect the time evolution of the reflectivity and transmission, making data interpretation much less straightforward [15,16]. Here, an extreme ultraviolet probe in the range 25–60 eV is used so that the photons are much less affected by the photo-induced plasma. Moreover, we employ polarization as an additional probe of the system, which changes the probe depth [17,18].

2. Results

The measurements were carried out at EIS-TIMEX beamline of the FERMI seeded FEL [19]. The pump-probe timing has a jitter of less than 10 fs [20]. The probe wavelength and polarization were varied using the harmonic and Apple-II-type undulator at FERMI [21]. The samples comprised 100 nm thick coatings of a-C on silicon substrates. The optical (251 nm) pump power is sufficient to induce sample damage, while the EUV probe power is not. This has been verified previously, based on power densities, visual inspection, and reflectivity measurements [22].
The full dataset comprises seven FEL wavelengths with s-polarization and five with p-polarization. Representative time curves are plotted in Figure 1, showing two different polarizations and two different probe energies. The probe pulse reflectivity decreases sharply following the excitation pulse (Δt = 0), but remains roughly constant for ambient samples (data at t < 0). The long-term value measured here approaches that found at 100 ms following the pump pulse, evidencing that all of the sample dynamics occur in the time range studied here.
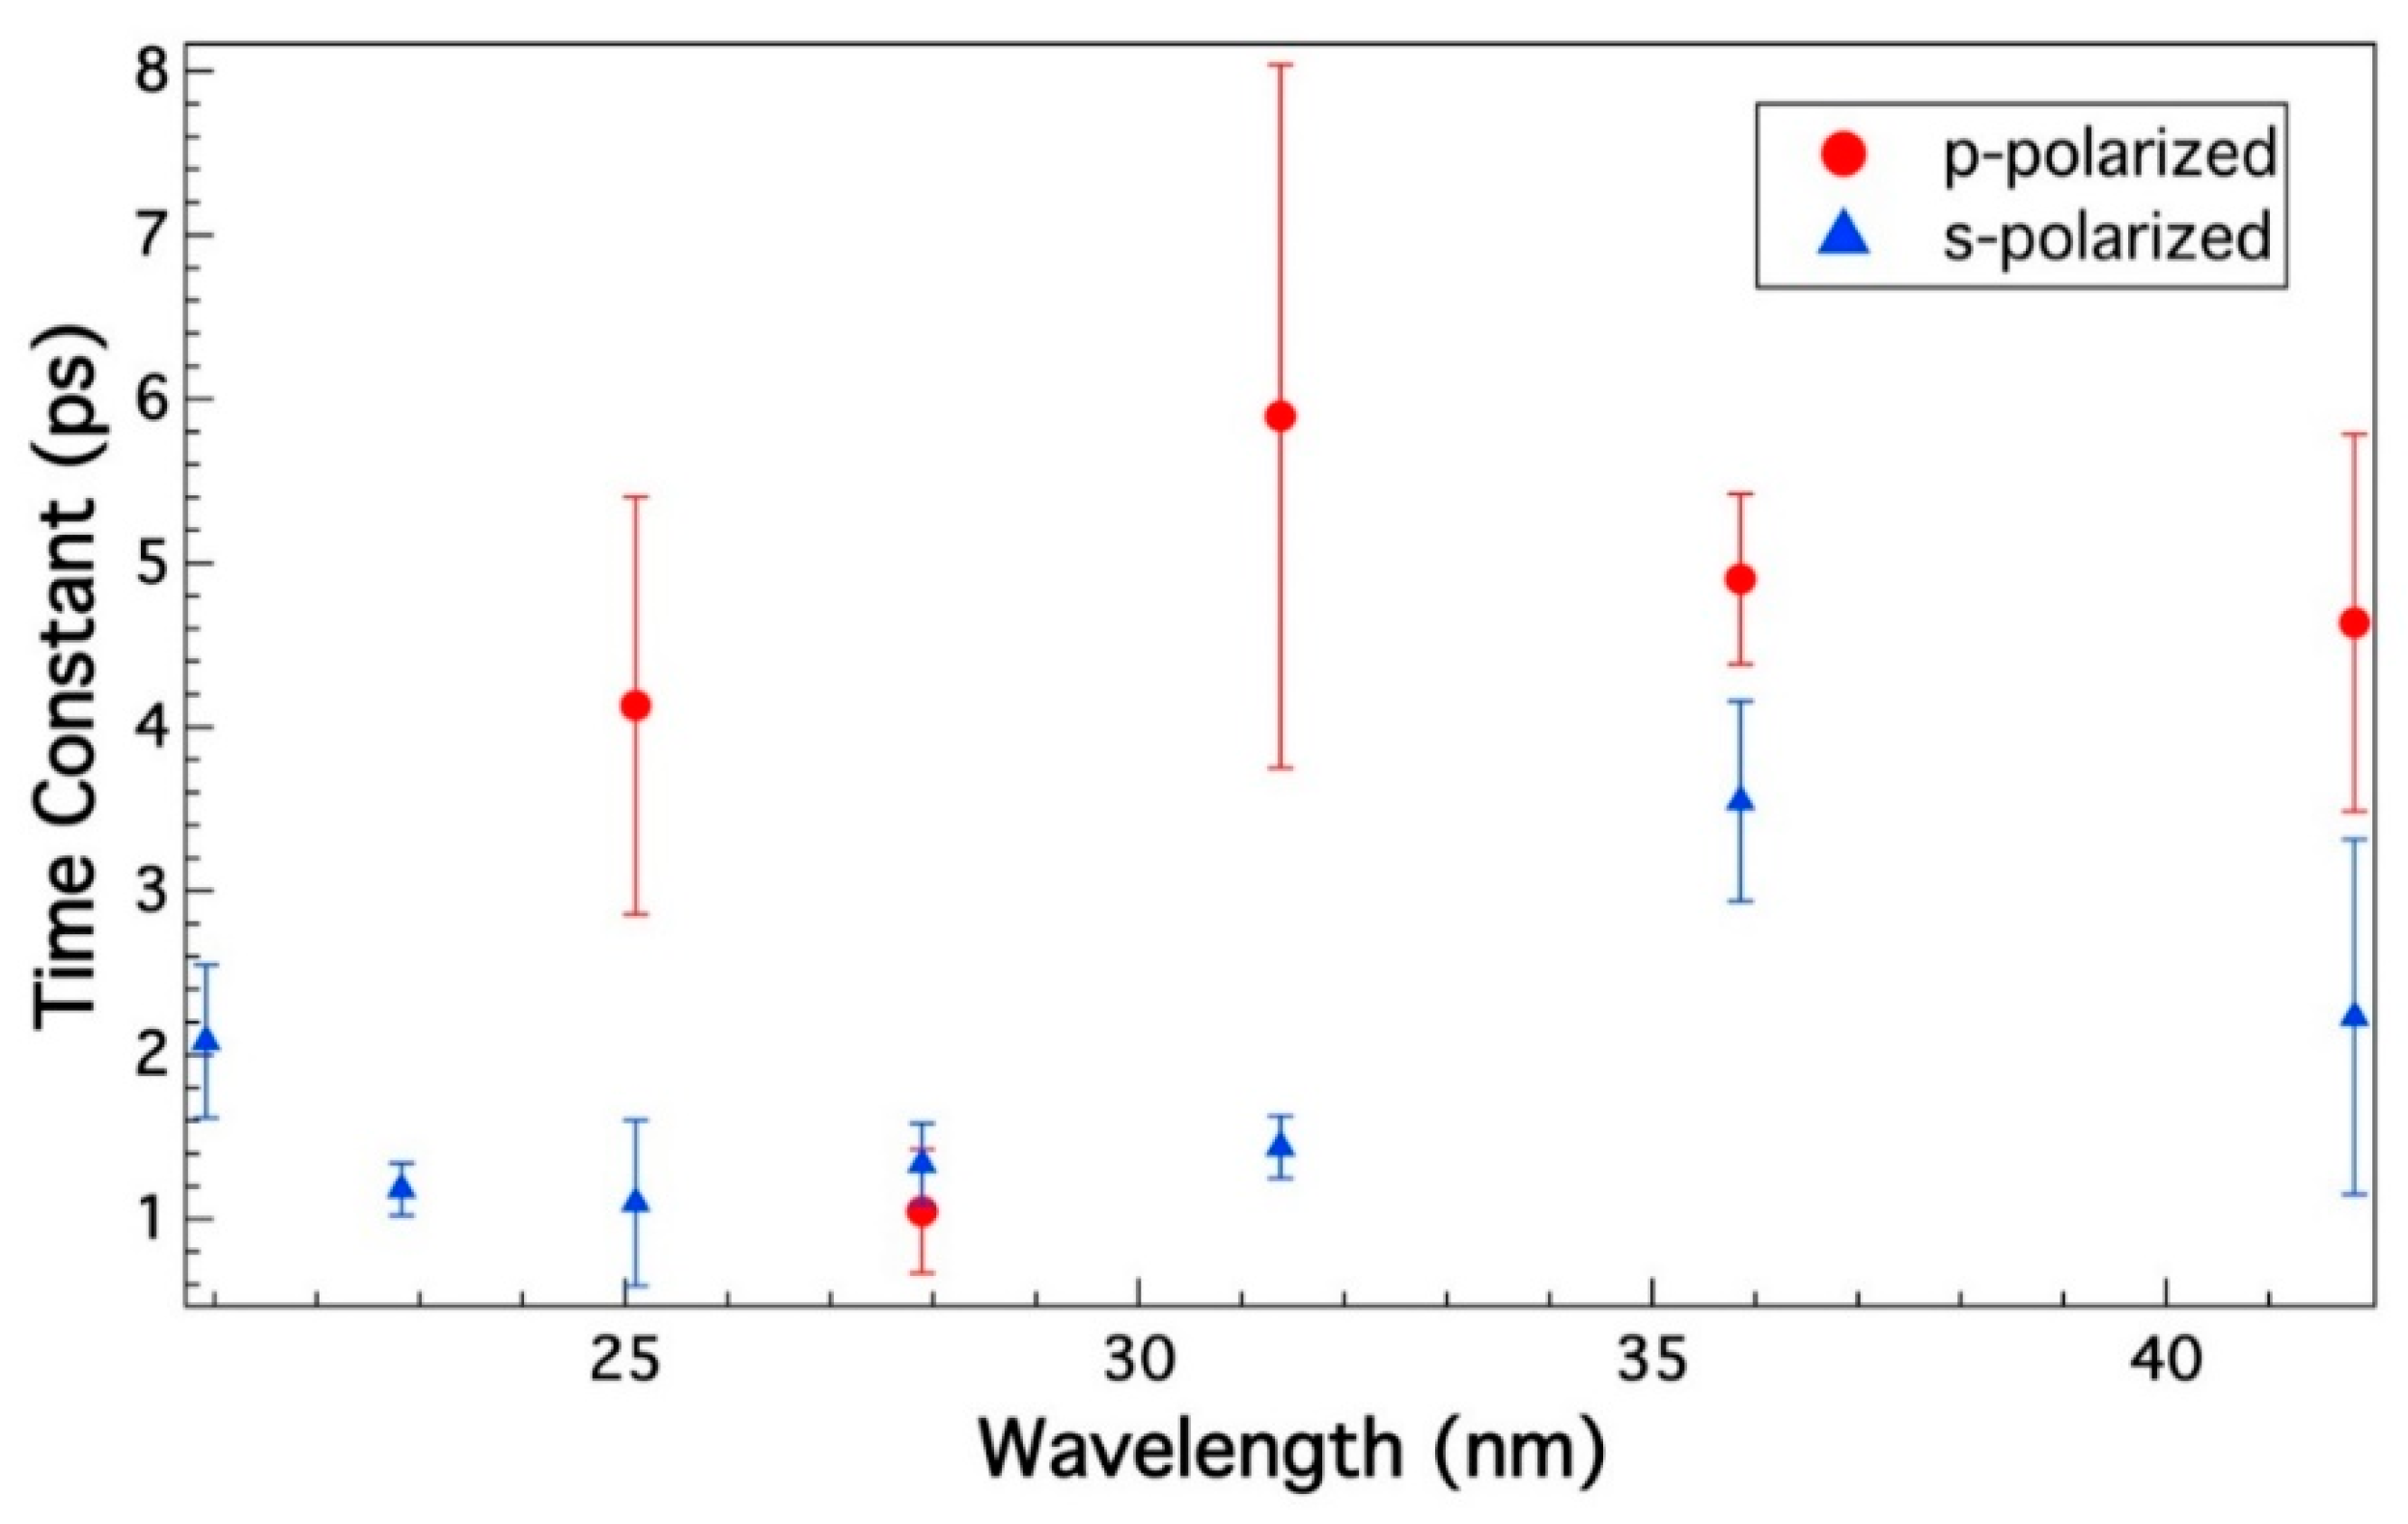
While s-polarization and p-polarization measurements both yield time constants that generally increase with increasing wavelength, a larger effect is found from switching from s-polarization to p-polarization. As shown in Figure 2, s-polarization has a time constant of ~1 ps, while p-polarization has a time constant of ~5 ps. Previous work estimated the plasma frequency to correspond to an energy < 5 eV, which is substantially below that of the probe energy [22]. However, at the longer probe wavelengths used here, the reflectivity should be higher which may lead to our observed change in time constant. The expected reflectivity changes are due to dynamics of the lattice, with s-polarization and p-polarization providing different probe depths [23]. The p-polarized data at 28 nm appears to be aberrant compared to the rest of the data, and we believe that it is due to random fluctuations.

3. Discussion

Transient EUV reflectivity exhibits markedly different trends then what is observed in the optical regime, which has a significantly faster reflectivity increase followed by a slow decay [14]. The optical results have been attributed to a large increase in free electron density, leading to a metallic-like surface, initially increasing the reflectivity, followed by the relaxation of the electrons and lattice expansion [24]. In contrast, EUV reflectivity is sensitive primarily to lattice dynamics, simplifying the interpretation.
Previous work has shown that the decay lifetime τ as a function of probe wavelength can be approximated assuming a constant surface expansion velocity at short times as
τ ( λ p r o b e ) = f λ p r o b e υ ¯
where f is a parameter depending on the probe polarization and the exact form of the density gradient, and υ ¯ is the velocity of the expanding surface [14,22,25]. This result implies that the time constant should increase linearly with the wavelength of the probe. This result can be used in conjunction with the simplification of the expression for a surface experiencing a shockwave (Equation (2)) to calculate the electronic temperature.
υ ¯ = 2 γ 1 ( Z K b T E M )     2 K b T E ( e V ) 10 4 m s
In this case, Z is the effective charge, T E is the electron temperature, M is mass of the carbon atom, and K b is the Boltzmann constant. Given the large scatter in the experimental data, when including all of the points and using the s-polarization f value of 0.6, an expansion velocity of 9.5 ± 1 nm/ps is obtained, substantially lower than both the previously determined 17 ± 4 nm/ps and the speed of sound in graphite 18 nm/ps [14,22,26]. However, due to the limited number of points and the large error bars, this value is sensitive to the removal of outlier points, and a value within error of the speed of sound can also be obtained. Using wavelengths between 22 and 32 nm, the expansion velocity is calculated to be 13 ± 0.5 nm/ps, within the error bars of the previous measurement. The p-polarized data are even more difficult to interpret, given the large scatter and error bars, but a value consistent with expansion at the speed of sound is reasonable. The calculated surface expansion velocity can then be used to calculate the electronic temperature, as detailed in Ref. [22]. While the surface temperature calculated from a fit of all data is closer to 0.4 eV than to the 0.8 eV value reported previously [22], the large scatter in the data indicates that a definitive assignment is not possible at present.
The large difference between s-polarization and p-polarization results in terms of decay time constant can be understood in terms of differences in what is being probed, as the p-polarization has a larger penetration depth [17,18], implying that it is actually sensitive to the underlying silicon substrate and related energy diffusion. However, expanding the films would make the experiment significantly harder to interpret as it would lead to a significantly less homogeneous phase of carbon.
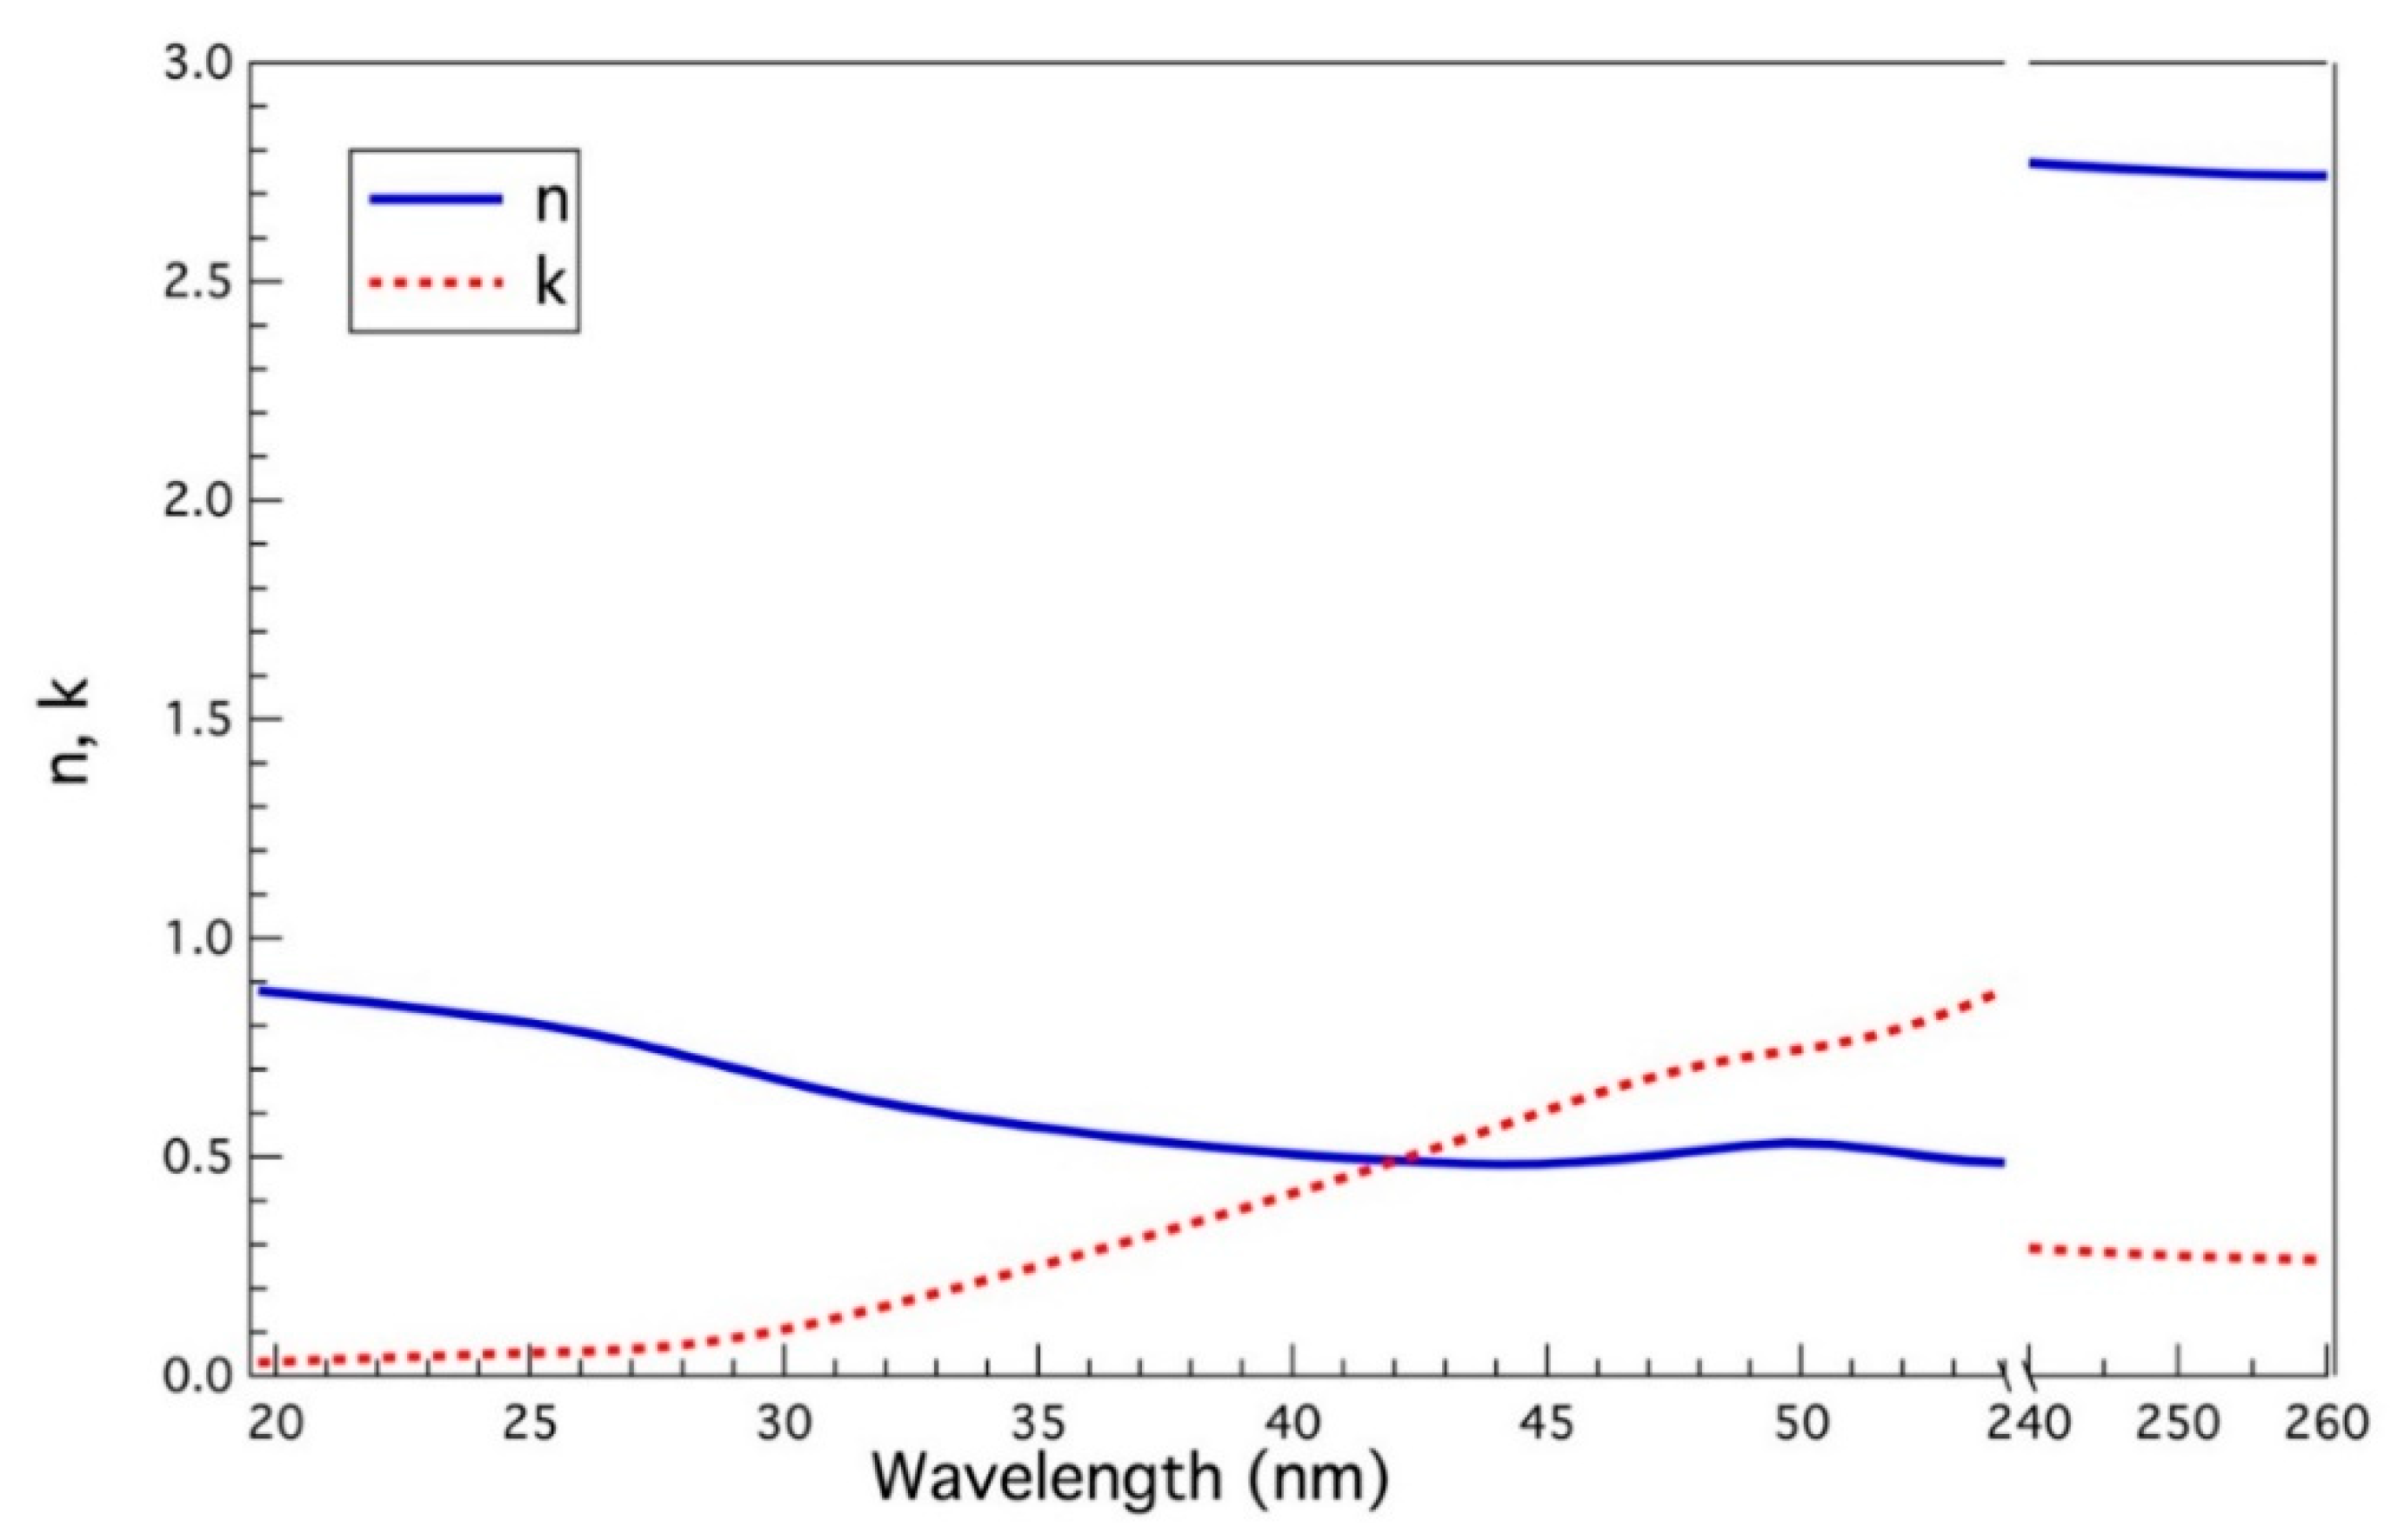
The real and imaginary optical constants corresponding to refractive index n and extinction coefficient k from an amorphous film are shown in Figure 3 [27]. Over the 20–45 nm range, the extinction coefficient (k) increases monotonically and the refractive index (n) decreases. While there is a noticeable increase in extinction as the probe length increases, it alone does not explain the observed data. The p-polarization data at 28 nm appear to be due to random fluctuations in the experiment.
In principle, it is possible to invert the reflectivity measurements to obtain n and k (the real and imaginary components of the complex index of refraction) from the Kramers–Kronig relation. However, given the quantity of data here, it was not possible to solve due to discontinuities related to solution hopping [28]. A direct solution of the real and imaginary parts of the optical constants would allow for the determination of reflectivity and transmission as a function of time, and given additional related experiments, temperature. This would effect a more detailed understanding of the physical properties of liquid carbon. While this can, in principle, be addressed by making large approximations, it is difficult to justify such approximations here.

4. Materials and Methods

The experimental setup has been detailed previously [22,29]. Briefly, at the EIS-TIMEX end-station, an optical pump pulse (251 nm, 130 fs, pulse energy ~35 µJ) focused to approximately 70 × 100 µm2 FWHM and an FEL pulse (very roughly 29–59 eV, pulse length ~70 fs, ~1 µJ) focused to 30 × 15 µm impinged upon a 100 nm amorphous carbon film of 2.1 g/cm3 density with roughness less than 1 nm, and oriented at approximately 40° relative to the pump pulse [19]. The fluence of the optical laser had a large variation and may be related to the noise in the observed signal. The FEL and optical pulses were divergent by approximately 10°, which was exploited to separate the beams and measure the reflected FEL intensity on an AXUV photo-diode (Opto-Diode) with a response time of significantly less than 0.1 s. The photodiode was shielded from the pump pulse and other stray radiation by a 100 nm thick Al foil. Polarization of the FEL has been characterized previously [30].
As the pump pulse damaged the sample, a series of FEL probe pulses were used to optimize the measurement:
(i)
Three FEL pulses well before the arrival (unpumped reflectivity);
(ii)
One value followed very shortly after the pump pulse (pump-probe);
(iii)
One value 100 ms after the pump pulse (post damage reflectivity).
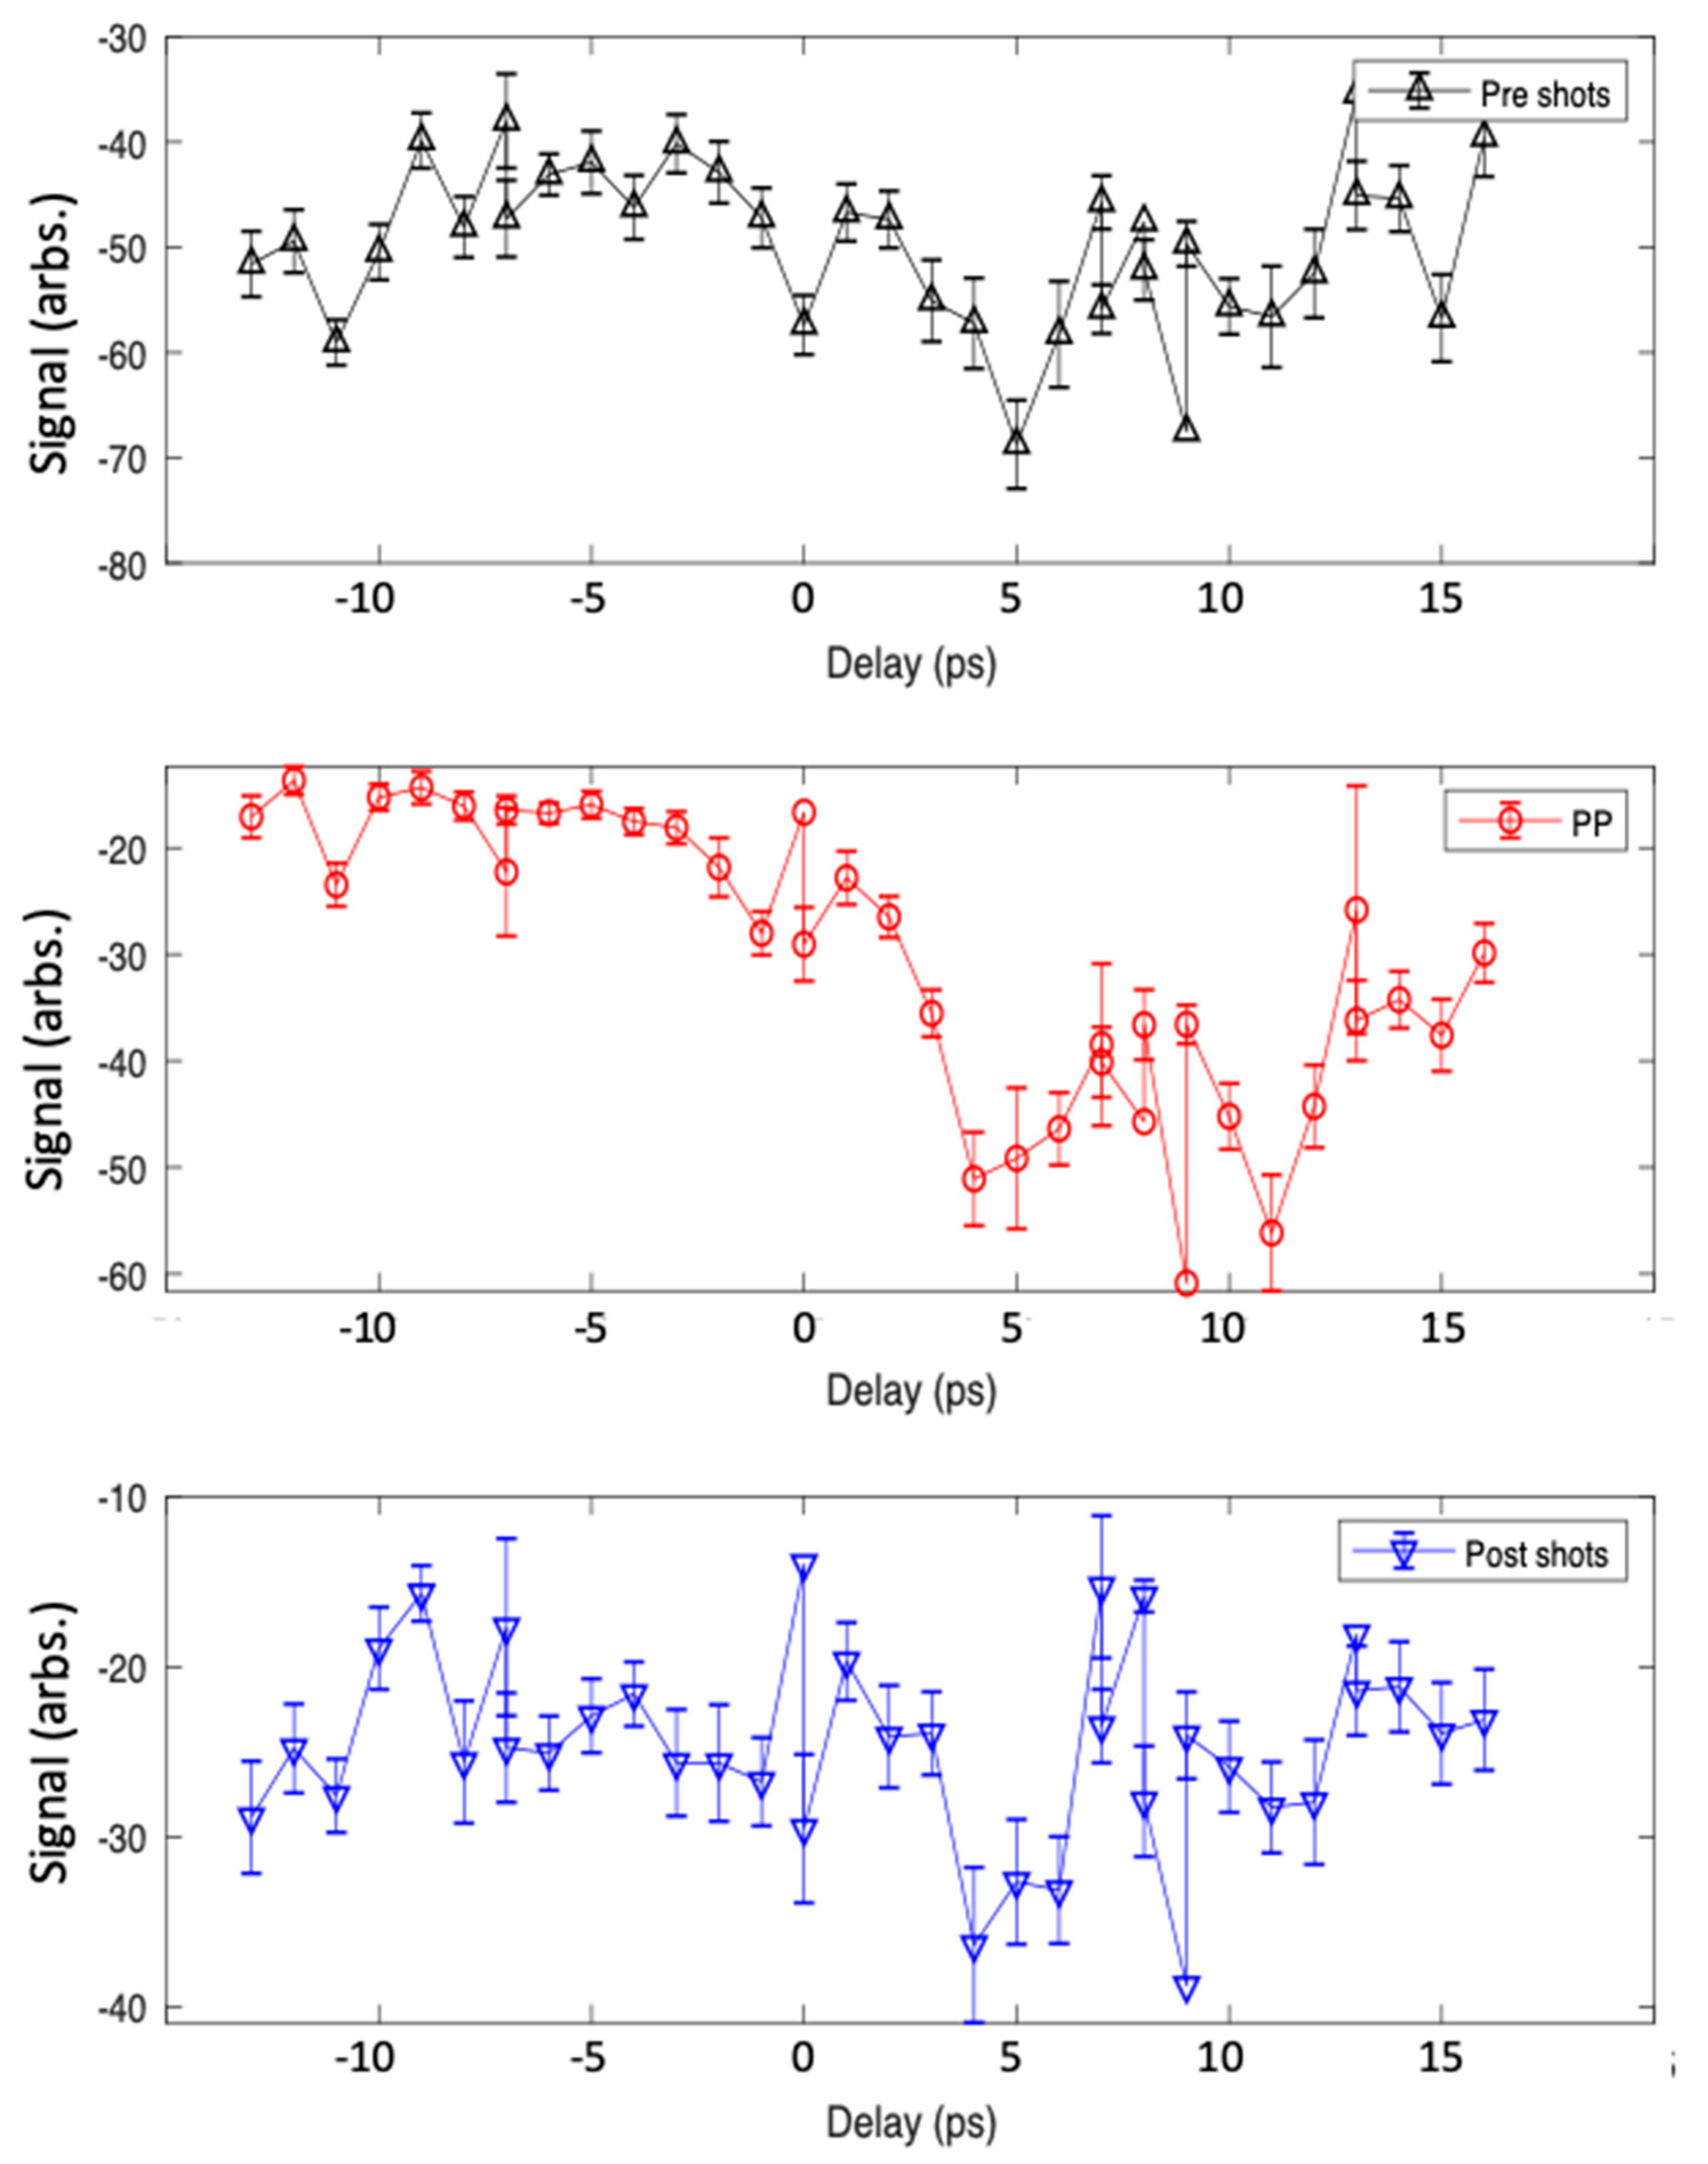
The sample was then rastered to a new spot and the sequence repeated. We observed no evidence of sample damage from step (i). Error bars are one standard-deviation. Shown in Figure 4 is the different reflectivity curves for the entire series of pump pulses with horizontal polarization at 41.83 nm.
The reflectivity observed as a function of delay was fit using the following empirical model:
{ A 0 t < 0 A e x p e t / τ + A 1 t       0
The dynamics studied are significantly slower than the pulse durations used in the experiment, so such a simple model is well justified.

5. Conclusions

Irradiation by intense ultrafast optical laser pulses causes a large decrease in the EUV reflectivity of amorphous carbon films. The process is significantly simpler than what is found with reflectivity in the optical regime, and is consistent with previous measurements, revealing a maximum electron temperature of 0.8 eV, while adding to the energy ranges and polarization dependence explored. The s-polarized FEL probe decays significantly faster (~1 ps) then the p-polarized (~5 ps) probe. The p-polarized FEL probe has a larger penetration depth and is thus sensitive to different dynamics than the s-polarized probe is. Ultimately, given additional data, it should be possible to completely invert the Kramers–Kronig relationship and solve for n and k.

Author Contributions

S.L.R., R.J.S. and C.P.S. prepared the manuscript, S.L.R., R.M., C.P.S. and R.J.S. discussed the data, R.M., S.L.R., C.M., and S.W.D. prepared the experimental set-up, R.M., S.L.R., E.P., F.B., L.F., A.G., A.S., G.K., and S.W.D. conducted the experiment, all the authors discussed the data analysis and revised the manuscript. All authors have read and agreed to the published version of the manuscript.

Funding

S.L.R. received a National Science Foundation Graduate Research Fellowship under Grant No. DGE 1106400. Any opinions, findings, and conclusions or recommendations expressed in this material are those of the author(s) and do not necessarily reflect the views of the National Science Foundation. R.J.S. and S.D. were supported by the Office of Science, Office of Basic Energy Sciences, Division of Chemical Sciences, Geosciences, and Biosciences of the U.S. Department of Energy at the Lawrence Berkeley National Laboratory under Contract No. DE-AC02- 05CH11231 (LBNL).

Acknowledgments

This work is supported by the U.S. Army Research Laboratory and the U.S. Army Research Office under grant number W911NF-13-1-0483 and No. W911NF-17-1-0163. The XFEL experiments were conducted at the EIS-TIMEX beamline at FERMI.

Conflicts of Interest

The authors declare no conflict of interest.

Abbreviations

FELFree electron laser
FWHMFull-width-half-maximum
EUVExtreme ultraviolet
a-CAmorphous carbon

References

  1. Bonse, J.; Wiggins, S.M.; Solis, J. Ultrafast phase transitions after femtosecond laser irradiation of indium phosphide. J. Appl. Phys. 2004, 96, 2628–2631. [Google Scholar] [CrossRef] [Green Version]
  2. Suess, R.J.; Bingham, N.S.; Charipar, K.M.; Kim, H.; Mathews, S.A.; Piqué, A.; Charipar, N.A. Ultrafast Phase Transition Dynamics in Strained Vanadium Dioxide Films. Adv. Mater. Interfaces 2017, 4, 1700810. [Google Scholar] [CrossRef]
  3. Mo, M.; Murphy, S.; Chen, Z.; Fossati, P.; Li, R.; Wang, Y.; Wang, X.; Glenzer, S. Visualization of ultrafast melting initiated from radiation-driven defects in solids. Sci. Adv. 2019, 5, eaaw0392. [Google Scholar] [CrossRef] [PubMed] [Green Version]
  4. Koenig, M.; Benuzzi-Mounaix, A.; Ravasio, A.; Vinci, T.; Ozaki, N.; Lepape, S.; Batani, D.; Huser, G.; Hall, T.; Hicks, D.; et al. Progress in the study of warm dense matter. Plasma Phys. Control. Fusion 2005, 47, B441–B449. [Google Scholar] [CrossRef] [Green Version]
  5. Vinko, S.M.; Ciricosta, O.; Cho, B.I.; Engelhorn, K.; Chung, H.-K.; Brown, C.R.D.; Burian, T.; Chalupský, J.; Falcone, R.W.; Graves, C.; et al. Creation and diagnosis of a solid-density plasma with an X-ray free-electron laser. Nature 2012, 482, 59–62. [Google Scholar] [CrossRef] [PubMed]
  6. Hull, C.J.; Raj, S.L.; Saykally, R.J. The Liquid State of Carbon. Chem. Phys. Lett. 2020, 749, 137341. [Google Scholar] [CrossRef]
  7. Hau-Riege, S.P.; Boutet, S.; Barty, A.; Bajt, S.; Bogan, M.J.; Frank, M.; Andreasson, J.; Iwan, B.; Seibert, M.M.; Hajdu, J.; et al. Sacrificial Tamper Slows Down Sample Explosion in FLASH Diffraction Experiments. Phys. Rev. Lett. 2010, 104, 064801. [Google Scholar] [CrossRef] [Green Version]
  8. Savvatimskiy, A.I. Measurements of the melting point of graphite and the properties of liquid carbon (a review for 1963–2003). Carbon 2005, 43, 1115–1142. [Google Scholar] [CrossRef]
  9. Whitley, H.D.; Sanchez, D.M.; Hamel, S.; Correa, A.A.; Benedict, L.X. Molecular Dynamics Simulations of Warm Dense Carbon. Contrib. Plasma Phys. 2015, 55, 390–398. [Google Scholar] [CrossRef]
  10. Johnson, S.L.; Heimann, P.A.; MacPhee, A.G.; Lindenberg, A.M.; Monteiro, O.R.; Chang, Z.; Lee, R.W.; Falcone, R.W. Bonding in Liquid Carbon Studied by Time-Resolved X-Ray Absorption Spectroscopy. Phys. Rev. Lett. 2005, 94, 057407. [Google Scholar] [CrossRef] [Green Version]
  11. Lomba, E.; López-Martín, J.L.; Anta, J.A.; Hoye, J.S.; Kahl, G. A theoretical approach to the tight-binding band structure of liquid carbon and silicon beyond linear approximations. J. Chem. Phys. 1997, 106, 10238–10247. [Google Scholar] [CrossRef]
  12. Brown, C.R.D.; Gericke, D.O.; Cammarata, M.; Cho, B.I.; Döppner, T.; Engelhorn, K.; Förster, E.; Fortmann, C.; Fritz, D.; Galtier, E.; et al. Evidence for a glassy state in strongly driven carbon. Sci. Rep. 2014, 4, 5214. [Google Scholar] [CrossRef] [PubMed] [Green Version]
  13. Bundy, F.P. Pressure-temperature phase diagram of elemental carbon. Phys. A Stat. Mech. Its Appl. 1989, 156, 169–178. [Google Scholar] [CrossRef]
  14. Reitze, D.H.; Ahn, H.; Downer, M.C. Optical properties of liquid carbon measured by femtosecond spectroscopy. Phys. Rev. B 1992, 45, 2677–2693. [Google Scholar] [CrossRef]
  15. Shin, T.; Teitelbaum, S.W.; Wolfson, J.; Kandyla, M.; Nelson, K.A. Extended two-temperature model for ultrafast thermal response of band gap materials upon impulsive optical excitation. J. Chem. Phys. 2015, 143, 194705. [Google Scholar] [CrossRef]
  16. Rämer, A.; Osmani, O.; Rethfeld, B. Laser damage in silicon: Energy absorption, relaxation, and transport. J. Appl. Phys. 2014, 116, 053508. [Google Scholar] [CrossRef] [Green Version]
  17. Fedosejevs, R.; Ottmann, R.; Sigel, R.; Kühnle, G.; Szatmari, S.; Schäfer, F.P. Absorption of femtosecond laser pulses in high-density plasma. Phys. Rev. Lett. 1990, 64, 1250–1253. [Google Scholar] [CrossRef] [Green Version]
  18. Milchberg, H.M.; Freeman, R.R. Light absorption in ultrashort scale length plasmas. J. Opt. Soc. Am. BJosab 1989, 6, 1351–1355. [Google Scholar] [CrossRef]
  19. Masciovecchio, C.; Battistoni, A.; Giangrisostomi, E.; Bencivenga, F.; Principi, E.; Mincigrucci, R.; Cucini, R.; Gessini, A.; D’Amico, F.; Borghes, R.; et al. EIS: The scattering beamline at FERMI. J. Synchrotron Radiat. 2015, 22, 553–564. [Google Scholar] [CrossRef]
  20. Danailov, M.B.; Bencivenga, F.; Capotondi, F.; Casolari, F.; Cinquegrana, P.; Demidovich, A.; Giangrisostomi, E.; Kiskinova, M.P.; Kurdi, G.; Manfredda, M.; et al. Towards jitter-free pump-probe measurements at seeded free electron laser facilities. Opt. Express 2014, 22, 12869–12879. [Google Scholar] [CrossRef]
  21. Allaria, E.; Diviacco, B.; Callegari, C.; Finetti, P.; Mahieu, B.; Viefhaus, J.; Zangrando, M.; De Ninno, G.; Lambert, G.; Ferrari, E.; et al. Control of the Polarization of a Vacuum-Ultraviolet, High-Gain, Free-Electron Laser. Phys. Rev. X 2014, 4, 041040. [Google Scholar] [CrossRef] [Green Version]
  22. Mincigrucci, R.; Principi, E.; Bencivenga, F.; Foglia, L.; Gessini, A.; Kurdi, G.; Simoncig, A.; Masciovecchio, C. Transient EUV Reflectivity Measurements of Carbon upon Ultrafast Laser Heating. Photonics 2017, 4, 23. [Google Scholar] [CrossRef] [Green Version]
  23. Tobey, R.I.; Siemens, M.E.; Cohen, O.; Li, Q.; Murnane, M.M.; Kapteyn, H.C.; Nelson, K.A. Ultrafast Extreme Ultraviolet Holography: Dynamic Monitoring of Surface Deformation. In Proceedings of the Ultrafast Phenomena XV; Corkum, P., Jonas, D.M., Miller, R.J.D., Weiner, A.M., Eds.; Springer: Berlin/Heidelberg, Germany, 2007; pp. 42–44. [Google Scholar]
  24. Meitzner, J.; Moore, F.G.; Tillotson, B.M.; Kevan, S.D.; Richmond, G.L. Time-resolved measurement of free carrier absorption, diffusivity, and internal quantum efficiency in silicon. Appl. Phys. Lett. 2013, 103, 092101. [Google Scholar] [CrossRef] [Green Version]
  25. Zel’dovič, J.B.; Rajzer, J.P.; Hayes, W.D. Physics of Shock Waves and High-Temperature Hydrodynamic Phenomena; Unabridged, unaltered republ. in 1 vol. of the 2-vol. work orig. publ. in Engl. in 1966 and 1967 by Acad. Press, New York. With new pref.; Dover Publ.: Mineola, NY, USA, 2002; ISBN 978-0-486-42002-8. [Google Scholar]
  26. Silva, S.R.P. Properties of Amorphous Carbon; The Institution of Engineering and Technology: London, UK, 2008; ISBN 978-0-86341-777-1. [Google Scholar]
  27. Larruquert, J.I.; Marcos, L.V.R.; Méndez, J.A.; Martin, P.J.; Bendavid, A. High reflectance ta-C coatings in the extreme ultraviolet. Opt. Express 2013, 21, 27537–27549. [Google Scholar] [CrossRef] [Green Version]
  28. Kuzmenko, A.B. Kramers–Kronig constrained variational analysis of optical spectra. Rev. Sci. Instrum. 2005, 76, 083108. [Google Scholar] [CrossRef] [Green Version]
  29. Mincigrucci, R.; Giangrisostomi, E.; Principi, E.; Battistoni, A.; Bencivenga, F.; Cucini, R.; Gessini, A.; Izzo, M.; Masciovecchio, C. Liquid Carbon Reflectivity at 19 nm. Photonics 2015, 2, 50–56. [Google Scholar] [CrossRef] [Green Version]
  30. Roussel, E.; Allaria, E.; Callegari, C.; Coreno, M.; Cucini, R.; Mitri, S.D.; Diviacco, B.; Ferrari, E.; Finetti, P.; Gauthier, D.; et al. Polarization Characterization of Soft X-Ray Radiation at FERMI FEL-2. Photonics 2017, 4, 29. [Google Scholar] [CrossRef] [Green Version]
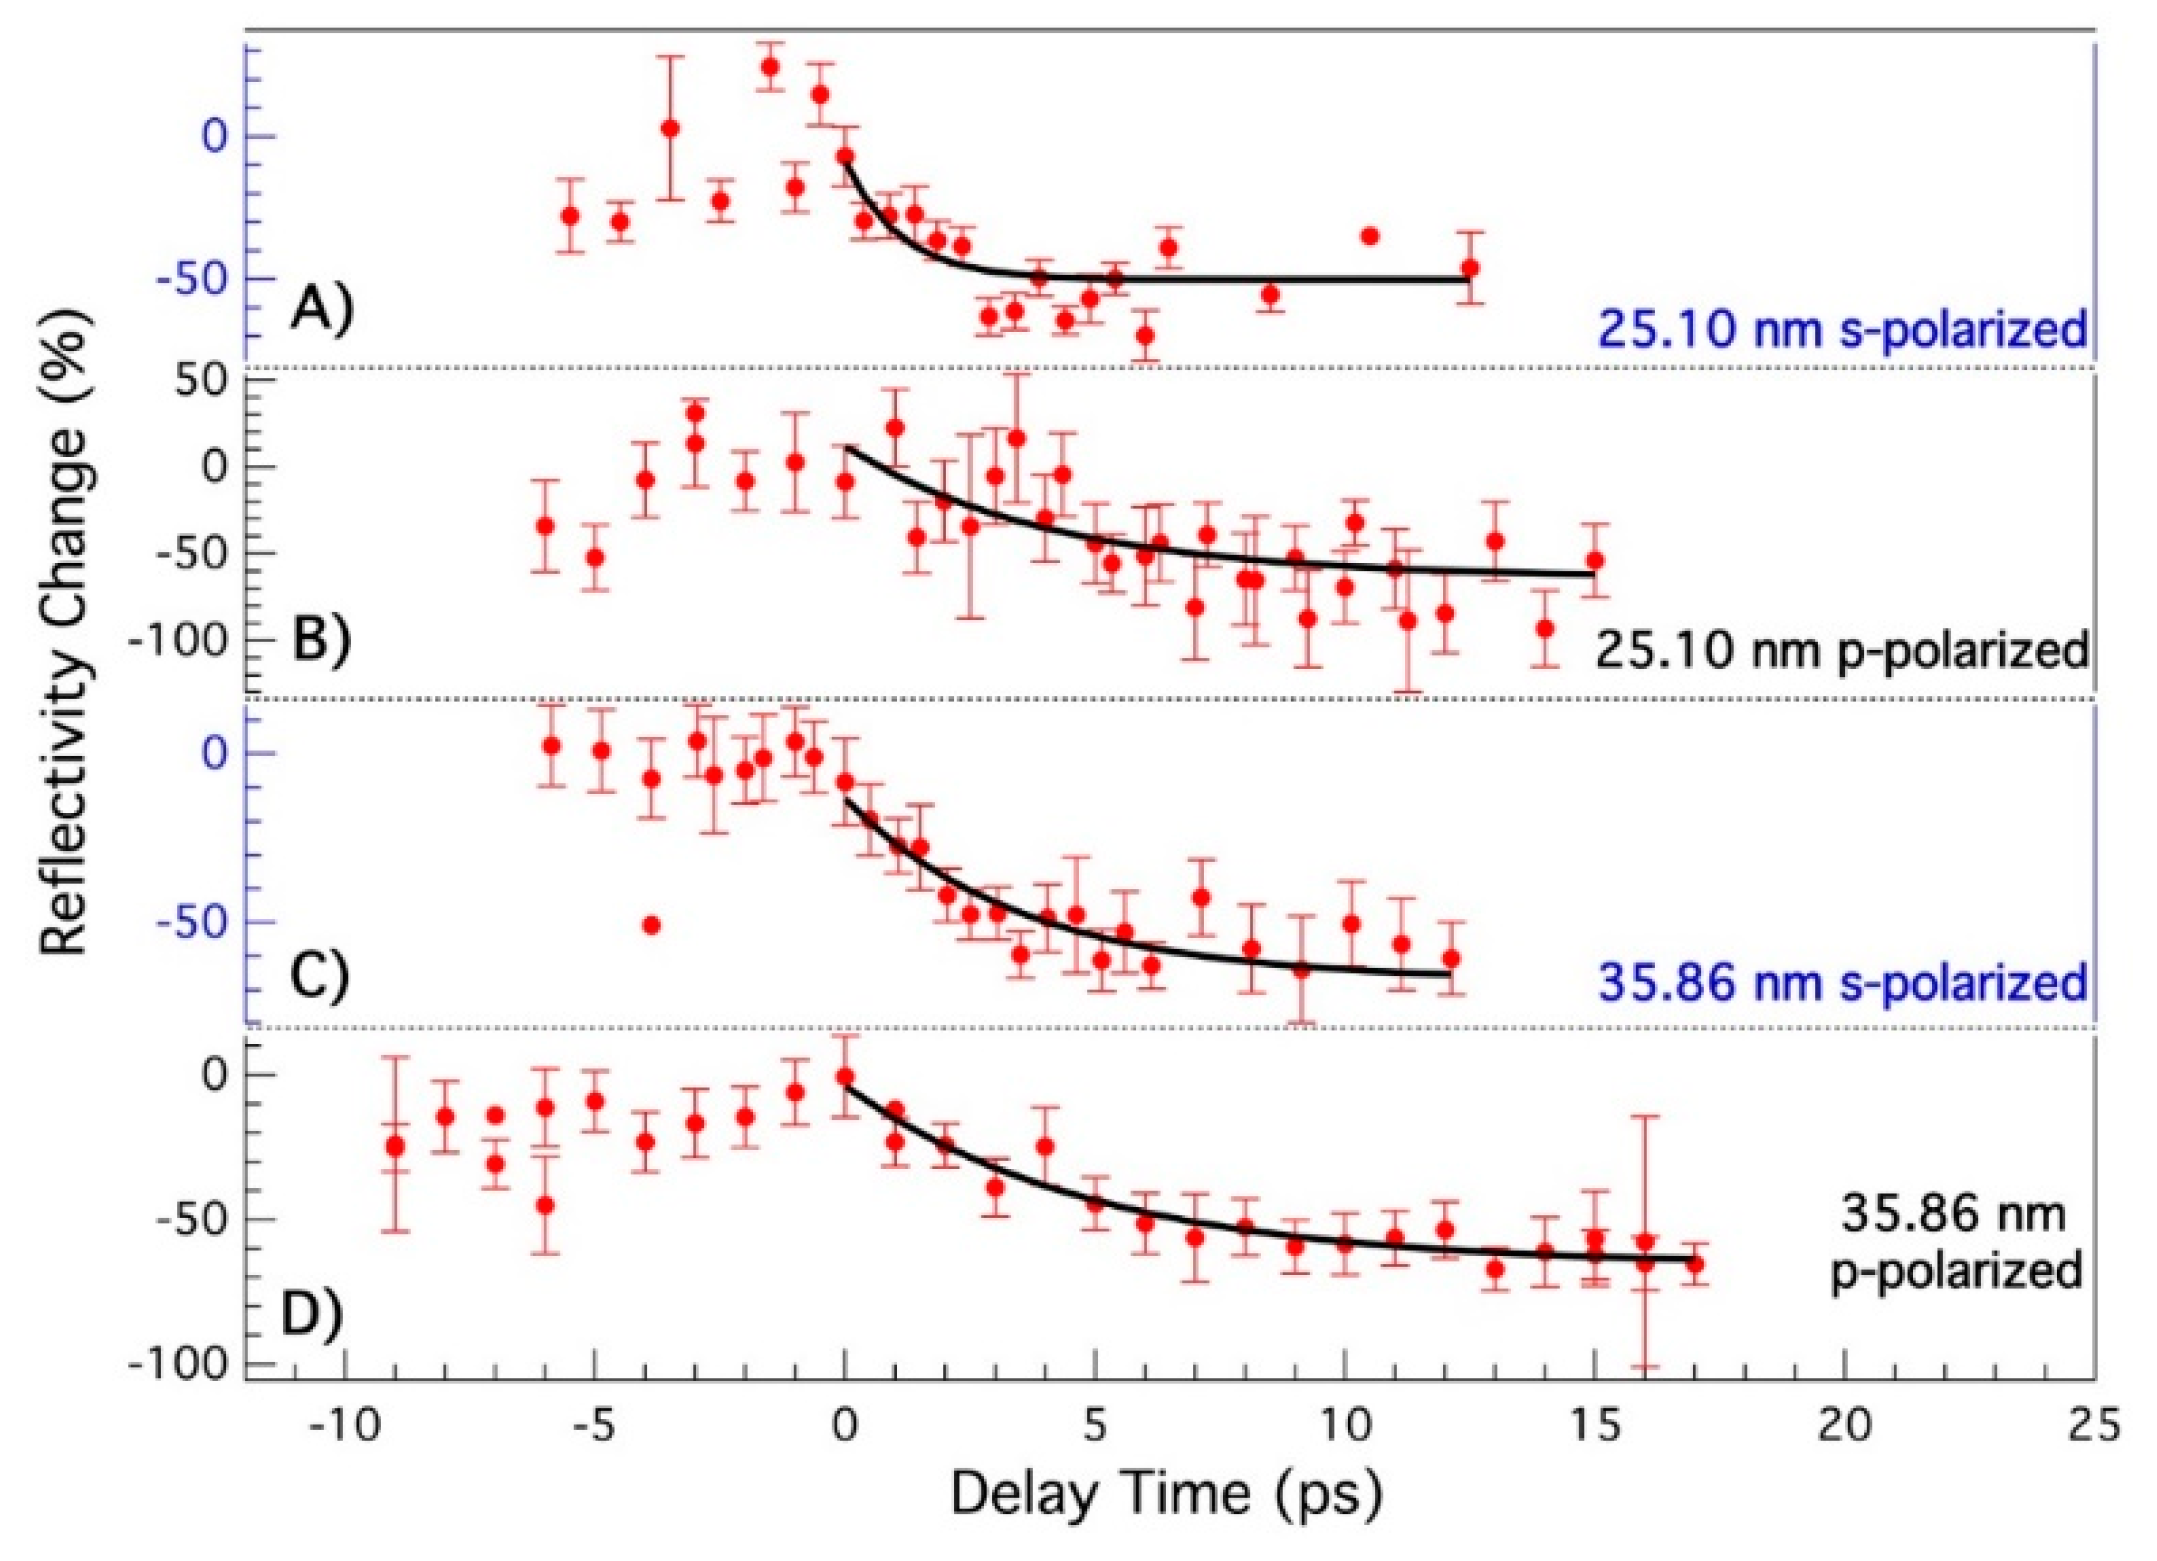
Figure 1. Reflectivity signal values as a function of delay time for 4 different combinations of wavelength and polarization, i.e.,: (A) 25.10 nm and s-polarization, (B) 25.10 nm and p-polarization, (C) 35.86 nm and s-polarization, (D) 35.86 nm and p-polarization. The solid blackline corresponds to the fit, while the red dots correspond to the experimentally measured signal.
Photonics 07 00035 g001
Figure 2. Decay time constants obtained from fitting the experimental data for p-polarized (red circles) and s-polarized (blue triangles) probe as a function of wavelength. The error bars correspond to the error in the fit.
Photonics 07 00035 g002
Figure 3. Values of the real (n, blue solid line) and imaginary optical constants (k, red dashed line) for an amorphous carbon thin film are shown for the relevant pump and probe wavelengths. Taken from [27].
Photonics 07 00035 g003
Figure 4. The reflectivity curves from a representative sample for 41.83 nm horizontally polarized light. The pre-shots (black triangles), pump-probe (red circles) and post-shots (blue triangles) corresponding to steps (i) (ii) and (iii), respectively. Only the pump-probe shows a large change in reflectivity on the timescale studied here.
Photonics 07 00035 g004