1. Introduction
Since the chaotic oscillation of a laser diode (LD) [
1,
2,
3,
4,
5,
6,
7] has a high frequency and broad bandwidth, its potential applications, such as physical random bit generation [
8,
9,
10,
11], reservoir computing [
12,
13,
14], decision-making [
15], and chaotic communication [
16,
17,
18,
19], have been widely studied. In these applications, more chaotic oscillation can contribute to increasing the performance, for example, randomness in random bit generation, a high bit rate in security in chaotic communication. Various methods of generating chaotic oscillation with a broad bandwidth and large chaotic property have been studied, for example, using a master–slave LD system with frequency detuning [
20,
21], an external feedback system with dual feedback [
22], or an external feedback system with random feedback [
23].
We previously proposed a method using a master–slave LD system with a random signal applied to the drive current of the LDs [
24]. In the optical injection system, which consists of master and slave LDs, various dynamics of the slave LD appear. For a small optical injection ratio, the slave laser oscillates stably, periodically or quasi-periodically. Then, the dynamics develop into a chaotic state with increasing optical injection ratio, and periodic oscillation is observed between chaotic states, which is called a “window”. In a window, the chaotic dynamics are concealed. We have shown numerically that the chaotic dynamics are revealed by applying a pseudorandom signal to the drive current of the master LD, and the chaotic property, that is, the orbital instability of the slave LD, is enhanced by increasing the standard deviation of the applied random signal. The orbital instability of a chaotic system can be controlled by applying a statistical random signal to a deterministic chaotic system.
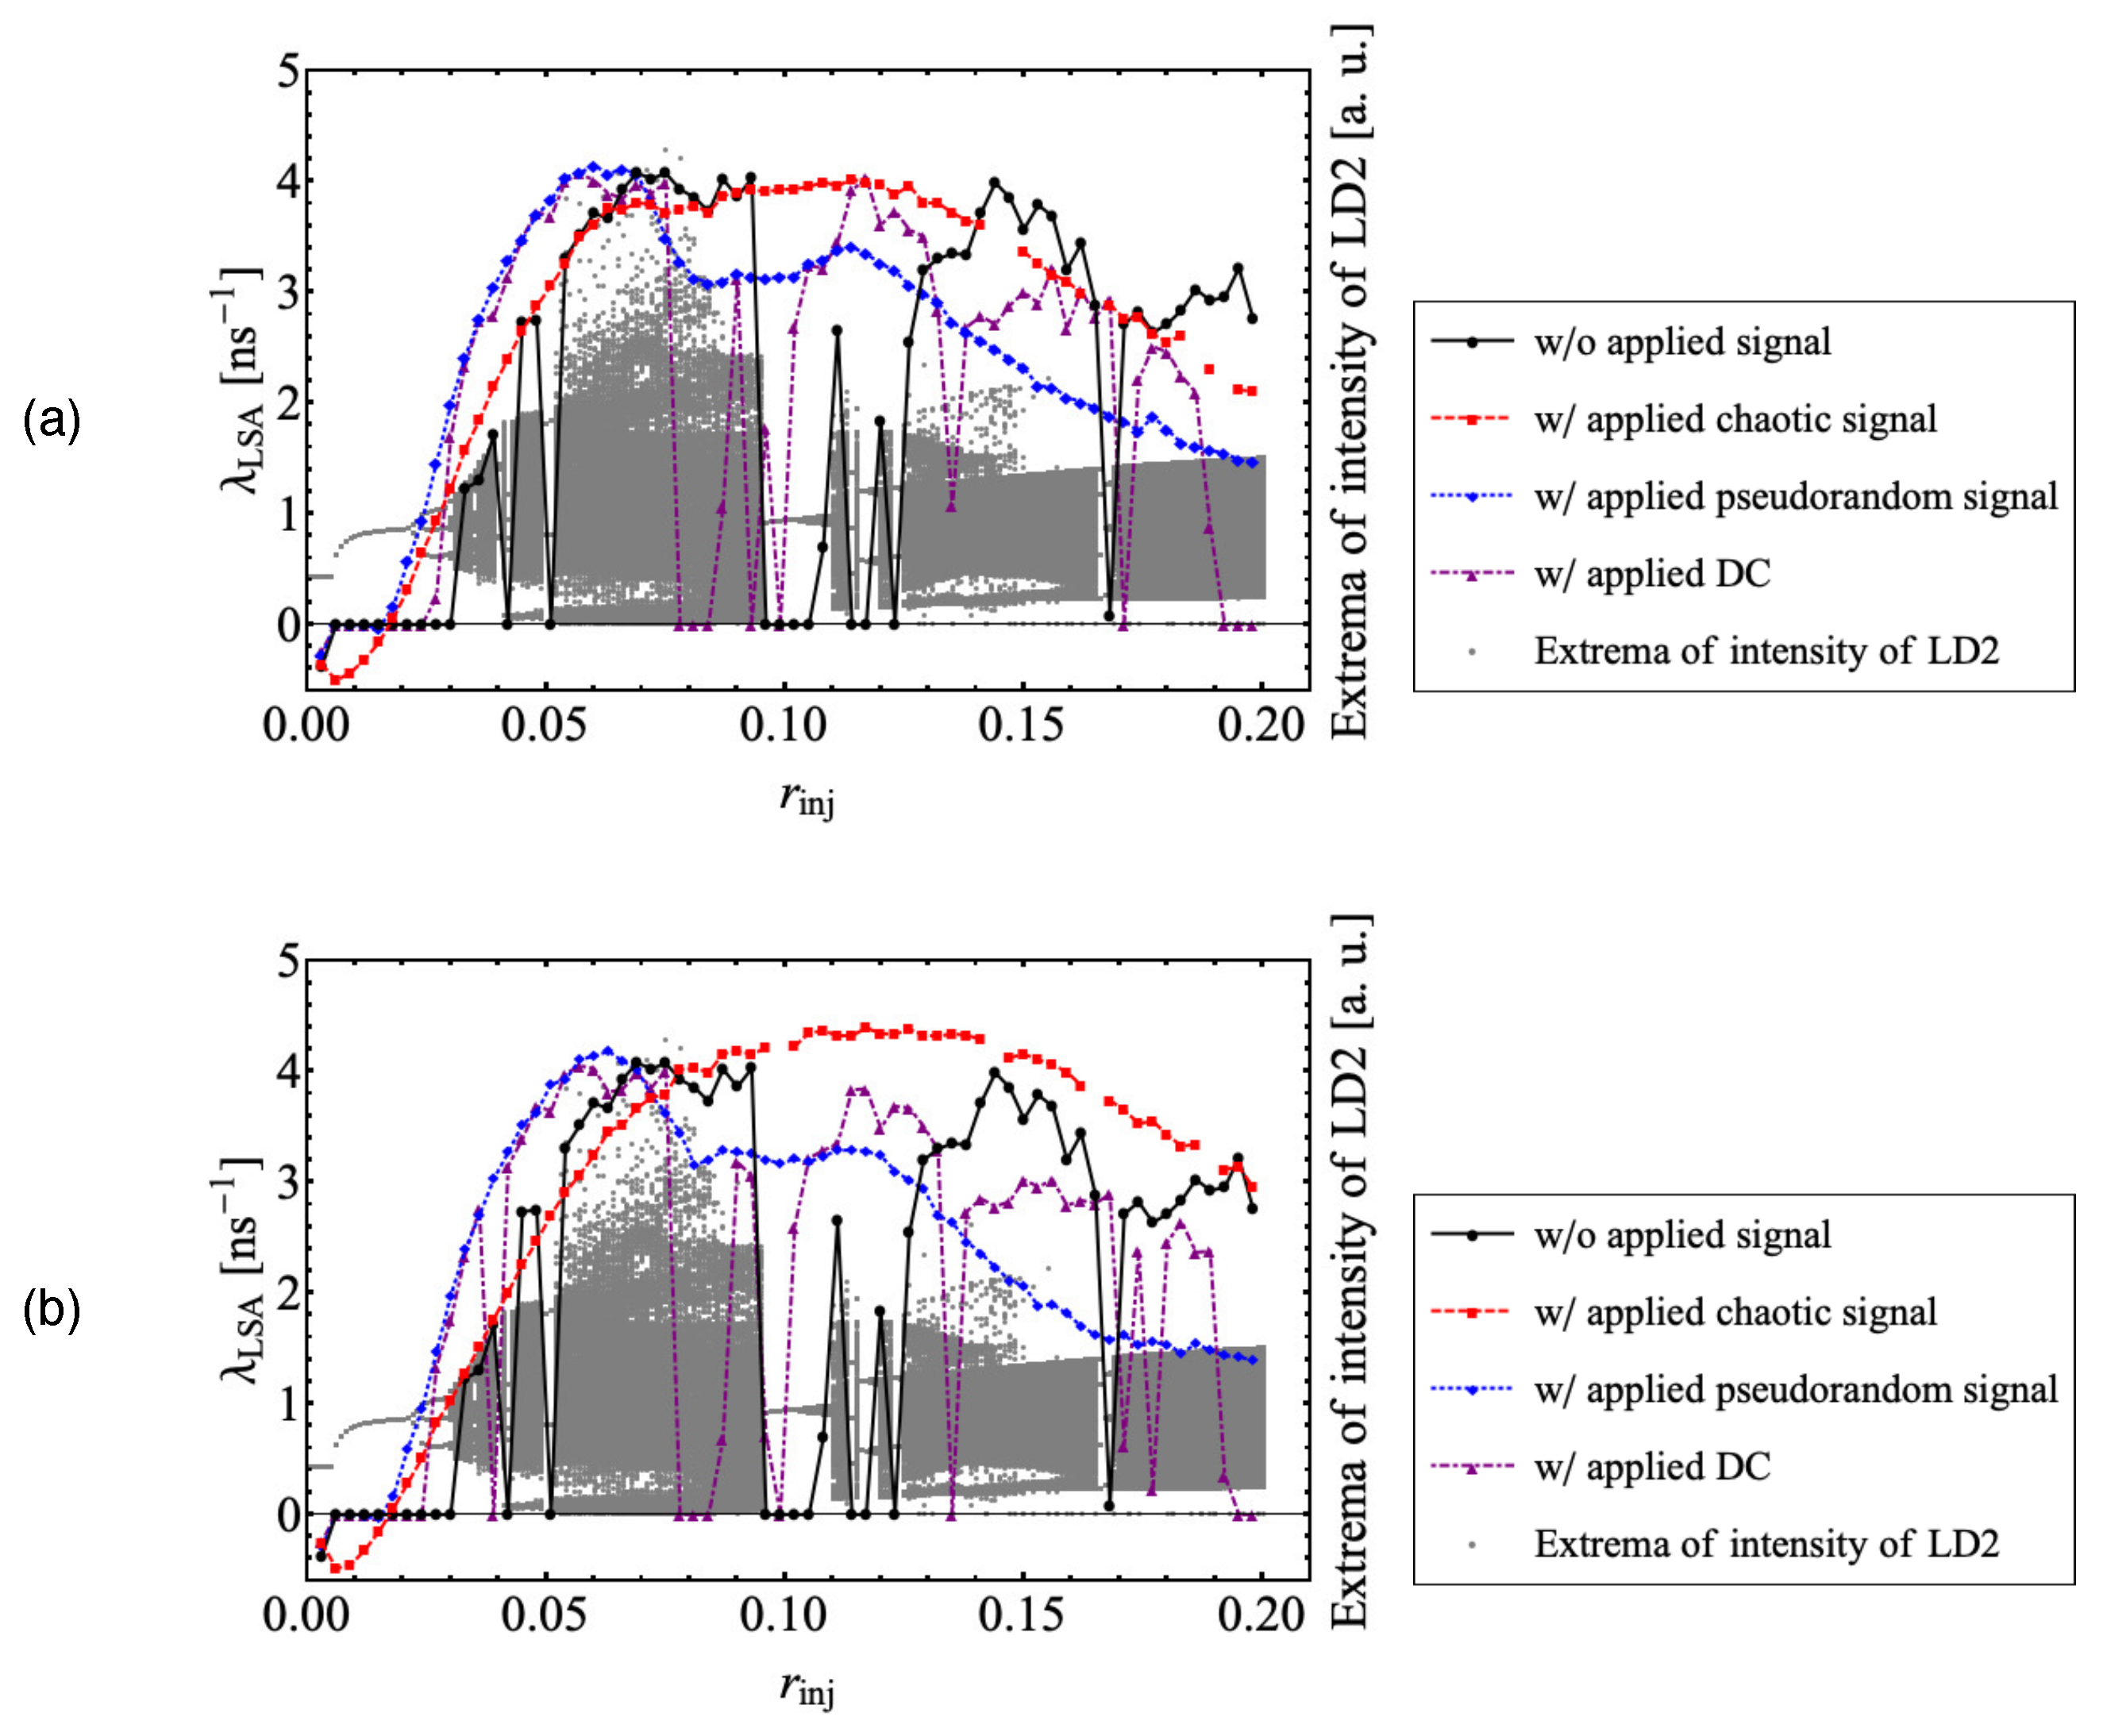
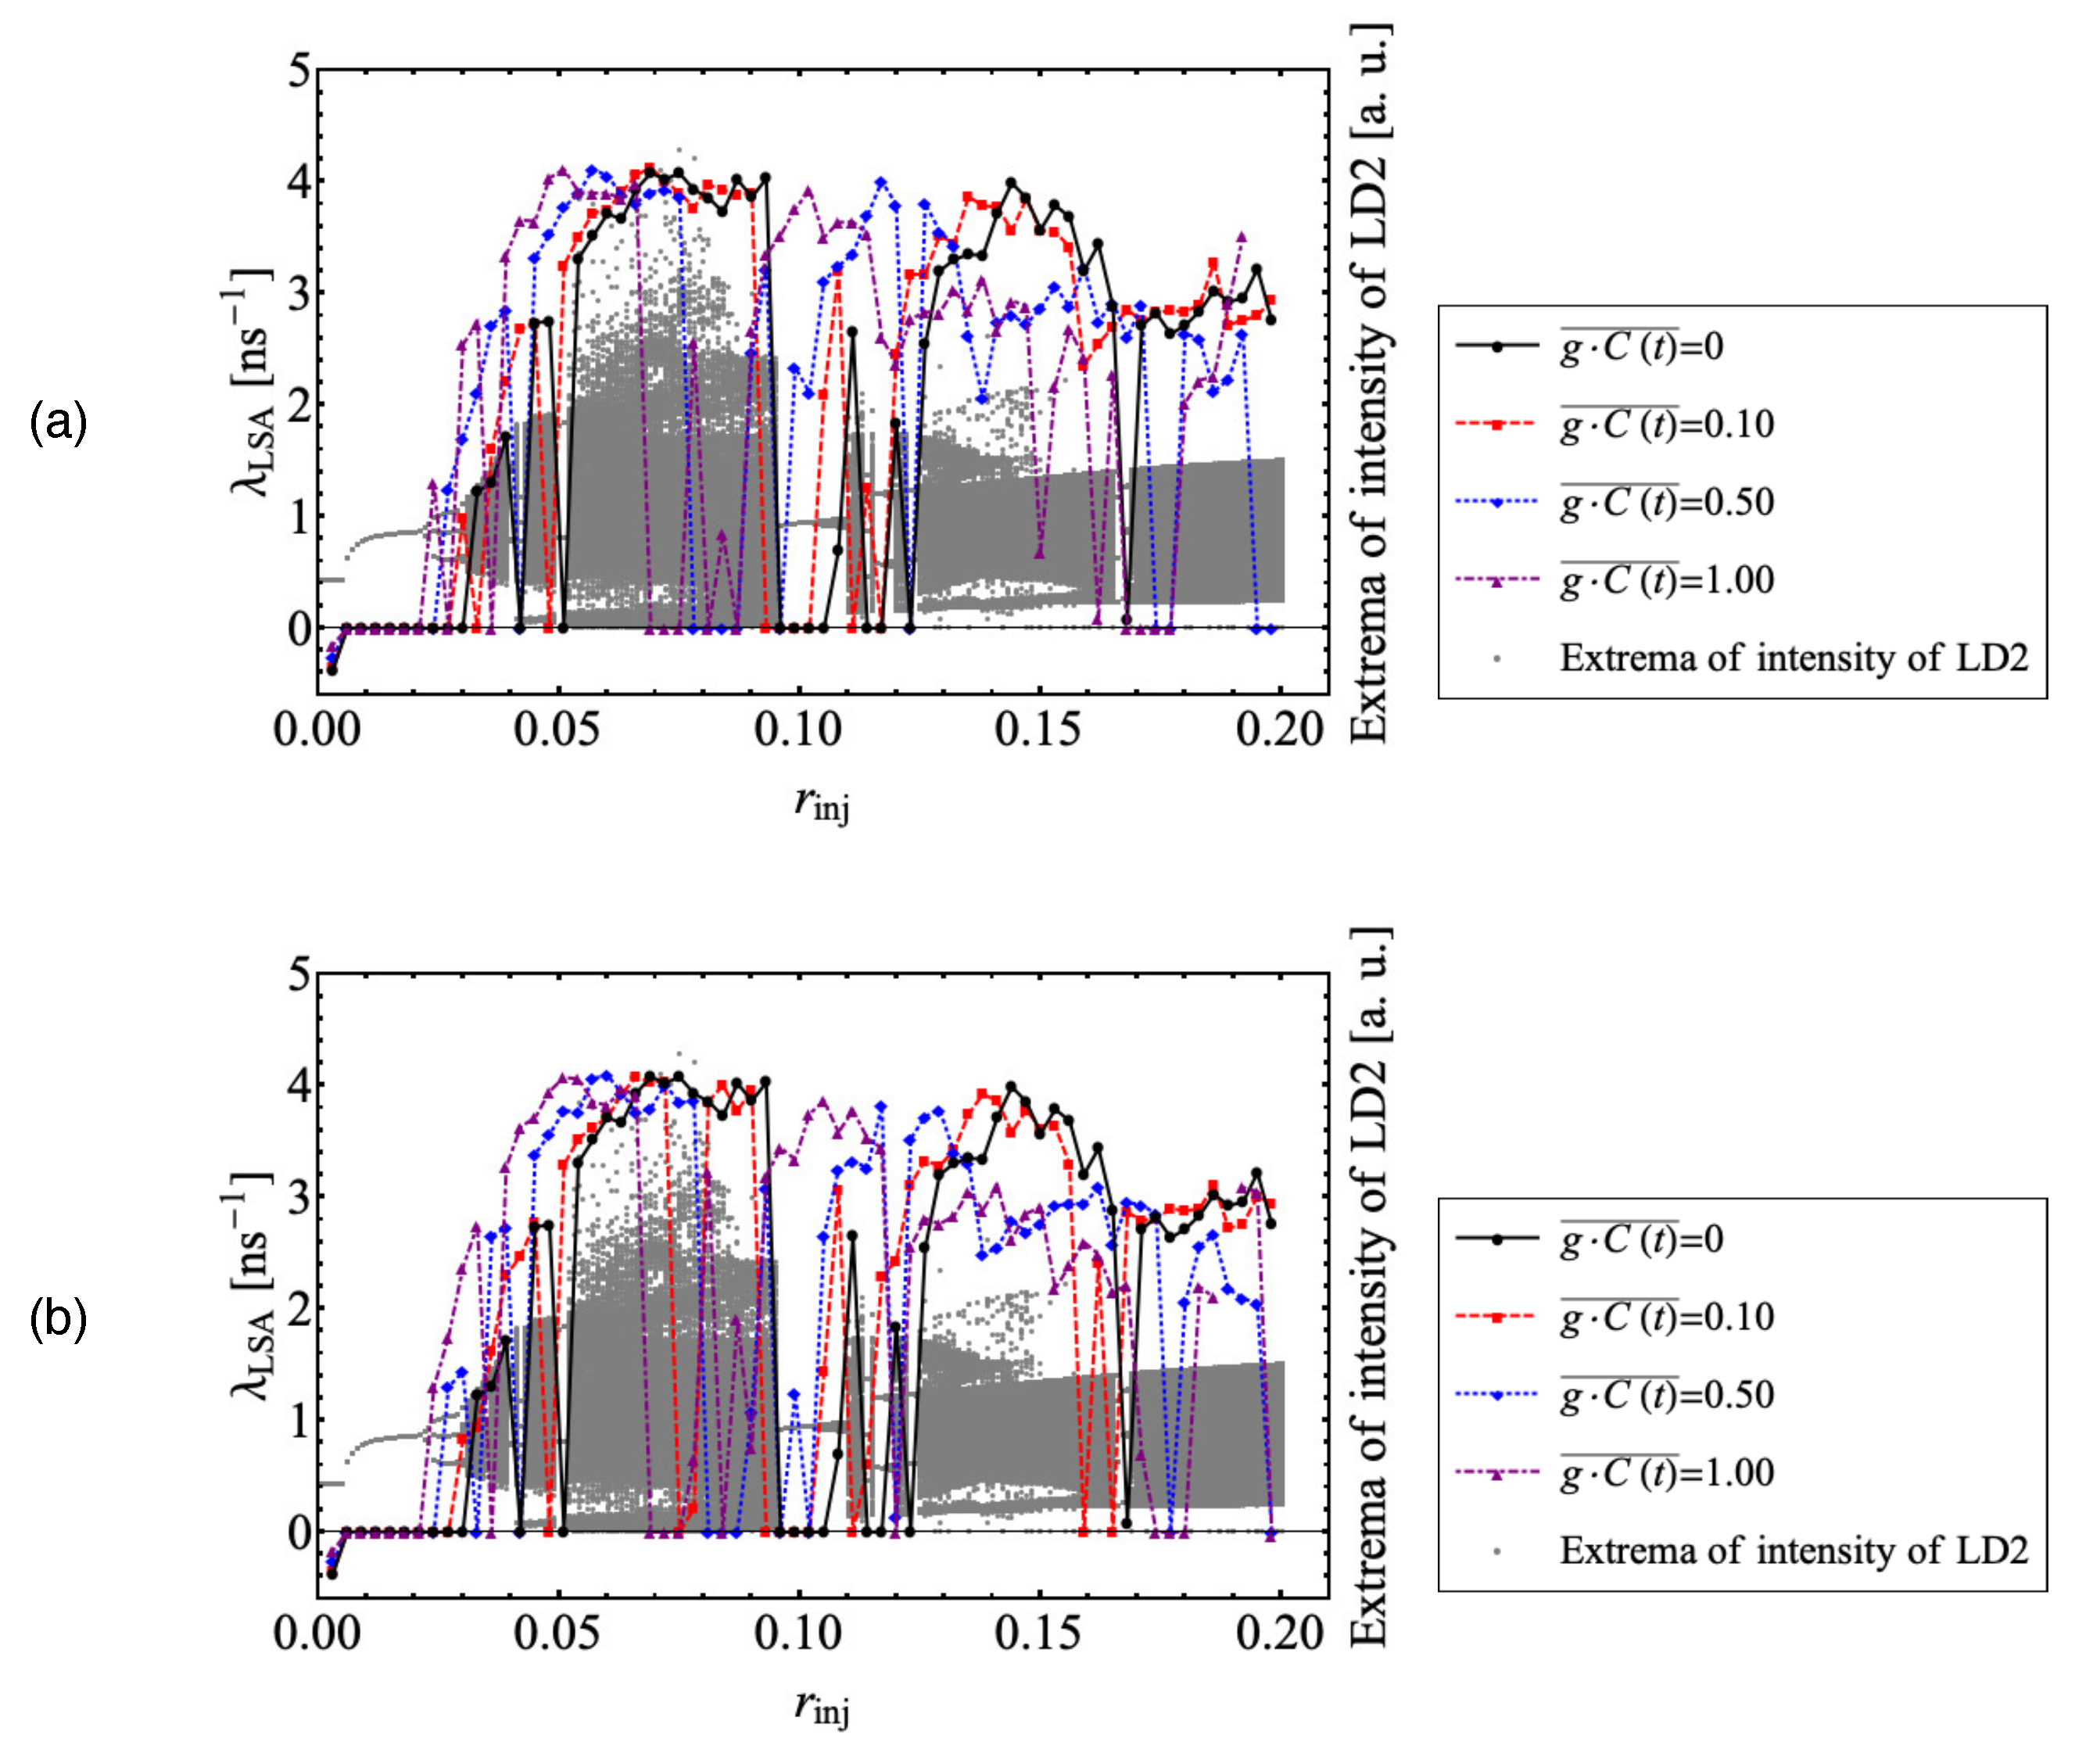
In this work, a deterministic chaotic signal is adopted as the applied signal. We numerically investigate an optical injection system with unidirectional coupling from a master LD to a slave LD by applying a signal, which is generated by the chaos source LD with external optical feedback, to the drive current of the master LD. First, we compare the system with an applied chaotic signal and the system with an applied random signal having the same mean and standard deviation as the chaotic signal. It is shown that, in the window, the chaotic dynamics of the slave LD are revealed by the applied chaotic signal as well as the applied pseudorandom signal. Moreover, the applied chaotic signal more greatly enhances the orbital instability of the slave LD than the applied pseudorandom signal. Next, to explore the factor causing the enhanced orbital instability of the slave LD, we estimate the orbital instability of the slave LD in terms of statistical and dynamical quantities of the applied chaotic signal. Then, we discuss the suitable conditions of the applied chaotic signal for enhancing the orbital instability of the LD system, and the chaos synchronization between the applied signal and LD system.
2. Chaotic Laser System and Lyapunov Exponent
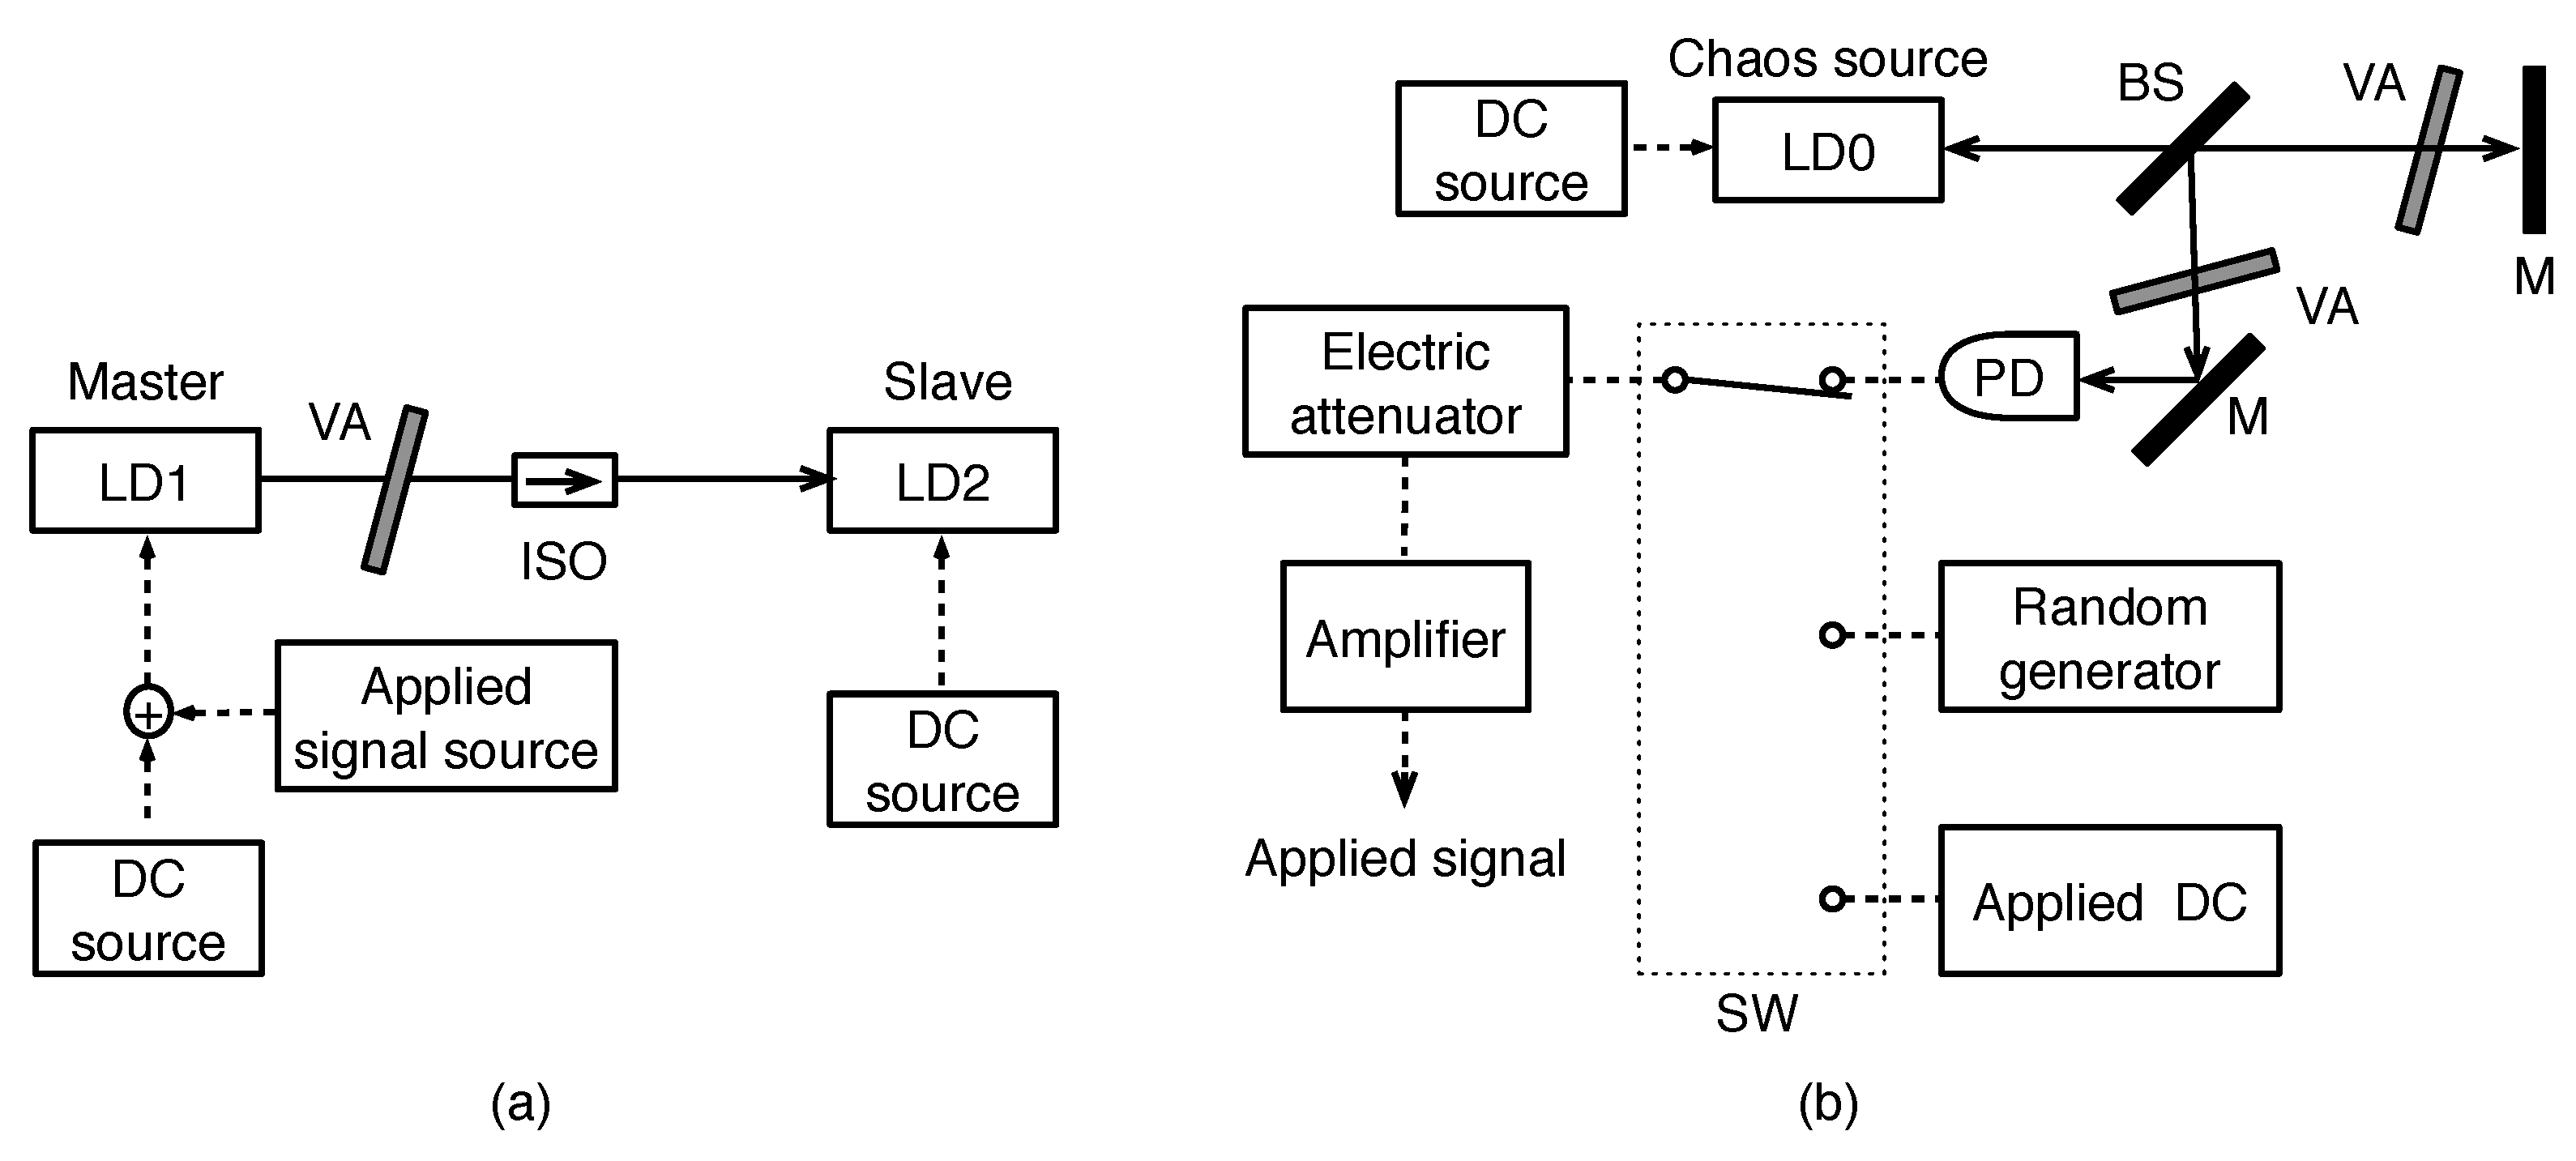
We consider the optical injection system consisting of two laser diodes (LDs), that is, a master LD (LD1) and a slave LD (LD2) in
Figure 1a, which are driven by a DC source. The optical coupling from LD2 to LD1 is restricted by an optical isolator (ISO) and the coupling ratio is controlled by a variable attenuator (VA). An external signal is electronically applied to the drive current of LD1, which is generated by an external applied signal source, and the amplification of the applied signal is controlled by a variable electric attenuator and an amplifier. In the following sections, we consider three kinds of applied signals, that is, a chaotic signal, a pseudorandom signal and a DC. The applied pseudorandom signal, and applied DC are generated by a signal generator, and the chaotic signal is generated by an external chaos source LD (LD0) with optical feedback whose ratio is controlled by VA (
Figure 1b). The chaotic signal is detected and converted into electric signal by a photo detector (PD). Since actual electric circuits have a frequency response and a cutoff frequency, impacts of the frequency band of the applied signal are needed to consider like Refs. [
24,
25]. In this work, we ignore the frequency response of the electric circuit to focus on the impacts of chaotic signal. The dynamics of LD0, LD1 and LD2 are described by the following rate equations [
26,
27]:
where
,
, and
are the amplitude, the phase of the laser field, and the carrier number above the value for the solitary LD, respectively. The subscripts 1, 2, and 0 denote LD1, LD2, and LD0, respectively.
is the differential optical gain,
is the linewidth enhancement factor,
is the carrier decay rate, and
is the cavity decay rate. The angular frequency of the solitary LD is described as
, where
c is the velocity of light and
is the wavelength. The drive current of the system without an applied signal is expressed as
.
Equations (1)–(3) describe the dynamics of LD1. The external signal is applied to ensure that the drive current of LD1 is above the threshold
, where
is the amplitude of LD0,
g is the amplification coefficient, and
represents the applied signal for LD1, which is normalized by the parameter
a. Equations (4)–(6) describe the dynamics of LD2, which has the optical injection from LD1. The second terms on the right side of Equations (4) and (5) describe the optical injection from LD1 to LD2.
and
are the amplitude and phase of the laser field injected into LD2 from LD1, respectively. Equations (7)–(9) describe the dynamics of LD0, which has the optical feedback. The second terms on the right side of Equations (7) and (9) describe the optical feedback for LD0.
and
are the amplitude and phase of the laser field fed back from the external cavity to LD0, respectively.
is the injection time from LD1 to LD2, and
is the round-trip time of the external cavity for LD0. The injection and feedback coefficients are expressed as
and
, respectively, where
is the injection ratio of the output injected into LD2 to the output of LD1,
is the feedback ratio of the output fed back from the external cavity to LD0, and
is the round-trip time in the inner cavity. In our simulation using the Runge–Kutta method, where the step size is
, the following values are assigned to the parameters, which are taken from Ref. [
26]:
,
,
,
,
,
,
,
,
,
and
. The initial values
and
are the convergent values of the solitary LD, and
is utilized. Then, the pseudorandom signal is generated by the Mersenne Twister random number generator [
28] and Box–Muller transform [
29].
In this study, the maximal Lyapunov exponent is estimated to quantify the orbital instability of the chaotic LD. We describe how to estimate the maximal Lyapunov exponent by linear stability analysis [
30,
31,
32]. When we estimate the Lyapunov exponent of LD2, the small variations
,
and
of the dynamic variables of Equations (4)–(6) from the reference orbit, respectively written as
,
and
, are considered. Since LD2 is the optical injection system,
,
, and
for LD2 satisfy
Here,
is the Jacobian matrix of order
, and is given in the
Appendix A. In this work, the time delay terms,
and
, are dealt with as external parameters since these parameters are not the dynamic variables of LD2 but those of LD1; in other words, the dynamics of LD2 is approximated using only three variables of LD2. On the other hand, when we estimate the Lyapunov exponent of LD0, since LD0 is the optical feedback system, the small variations
,
,
,
and
of Equations (7)–(9) from the reference orbit, respectively written as
,
,
,
and
, are considered. Then,
,
,
,
and
satisfy
where
is the Jacobian matrix of order
, and is given in the
Appendix A. These equations are calculated numerically using the Runge–Kutta method, where the step size is
, and the norm
is calculated by the method in Refs. [
33,
34]. The subscript
j indicates the time section
and the term in the square root is the summation in the range of
, where
indicates the injection time
for LD2 or the feedback time
for LD0. Since the norm between the chaotic orbit and the reference orbit is gradually large and the local approximation can not be used, we initialize and replace the small variation
,
and
with
,
and
, respectively, at intervals of
. The rate of increase in the norm is considered and the Lyapunov exponent is represented by
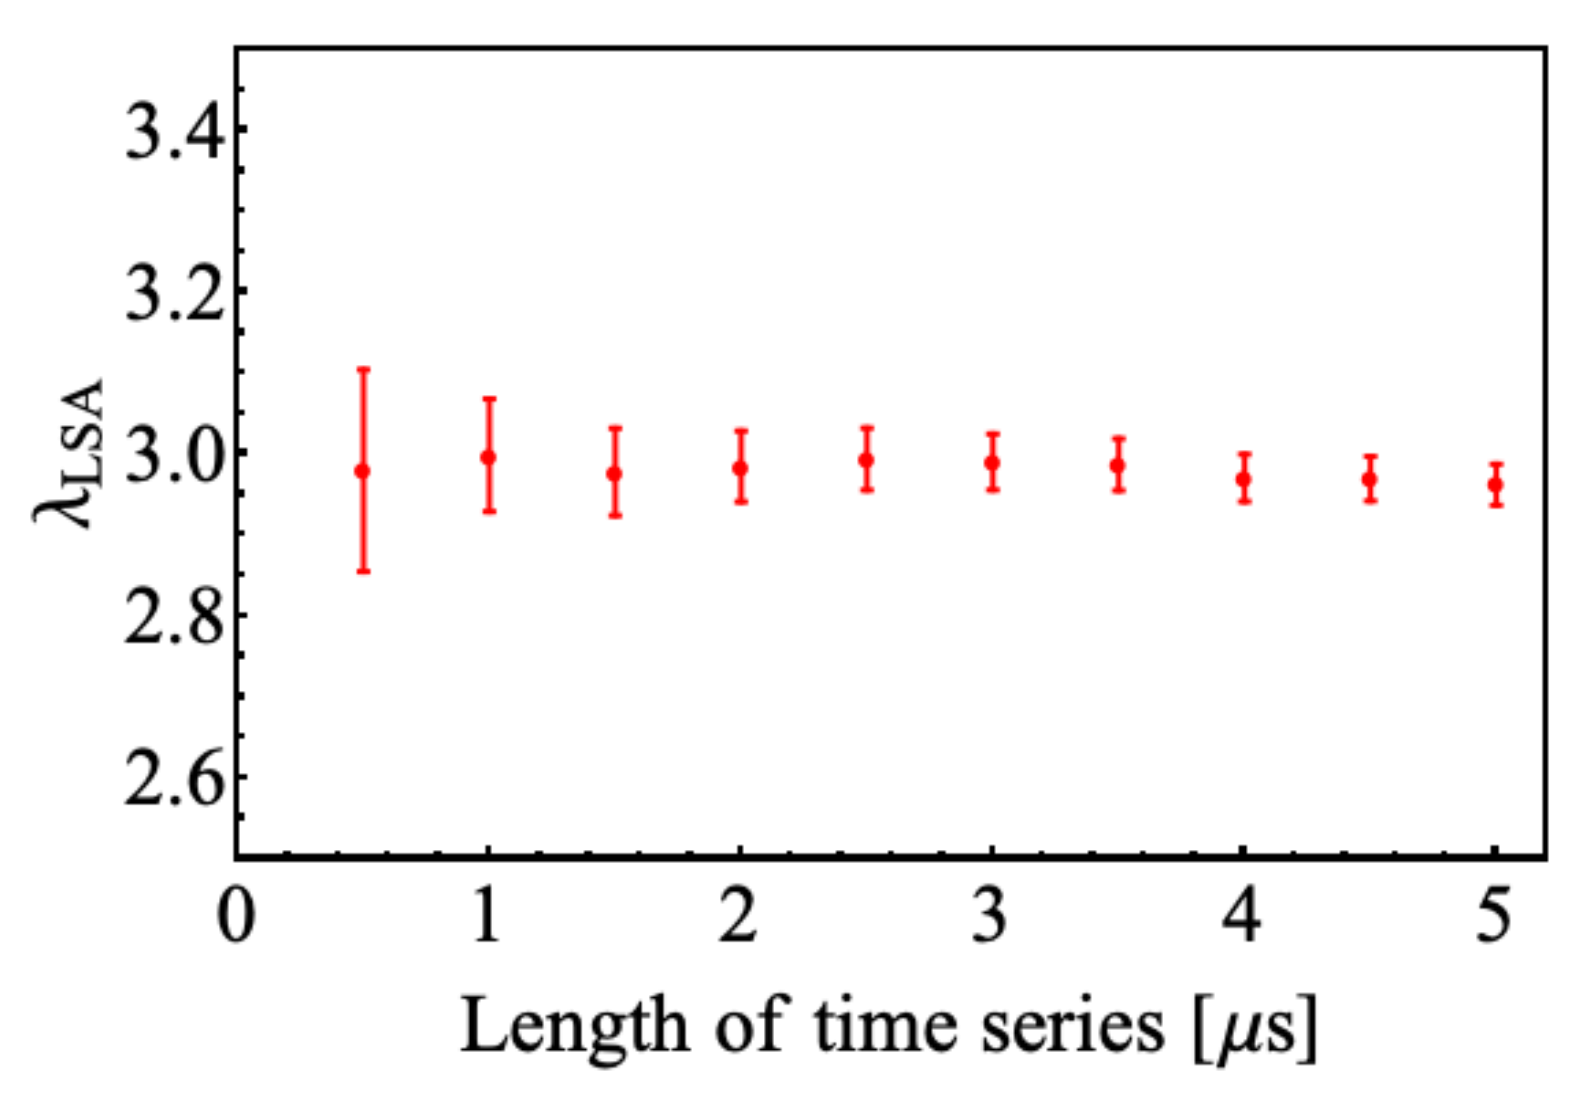
We use the discrete optical outputs
,
and
, which are sampled at intervals of 10 ps over 5 µs. Here, to show the robustness of
against initial conditions, we investigate
plotted against length of time series for the calculation of
. We consider the LD used in the figure of
Section 3.2, which has the parameters
and
as a typical example, and show the mean of
in
Figure 2. The error bars represent the standard deviations. The number of this population is a thousand and the initial value of
are given randomly in the range of
. As the length increases,
converges and the standard deviation sufficiently becomes small; for example, the standard deviation for 5 µs is 0.025. In this work, we adopt 5 µs as the length of time series, and the results shown in the following figures are not means but values which are obtained by a single calculation. Then, in the following numerical simulations, some
diverge when
or
and are not shown in the following figures.
4. Orbital Instability against Statistical and Dynamical Quantities of Applied Signal
First, we study the applied chaotic signal, which is generated by LD0 with optical feedback.
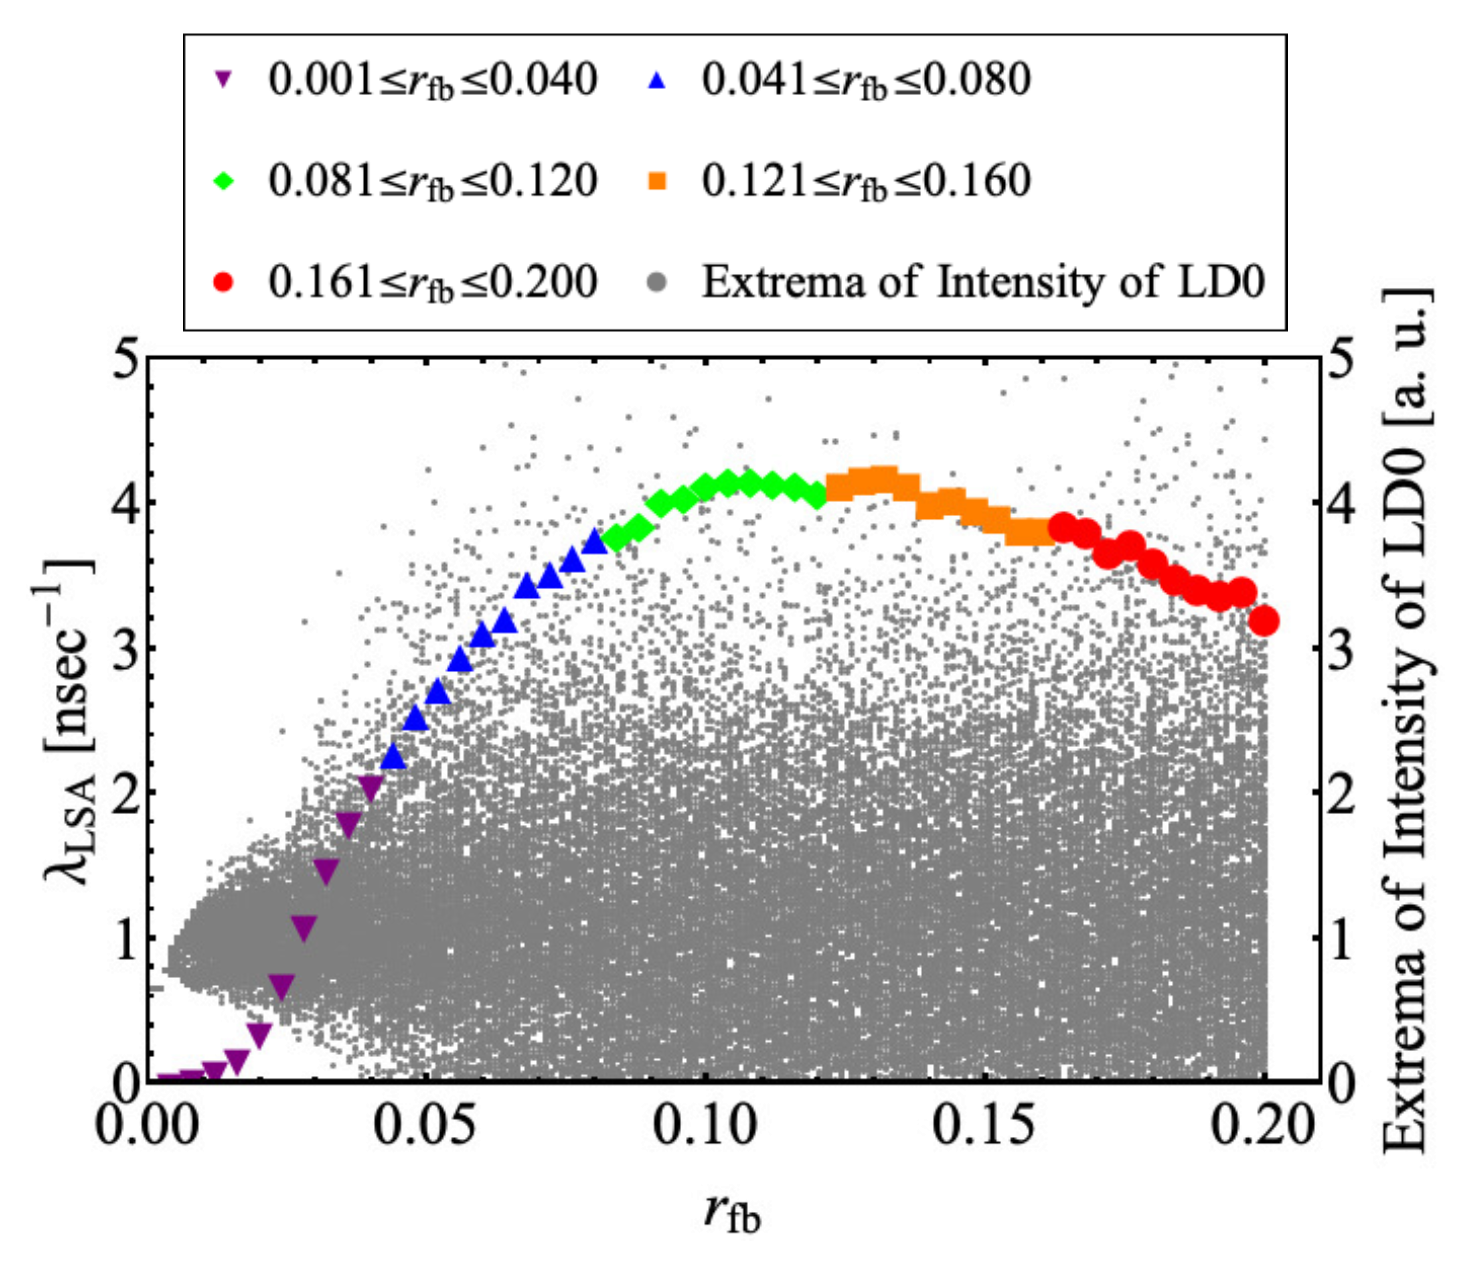
Figure 6 shows the extrema of the intensity of LD0 and the Lyapunov exponent
plotted against the optical feedback ratio
. Different symbols are used for different ranges of
, that is, purple down-pointing triangles, blue up-pointing triangles, green diamonds, orange squares, and red circles indicate
for
,
,
,
and
, respectively. In the range of
, the fluctuation of the intensity is small and
is small. With increasing
,
inceases for
and gradually decreases for
.
Next, we study the orbital instability of LD2 with the applied chaotic signal for statistical and dynamical quantities of the applied chaotic signal to show the characteristics of the applied chaotic signal that can control the orbital instability of LD2. The maximal values of
of LD2 in the range of
for certain
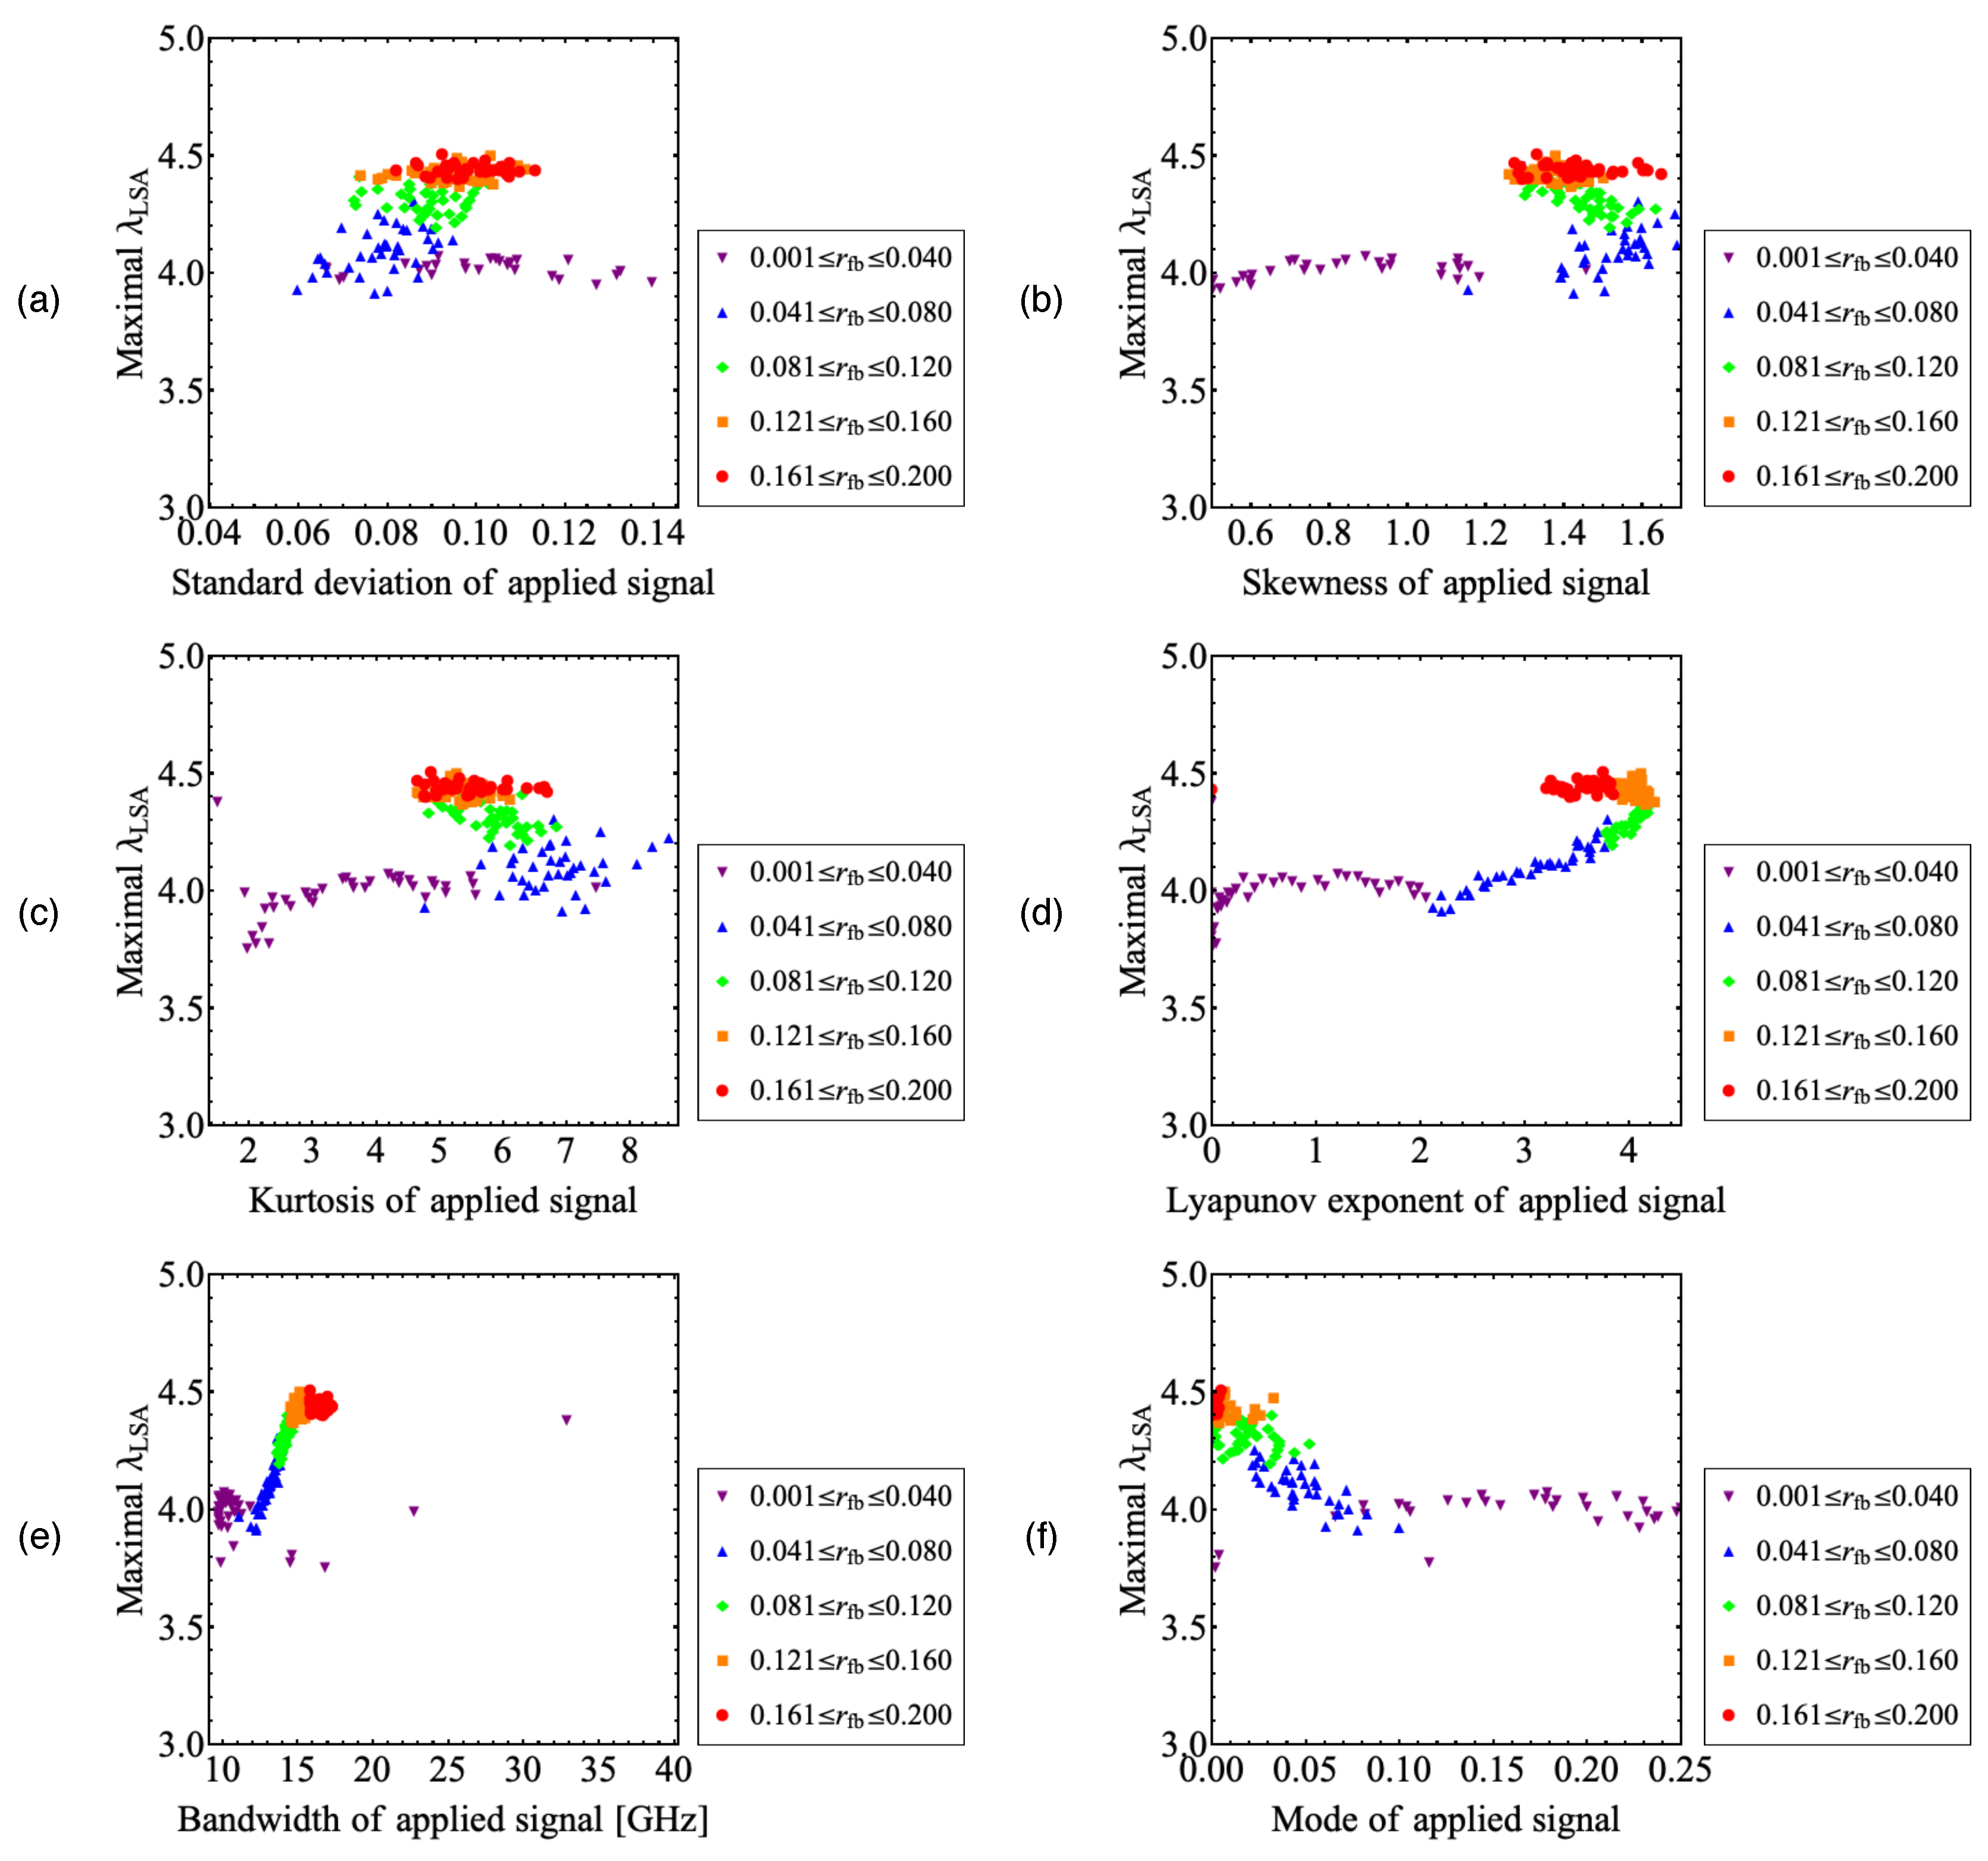
of LD0 are calculated and plotted against the standard deviation, skewness, kurtosis, Lyapunov exponent, bandwidth, and mode of the histogram of LD0 in
Figure 7. The symbols correspond to those in
Figure 6. In the range where the orbital instability of the applied signal is small (
), the maximal value of
does not vary with
(purple down-pointing triangles in
Figure 7). We then consider the range of
where the orbital instability of the applied chaotic signal is sufficiently large. The correlation between the maximal value of
and the standard deviation of the applied signal is low in
Figure 7a. On the other hand, in
Figure 7b–d, the maximal value of
is nonlinear with the skewness, kurtosis, and Lyapunov exponent of the applied signal in the range of
, respectively. The plots for
and
have different gradients: thus, it is difficult to identify
from the statistical quantities. However, in
Figure 7e–f, the maximal value of
is linear to the bandwidth and mode of the histogram of the applied signal in the range of
. Therefore, we can identify
from these quantities. Since the large bandwidth and small mode of the histogram of the applied signal contribute to the large Lyapunov exponent, the orbital instability of LD2 can be enhanced by applying a chaotic pulsation having a broad bandwidth.
Next, we discuss the shift of the maximal value of
upon applying the chaotic signal in
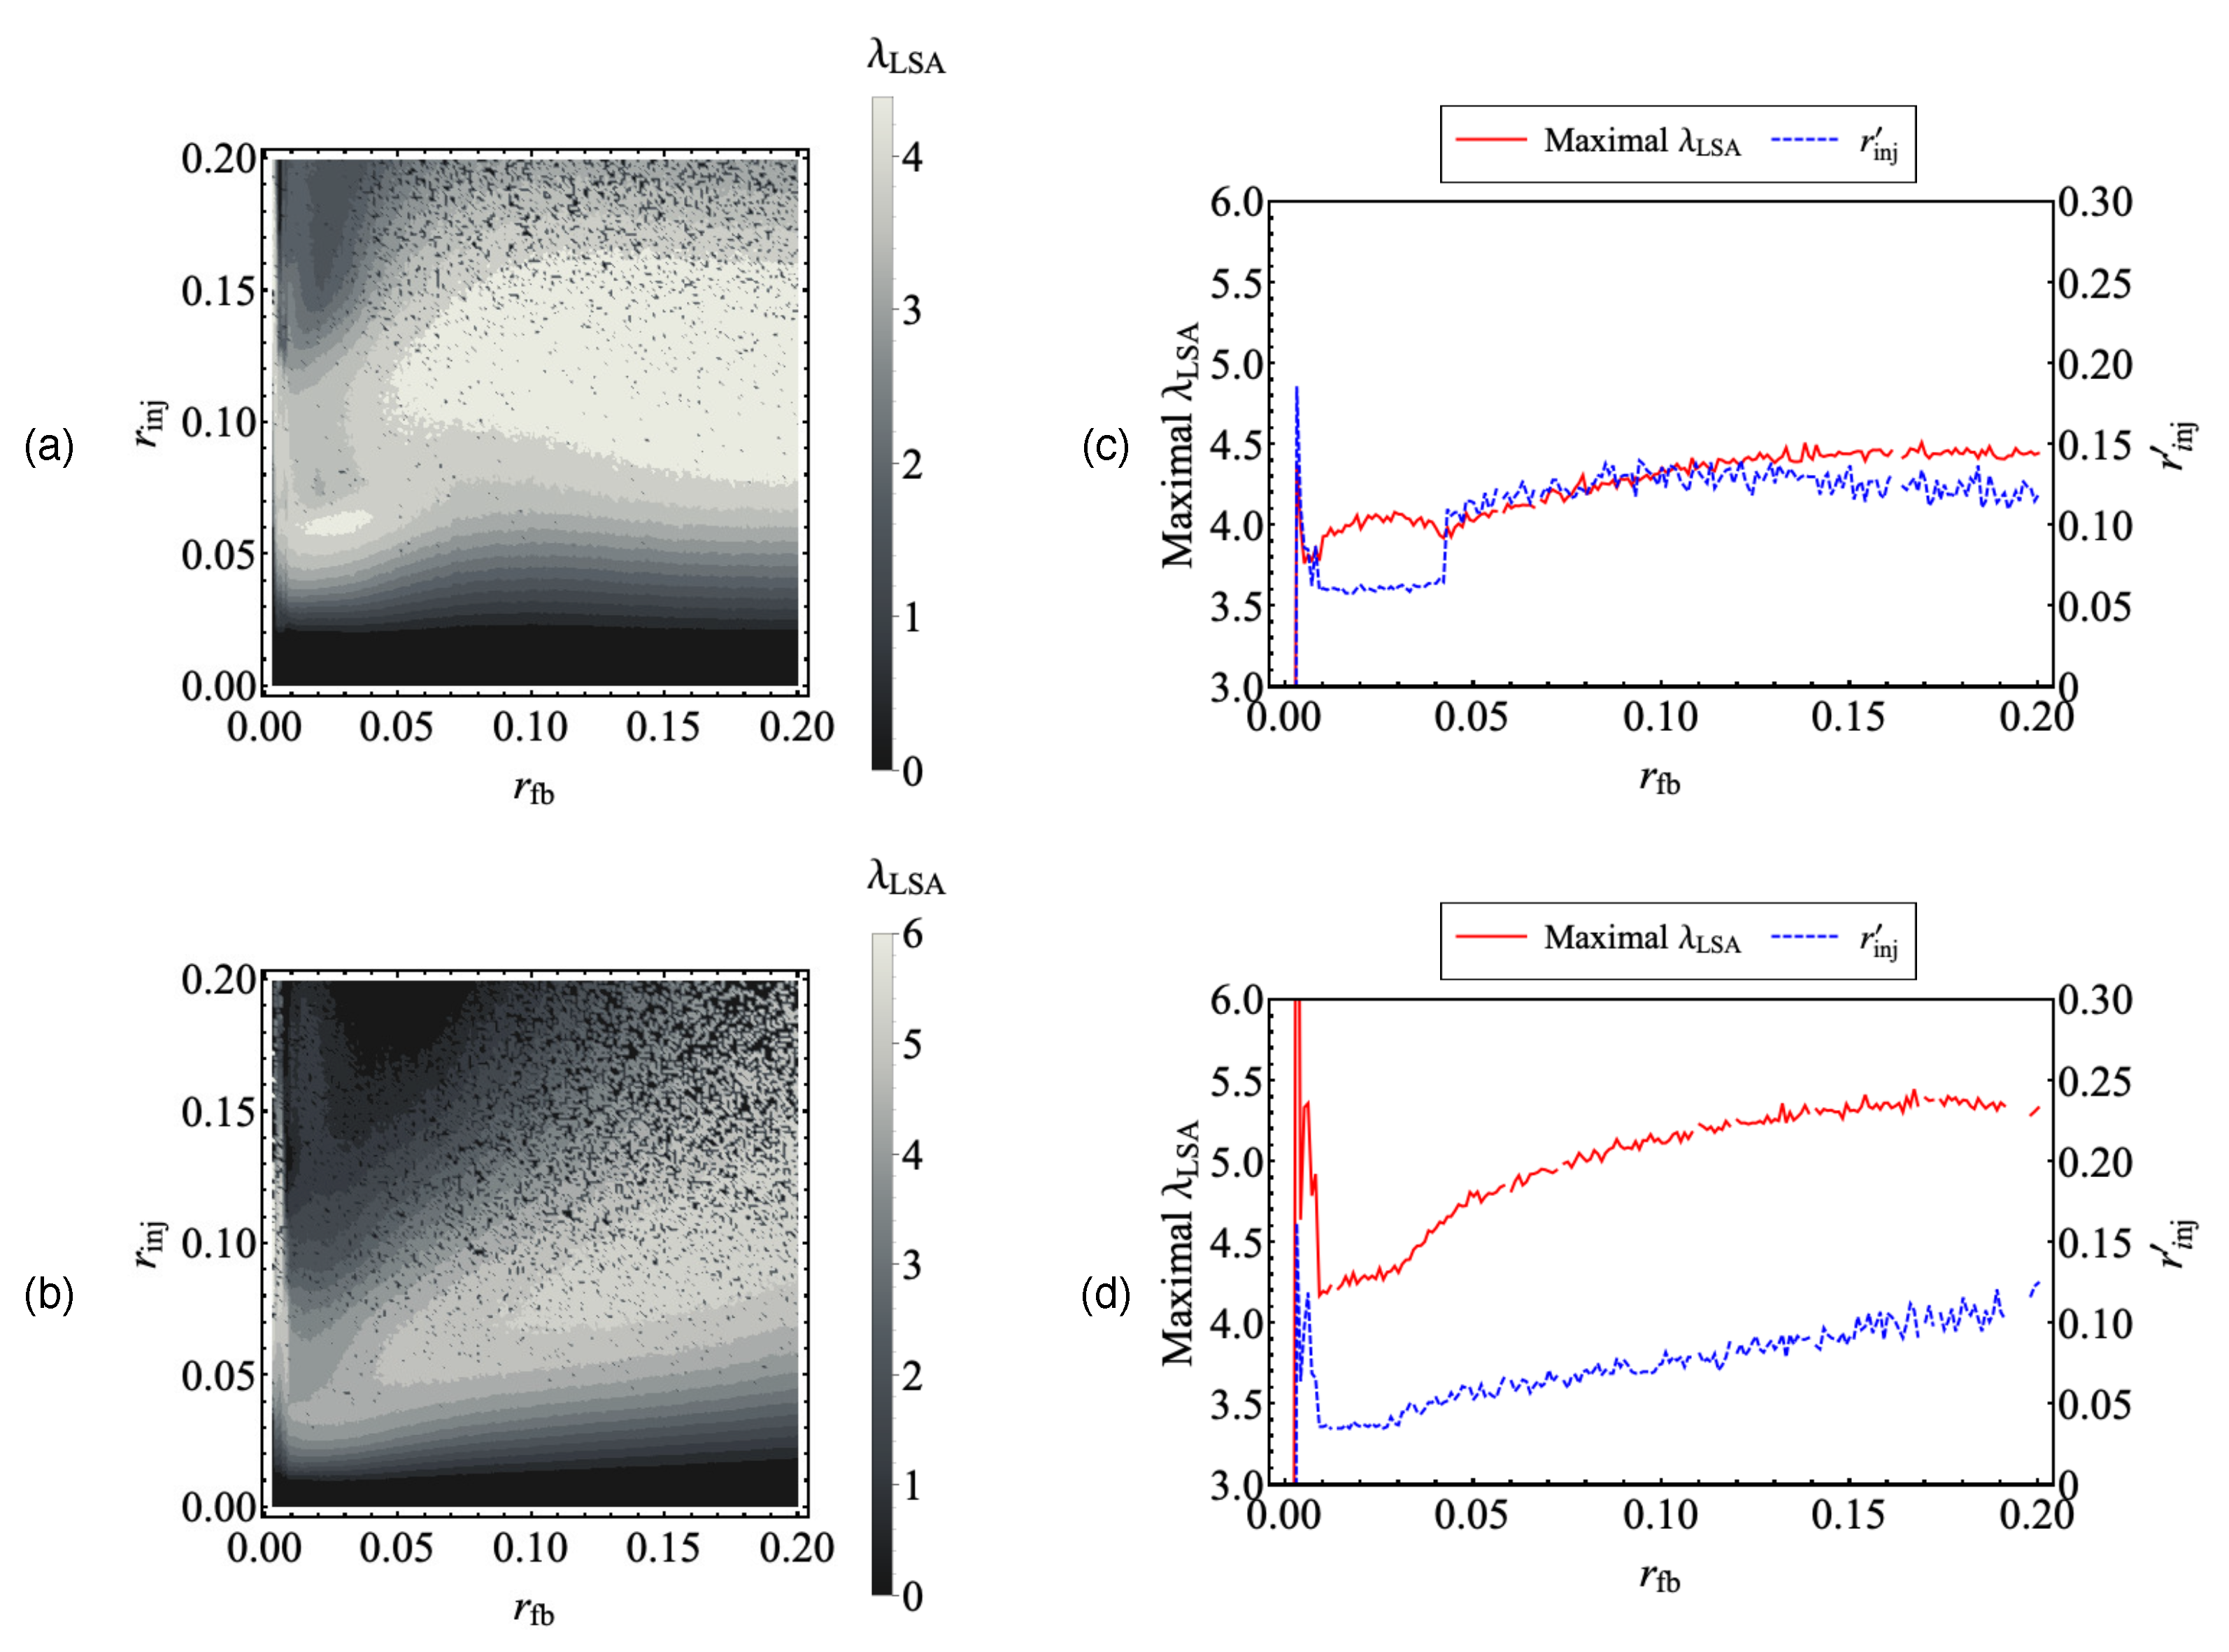
Figure 5. We consider the optical injection ratio
, which is
for the inherent system without the applied signal, and introduce the difference
.
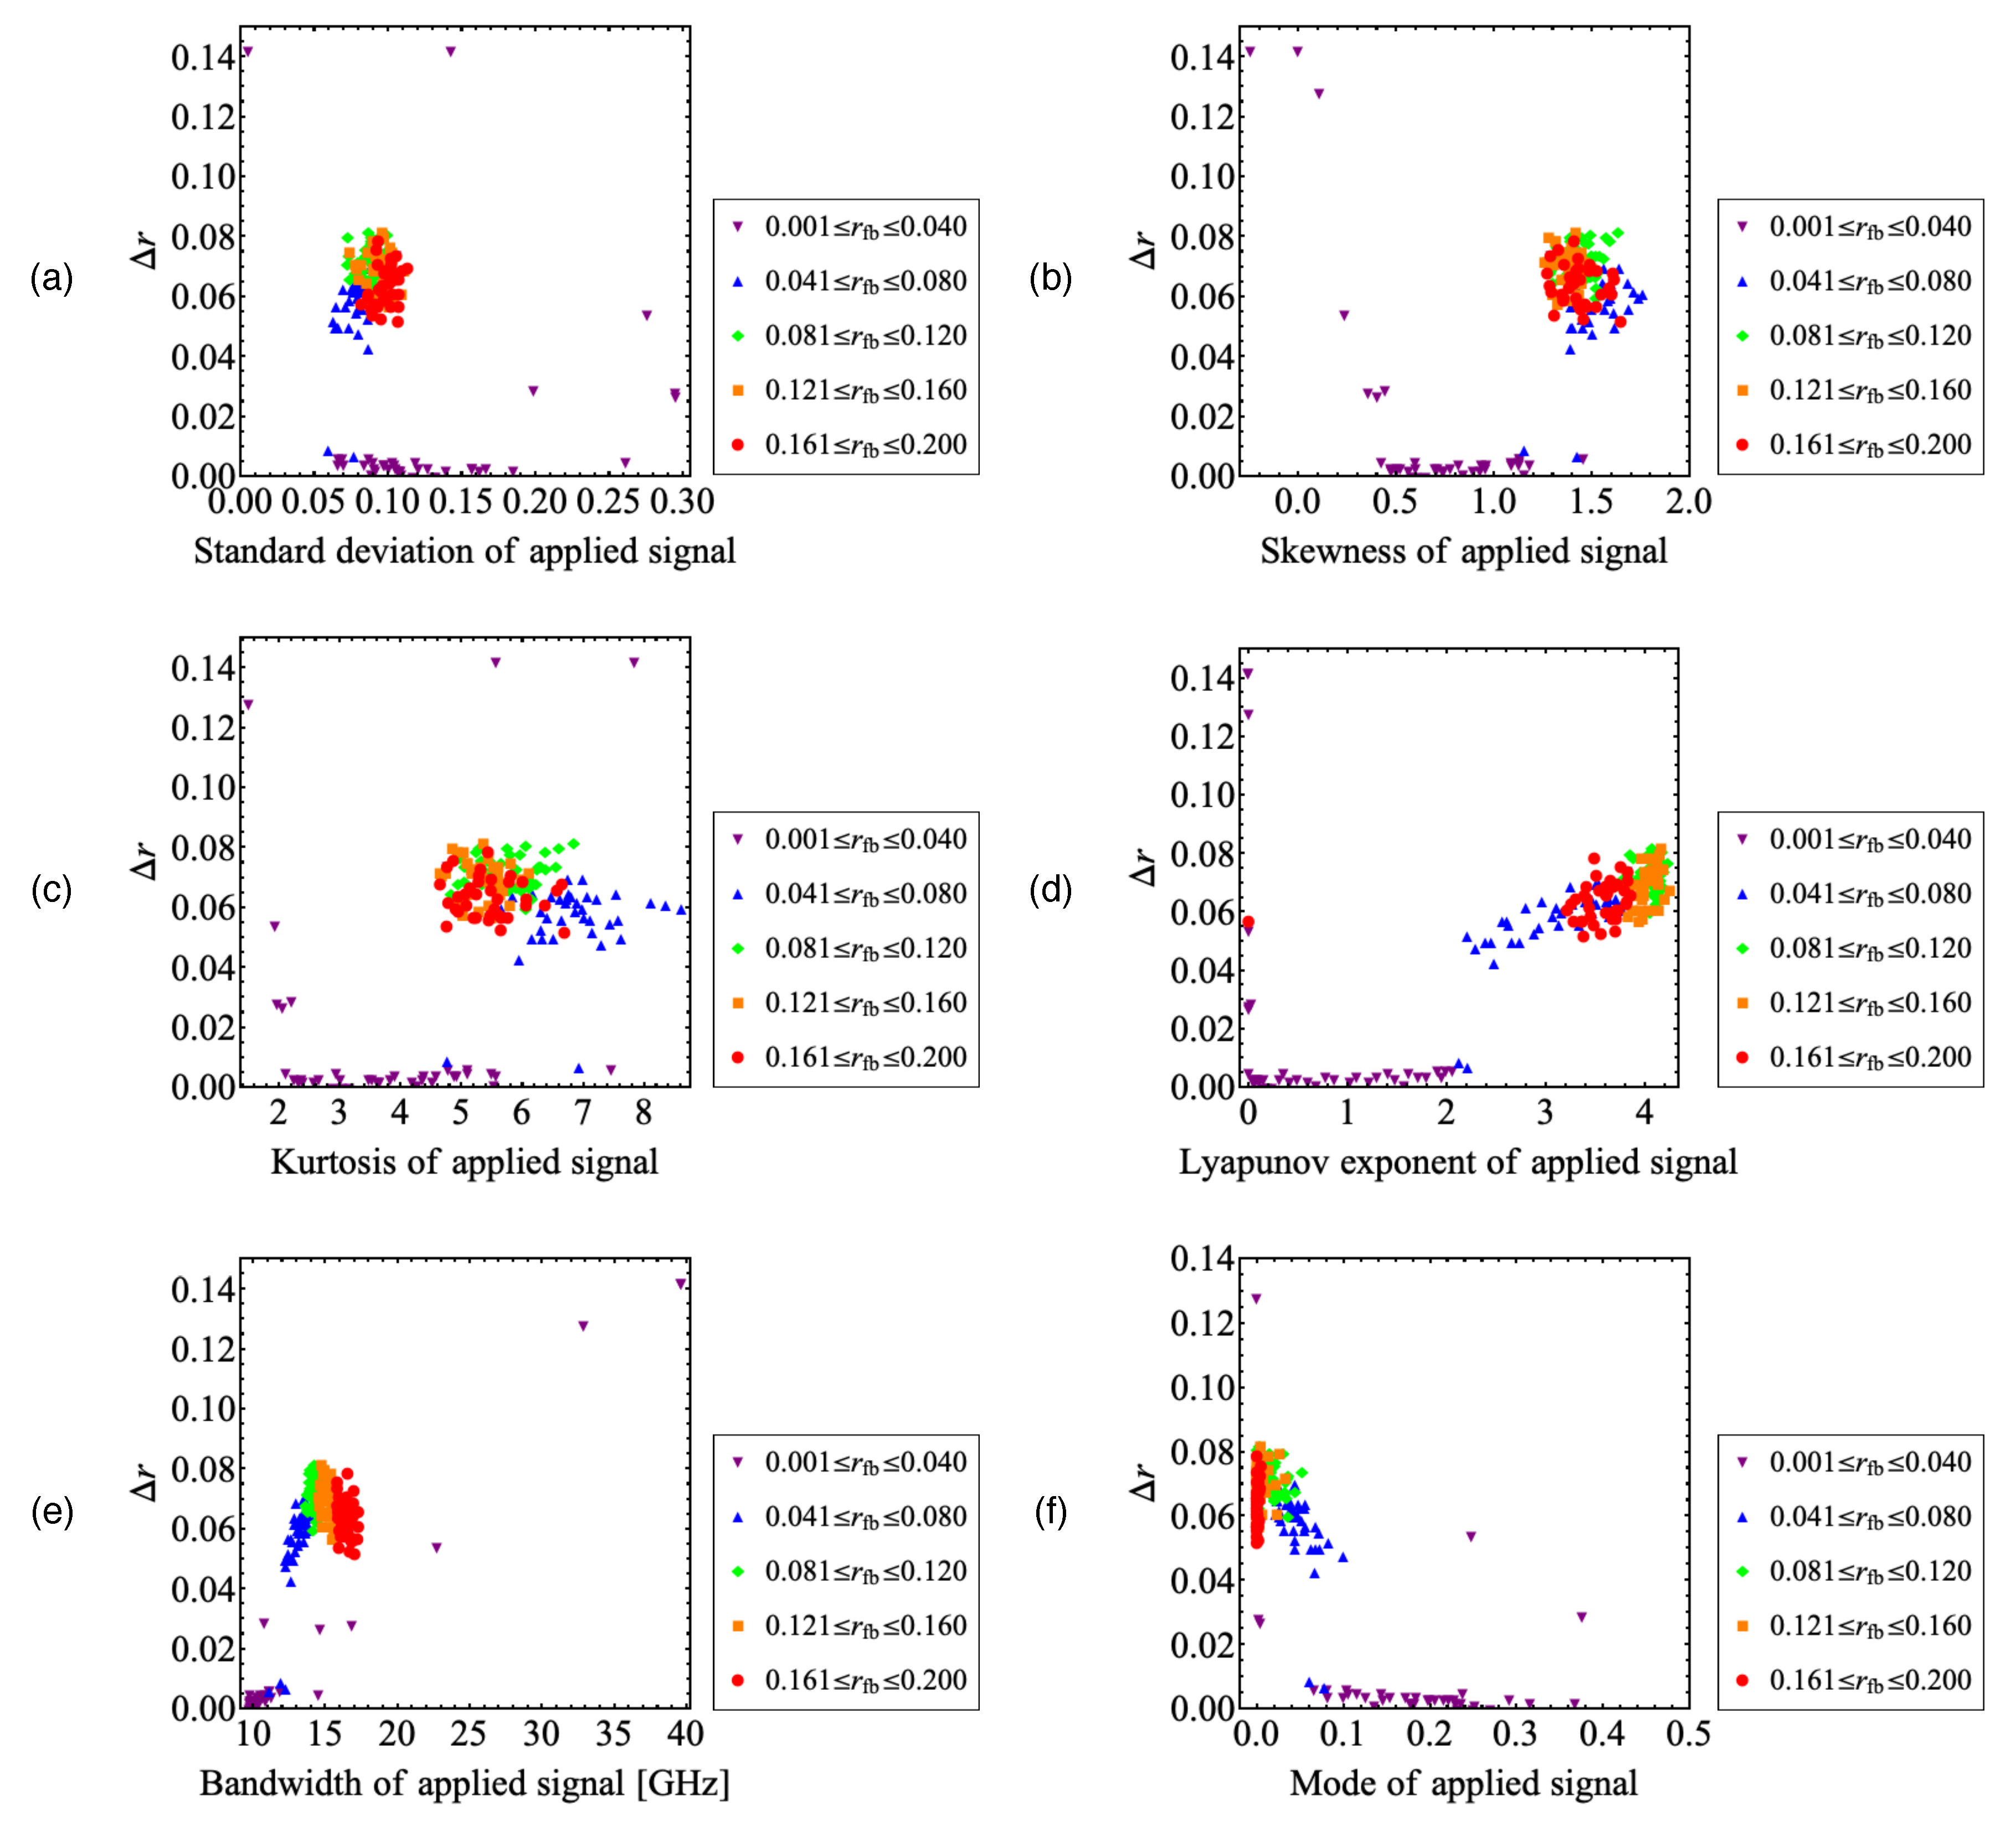
Figure 8 shows
plotted against statistical and dynamical quantities of the applied chaotic signal, that is, the standard deviation, skewness, kurtosis, Lyapunov exponent, bandwidth, and mode of the histogram of LD0 as in
Figure 7. In the range where the orbital instability of the applied signal is small (
),
is small for most plots. However, in the range of
, the orbital instability of LD2 is reduced since LD0 oscillates periodically or quasi-periodically. Since an additional optical injection is needed to obtain similar orbital instability,
becomes large. In the range of
, the orbital instability of LD2 is enhanced in the range of
, where a window can be observed in the inherent system, and the plots are concentrated around
.
The correlation between
and the standard deviation, skewness and kurtosis of the applied signal is low in
Figure 8a–c, respectively. In
Figure 8e,f,
is nonlinear to the bandwidth and mode of the histogram of the applied signal in the range of
, respectively. The plots for
and
have different gradients. On the other hand,
seems to depend on the Lyapunov exponent of the applied signal in the range of
(
Figure 8d).
Finally, we discuss the chaos synchronization between LDs. For example, we assume the application of the present system to chaotic secure communication that is a digital scheme by using a difference of the orbital instability of chaotic LD [
18]. The scheme is hardware-dependent, where the key to communication is based on the parameter of the LD system. LD1 and LD2 act as the transmitter and receiver LDs, respectively. Then, LD0 is the driver used to control the dynamics of LD1 and the message is modulated by LD0 and applied to LD1. The orbital instability of LD2 is controlled by LD0 through LD1 and corresponds to the digit. The proper receiver quantifies from only the optical intensity of LD2 at a certain interval, for example, using the method in Ref. [
32], and compares the quantified orbital instability with the predetermined threshold to decide the digit. Since the dynamics of LD2 are decided by the parameters of three LDs, it is difficult for eavesdroppers to decode the digit with only the transmitting signal. However, if LD2 synchronizes with the other LDs, the eavesdropper can estimate the digit from the transmitting signal. Thus, we investigate the chaos synchronization between LD2 and the other LDs. In
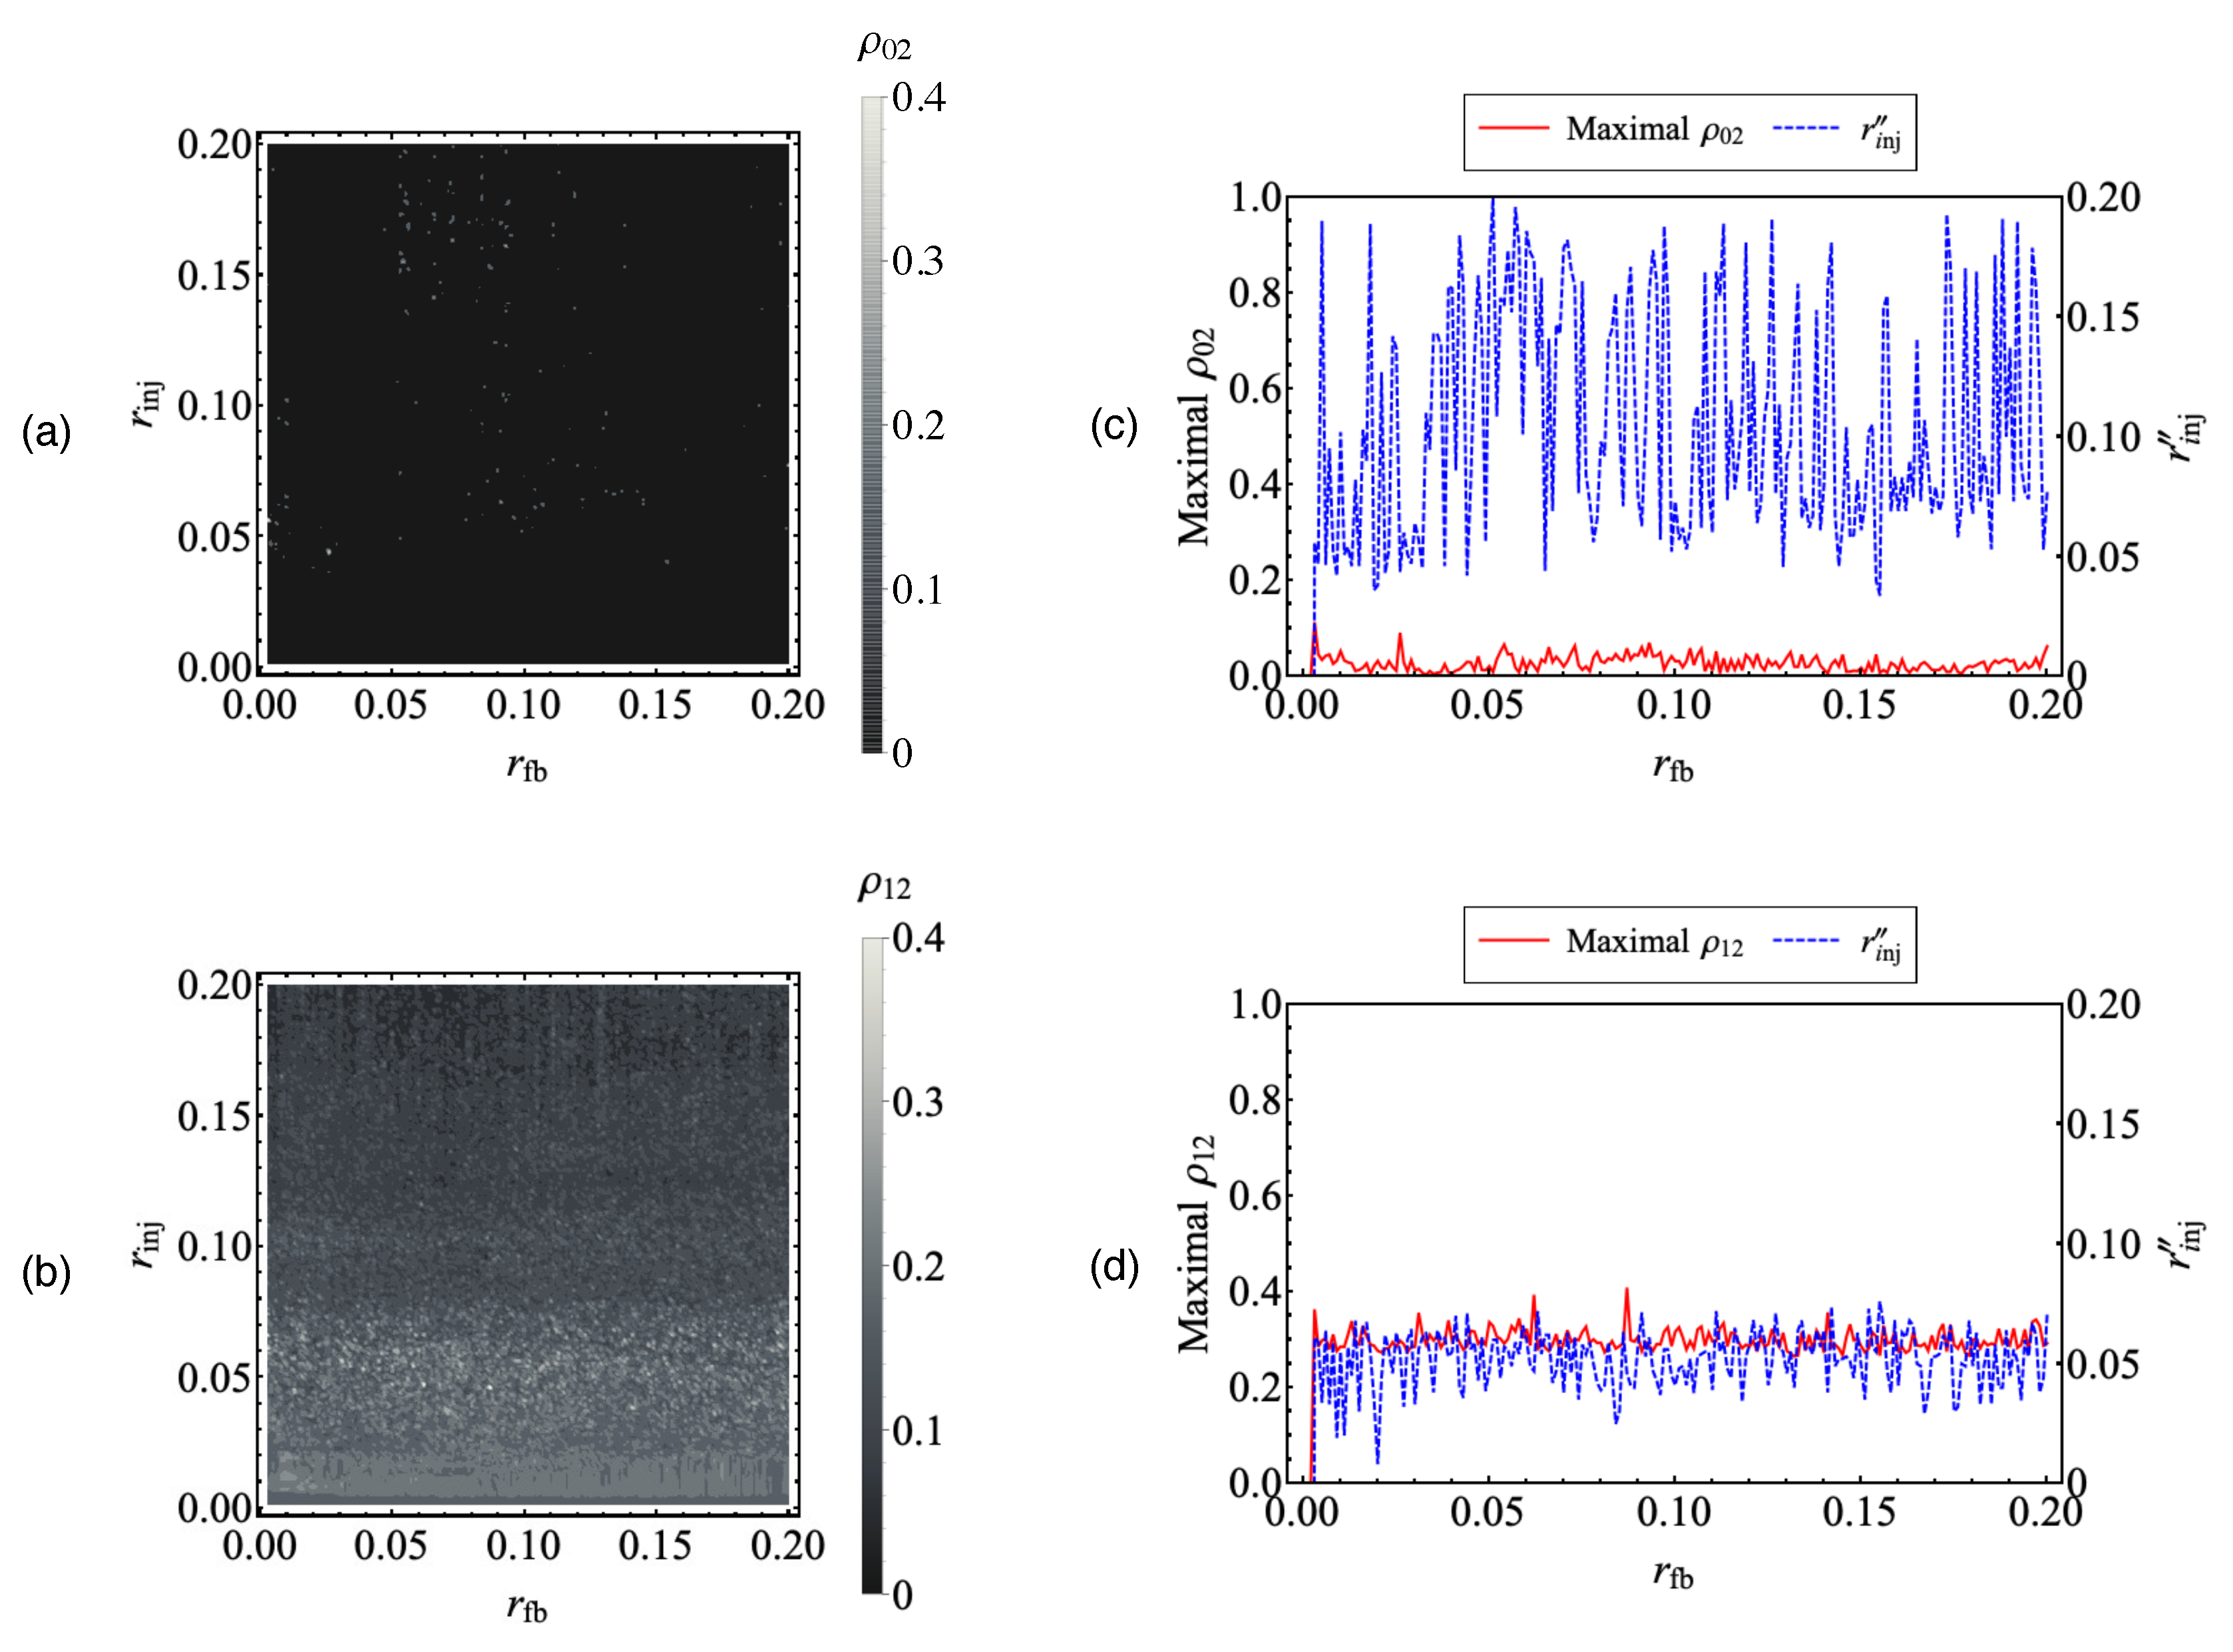
Figure 9, we calculate the correlation coefficient between the LDs plotted against
and
to quantify the chaos synchronization.
Figure 9a,b show the correlation coefficients between LD0 and LD2 and between LD1 and LD2, respectively. The correlation coefficient is expressed as
where
and
indicate the optical outputs of LD
i (
) and LD2, respectively, and
indicates the ensemble average. The roundtrip time of the external cavity
and the trip time of the injection light from LD1 to LD2
, have the same value, and the correlation coefficient is calculated in the range
.
Figure 9c,d show the maximal value of
and
in the range of
and the corresponding optical injection ratio
plotted against
. In
Figure 9a,c, the correlation coefficient
between LD0 and LD2 is small in the entire range and the maximum is 0.11, showing that LD2 does not synchronize with LD0. On the other hand, as shown in
Figure 9b,d, the correlation coefficient
between LD1 and LD2 is larger than that in
Figure 9a. For all
, the correlation coefficient is small in the range of
. With increasing
, the correlation coefficient becomes larger since the orbital instability of LD2 is enhanced (
). With further increase of
, the correlation coefficient becomes small again in the range of
, where a window can be observed in the inherent system. Since the maximal correlation coefficient between LD1 and LD2 is 0.40, chaos synchronization between LD1 and LD2 is not achieved. Therefore, it is concluded that the orbital instability of LD2 can be controlled by varying the parameters of LD0, which generates the applied chaotic signal, without chaos synchronization between the LDs.
5. Conclusions
We numerically studied the orbital instability of a chaotic laser diode (LD) system with optical injection, which consists of the master LD (LD1) and slave LD (LD2). The drive current of LD1 is modulated by the chaotic applied signal, which is generated by LD0 with optical feedback. First, we showed that chaotic behavior in the window is actualized by applying the chaotic signal as well as a pseudorandom signal. The optical injection ratio required to oscillate LD2 chaotically is decreased by applying the pseudorandom signal or DC but increased by applying the chaotic signal.
Next, we investigated the maximal value of the Lyapunov exponent of LD2 in the range of as a function of the optical feedback ratio of LD0 and the optical injection ratio from LD1 to LD2. When the amplitude of the applied chaotic signal is sufficiently large and the inherent system without the applied chaotic signal is in the window, the Lyapunov exponent of LD2 can be controlled by varying the optical feedback ratio of LD0.
Then, we discussed the effect of statistical and dynamical quantities of the applied chaotic signal on the orbital instability of LD2. The bandwidth and mode of the histogram of the applied chaotic signal are linear to the maximal value of the Lyapunov exponent of LD2. It was shown that the orbital instability of LD2 can be enhanced efficiently by applying a chaotic pulsation having a broad bandwidth.
Finally, we investigate the chaos synchronization between LDs. The LDs do not synchronize with each other. It was shown that the orbital instability of the chaotic LD can be controlled without chaos synchronization. Since it is difficult to estimate the dynamics of LD0 from the optical intensity of LD1, the characteristics is useful to the application of chaotic LD like a secure communication.
