1. Introduction
In this article, the dynamical behavior of semiconductor lasers subjected to optical feedback from an external mirror, in the long cavity case [
1], based on the experimental observations of the research group I belong to are reviewed. External optical feedback is known to lead to a wealth of dynamical regimes [
1,
2], some of which have been exploited in diverse applications such as laser feedback interferometry [
3], reservoir computing [
4], physical-layer secure communications [
5], and random-number generation [
6]. A classification of the different dynamical regimes of a laser diode with optical feedback has been proposed as early as 1986 by Tkach and Chraplyvy [
7], and is still being referred to. The classification features five regimes, four of which involve CW dynamics, and only one, regime IV, corresponds to all other possible dynamics. It has been shown since then that regime IV actually contains a great variety of dynamical regimes. The sequence of regimes experimentally observed within regime IV and leading to chaotic behavior as the feedback level is increased will be focused on, and, when possible, agreement or disagreement with the Lang and Kobayashi rate equation model will be indicated.
The paper is organized as follows:
Section 2 reviews previous experimental studies of routes to chaos,
Section 3 presents the experimental setup,
Section 4 discusses modeling considerations, and
Section 5 and
Section 6 present our observations when the laser is biased close to and far from threshold, respectively; finally,
Section 7 summarizes and discusses the main conclusions.
2. State of the Art
Laser diodes subjected to external optical feedback have been the subject of a large number of publications in the last three decades, focusing either on dynamical behavior or on their use in a variety of applications. We refer the reader to a book [
1] and a review paper [
2] for extensive information. We focus here on experimental investigations of the sequence of dynamical regimes experienced by the laser as the feedback strength is increased, from CW to chaotic behavior. These routes reveal the way in which intrinsic time scales of a laser with optical feedback interplay and lead to a variety of sustained periodic or quasiperiodic oscillations and eventually chaos. Quasiperiodic [
8,
9,
10], period-doubling [
11], and subharmonic [
12] routes to chaos have been reported. Contrary to the quasiperiodic route, which is reported to occur for a wide range of operating conditions, the period-doubling and subharmonic routes have been observed for specific, restricted conditions. Of note, the routes have typically been studied based on observations of a discrete set of feedback levels, and not for continuous tuning. Hohl and Gavrielides have also observed [
13], both experimentally and numerically, an alternating sequence of CW and chaotic behavior, referred to as a bifurcation cascade, for a laser biased close to threshold. In their experiment, the optical spectrum was monitored while the feedback level was continuously tuned.
Previous work from our group has revisited the various routes to chaos observed in the literature, confirming and complementing, in the case of a laser being biased close to threshold, the bifurcation cascade route but also providing a different interpretation of the route observed for larger bias currents. In particular, we show that the route that has been named “quasiperiodic” does not contain the sequence of regimes expected in such a case as it involves a number of different attractors and their interplay.
4. Modeling Considerations
Even though experimental results are our focus, I will also refer to the Lang and Kobayashi (LK) model [
19], which is widely used to interpret the nonlinear dynamics of single-mode laser diodes subjected to optical feedback. It is based on standard semi-classical rate equation modeling, and no spatial effects within the laser cavity are taken into account explicitly. The dynamics involve the total carrier population
N(
t), an intra-cavity electric field that is only time-dependent and represented as
E(
t)exp[
iω0t +
iϕ(
t)], where
E is the amplitude,
ϕ the slowly-varying phase, and ω
0 the angular frequency of the solitary laser. The terms of the rate equations take into account sources of carrier and photon gains and losses, as well as a coupling between the amplitude and the phase represented by the linewidth enhancement factor
α. Lang and Kobayashi have added, in the field equation, a term proportional to the delayed optical feedback. The LK model has proven to be useful in interpreting numerous experimentally observed dynamical behaviors of a LD, and has also been used for prediction (e.g., Refs. [
20,
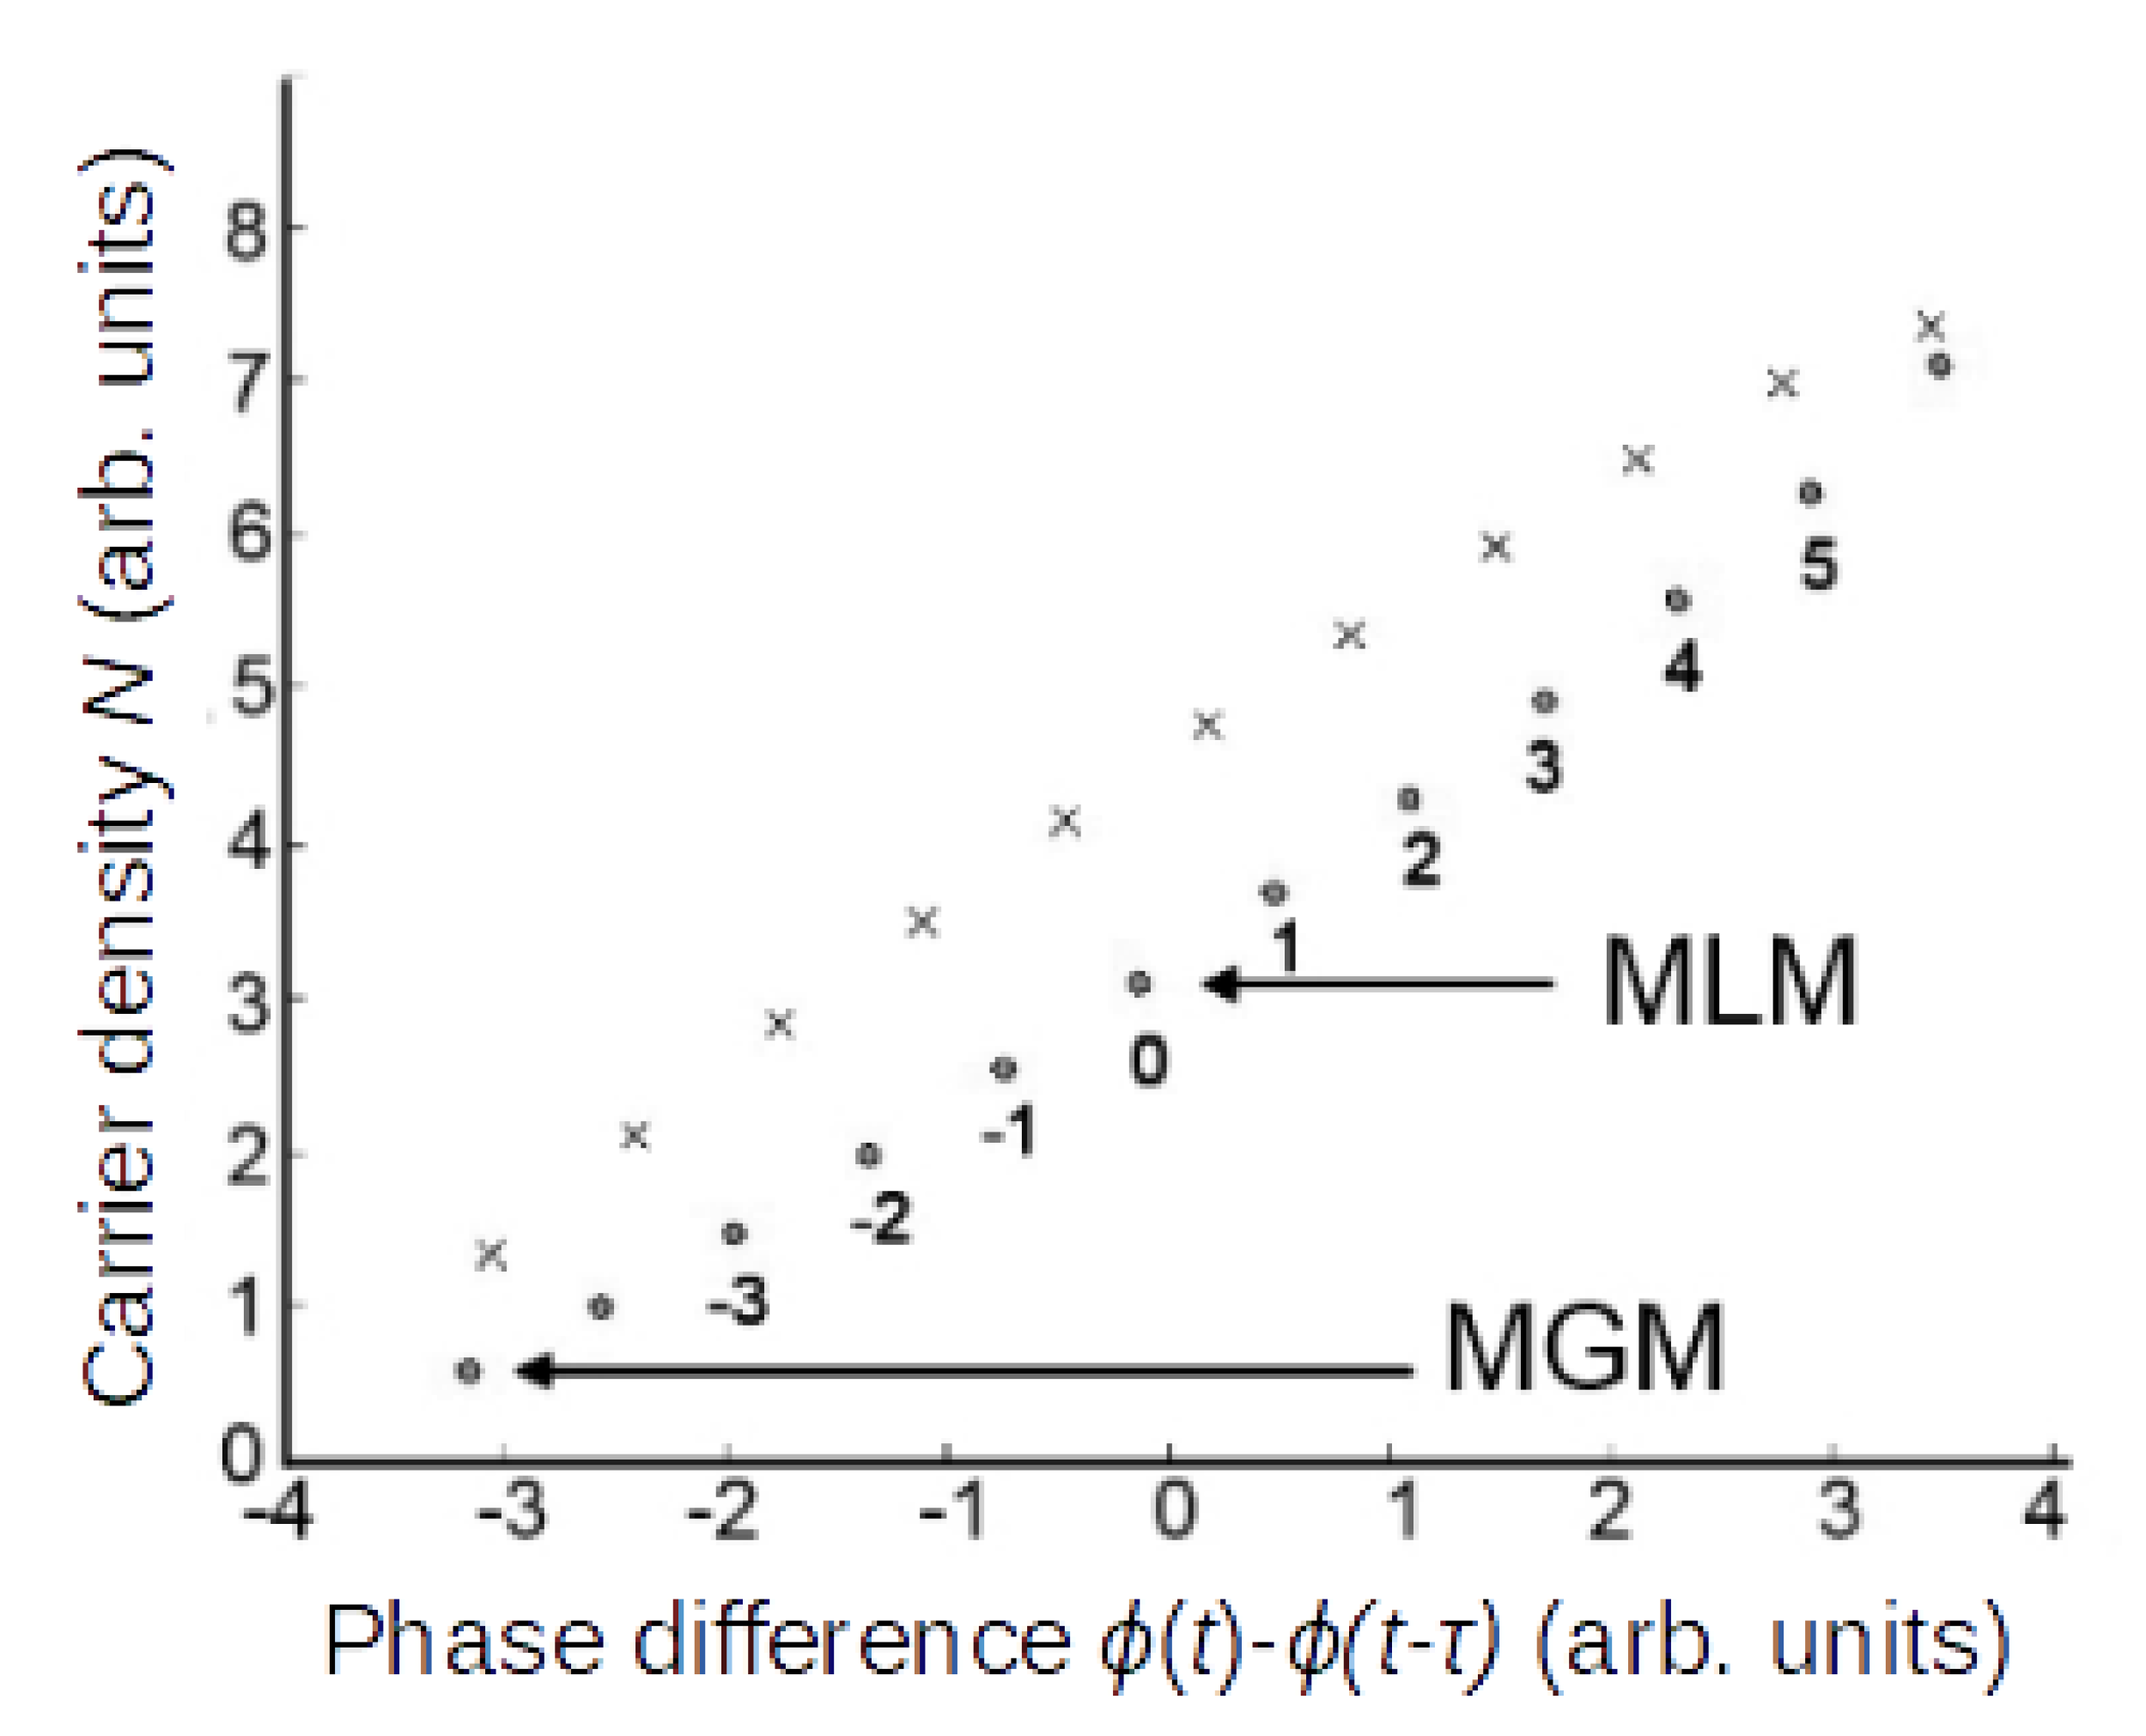
21]). In particular, the model shows that, as feedback level is increased, potentially stable CW solutions, named external-cavity modes, and unstable CW solutions, referred to as antimodes, appear in pairs. The equilibria (ECMs) are spaced in frequency by ~
fτ. They are located on an ellipse in the (
N(t),
ϕ(
t) −
ϕ(
t −
τ)) plane, where
τ is the round-trip time in the external cavity. ECMs are located on the lower part of the ellipse and antimodes on the upper part of it, as represented in
Figure 2. The mode that is closest in frequency to that of the solitary laser is called the minimum linewidth mode (MLM), and denoted ECM 0. Positively shifted ECMs with respect to ECM 0 use positive numbering (1, 2, 3…), while negatively shifted ECMs use negative numbering. The mode with the lowest optical frequency is the maximum gain mode (MGM).
Finally, two time scales are of crucial importance. The first is the relaxation oscillation period, τRO, which is intrinsic to the laser and represents the period of transient oscillations appearing in a LD as a result of the interaction between the carrier and photon populations. The second is the delay introduced by the optical feedback. The frequency of the relaxation oscillations is denoted fRO = 1/τRO, and the inverse of the delay is called here the delay frequency fτ = 1/τ.
5. Route to Chaos When the Laser Is Biased Close to Threshold
In this section, I present a review of our observations in the case of a laser biased relatively close to threshold [
22,
23]. In this case, the sequence of bifurcations displays regular or irregular alternation between different regimes; this type of sequence will be referred to as a cascade of bifurcations [
13].
Hohl and Gavrielides have reported in Ref. [
13], for a current of
J = 0.99
Jth, where
Jth is the solitary laser threshold current, an alternating sequence of CW and chaotic behaviors as the feedback level is increased.
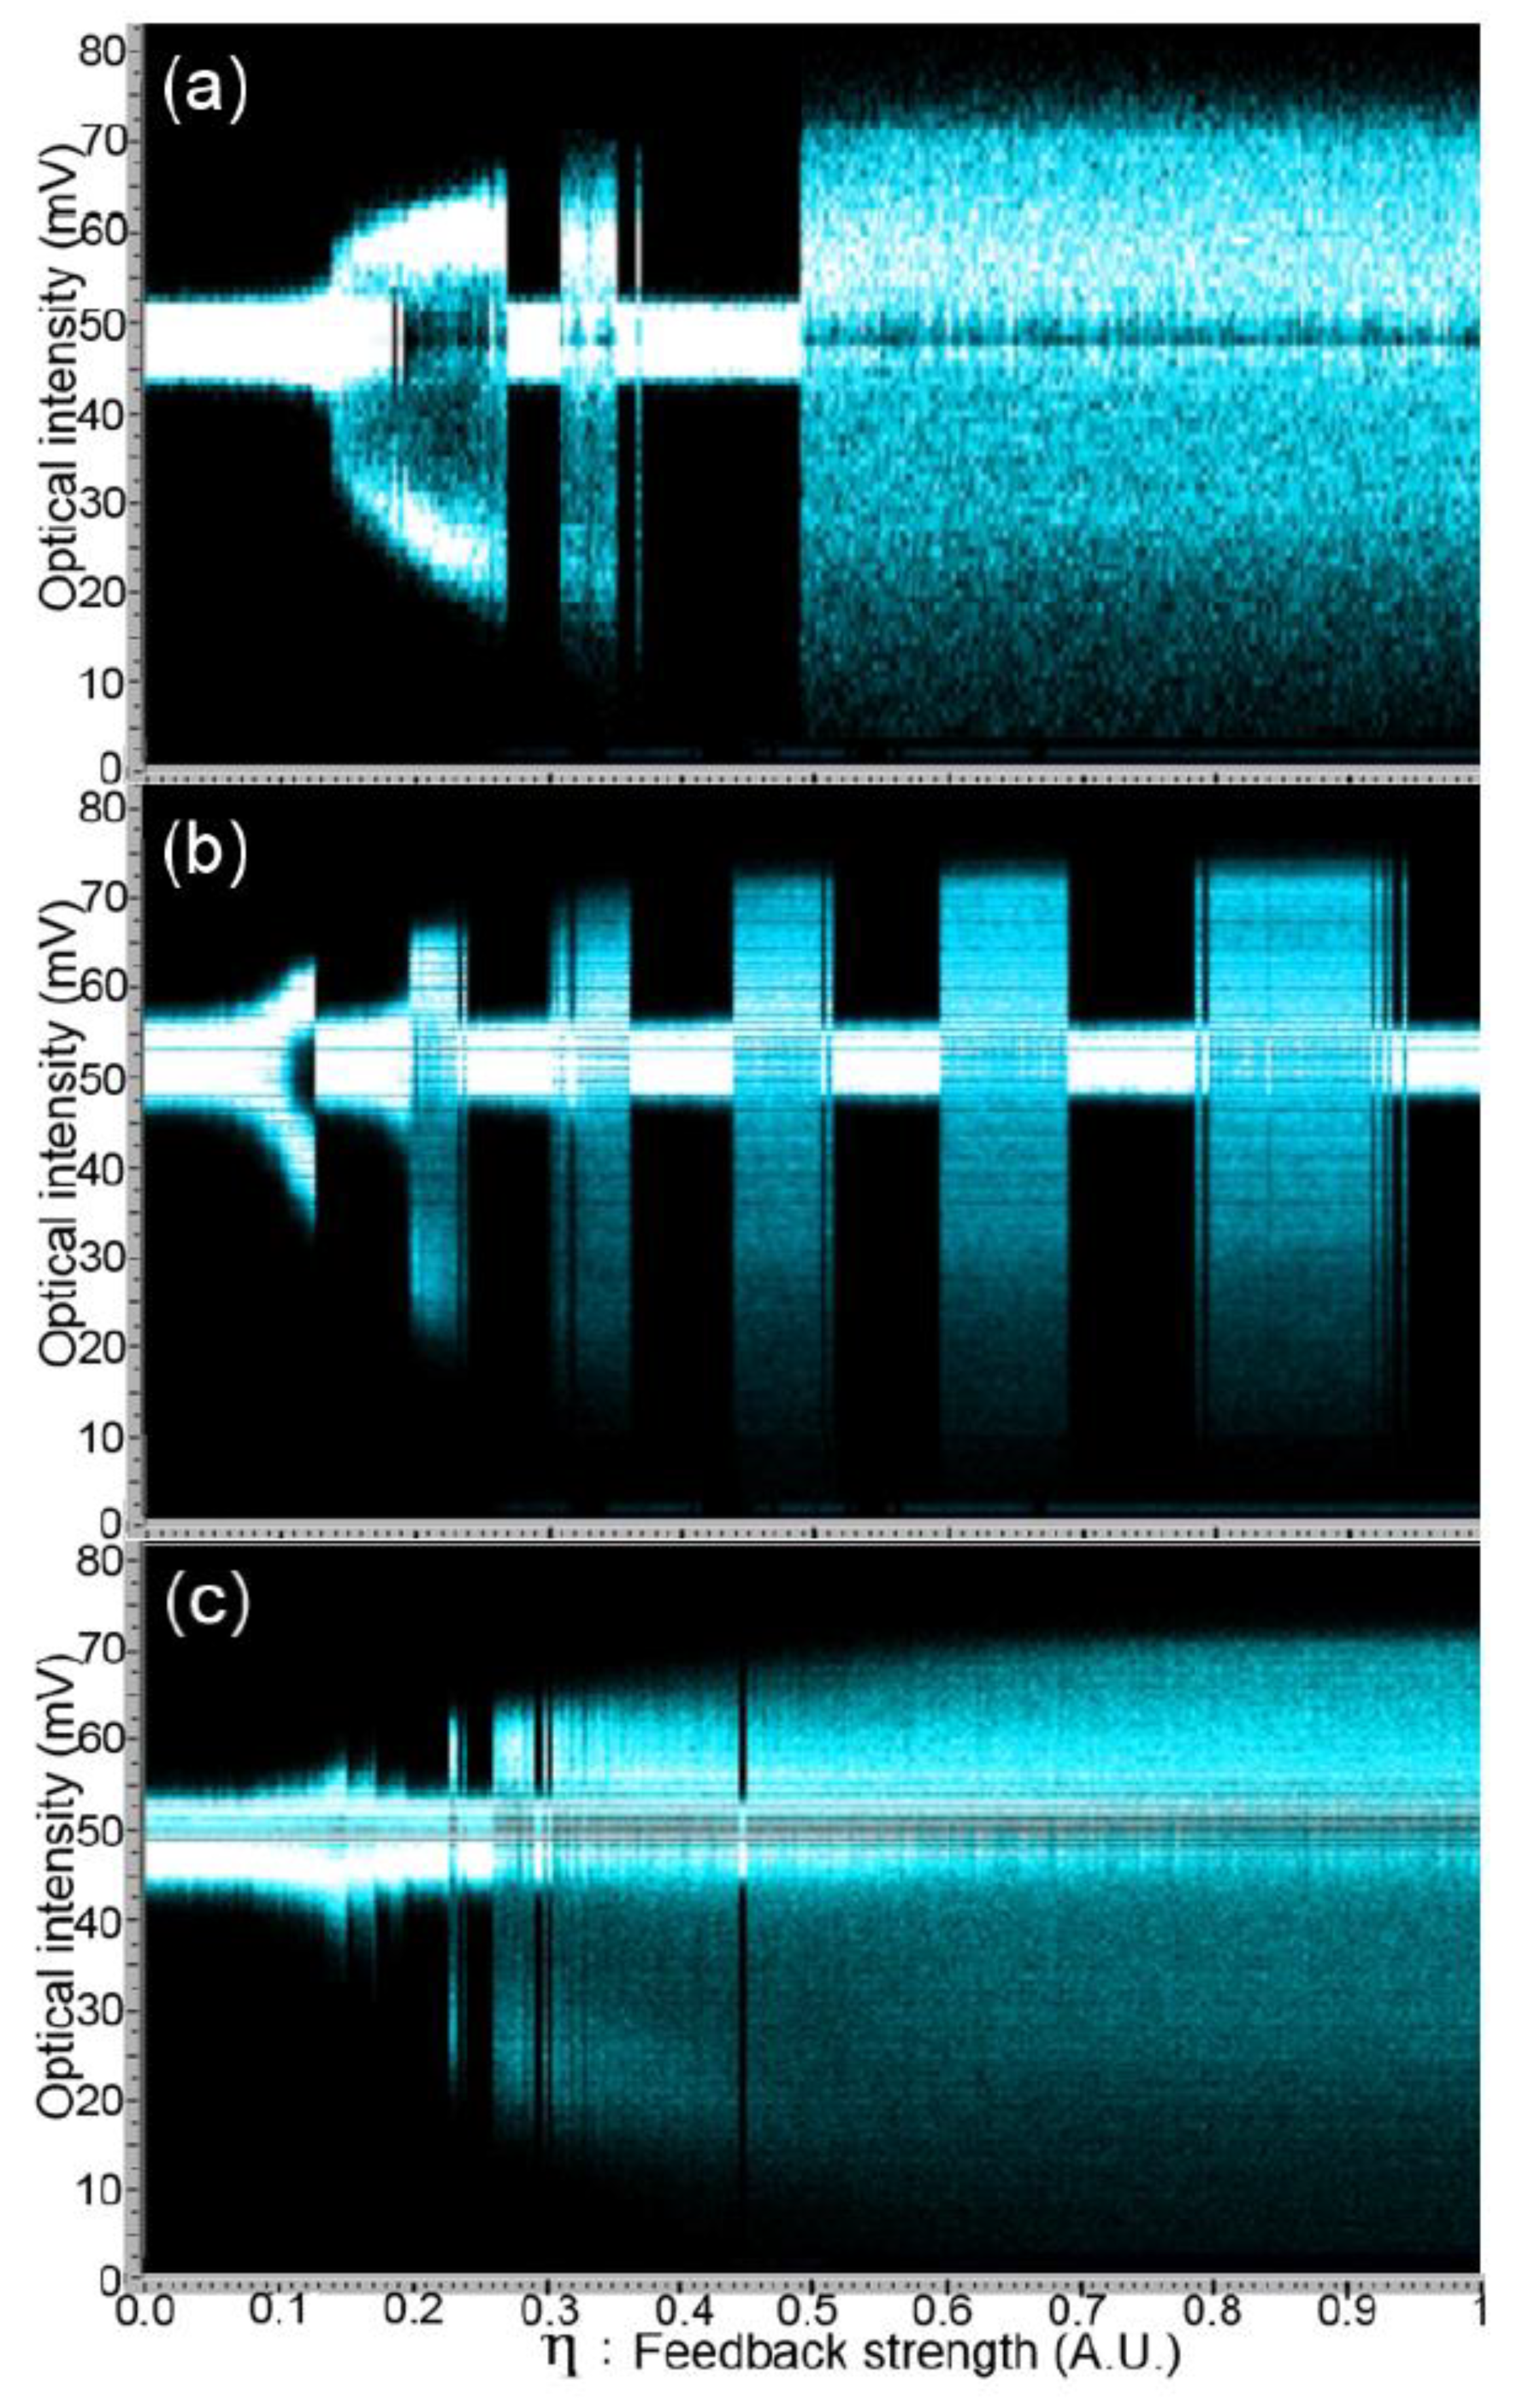
Figure 3 represents three experimental bifurcation diagrams for different currents and cavity lengths. The probability density function of the extrema of the optical intensity
I is represented, using a color map, as a function of the feedback strength
η. In panel (b), we observe a regular alternation between two distinct regimes: one is characterized by small-intensity fluctuations, while in the other fluctuations are much larger. This regular alternation is consistent with the optical spectra that have been observed in Ref. [
13]. Hohl and Gavrielides also provide an interpretation, based on LK, in which slips toward newly created stable maximum gain modes (MGMs) occur regularly as the feedback level increases and the ellipse grows in size. These slips correspond to abrupt switches to a CW regime, which itself leads, as
η is increased, to more complex behavior, including low frequency fluctuations (LFF) and fully developed coherence collapse (CC), involving a number of ECMs. The experimental bifurcation diagrams we have obtained confirm this interpretation and show the robustness of the alternation between regimes for a range of currents and cavity lengths. Specifically, we have found that regular or irregular alternations are consistently observed for currents
J 1.6
Jth [
23].
As the current is increased above threshold, we find that the bifurcation cascade progressively disappears. Regions of CW and of large fluctuations are still observed, but not in regular alternation, as illustrated in panel (a). Above 1.6
Jth approximately, no alternation can be observed [
22,
23], and the bifurcation structure progressively becomes the one described in the next section.
An increase of the cavity length also leads to a degradation of the regularity of the alternation [
23], as illustrated in panel (c). A possible explanation is that, as the cavity length increases, ECMs become more closely spaced in frequency and attractor merging is facilitated. This makes it more difficult for independent attractors to develop, with a significant basin, around a single ECM, and no slip toward a stable CW regime occurs.
Finally, I would like to point out that numerical simulations based on the Lang and Kobayashi model lead to bifurcation cascades for a significantly narrower range of parameter values than experiments do, indicating a possible limit of the model. Comparisons between numerical and experimental bifurcation diagrams can be found in Ref. [
23].
6. Route to Chaos at Larger Bias Current
In this section, I focus on a review of the experimentally observed bifurcation scenario when the laser is biased significantly above threshold. Of note, numerous simulated bifurcation diagrams, based on the LK model, can be found in the literature ([
1] and references therein). The first bifurcations observed in simulations usually correspond, in the long cavity case, to an undamping of the relaxation oscillations followed by quasiperiodic behavior in which a second timescale, close to the round-trip time in the external cavity, comes into play. The sequence of bifurcations observed after that is strongly dependent on the choice of the model parameter values. Experimentally, however, we have found that a consistent and robust scenario occurs when the current
J 2
Jth. Specifically, we have investigated systematically the route from CW behavior to fully developed coherence collapse, for a range of laser diodes, both packaged and unpackaged, quantum well- or quantum dash-based.
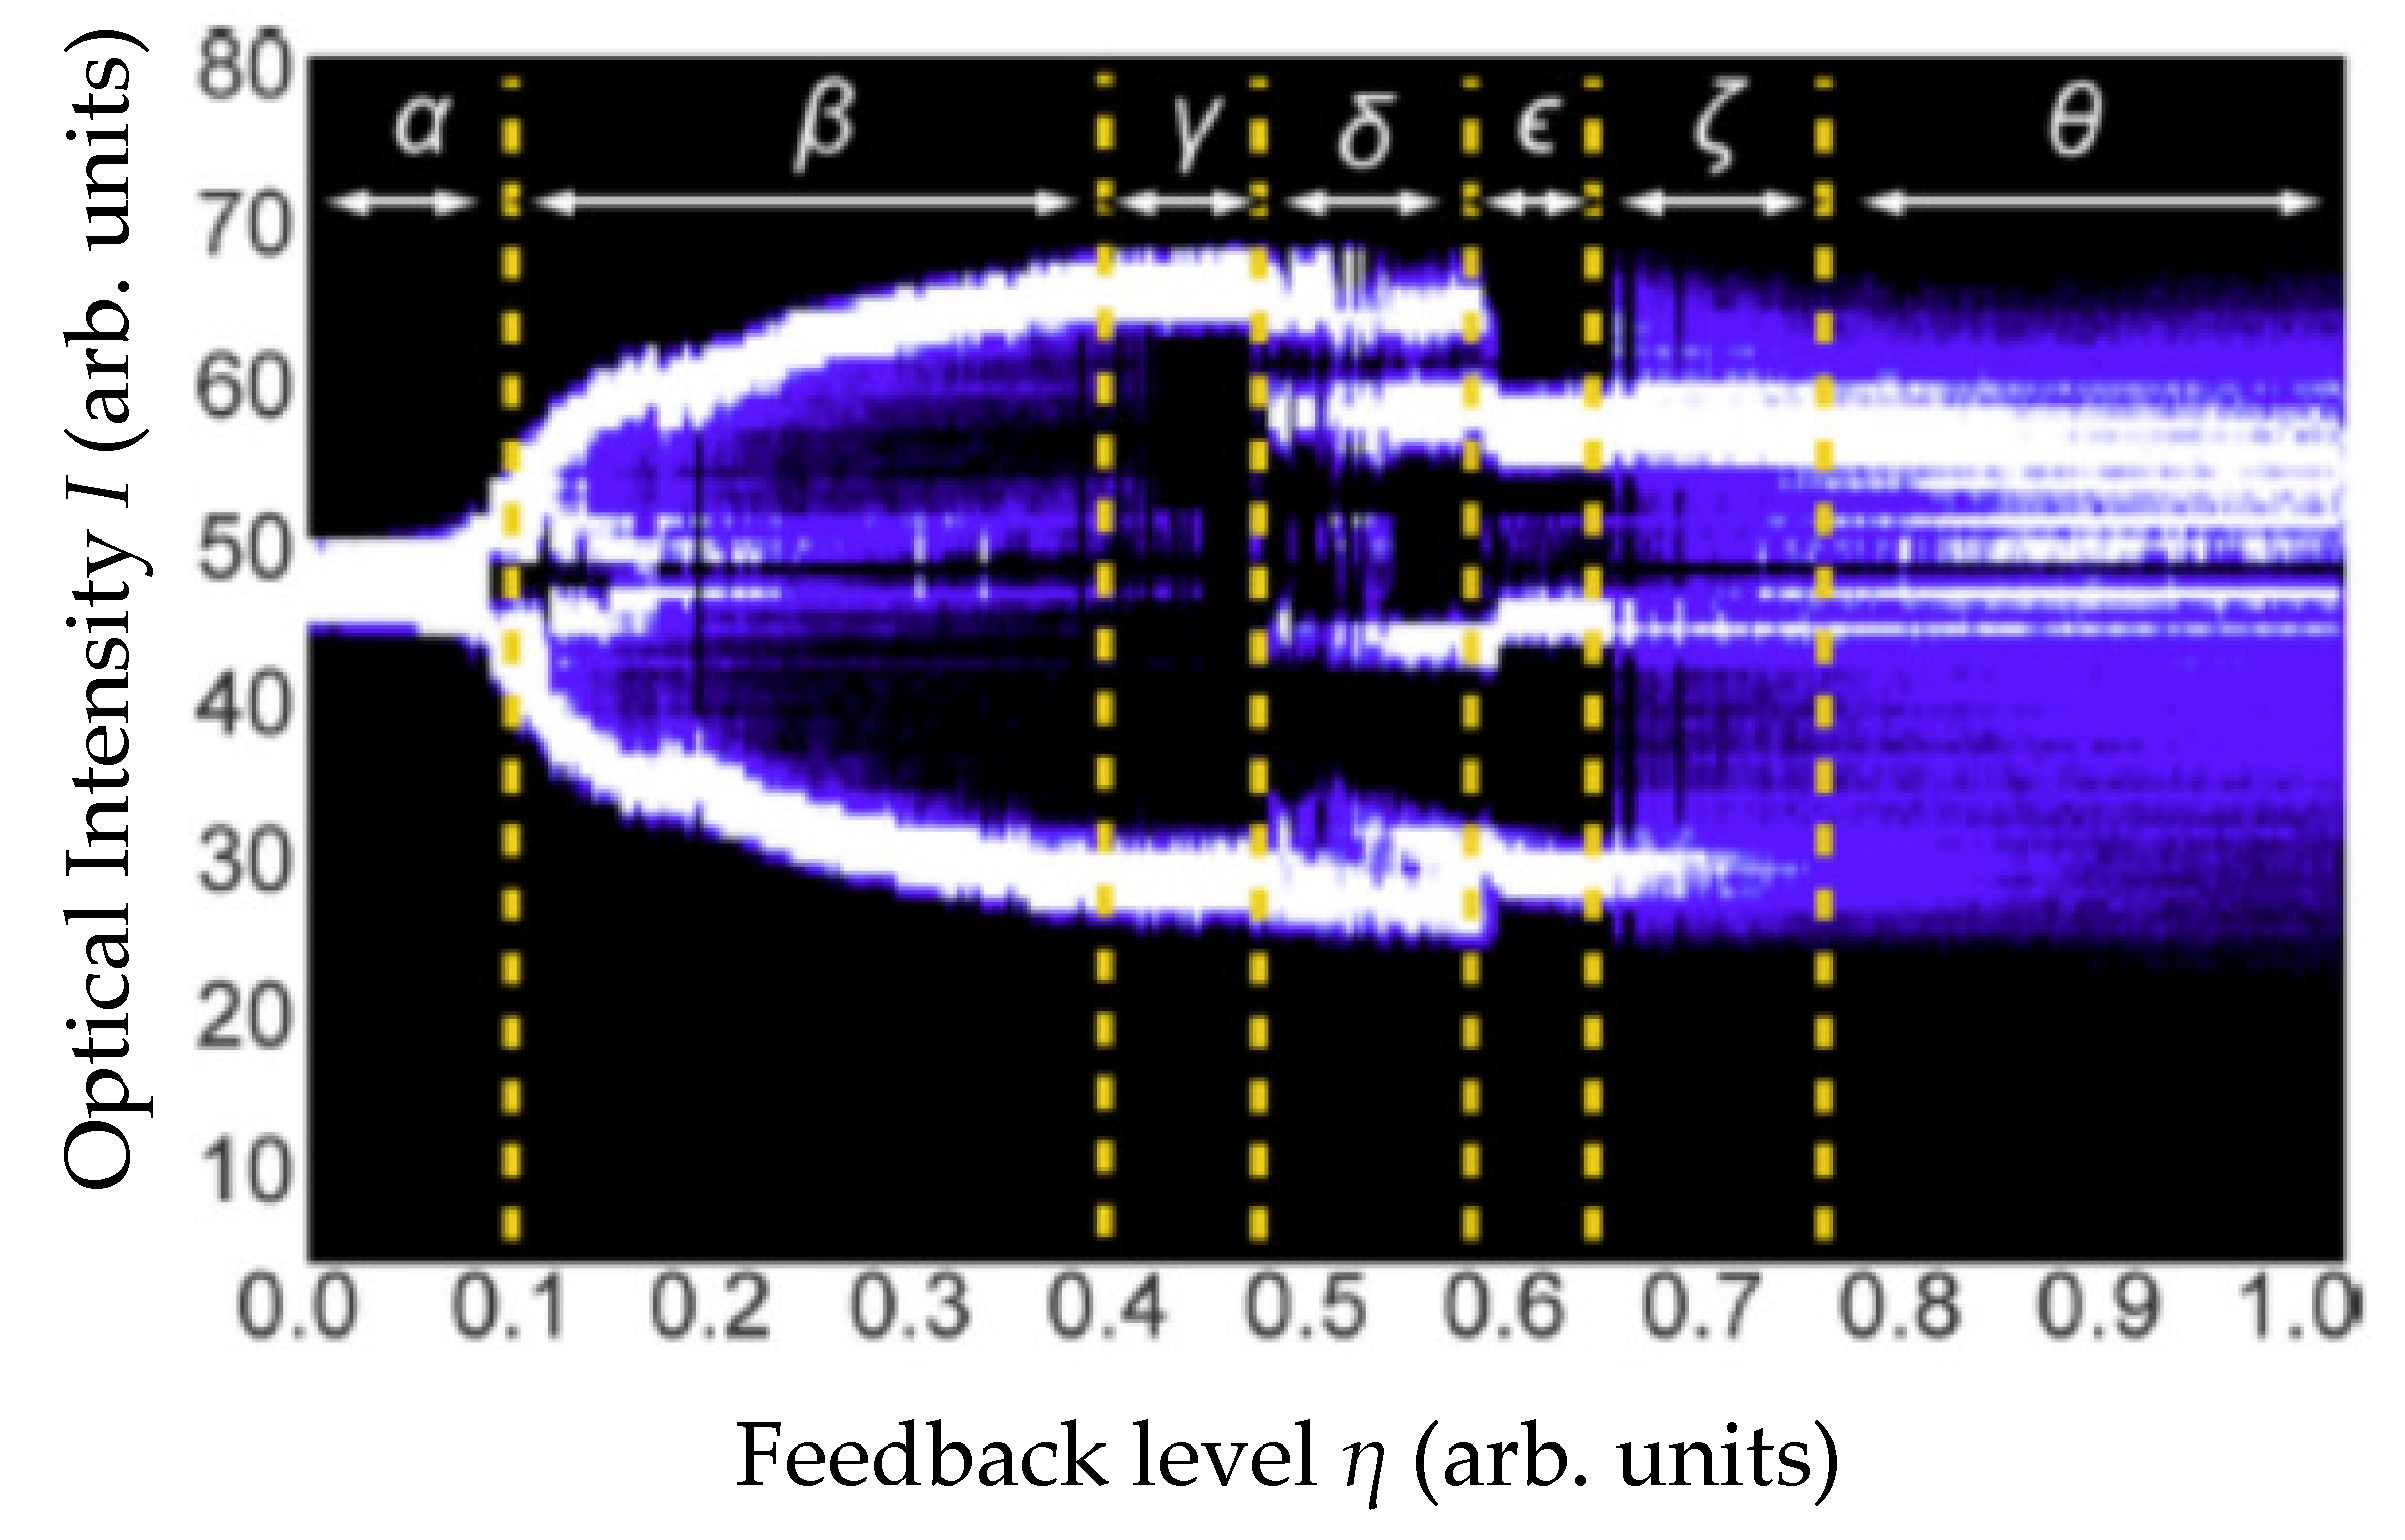
Figure 4 represents the bifurcation diagram of a LD biased at
J = 2.28
Jth, for a cavity length
L =30 cm (
fτ = 500 MHz,
fRO ~ 7.8 GHz). The bifurcation diagram is significantly different from the ones reported in the previous section, for lower current, as no alternation between CW and more complex regimes takes place. We observe a sequence of different regimes leading from CW (region
α) to fully developed coherence collapse (region
θ), going through quasiperiodic-like (QP) behavior (region
β), limit cycle (LC) periodic behavior (region
γ), a region of intermittency (region
δ) involving a subharmonic (SH) regime, a period-doubled (PD) regime (region
ε), and an intermittency region (
ζ) between PD and fully developed CC [
17,
24].
The traditional analysis of the optical intensity
I alone is insufficient to unravel this complex sequence of dynamics. For this reason, we have analyzed simultaneously the laser voltage
V, the optical spectrum, and the optical phase
ϕ. Detailed experimental reports and interpretation of the intensity, phase, and optical spectrum in the various regimes can be found in Refs. [
16,
17,
24,
25]; the main points are focused on here.
The first regime that can be identified experimentally looks quasiperiodic in the time domain (region
β). A study of the optical spectra and optical phase [
16] reveals that it actually involves an alternation in time between a periodic oscillation located around ECM 1 and another ECM, which depends on feedback level (e.g., ECM −3 or ECM −4). The quasiperiodic appearance in time therefore does not result from a torus that would have developed from two successive Hopf bifurcations of a given ECM, as would be expected in a traditional quasiperiodic (Ruelle-Takens or Curry-Yorke) route [
26], but is rather the result of the interaction between two equilibria (ECMs). In addition, it is interesting to note that the high frequency of the QP regime is equal to a multiple of the delay frequency
fτ that is close to
fRO [
25] and it remains locked to that multiple if the current, and thus
fRO, is slightly varied. As the feedback is further increased, and region
γ is reached, periodic LC dynamics, located on a single ECM, are observed, again with frequencies that are (different) multiples of
fτ. Specifically, the last limit cycle of region
γ is located around ECM 2 and its RF frequency, measured both from
I(
t) and
V(
t) is equal to 7 GHz, corresponding to 14 times
fτ. The previous observations show that there appears to be locking at the RF level between the intrinsic frequencies
fτ and
fRO, from the very early stages of the dynamics.
As the feedback level is increased, the optical frequencies involved in the dynamics also tend to lock. Indeed, when the PD regime is reached in region
ε, the RF frequencies still display locking, as
I and
V show period-doubled oscillation at 3.5 GHz, corresponding to a halving of the frequency (7 GHz) of the last limit cycle of region
γ. In addition, a locking occurs at the optical frequency level since the ECMs participating in the dynamics, as revealed by the optical spectrum and phase [
16], are also separated by 7 GHz. Specifically, ECMS 3, −4, and −11 participate in the period-doubled dynamics: 3 and −11 are separated by 7 GHz, while 3 and −4, and −4 and −11, are separated by 3.5 GHz. Before this complete locking occurs, for lower feedback in region
δ, a partial locking is observed to which 3 ECMS participate: two are separated by 3.5 GHz (e.g., ECMs 0 and −7), and thus exhibit locking, while the third, ECM 3, does not. The corresponding dynamical regime (region
δ) shows a regular alternation in time between LC and PD oscillations. The duration of the LC and PD oscillations varies with the feedback level, but the sum of the main frequencies in the RF spectra always adds up to ~
fRO (e.g.,
fRO/3 and 2
fRO/3), corresponding to a subharmonic regime [
12,
16,
24]. In summary, as the feedback level is increased, the locking between the dynamical frequencies involved in the laser dynamics progresses until full locking is attained. This locked regime is not maintained indefinitely, however, as it is lost to CC. In Ref. [
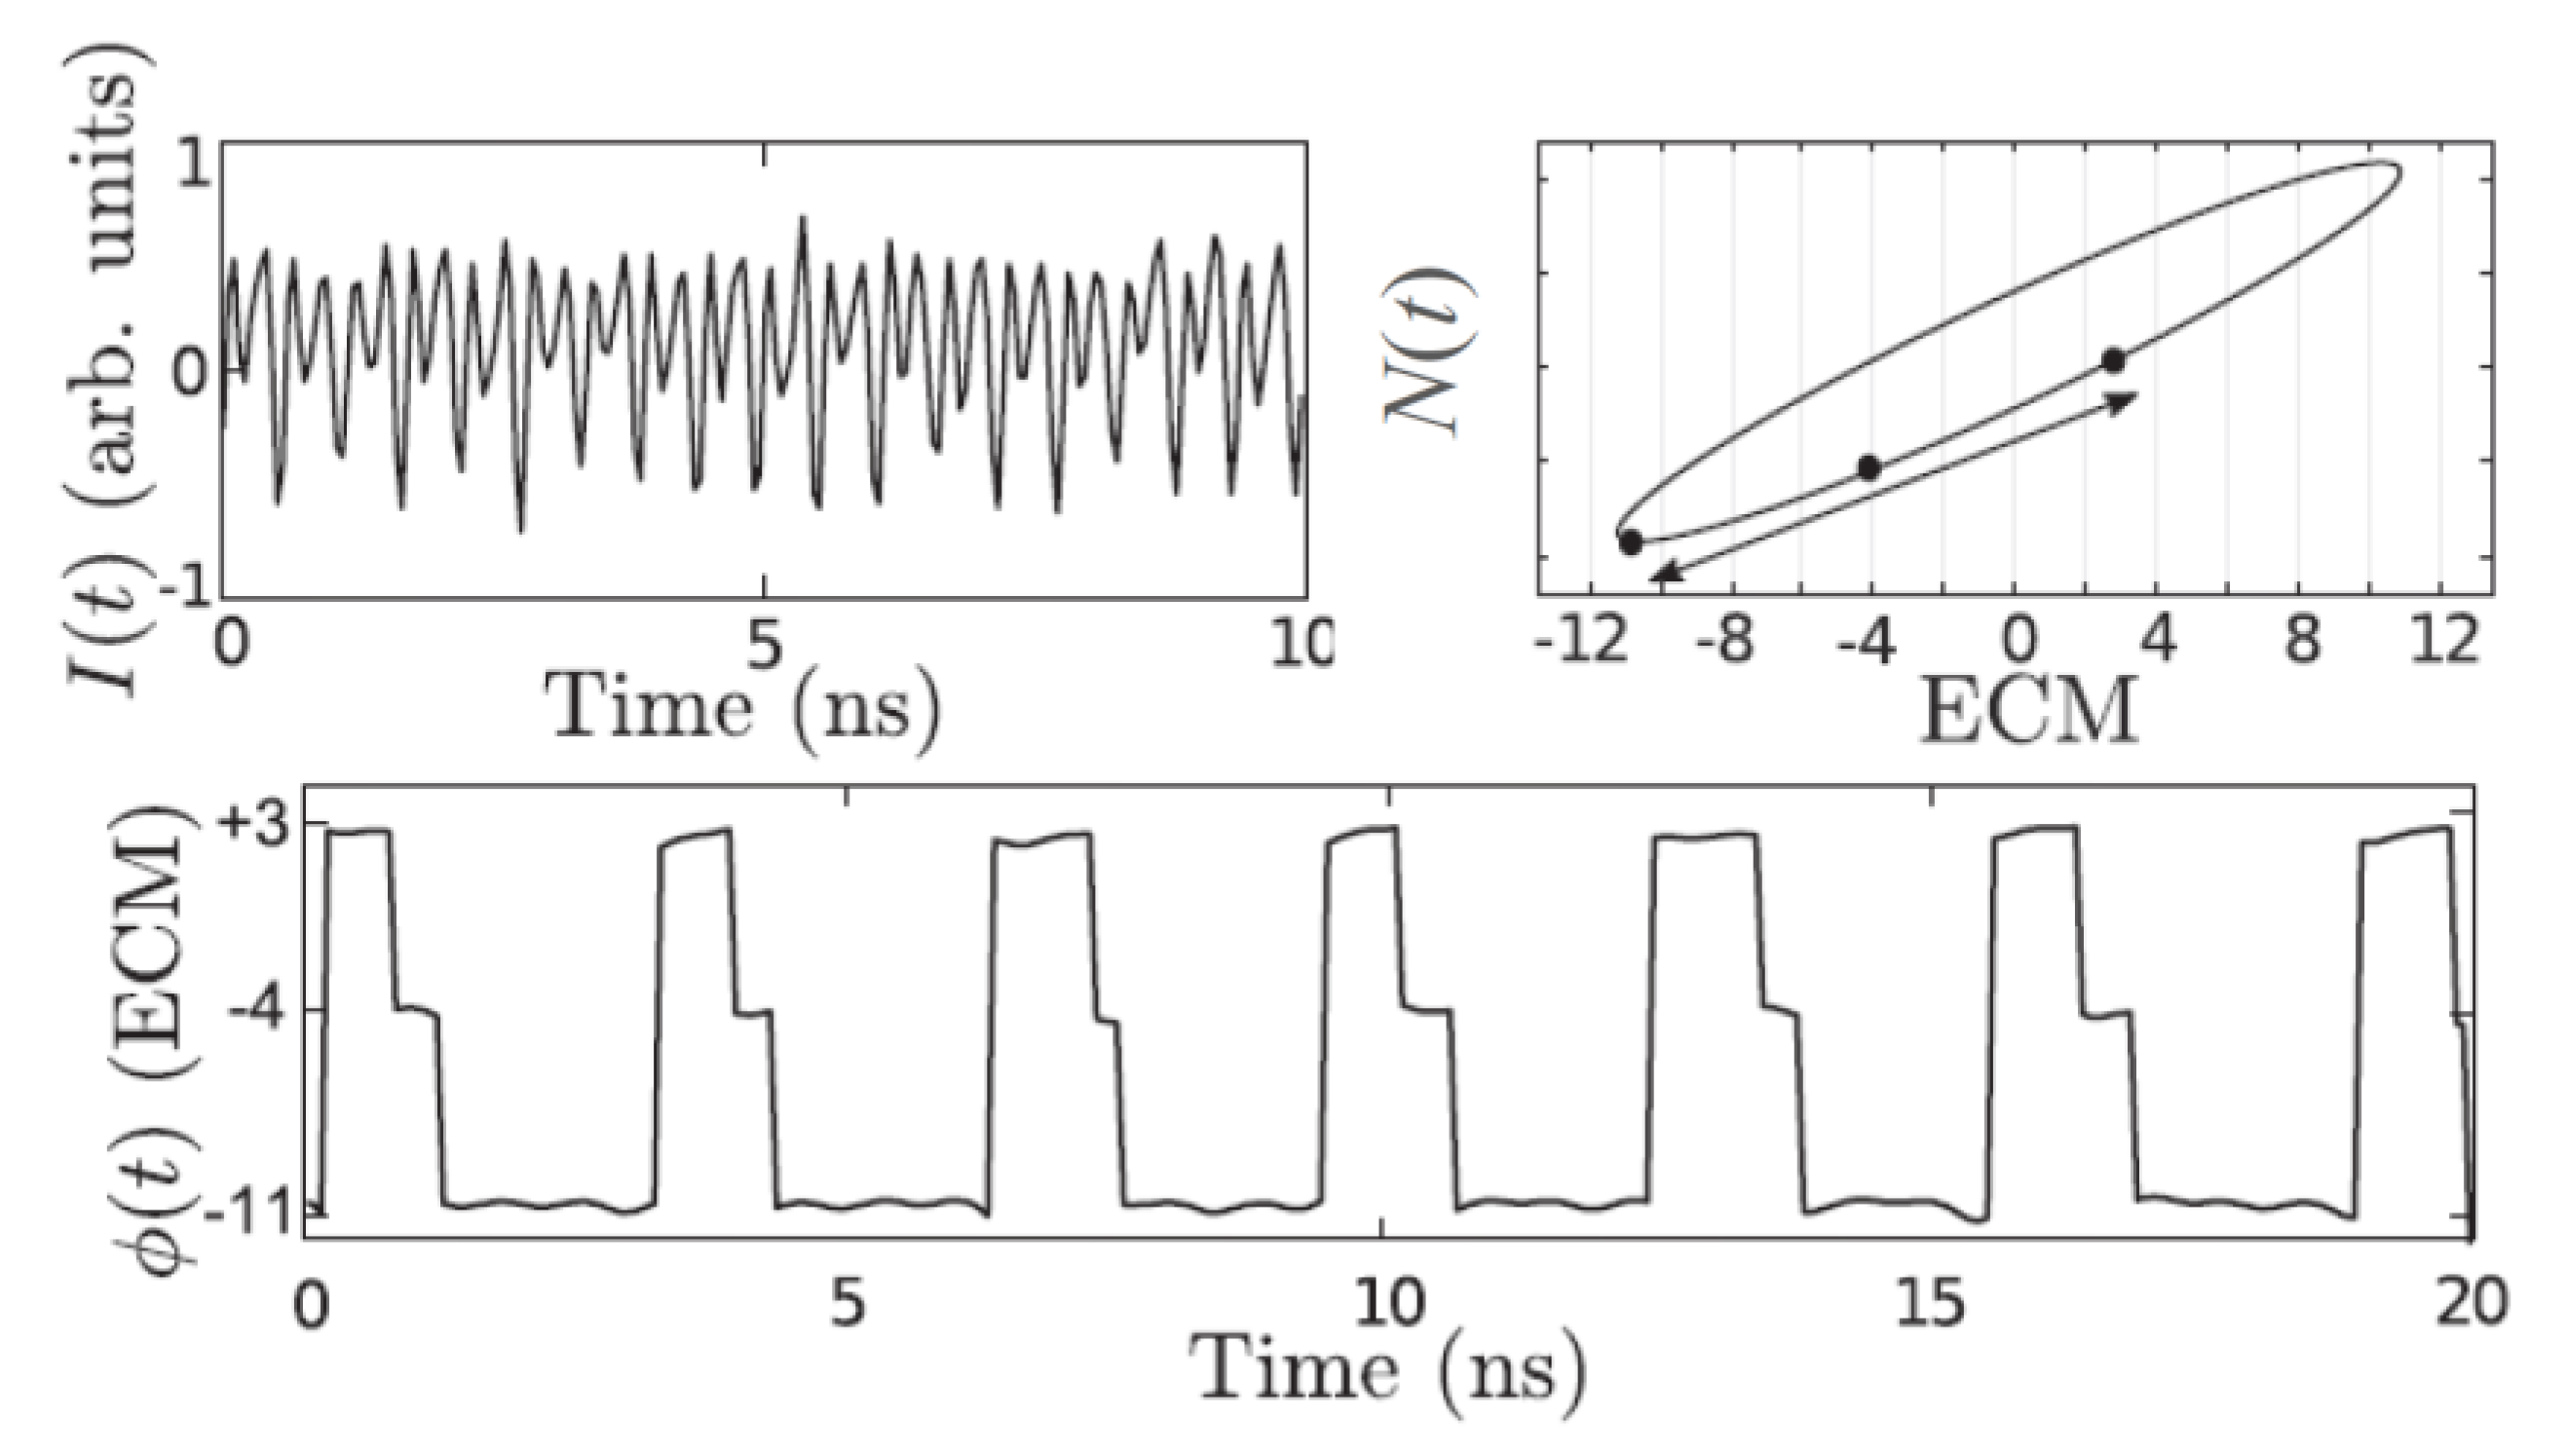
16], the disappearance of the PD regime is interpreted as resulting from a crisis. To illustrate this point, the experimentally measured optical phase
ϕ(
t) and intensity
I(t), in the PD regime, are displayed in
Figure 5. We see that the dynamical state moves, as a function of time, from ECM 3, to ECM −4, to ECM −11, then endures an abrupt repulsion toward ECM 3 again. A possible interpretation is that an antimode, located close ECM −11, provides the necessary repelling force, in the direction of its unstable manifold, and thus connects in phase space the distant ECMs −11 and +3. As the feedback level is raised, the ellipse grows in size, leading to an increase in the distance between ECM −11 and the closest antimode. When, for some feedback level, the ellipse becomes too wide, the connection breaks and a boundary crisis to CC behavior occurs. In the CC regime, as reported in numerous publications, a large number of ECMs are involved [
1,
2] and the intensity, voltage, and phase are observed to vary chaotically. Of note, the sequence of bifurcations described in this section has been observed consistently for a range of quantum well lasers, as well as with a quantum dash laser, illustrating the generality of the results for these types of quantum confinement. Finally, let me mention that the most common route to chaos of a semiconductor laser subjected to optical feedback, which is the one reported in this section, has often been described as a quasiperiodic route. Even though dynamical behaviors of quasiperiodic appearance are indeed observed, we have shown that the route actually differs significantly from a traditional quasiperiodic route [
26,
27] in which a single equilibrium point undergoes a series of Hopf bifurcations leading to periodic then quasiperiodic behavior, and finally chaos. In Ref. [
16], we have proposed to name the sequence of bifurcations a crisis route to chaos.
7. Discussion
In this article, I have reviewed the experimentally observed routes to CC of a laser diode subjected to optical feedback as the feedback level is increased.
When the laser is biased close to threshold, stable dynamics around a single ECM are hardly observed, with the notable exception of CW behavior on the MGM, which displays a negative frequency shift with respect to solitary laser frequency. A typical bifurcation diagram consists of an alternation between complex regimes involving numerous ECMs and regions of stable behavior that occur when the MGM becomes accessible.
For currents significantly above threshold, the picture is different as some stable attractors develop around individual ECMs. In particular, for minor feedback, stable limit cycles develop around ECMs that have a positive frequency shift, which is consistent with the predictions by Masoller and Abraham [
28]. Of note, the RF frequencies, measured from the intensity and voltage, always display a locking between the relaxation oscillation frequency and the delay frequency. Specifically, we consistently observe that the first dominant RF frequency that can be identified experimentally is not the relaxation oscillation frequency
fRO but rather a multiple of the delay frequency
fτ that is close to
fRO. Of note, by dominant frequency, we either mean the fast frequency, when quasiperiodic-like behavior is the first observed in the bifurcation sequence, or the actual oscillation frequency, when LC dynamics are observed first (as reported in Ref. [
18], different ECMs can be experimentally selected as starting states of bifurcation diagrams, resulting in different initial instabilities). Interestingly, similar locking has also been reported in quantum dot lasers subjected to optical feedback [
25].
As the feedback level increases and the ellipse grows, allowing for the coexistence of ECMs that are distant in frequency, partial then complete locking of the optical frequencies of the ECMs also occurs. Partial locking takes place in the subharmonic regime. Complete locking occurs in the period-doubled regime, when the optical intensity and voltage oscillate at a frequency that is also equal to the optical frequency spacing between the ECMs involved. This type of regime appears to be a mixed ECM solution, as described by Pieroux et al. in Ref. [
29]. Finally, for larger feedback, the locking is lost as a simple regime involving a limited number of ECMS becomes impossible and the laser dynamics become chaotic.


