Article

Verification of Non-thermal Effects of 0.3–0.6 THz-Waves on Human Cultured Cells

1
RIKEN, Center for Advanced Photonics, Sendai 980-0845, Japan
2
Terahertz technology research Center, National Institute of Information and Communications Technology, Koganei 184-8795, Japan
3
Graduate School of Engineering, Nagoya University, Nagoya 464-8603, Japan
*
Author to whom correspondence should be addressed.
Photonics 2019, 6(1), 33; https://doi.org/10.3390/photonics6010033
Submission received: 30 January 2019 / Revised: 20 March 2019 / Accepted: 21 March 2019 / Published: 25 March 2019
(This article belongs to the Special Issue Terahertz Photonics)

Abstract

:
Recent progress has been made in the development of terahertz (THz) waves for practical applications. Few studies that have assessed the biological effects of THz waves have been reported, and the data currently available regarding the safety of THz waves is inadequate. In this study, the effect of THz wave exposure on two cultured cells was assessed using a widely tunable THz source with a 0.3–0.6 THz frequency range, which can be used and increased in one GHz increments. The THz waves applied to the cultured cells were weak enough such that any thermal effects could be disregarded. The influence of THz wave exposure on both the proliferative and metabolic activities of these cells was investigated, as well as the extent of the thermal stress placed on the cells. In this work, no measurable effect on the proliferative or metabolic activities of either cell type was observed following the exposure to THz waves. No differences in the quantity of cDNA related to heat shock protein 70 was detected in either the sham or exposure group. As such, no differences in cellular activity between cells exposed to THz waves and those not exposed were observed.

1. Introduction

The number of devices that use electromagnetic waves has increased in recent years, with rapid progress being made in the development of applications for waves such as in high-speed communication and security scanning technologies in the millimeter and terahertz (THz) frequency ranges [1], including wireless data transmission at 24 and 40 Gbit/s at 300 GHz using a Uni-Travelling-Carrier Photodiode (UTC-PD) [2,3]. As THz technology advances, studies of the biological effects of exposure to THz waves are required. Despite this, to the best of our knowledge, no adequate assessment of the biological effects of electromagnetic waves at these frequencies has been made [4]. Wilmink et al. [5] reviewed that irradiation with THz waves at high intensity can generate heat and damage cells.
According to recent research trends published by the Scientific Committee on Emerging and Newly Identified Health Risks (SCENIHR) of the European Commission [6], there have been few studies to date that investigate the biological effects of the THz frequency range (0.1–1.0 THz). The SCENIHR report recommended further research focusing on the impact of THz waves on the skin (low-intensity long-term exposure) and eyes (high-intensity short-term exposure). In recent years, increasing research attention has been focused on the frequency range near 0.1 THz (0.031–5 mW/cm2) [7,8,9,10,11,12,13], which studied genomic instability and damage, genotoxicity, morphological changes, enzyme activity, etc. In addition, a number of studies have focused on the frequency range near 2 THz (0.03 mW/cm2–1.4 W/cm2) [14,15,16,17,18,19], which studied gene expression, DNA damages, genotoxicity, inflammatory responses and stress systems etc. Research that examines the biological effects of exposure to the 0.2–2.0 THz frequency range is still lacking.
Fröhlich hypothesized that the frequency at which resonance oscillation occurs in the cell membrane (phospholipid bilayer) exists in the THz band (approximately 0.1–1 THz) [20], suggesting that the THz wave band may have non-thermal effects. Several reports published thus far have claimed to have verified this hypothesis for the frequency band below 0.1 THz [21,22,23]. However, this hypothesis has not been entirely verified by these studies, as the frequencies investigated were lower than expected, and the tuning range of the millimeter wave sources used were insufficient. Recent advancements in technology have allowed the development of millimeter-wave/THz-wave sources that are capable of variable frequencies (widely tunable) and are also tunable by 1 GHz steps within a wide range. One wave source with this capability is the UTC-PD. Using the UTC-PD, we aimed to investigate the potential non-thermal effects of long-term exposure to weak radiation, thereby allowing any thermal effects (frequency range: 0.3–0.6 THz, intensity: <4.5 μW/cm2) on cultured cells to be ignored.
We proposed a novel method for observing the morphology of cells irradiated with THz waves. Many studies of the biological effects of THz irradiation have exposed samples through the bottoms of dishes because of the high water absorptance in the THz region [24,25,26]. However, this method cannot be used with an inverted microscope, as high-magnification objective lenses block THz irradiation. An inverted microscope is useful for observing adherent and suspended cells and various microbes cultured in dishes. We devised a simple method for irradiating the dishes with THz waves from above.

2. Materials and Methods

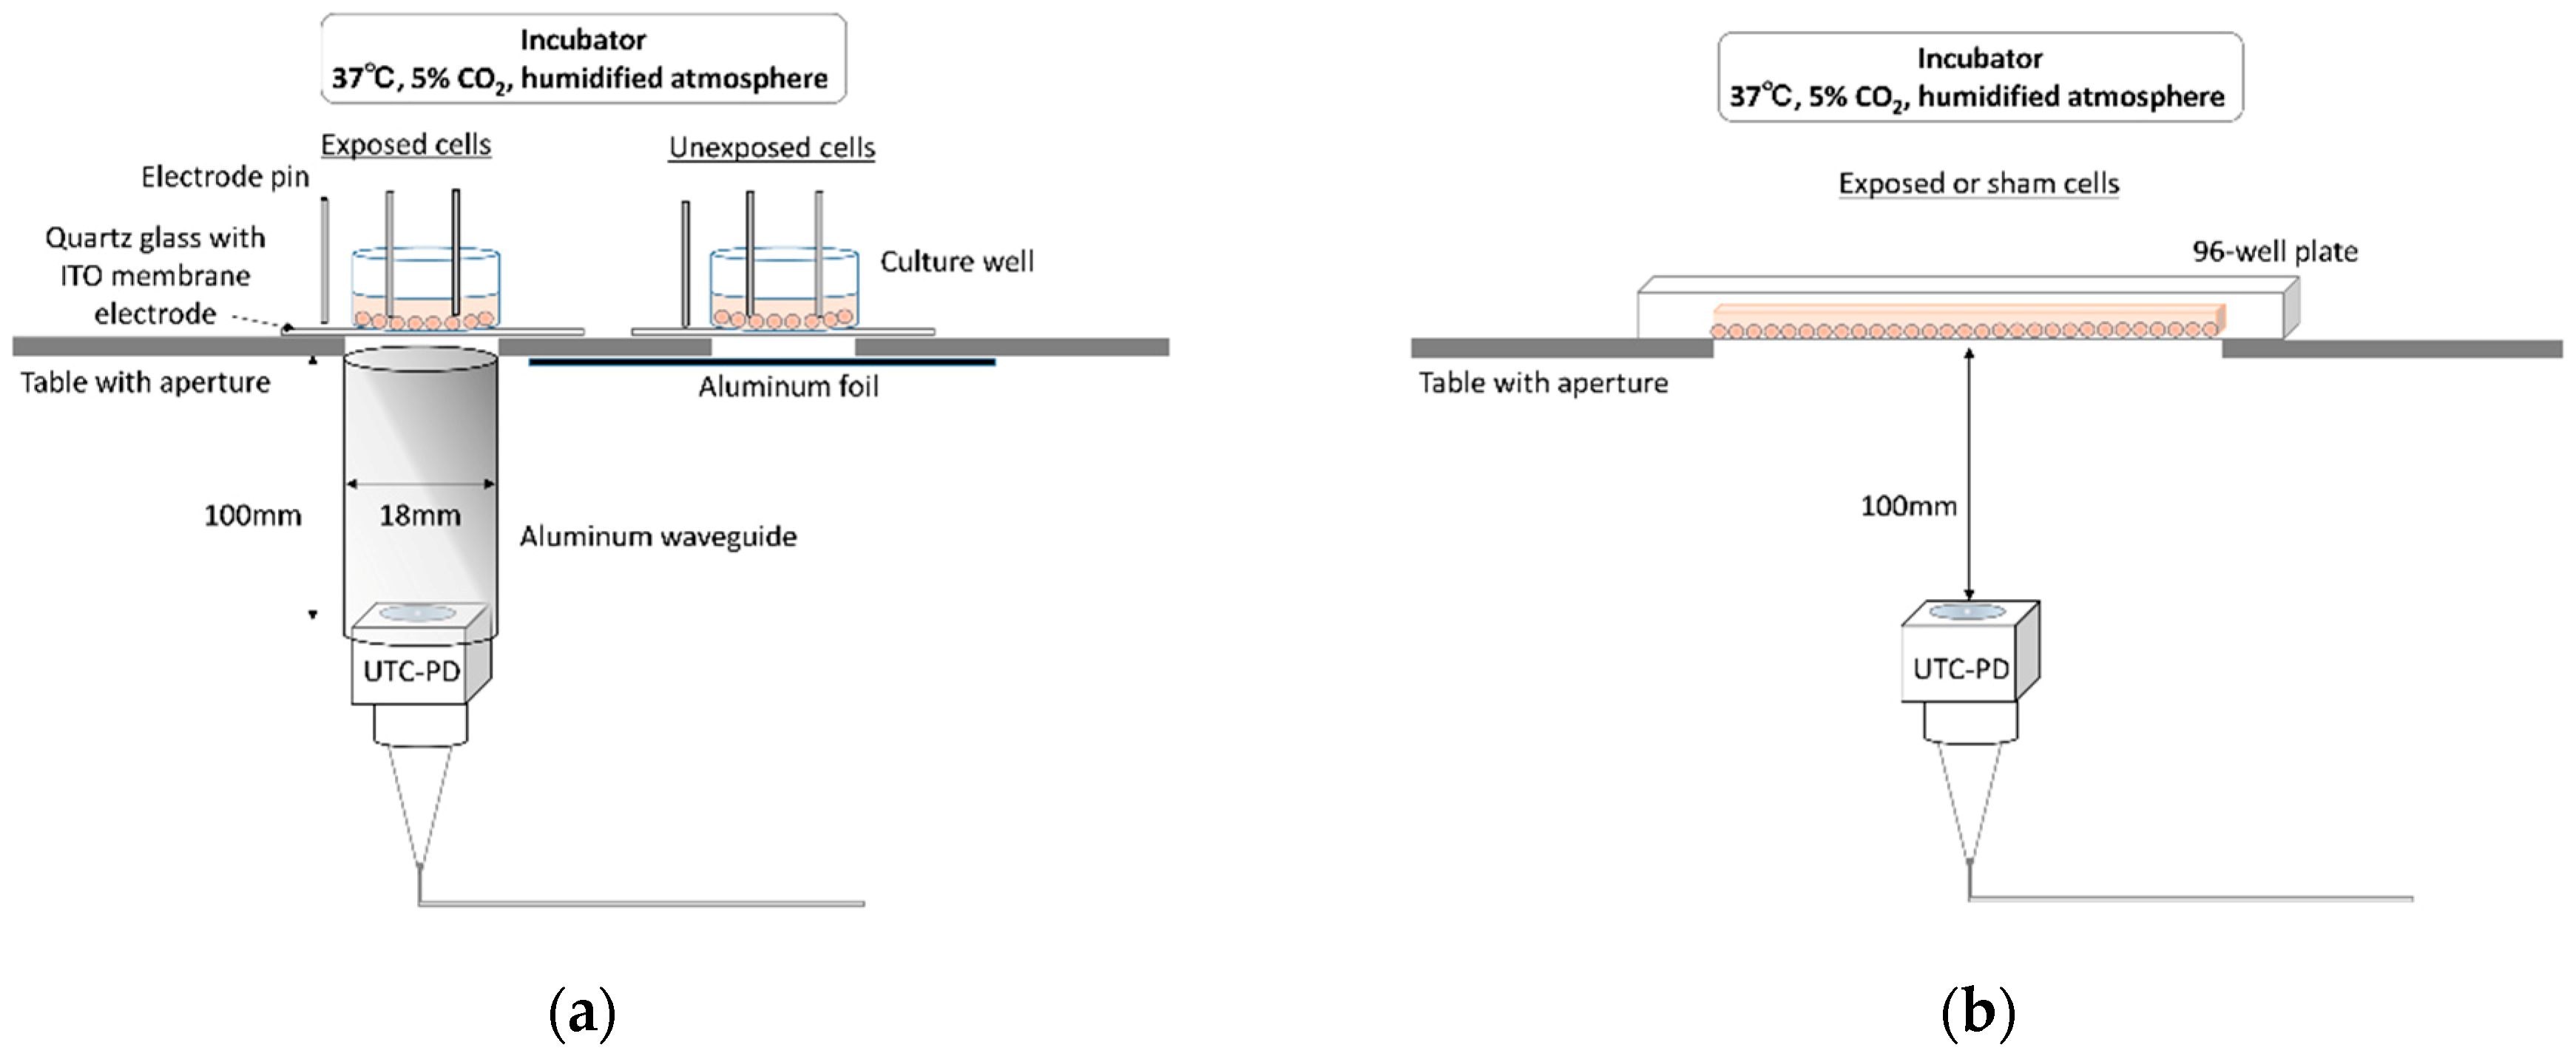
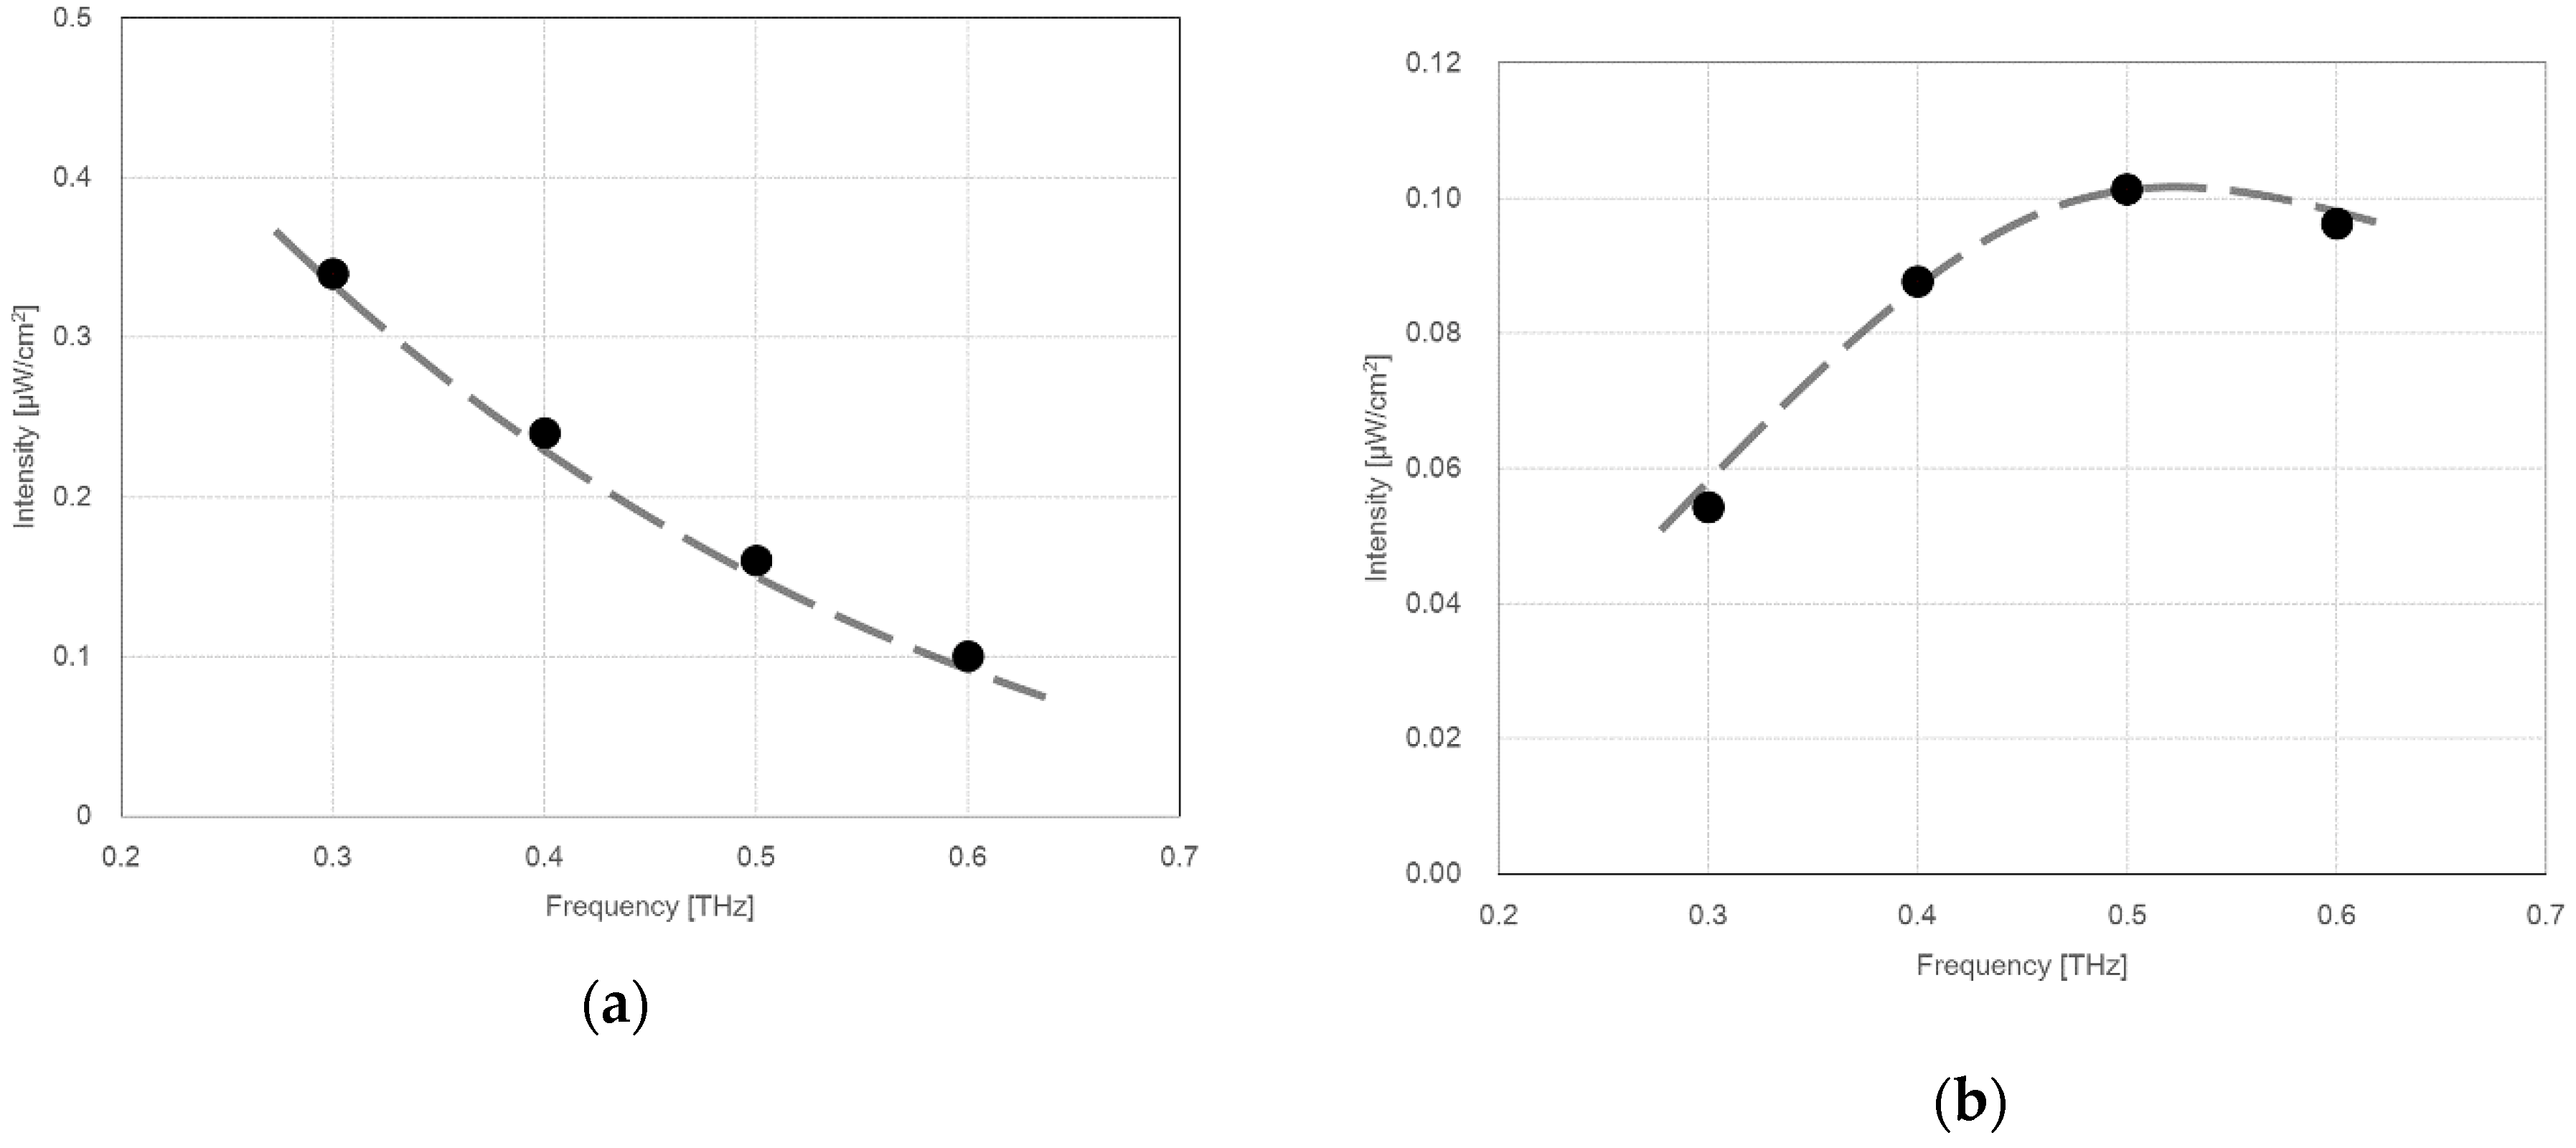
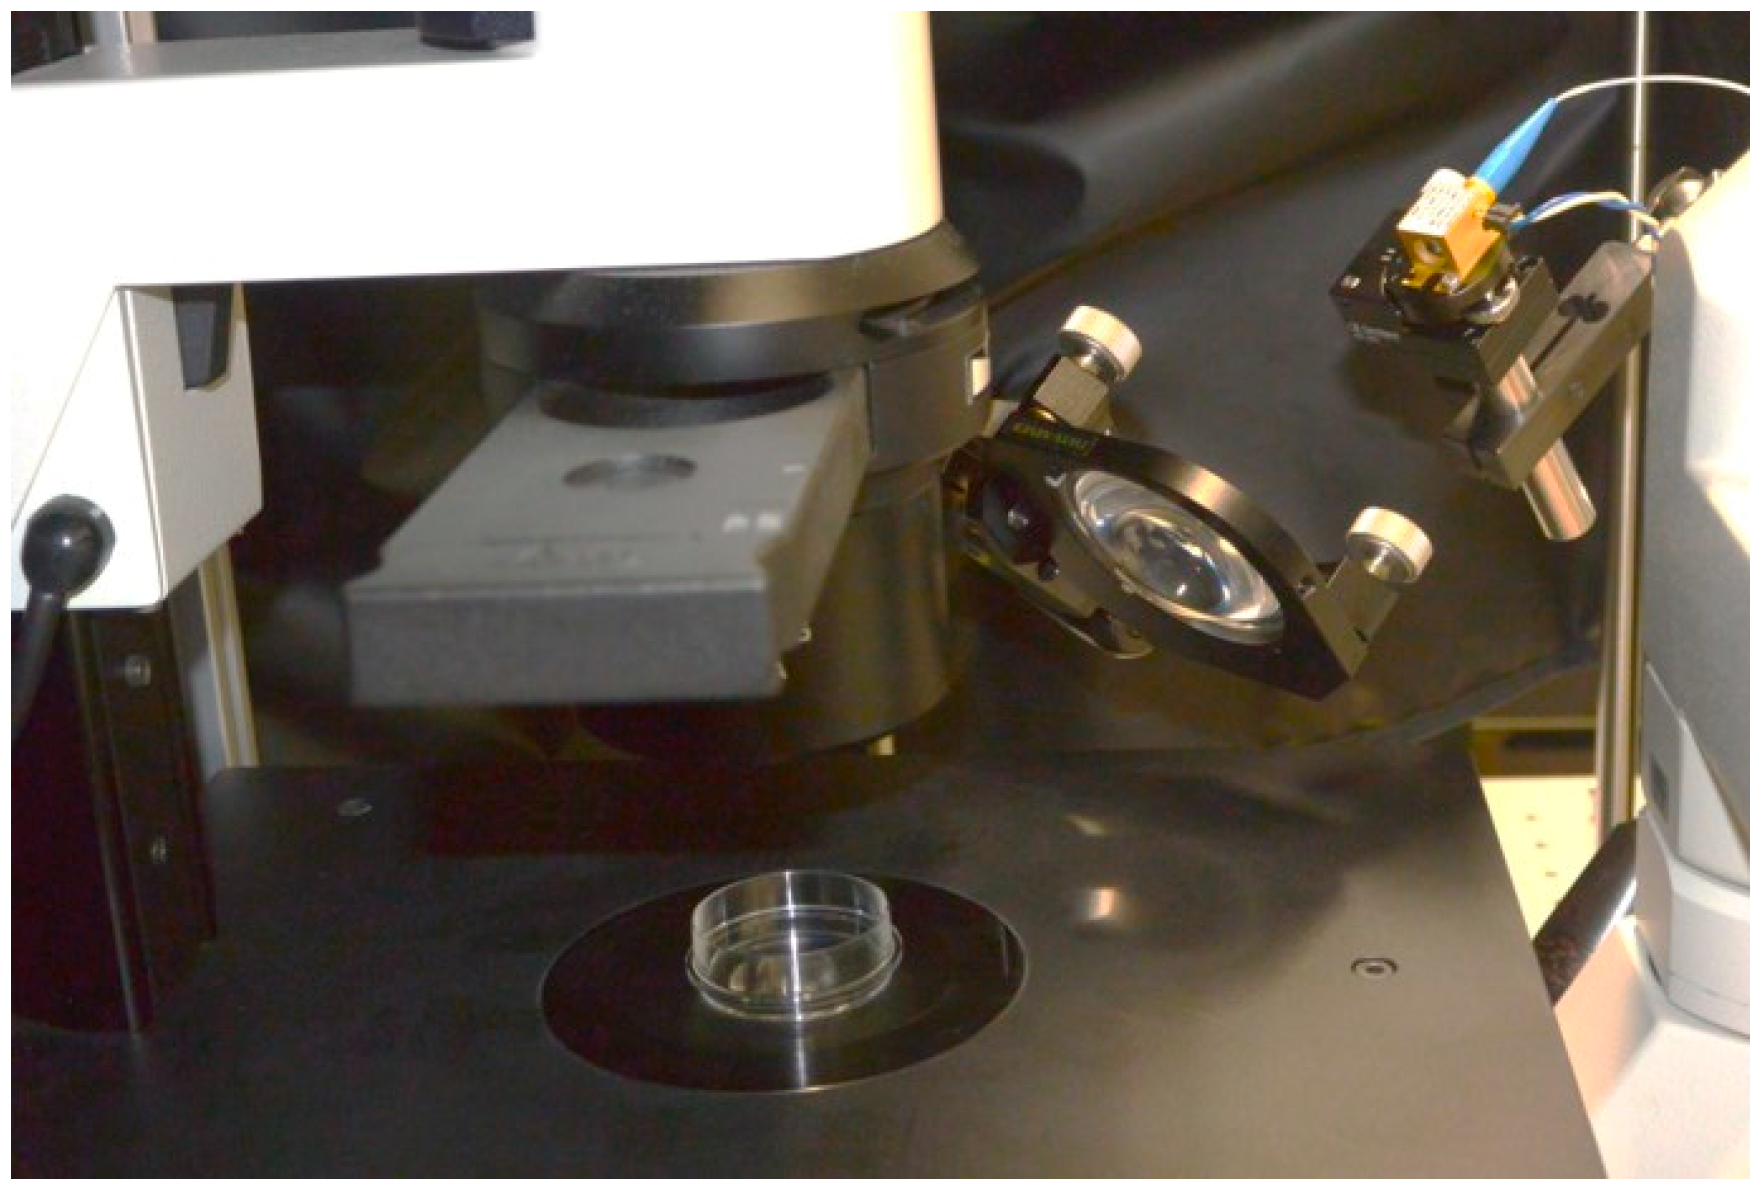
2.1. THz Wave Source

A UTC-PD (NTT Electronics Inc., Yokohama, Japan) was used as the millimeter-wave/THz-wave source. This wave source generates tunable continuous waves, from 10 GHz to 2 THz, by photomixing two wavelength-tunable laser diodes of approximately 1.55 µm on the photodiode [27]. In this study, the wave source was placed in the incubator (positioned approximately 100 mm below the culture well) and the beam divergence angle was adjusted using a silicon lens [28] to ensure that the entire bottom of the well was irradiated (Figure 1a,b). Figure 2 shows the frequency dependence of the irradiation intensity inside the culture well (a) and 96-well plate (b). The frequency range of the irradiated THz waves was 0.3–0.6 THz. In the case of the culture well, the irradiated THz wave covered the well through an aluminum waveguide, with an intensity less than 1 μW/cm2, including both coupling and propagating loss by the waveguide and an absorption loss by the bottom of cell. In the case of the 96-well plate, the irradiated THz wave covered all of the 96 wells through free space, with the intensity approximately 0.1 μW/cm2, including absorption loss by the bottom of the well.
The absolute power and beam profile of the THz waves were measured using a pre-calibrated pyroelectric detector (THz 20; Sensor und Lasertechnik, Wildau, Germany) and an InSb Hot Electron Bolometer (QFI/X; QMC Instruments Ltd., Cardiff, UK), respectively. Temperature shifts inside the incubator caused by the self-heating of the UTC-PD were observed to be less than 0.3 °C.
We devised a simple method for irradiating the dishes with THz waves from above to observe cell morphology. To irradiate from the top of the dish, the irradiation system was constructed on the inverted microscope stage (Figure 3). The irradiation light from the UTC-PD was converged in a lens (Tsurupica; PAX Co., Sendai, Japan). The irradiation intensity was estimated from the output of the light source and the beam diameter on the dish to be 4.1~5 µW/cm2 at 0.3–0.6 THz.

2.2. Cells Used for the THz Wave Exposure

Two cell lines were cultured for use in this study. Normal human skin fibroblast (NB1RGB) and human corneal epithelial (HCE-T) cells lines [29] were both obtained from RIKEN BioResource Research Center, Japan. To culture NB1RGB cells, 10% fetal bovine serum (USDA Tested FBS; GE Healthcare UK Ltd., Little Chalfont, England) was added to MEM 1 × ALPHA plus GlutaMax (Life Technologies Corporation, Carlsbad, CA, USA). To culture HCE-T cells, 5% FBS, 5 μg/mL insulin, 10 ng/mL hEGF, and 0.5% dimethylsulfoxide (DMSO) were added to DMEM:HamF12 (1:1) (FUJIFILM Wako Pure Chemical Corporation, Osaka, Japan). Incubation was carried out at 37°C in a saturated steam environment and a 5% CO2 atmosphere.

2.3. Cell Proliferation

An alternating current impedance measurement method (BM2401; HIOKI E.E. CORPORATION, Ueda, Japan) was used for cell proliferation. Figure 1a shows a scheme of the exposure set-up for cell proliferation. An ITO membrane electrode was affixed to the bottom (area: 0.785 cm2) of the culture well. In this method of measuring cell proliferation, the impedance current flow between the ITO electrode membrane and electrode pin was recorded. The impedance value changes during cell growth on the ITO membrane. If the cells adhered to the ITO membrane electrode proliferate, the flow of the electrical current is disturbed, and the impedance value would increase. The reactance ratio was calculated based on this value, and the cellular growth curve was derived from this ratio. Cell proliferation was indirectly measured using the method described above. The impedance value was measured at a frequency of 100 kHz every 5 min over a 94 h period. As a positive control, 20% of DMSO was added to cells instead of THz wave irradiation.
The emitter of the UTC-PD was placed in an aluminum light pipe positioned 100 mm below the bottom of the culture well that contained the exposed cells. The bottom of the well containing the unexposed cells was covered with an aluminum foil impermeable to THz waves to prevent exposure. The bottom of the culture wells had a thickness of 0.7 mm and approximately 10% THz wave permeability. Twelve thousand cells were seeded per well and cultured normally for 26 h. The exposed cells were then continuously exposed to THz waves, starting at a frequency of 0.3 THz and increasing to 0.6 THz in 1-GHz steps every 18 min and 34 s over a 94 h period. Following exposure, the cells were observed under a microscope (DM IL LED; Leica Microsystems, Wetzlar, Germany).

2.4. Cell Viability

We investigated the viability of cells exposed to THz waves during cell proliferation. A 96-well plate (THz wave permeability of 90%; Corning, Corning, NY, USA) was used for the cell culture. To ensure consistency in the measurement between the exposed and sham cells, two incubators of the same model were used, one for each group (Figure 1b).
Cell viability for each cell group was determined using the MTT assay [30]. Four thousand cells were seeded in a single well of a 96-well plate and cultured for 2 h, until the cells adhered to the surface at the bottom of the well. The exposure group cells were then continuously exposed to THz waves, starting at a frequency of 0.3 THz, increasing to 0.6 THz with 1-GHz steps every 13 min and 47 s over a 70 h period. The colorimetric assay reagent CellTiter 96® AQueous One Solution Cell Proliferation Assay (Promega Corporation, Madison, WI, USA) [31] was added directly to the cells 72 h after seeding. The cells were then cultured for 3 h without any further exposure. Absorbance at 490 nm was measured using a microplate reader (iMark microplate reader; Bio-Rad Laboratories, Inc., Hercules, CA, USA). The positive control cells were cultured at temperatures greater than 43 °C for 70 h, and their viability was taken to be the normal culture environment for any comparisons.
Experiments were also conducted that involved changing the timing of exposure, following the same procedure. Cells were cultured for 72 h without exposure to THz waves. After culturing, reagents were added directly to the cells and cultured for another 3 h. Cells were then exposed to THz waves during this 3 h incubation time. The frequency of the exposure stimulus was increased by increments of 1-GHz every 25 s (from 0.3 THz to a maximum of 0.6 THz). The absorbance at 490 nm was then measured. As a positive control, cells were exposed to DMSO, known to be highly cytotoxic at high concentrations, for 3 h. DMSO was directly added to the cells after the absorbance was measurement was taken.

2.5. Morphological Observations of Human Corneal Cells (HCE-T) Exposed

We monitored the morphological changes of human cornea cells (HCE-T) exposed to 0.3, 0.4, 0.5, and 0.6 THz from a variable broadband THz source and an irradiation time of 10 min. We showed experimental results of morphology in HCE-T cells with sensitive to change. HCE-T were cultured for 5 days and the confluent cells were stained with CellBrite Green cytoplasmic membrane dye (Biotium, Inc., Fremont, CA, USA), a fat-soluble carbocyanine dye that emits strong fluorescence when incorporated in a lipid bilayer membrane. The growth medium was aspirated. Then, 2.5 μL cell-labeling solution was added to 1 mL growth medium and mixed well, and 200 μL was added to the culture medium. The cells were incubated at 37 °C for 30 min. The staining medium was aspirated, and the cells washed three times. For each wash cycle, the cells were covered with warmed fresh growth medium and incubated at 37 °C for 5 min. After washing, warmed growth medium 20 μL was added to the cells, and a cell disk (LF1:MS-92132 Sumitomo Bakelite, Tokyo, Japan) was put on the cells. The total estimated thickness of the culture medium, cells, and cell desk was about 75 μm. Based on the water absorption coefficients in the THz region (α=131, 146, 160, and 176 cm−1 at 0.3, 0.4, 0.5, and 0.6 THz, respectively) and the transmittance of the cell disk (88, 86, 83, and 84% at 0.3, 0.4, 0.5, and 0.6 THz, respectively), the transmittance was 20–30%, and the THz wave intensity at the cells was approximately 1.0~1.4 μW/cm2. An inverted microscope (Leica, DMIL LED) and a fluorescence source (Leica EL6000) were used for cell observation before and after irradiation. Film-bottom dishes (FD10300 Matsunami Glass, Kishiwada, Japan) with a thin central bottom area for clear viewing were used for cell culture. To compare cell shapes, two positive controls were prepared: heat treatment at 43 °C for 10 min and immersion in DMSO for 10 min.

2.6. Assessment of the Level of Heat Shock Protein 70 mRNA Expression

mRNA expression levels of heat shock protein 70 (HSP70), which is expressed in cells in response to heat stress, were assessed. Total mRNA was extracted from cells using the RNeasy Plus Mini Kit (QIAGEN, Hilden, Germany). HSP70 cDNA was then subsequently obtained using reverse transcription-polymerase chain reaction (RT-PCR). The primers used in this study are listed in Table 1 [32,33]. The PrimeScript One Step RT-PCR Kit Ver. 2 (Takara Bio Inc., Kusatsu, Japan) was used for RT-PCR. Amplification was performed using a thermal cycler as follows: 50 °C for 30 min, 94 °C for 2 min, followed by 30 cycles of 94 °C for 30 s, 60 °C for 30 s, and 72 °C for 60 s. The final cycle was maintained at 4 °C. β-actin was used as an internal standard. Synthesized PCR products were stained with Midori Green Direct (NIPPON Genetics Co., Ltd., Tokyo, Japan) and electrophoresed in a 2% agarose gel at 100 V for 28 min.

2.7. Statistical Analysis Method

Cell proliferation and cell viability experiments were performed in triplicate. Cell growth curves were derived by averaging 3–4 sets of measurement data at each frequency. Cell viability was calculated as the mean value ± standard deviation (SD). Cellular activity and cell viability were calculated based on radiation absorbance exhibited, with the absorbance by unexposed or sham cells taken to be 100% and the absorbance by exposed cells calculated as (absorbance by exposed cells/absorbance by unexposed or sham cells) × 100 %. Exposed, unexposed, or sham cells were then compared with respect to each data set and subjected to a significant difference test (risk ratio: 95%), comprising the t-test.

3. Results

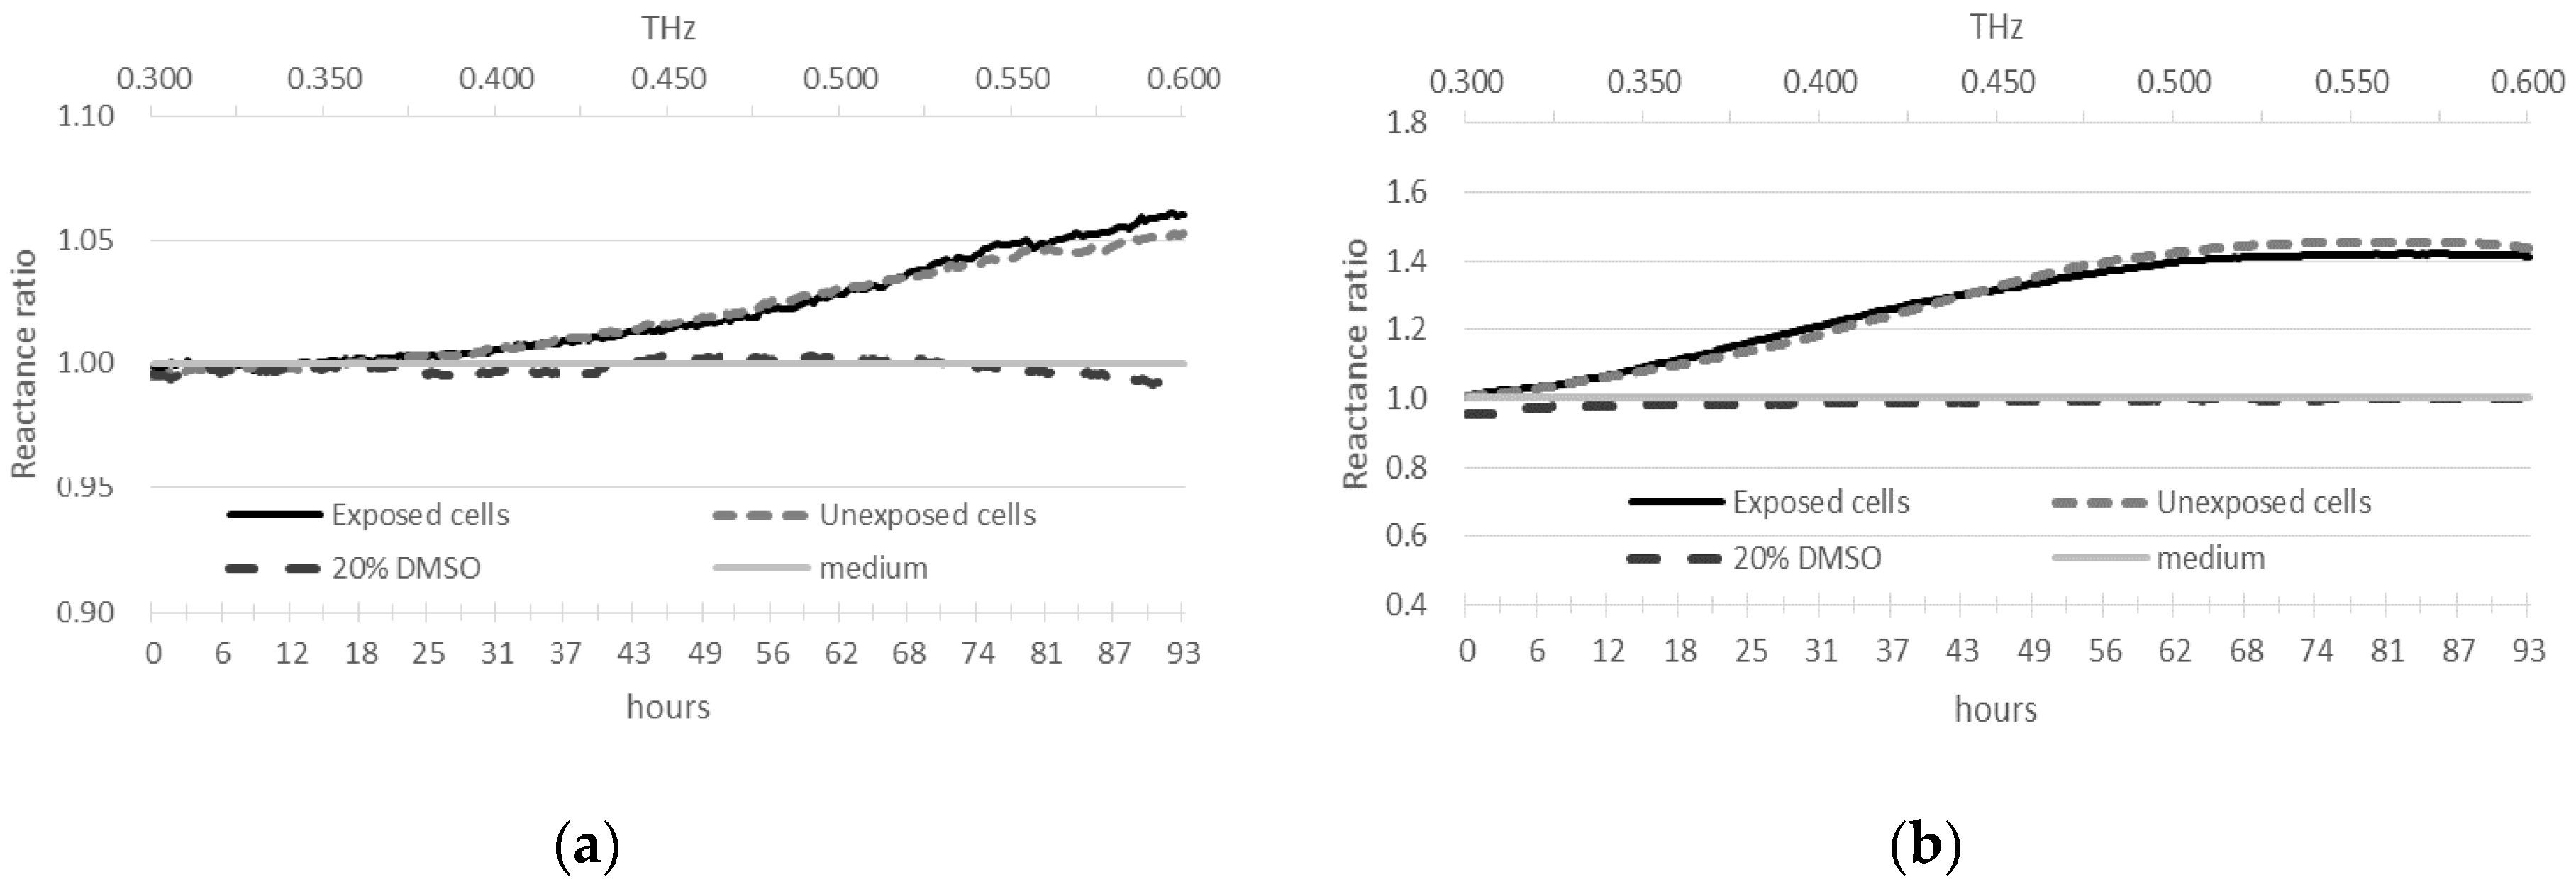
3.1. Cell Proliferation
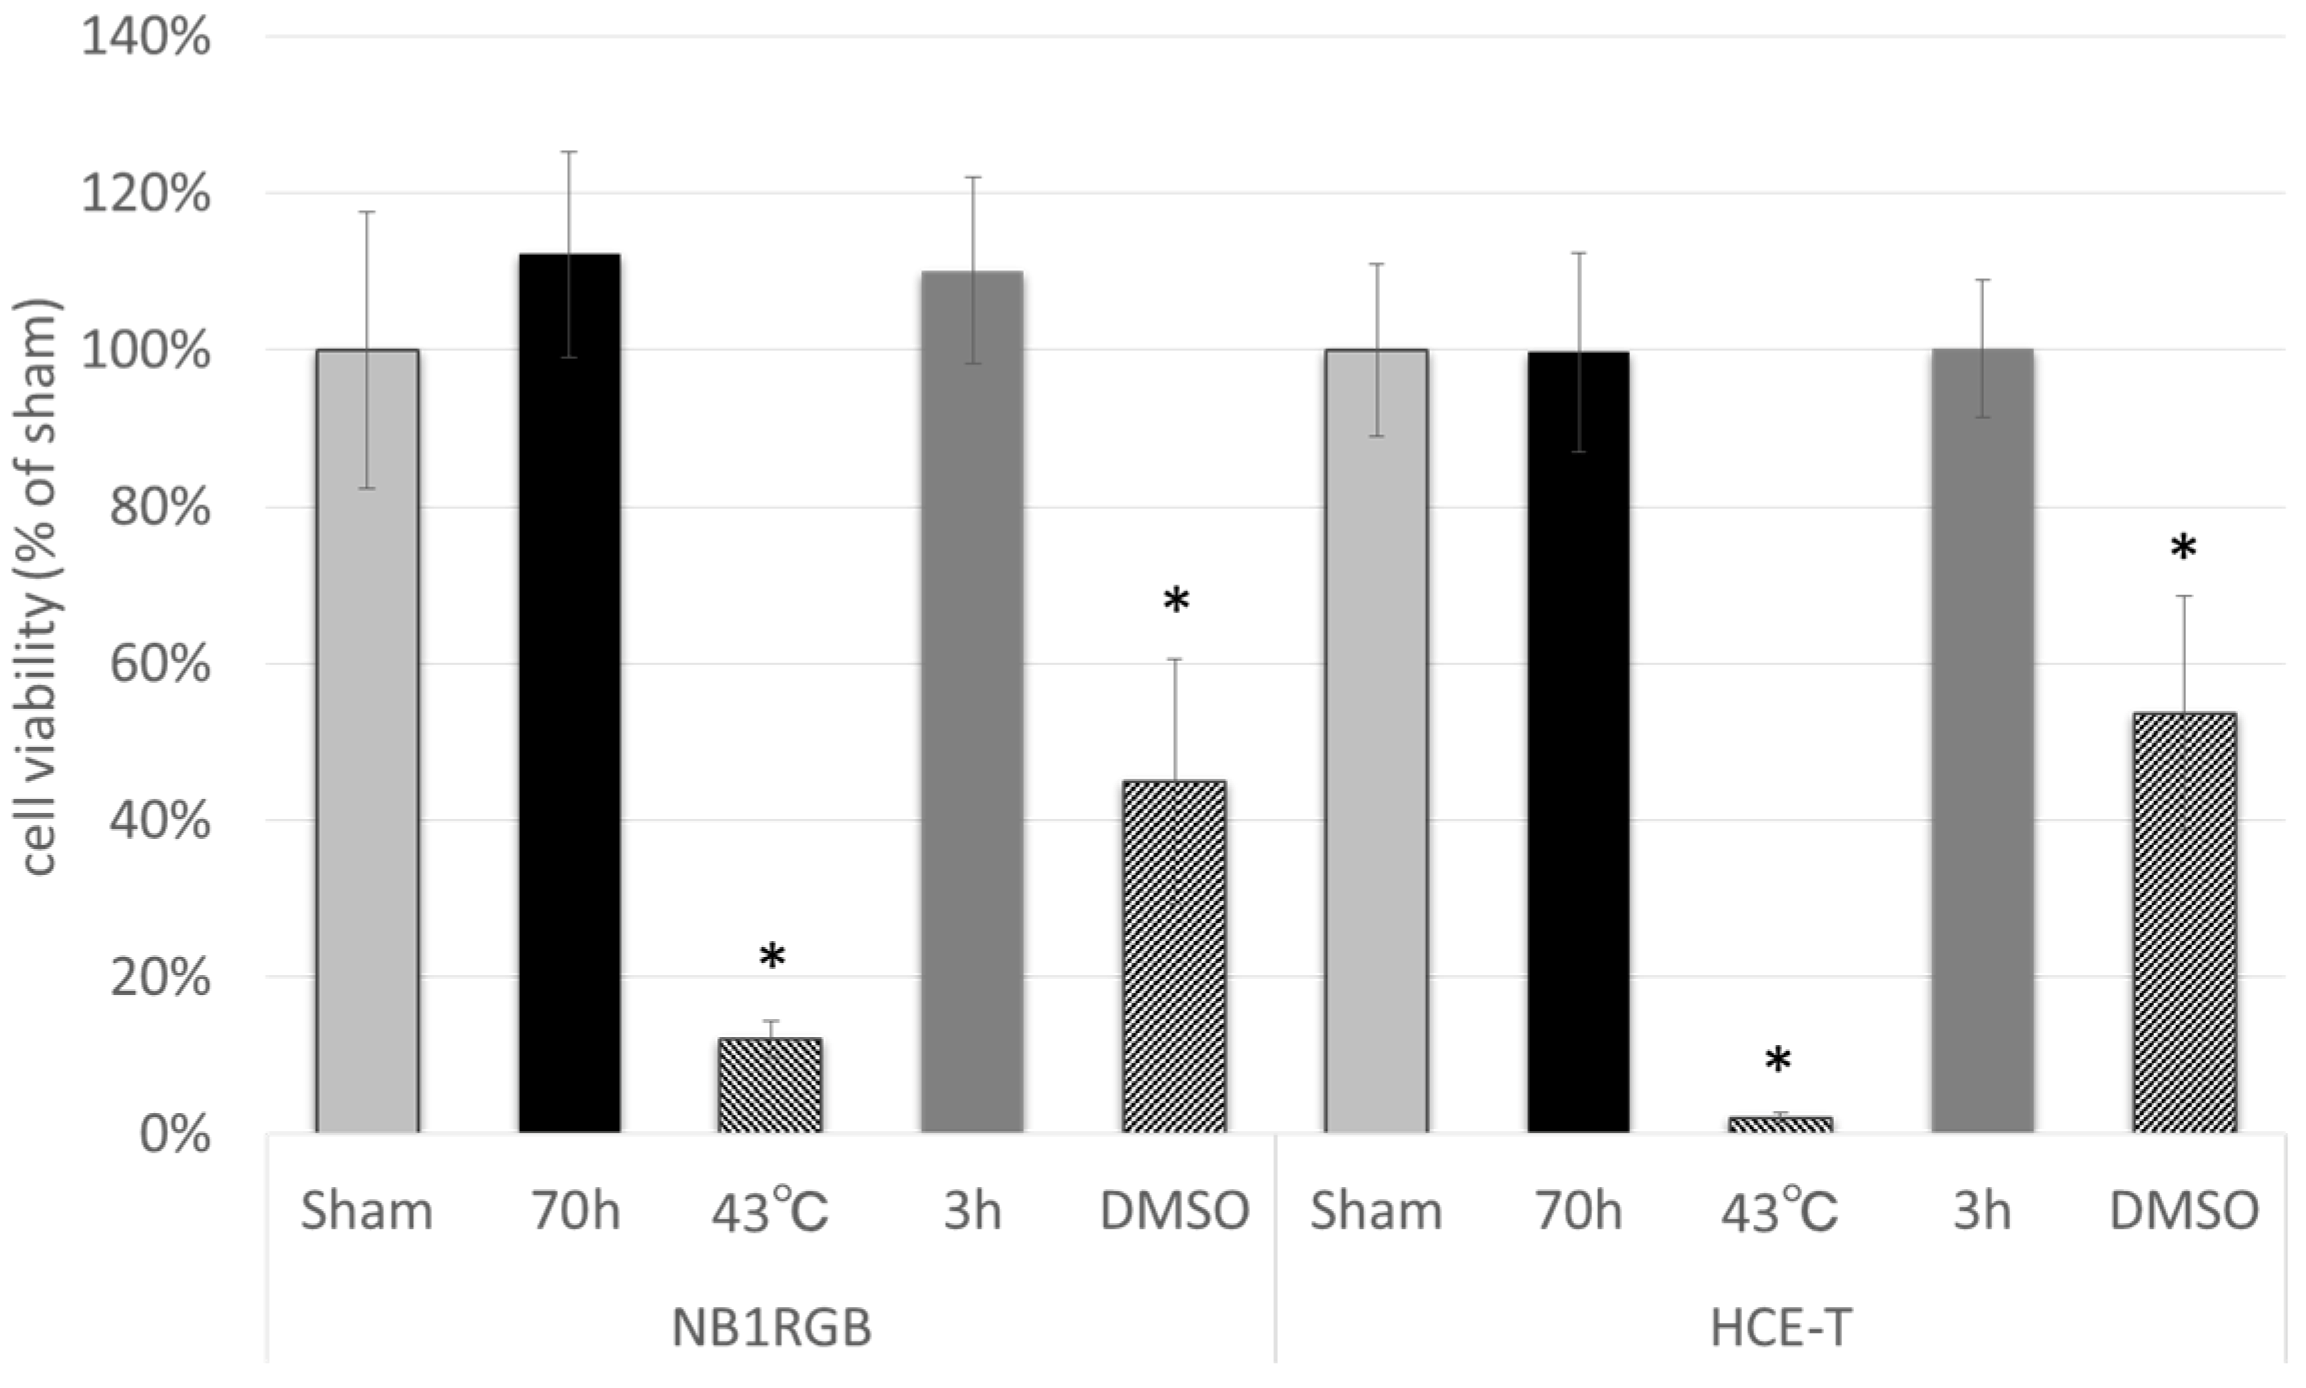
Figure 4 presents the cell growth curve based on the AC impedance measurement method for each cell line. We observed that cells exposed to 0.3–0.6 THz waves for 94 h exhibited no difference in terms of proliferation compared to cells not exposed to these THz frequencies (average of three independent experiments [SD: 0.00–0.16]). The reactance ratios did not show a significant difference between the exposed and unexposed cells; p = 0.51 (NB1RGB) and 0.48 (HCE-T), respectively. Comparing the reactance ratios at each irradiation frequency, no effect on cell proliferation attributable to a specific frequency could be identified. Cell growth was observed for both exposed and unexposed cells, however, those treated with DMSO did not grow. No differences between exposed and unexposed cells were identified (Figure 5).

3.2. Cell Viability

Figure 6 shows cell viability following exposure to 0.3–0.6 THz waves during cell proliferation and sham cells. In addition, cells cultured for 70 h at 43 °C (positive control) exhibited a significant decrease in viability (NB1RGB: 88 % decrease; HCE-T: 98% decrease) compared with sham cells (p < 0.01). By contrast, the cells exposed to THz and the sham cells demonstrated no observable difference in cell viability.
The viability of cells exposed to 0.3–0.6 THz waves for 3 h after proliferation did not differ from that of the sham cells of both cell types. DMSO, which is cytotoxic at high concentrations, was added to the positive control cells. After 3 h of incubation with DMSO, cell viability significantly decreased: by 55% and 46% in the NB1RGB and HCE-T cell groups, respectively (p < 0.01; Figure 6).

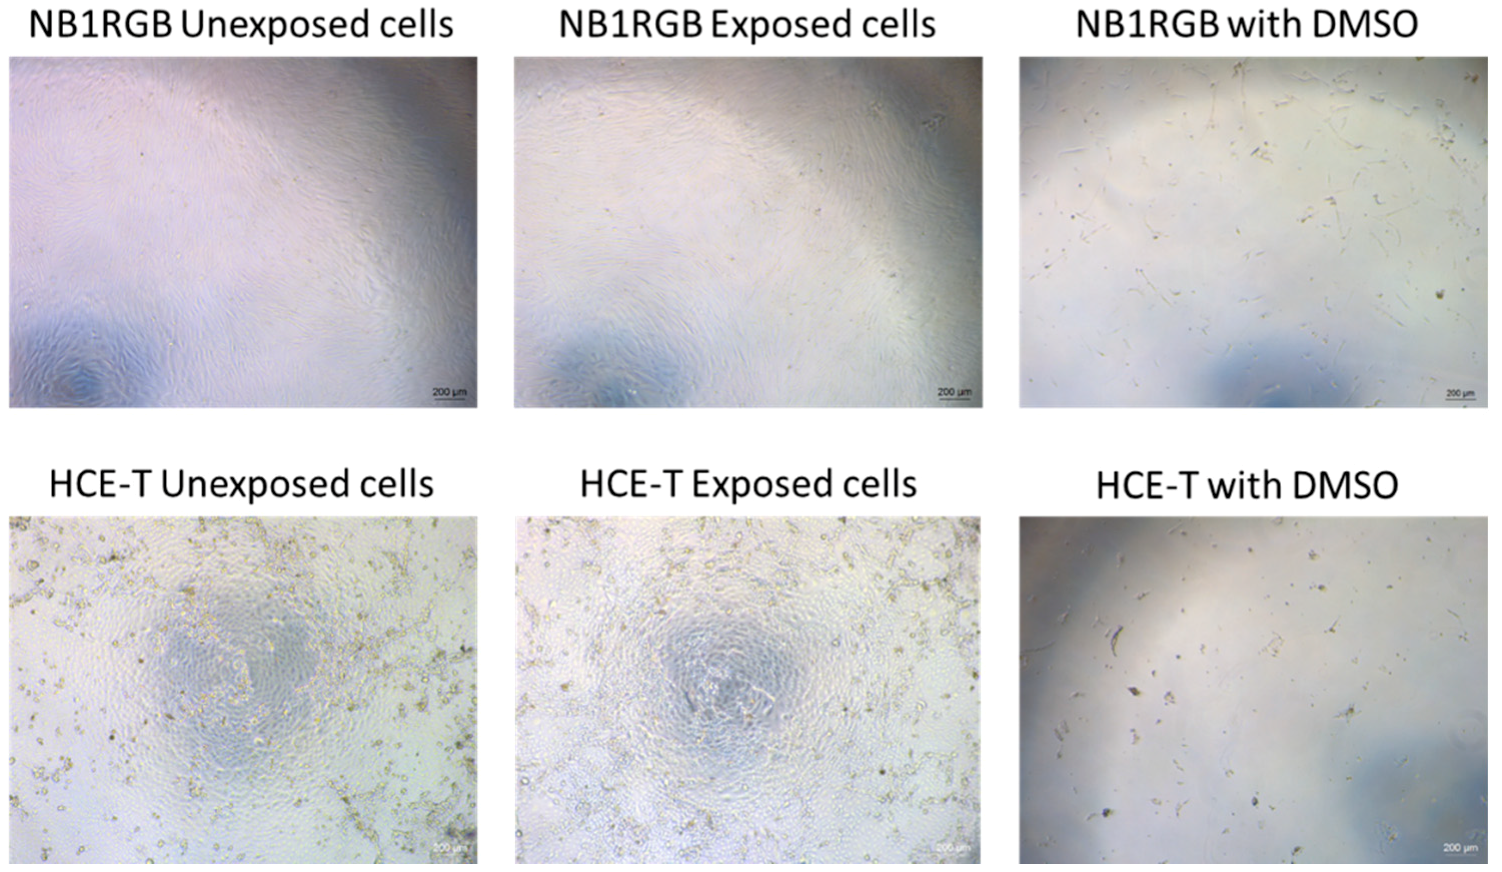
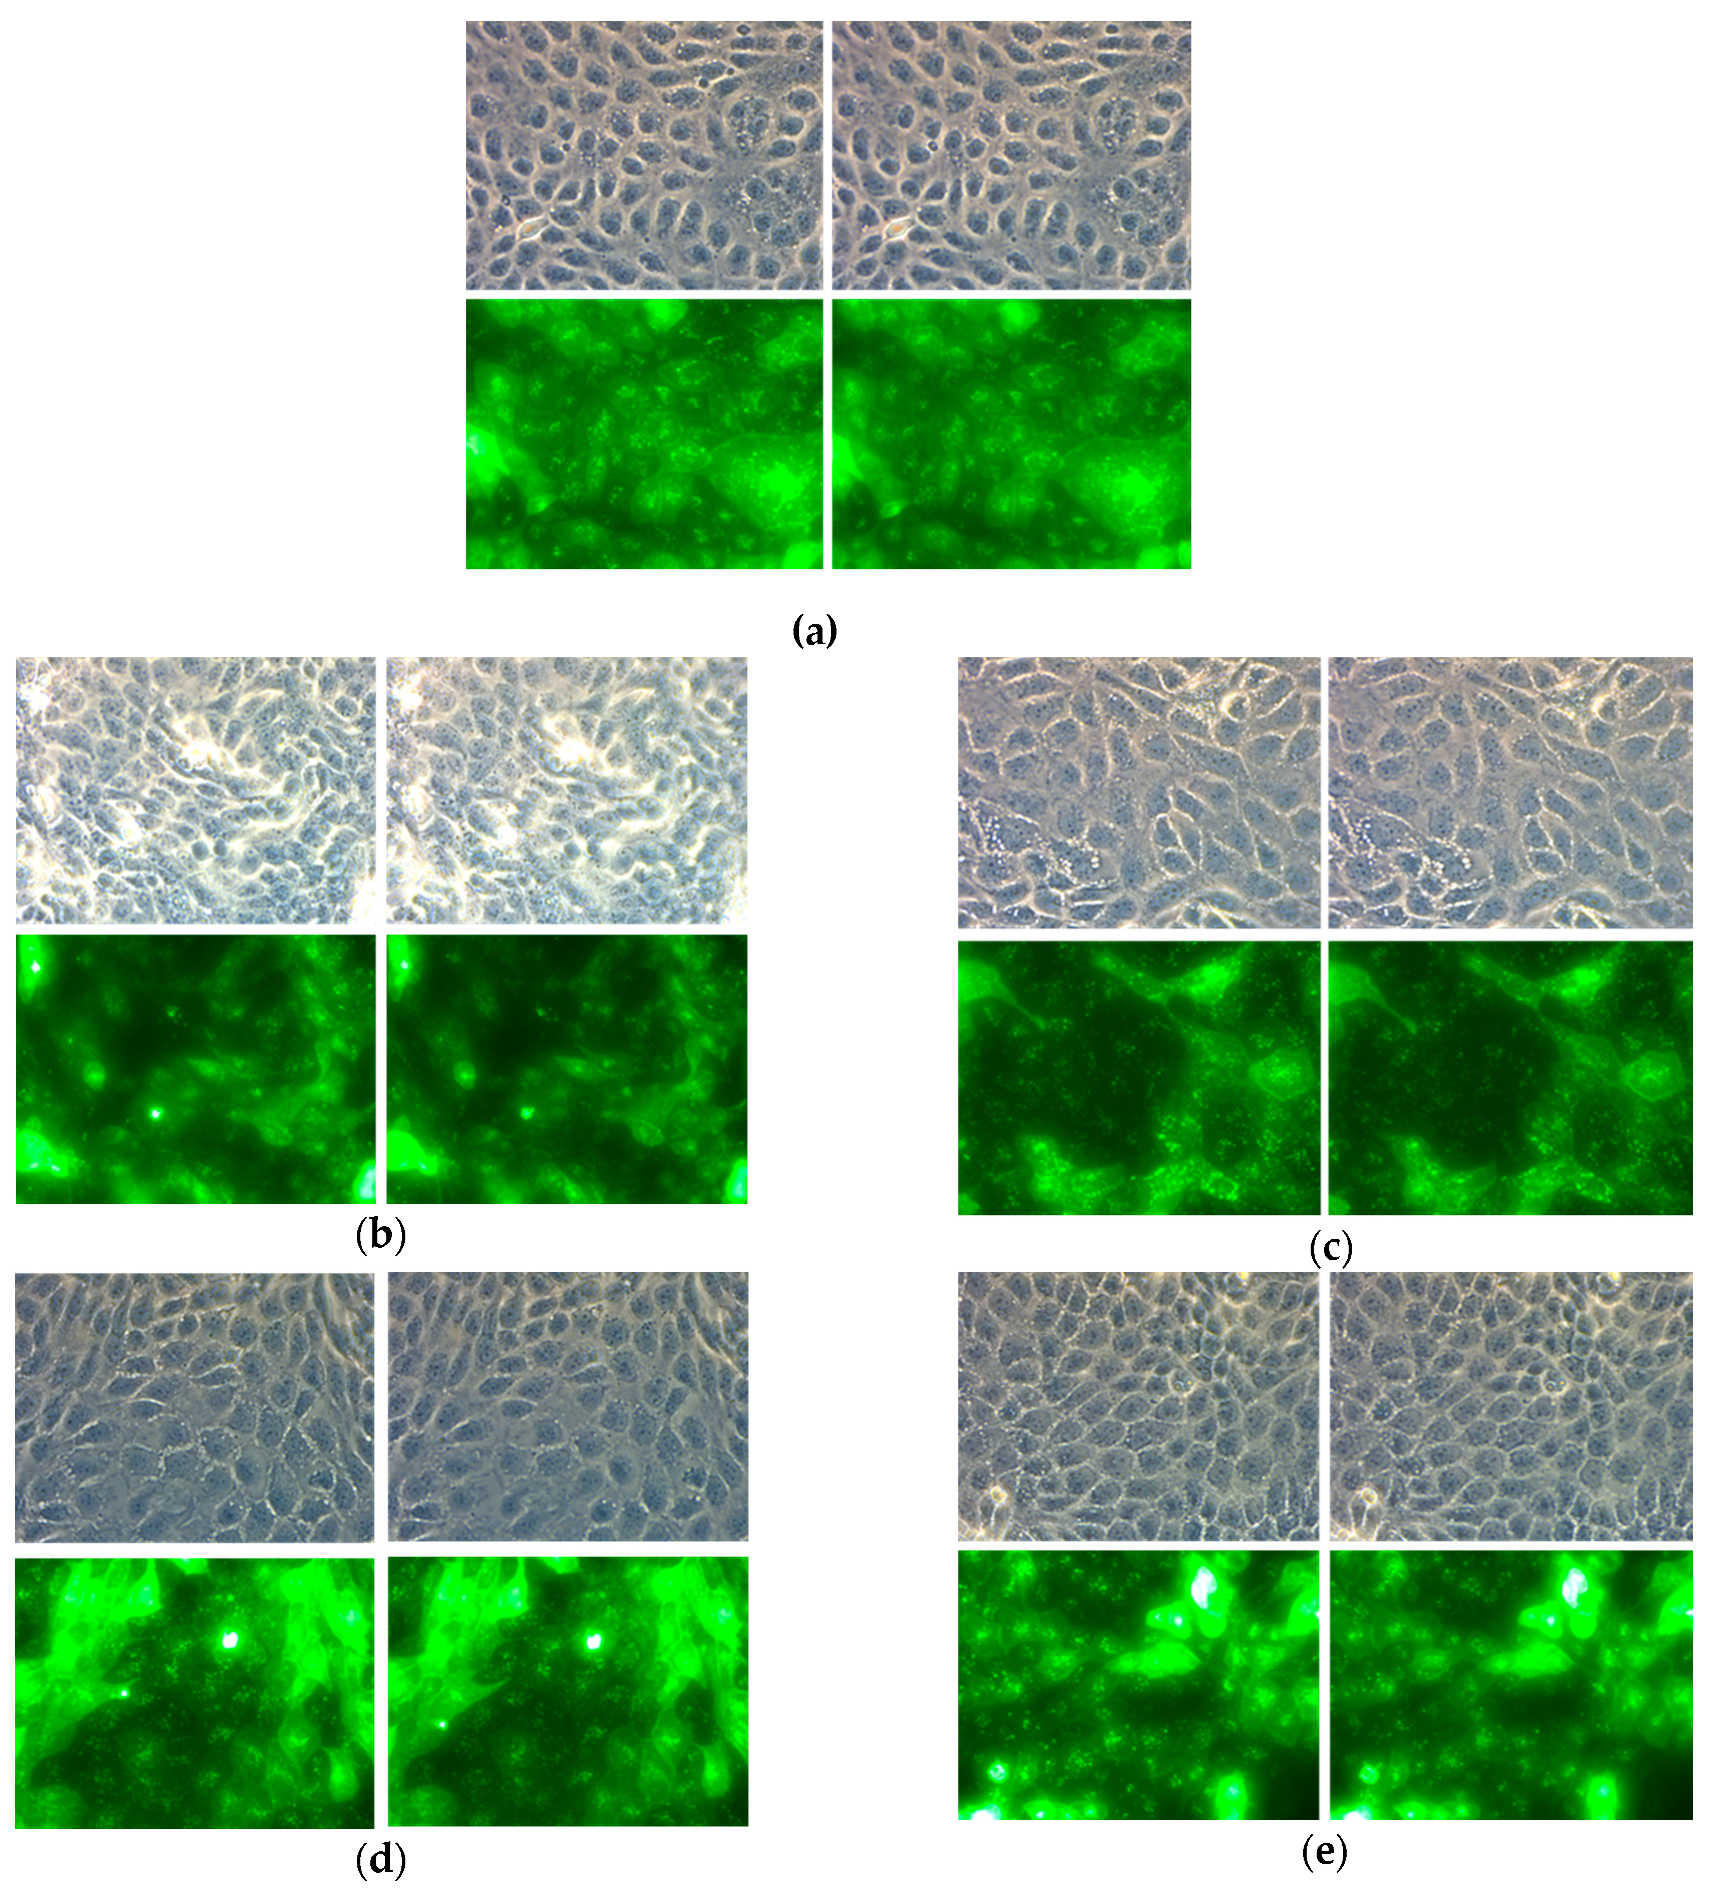
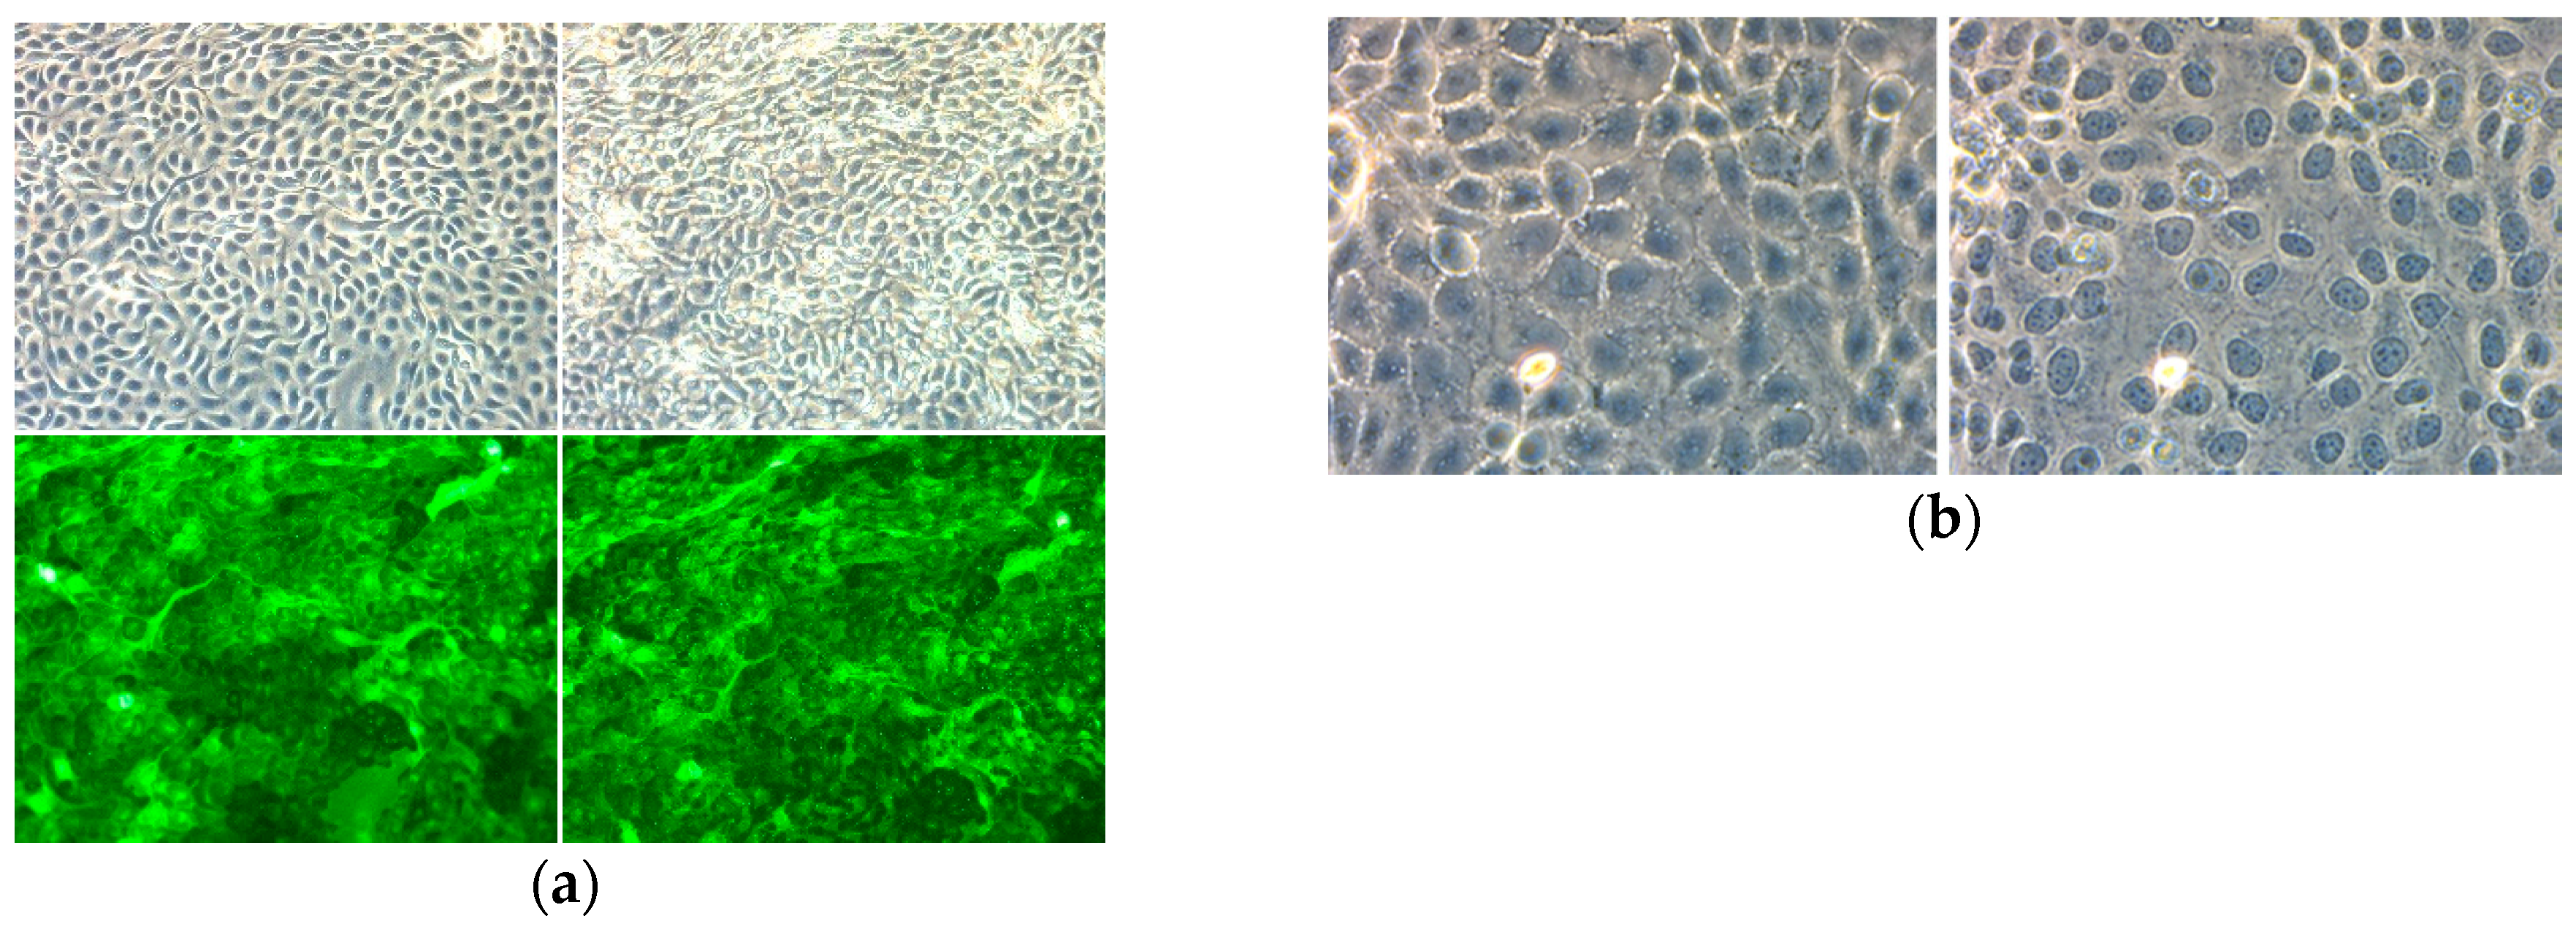
3.3. Morphological Observations of Human Corneal Cells (HCE-T) Exposed

Fluorescence microscope and phase-contrast microscope observations showed that the cell shape and cell membrane did not change on irradiation at 0.3, 0.4, 0.5, and 0.6 THz (Figure 7). No differences due to the THz frequency (0.3–0.6 THz) were seen. Cells were obviously damaged by heating. The cell shapes changed, and the cells peeled off the dish bottoms (Figure 8a). With the addition of 30% DMSO, cells were damaged, and their nuclei were contracted (Figure 8b).

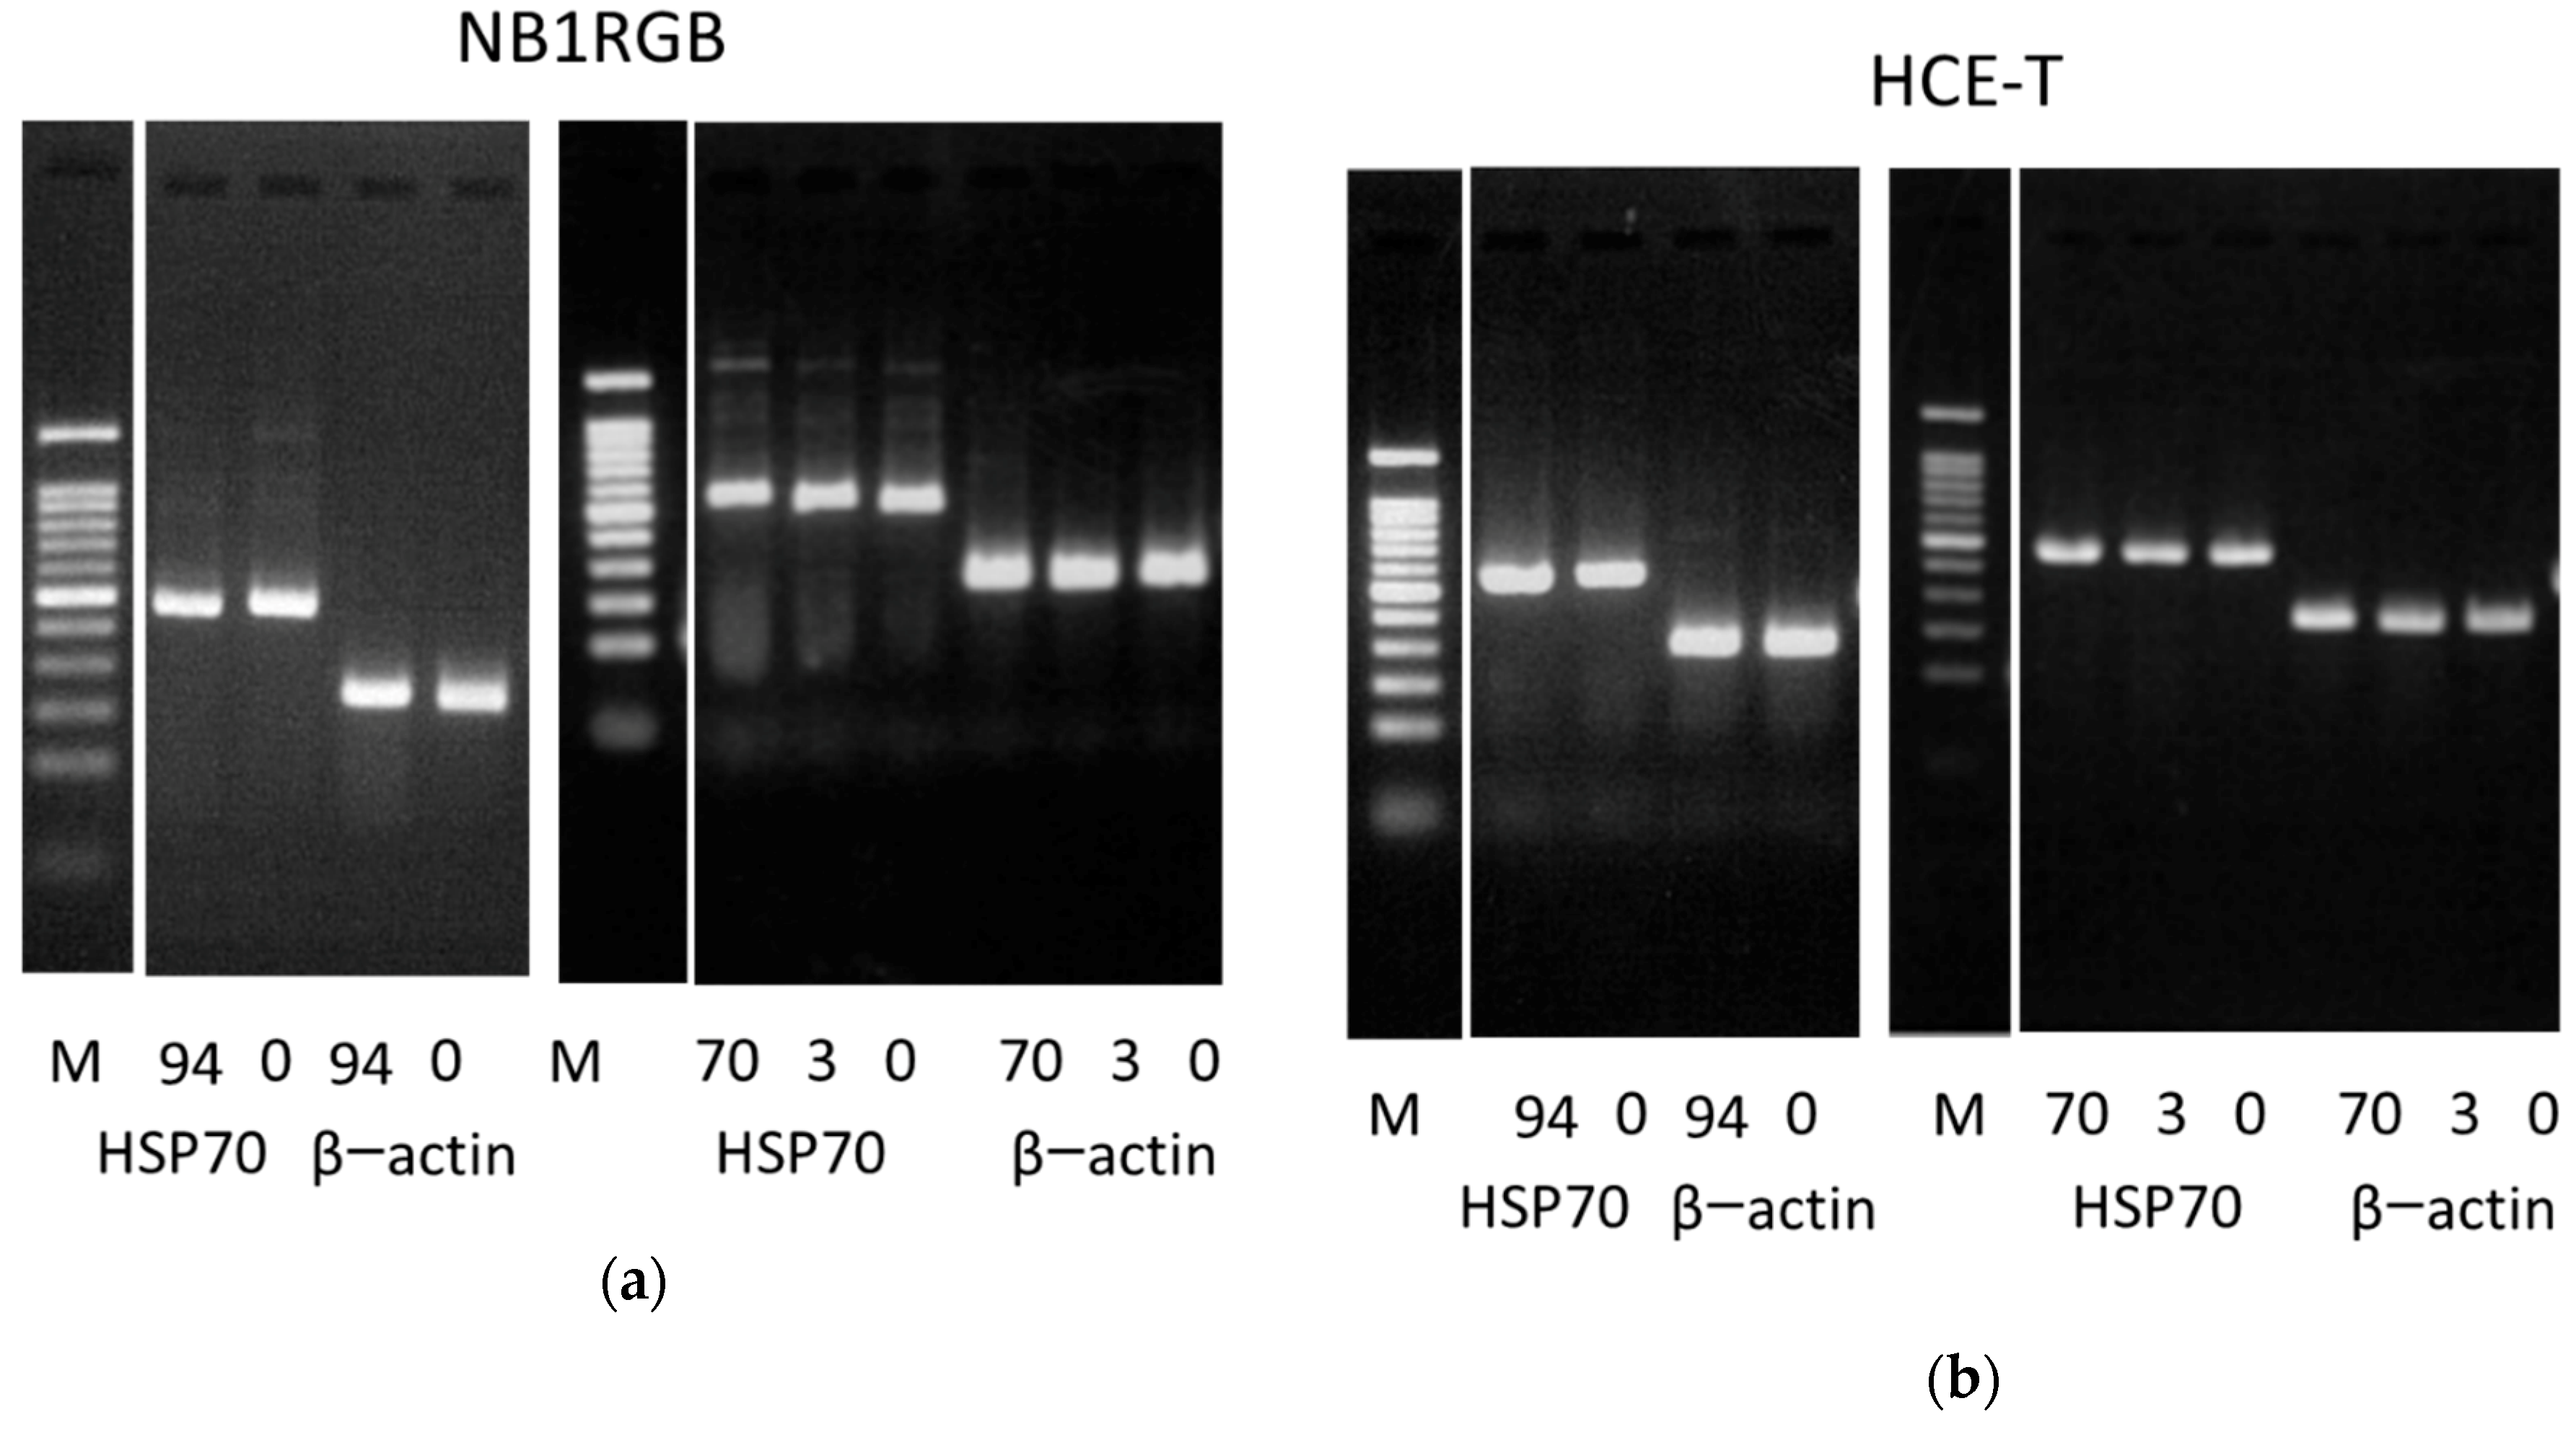
3.4. Detection of HSP70 mRNA Expression

We assessed the level of HSP70 mRNA expression as a result of exposure to 0.3–0.6 THz waves using RT-PCR. No differences in the level of HSP70 mRNA expression between the exposed and sham cells were observed (Figure 9). Similarly, no differences were observed with respect to β-actin expression levels as a result of exposure.

4. Discussion

Although the number of studies concerning the biological effect of THz wave exposure has risen in recent years, the number of completed studies remains small. In particular, there have been few studies conducted to date that have focused on the 0.2–1.0 THz frequency range. The present study was the first to investigate the effect of the exposure to THz waves at 1-GHz frequency steps within a 0.3–0.6 THz range using a widely tunable source. Frohlich’s hypothesis predicts that a possible resonance vibration in the cell membrane will be a non-thermal effect in the THz frequency region [20]. Hadjiloucas et al. previously reported that low power density 200–350 GHz exposure enhanced yeast cell growth due to non-thermal effects [34]. In this study, UTC-PD developed by NTT Corp. for THz light communication, was used as a THz wave source. The non-thermal effects of THz waves and/or Frohlich’s hypothesis have not yet been proven, and new THz technology may promote concern in the general public as a result. To address this issue, we have undertaken a study of the effect of widely tunable and low power THz waves on human cells, using cultured human skin and corneal cells as recommended in the SCENIHR 2015 report. Cells were subjected to long-term exposure of THz radiation at an intensity sufficiently low to allow assessment of non-thermal effects while disregarding thermal effects.
One prior study that investigated exposure to waves in the 0.3–0.6 THz range involved exposing human skin cells to 0.38 THz waves, with intensities between 0.03–0.9 mW/cm2, to assess DNA damage. In this study, no measurable effects from exposure to 0.38 THz waves were reported [15].
The occurrence of DNA damage following exposure to 0.1–0.15 THz waves (output power; about 1.5 kW in 4 µs) has been reported [11]. Titova et al. reported that exposure to THz pulse at energy of 1.0 and 0.1 μJ for 10 min lead to a DNA damage response in human skin tissue model [35]. If DNA had been damaged, subsequent cell growth would also be affected. Although the human skin and corneal cells used in the present study were continuously exposed to THz waves for 94 h, no change in cell growth as a result of exposure to any frequency between 0.3 and 0.6 THz (<1 μW/cm2) was observed, and no change in the reactance ratio of unexposed cells was identified (Figure 4). Based on these findings, we report that THz wave exposure has no effect on cell proliferation. In addition, no changes in cell growth rates were observed under the microscope (Figure 5). No cellular damage or changes to cell proliferation were observed as a result of exposure to 0.3–0.6 THz waves. The exposure power used in these experiments was of very low intensity. Irradiation with high-frequency millimeter or THz waves can generate heat and damage cells [5]. In this study, as increases in temperature were constrained to under 0.3 °C, thermal effects can be considered to be negligible.
We devised a simple method for irradiating the dishes with THz waves from above. This allowed us to observe the effects of THz irradiation using an inverted microscope. This method can be applied to various cells and microbes cultured in dishes. Fluorescence and phase-contrast microscopy showed that neither the cell shape nor the cell membrane changed with irradiation at 0.3, 0.4, 0.5, and 0.6 THz waves (Figure 7), whereas they were altered by heating at 43 °C for 10 min or the addition of 30% DMSO (Figure 8). DMSO is generally used as a cryoprotective agent [36], but high concentrations are cytotoxic [37]. The resistance to DMSO differs with cell type and growth stage [38]. The human corneal cells were damaged by heating at 43 °C for 10 min or exposure to 30% DMSO. Therefore, low-intensity, short-duration irradiation did not affect the human corneal cells. There was thought to be no thermal effect, as no morphological changes to the cells were seen.
No effect on the levels of HSP70 mRNA expression following THz wave exposure (Figure 9) was detected. In addition, cell viability of both NB1RGB and HCE-T cells exposed to THz waves for 70 h during proliferation did not significantly differ compared with the viability of sham cells (Figure 6). No measurable effect on cell viability following THz exposure was observed, while positive controls exhibited diminished cell proliferation and decreased viability due to changes in temperature (p < 0.01). Exposure for 3 h after cell proliferation is used to test for the cytotoxicity of chemicals and other products: cytotoxicity reduces cell viability (p < 0.01). The results of the present study demonstrated that THz wave exposure did not induce cytotoxic effects and cell viabilities did not change.
Williams et al. [39] reported that the effects of exposure to broadband radiation of up to ~0.5 THz with high peak pulse powers was no difference on cell morphology, adhesion, proliferation, and differentiation between exposure group and control group in HCE-T cells. Although in our study the same cell lines were used, we investigated the non-thermal effects of 0.3–0.6 THz weak continuous wave (CW). And there were no significant changes in the proliferation and metabolic activity of cells exposed to 0.3–0.6 THz CW radiation compared with unexposed or sham cells, and no morphological changes were observed.

5. Conclusions

Novel THz devices are expected to be developed in near future, but few studies have assessed the biological effects of 0.2–2.0 THz radiation. In this report, the exposure to 0.3–0.6 THz waves had no measurable effects on the proliferative or metabolic activities of human skin fibroblasts and corneal epithelial cell lines. No differences in the quantities of cDNA detected were observed between the sham and the exposure group with respect to heat shock protein 70, whose mRNA levels increase in response to heat stress. There were no morphological changes between before and after exposed cells.

Author Contributions

N.Y., H.Y. and S.O. conducted the experiments of cells; S.H. evaluated the exposure conditions; K.K. provided advice regarding the experiments and the paper; and N.Y. wrote the paper.

Funding

This research received no external funding.

Acknowledgments

The authors would like to extend their gratitude to K. Mori, Nagoya University, who assisted with the measurements, and to S. Kato, RIKEN, who assisted with data analysis. This study work was supported by the Ministry of Internal Affairs and Communications (MIC), Japan.

Conflicts of Interest

The authors declare no conflict of interest.

References

  1. Tonouchi, M. Cutting edge terahertz technology. Nat. Photonics 2007, 1, 97–105. [Google Scholar] [CrossRef]
  2. Song, H.-J.; Ajito, K.; Muramoto, Y.; Wakatsuki, A.; Nagatsuma, T.; Kukutsu, N. 24 Gbit/s data transmission in 300 GHz band for future terahertz communications. Electron. Lett. 2012, 48, 953–954. [Google Scholar] [CrossRef]
  3. Nagatsuma, T. Breakthroughs in photonics 2013; THz communications based on photonics. IEEE Photonics J. 2014, 6, 0701505. [Google Scholar] [CrossRef]
  4. Mattsson, M.-O.; Zeni, O.; Simko, M. Is there a biological basis for therapeutic applications of millimeter waves and THz waves? J. Infrared Millim. Terahertz Waves 2018, 39, 863–878. [Google Scholar] [CrossRef]
  5. Wilmink, G.J.; Grundt, J.E. Invited Review Article: Current state of research on biological effects of terahertz radiation. J. Infrared Millim. Terahertz Waves 2011, 32, 1074–1122. [Google Scholar] [CrossRef]
  6. Scientific Committee on Emerging and Newly Identified Health Risks (SCENIHR). Final Opinion on Potential Health Effects of Exposure to Electromagnetic Fields (EMF) 2015. Available online: https://ec.europa.eu/health/scientific_committees/emerging/docs/scenihr_o_041.pdf (accessed on 22 March 2019).
  7. Korenstein-Ilan, A.; Barbul, A.; Hasin, P.; Eliran, A.; Gover, A.; Korenstein, R. Terahertz radiation increases genomic instability in human lymphocytes. Radiat. Res. 2008, 170, 224–234. [Google Scholar] [CrossRef]
  8. Homenko, A.; Kapilevich, B.; Kornstein, R.; Firer, M.A. Effects of 100 GHz radiation on alkaline phosphatase activity and antigen-antibody interaction. Bioelectromagnetics 2009, 30, 167–175. [Google Scholar] [CrossRef] [PubMed]
  9. Hintzsche, H.; Jastrow, C.; Kleine-Ostmann, T.; Stopper, H.; Schmid, E.; Schrader, T. Terahertz radiation induces spindle disturbances in human-hamster hybrid cells. Radiat. Res. 2011, 175, 569–574. [Google Scholar] [CrossRef] [PubMed]
  10. Hintzsche, H.; Jastrow, C.; Kleine-Ostmann, T.; Kärst, U.; Schrader, T.; Stopper, H. Terahertz electromagnetic fields (0.106 THz) do not induce manifest genomic damage in vitro. PLoS ONE 2012, 7, e46397. [Google Scholar] [CrossRef]
  11. De Amicis, A.; Sanctis, S.D.; Cristofaro, S.D.; Franchini, V.; Lista, F.; Regalbuto, E.; Giovenale, E.; Gallerano, G.P.; Nenzi, P.; Bei, R.; et al. Biological effects of in vitro THz radiation exposure in human foetal fibroblasts. Mutat. Res. Genet. Toxicol. Environ. Mutagen. 2015, 793, 150–160. [Google Scholar] [CrossRef]
  12. Koyama, S.; Narita, E.; Shimizu, Y.; Shiina, T.; Taki, M.; Shinohara, N.; Miyakoshi, J. Twenty Four-Hour Exposure to a 0.12 THz Electromagnetic Field Does Not Affect the Genotoxicity, Morphological Changes, or Expression of Heat Shock Protein in HCE-T Cells. Int. J. Environ. Res. Public Health 2016, 13, 793. [Google Scholar] [CrossRef]
  13. Yaekashiwa, N.; Otsuki, S.; Hayashi, S.; Kawase, K. Investigation on the non-thermal effects of exposing cells to 70–300 GHz using a widely tunable source. J. Radiat. Res. 2018, 59, 116–121. [Google Scholar] [CrossRef]
  14. Alexandrov, B.S.; Rasmussen, K.Ø.; Bishop, A.R.; Usheva, A.; Alexandrov, L.B.; Chong, S.; Dagon, Y.; Booshehri, L.G.; Mielke, C.H.; Phipps, M.L.; et al. Non-thermal effects of terahertz radiation on gene expression in mouse stem cells. Biomed. Opt. Express 2011, 2, 2679–2689. [Google Scholar] [CrossRef] [PubMed] [Green Version]
  15. Hintzsche, H.; Jastrow, C.; Heinen, B.; Baaske, K.; Kleine-Ostmann, T.; Schwerdtfeger, M.; Shakfa, M.K.; Kärst, U.; Koch, M.; Schrader, T.; et al. Terahertz radiation at 0.380 THz and 2.520 THz does not lead to DNA damage in skin cells in vitro. Radiat. Res. 2013, 179, 38–45. [Google Scholar] [CrossRef]
  16. Hwang, Y.; Ahn, J.; Mun, J.; Bae, S.; Jeong, Y.U.; Vinokurov, N.A.; Kim, P. In vivo analysis of THz wave irradiation induced acute inflammatory response in skin by laser-scanning confocal microscopy. Opt. Express 2014, 22, 11465–11475. [Google Scholar] [CrossRef]
  17. Bogomazova, A.N.; Vassina, E.M.; Goryachkovskaya, T.N.; Popik, V.M.; Sokolov, A.S.; Kolchanov, N.A.; Lagarkova, M.A.; Kiselev, S.L.; Peltek, S.E. No DNA damage response and negligible genome-wide transcriptional changes in human embryonic stem cells exposed to terahertz radiation. Sci. Rep. 2015, 5, 7749. [Google Scholar] [CrossRef] [Green Version]
  18. Sergeeva, S.; Demidova, E.; Sinitsyna, O.; Goryachkovskaya, T.; Bryanskaya, A.; Semenov, A.; Meshcheryakova, I.; Dianov, G.; Popik, V.; Peltek, S. 2.3THz radiation: Absence of genotoxicity/mutagenicity in Escherichia coli and Salmonella typhimurium. Mutat. Res. Genet. Toxicol. Environ. Mutagen. 2016, 803–804, 34–38. [Google Scholar] [CrossRef] [PubMed]
  19. Demidova, E.V.; Goryachkovskaya, T.N.; Mescheryakova, I.A.; Malup, T.K.; Semenov, A.I.; Vinokurov, N.A.; Kolchanov, N.A.; Popik, V.M.; Peltek, S.E. Impact of terahertz radiation on stress-sensitive genes of E. coli cell. IEEE Trans. Terahertz Sci. Technol. 2016, 6, 435–441. [Google Scholar] [CrossRef]
  20. Fröhlich, H. Long-range coherence and energy storage in biological systems. Int. J. Quant. Chem. 1968, 2, 641–649. [Google Scholar] [CrossRef]
  21. Grundler, W.; Keilmann, F.; Fröhlich, H. Resonant growth rate response of yeast cells irradiated by weak microwaves. Phys. Lett. A 1977, 62, 463–466. [Google Scholar] [CrossRef]
  22. Grundler, W.; Keilmann, F. Sharp resonances in yeast growth prove nonthermal sensitivity to microwaves. Phys. Rev. Lett. 1983, 51, 1214–1216. [Google Scholar] [CrossRef]
  23. Jelinek, F.; Saroch, J.; Kucera, O.; Hasek, J.; Pokorny, J.; Jaffrezic-Renault, N.; Ponsonnet, L. Measurement of electromagnetic activity of yeast cells at 42 GHz. Radioengineering 2007, 16, 36–39. Available online: http://hdl.handle.net/11012/57274 (accessed on 22 March 2019).
  24. Clothier, R.H.; Bourne, N. Effects of THz exposure on human primary kerationocyte differentiation and viability. J. Biol. Phys. 2003, 29, 179–185. [Google Scholar] [CrossRef] [PubMed]
  25. Wilmink, G.J.; Rivest, B.D.; Lbey, B.L.; Roth, C.L.; Bernhard, J.; Roach, W.P. Quantitative investigation of the bioeffects associated with terahertz radiation. Proc. SPIE 2010, 7562, 75620L. [Google Scholar]
  26. Demidova, E.V.; Goryachkovskaya, T.N.; Malup, T.K.; Bannikova, S.V.; Semenov, A.I.; Vinokurov, N.A.; Kolchanov, N.A.; Popik, V.M.; Peltek, S.E. Studying the non-thermal effects of terahertz radiation on E. coli/pKatG-gfp biosensor cells. Bioelectromagnetics 2013, 34, 15–21. [Google Scholar] [CrossRef] [PubMed]
  27. Ito, H.; Nagatsuma, T.; Ishibashi, T. Uni-traveling-carrier photodiodes for high-speed detection and broadband sensing. Proc. SPIE 2007, 6479, 64790X. [Google Scholar] [CrossRef]
  28. Ishibashi, T.; Muramoto, Y.; Yoshimatsu, T.; Ito, H. Continuous THz wave generation by photodiodes up to 2.5 THz. In Proceedings of the 38th International Conference Mainz (IRMMW-THz), Mainz, Germany, 1–6 September 2013; pp. 1–2. [Google Scholar] [CrossRef]
  29. Araki-Sasaki, K.; Ohashi, Y.; Sasabe, T.; Hayashi, K.; Watanabe, H.; Tano, Y.; Handa, H. An SV40-immortalized human corneal epithelial cell line and its characterization. Investig. Ophthalmol. Vis. Sci. 1995, 36, 614–621. [Google Scholar]
  30. Mosmann, T. Rapid colorimetric assay for cellular growth and survival: Application to proliferation and cytotoxicity assays. J. Immunol. Methods 1983, 65, 55–63. [Google Scholar] [CrossRef]
  31. Barltrop, J.A.; Owen, T.C.; Cory, A.H.; Cory, J.G. 5-(3-carboxymethoxyphenyl)-2-(4,5-dimethylthiazolyl)-3-(4-sulfophenyl)tetrazolium, inner salt (MTS) and related analogs of 3-(4,5-dimethylthiazolyl)-2,5-diphenyltetrazolium bromide (MTT) reducing to purple water-soluble formazans as cell-viability indicators. Bioorg. Med. Chem. Lett. 1991, 1, 611–614. [Google Scholar] [CrossRef]
  32. Wang, S.M.; Khandekar, J.D.; Kaul, K.L.; Winchester, D.J.; Morimoto, R.I. A method for the quantitative analysis of human heat shock gene expression using a multiplex RT-PCR assay. Cell Stress Chaperones 1999, 4, 153–161. [Google Scholar] [CrossRef] [PubMed]
  33. Sun, L.; Ke, Y.; Wang, K.; Lu, D.; Hu, H.; Gao, X.; Wang, B.; Zheng, W.; Lou, J.; Wu, W. Effects of 1.8 GHz radiofrequency field on DNA damage and expression of heat shock protein 70 in human lens epithelial cells. Mutat. Res. 2006, 602, 135–142. [Google Scholar] [CrossRef]
  34. Hadjiloucas, S.; Chahal, M.S.; Bowen, J.W. Preliminary results on the non-thermal effects of 200–350 GHz radiation on the growth rate of S. cerevisiae cells in microcolonies. Phys. Med. Biol. 2002, 47, 3831–3839. [Google Scholar] [CrossRef]
  35. Titova, L.V.; Ayesheshim, A.K.; Golubov, A.; Fogen, D.; Rodriguez-Juarez, R.; Hegmann, F.A.; Kovalchuk, O. Intense THz pulses cause H2AX phosphorylation and activate DNA damage response in human skin tissue. Biomed. Opt. Express 2013, 4, 559–568. [Google Scholar] [CrossRef] [PubMed] [Green Version]
  36. Rall, W.F.; Fahy, G.M. Ice-free cryopreservation of mouse embryos at −196 degrees C by vitrification. Nature 1985, 313, 573–575. [Google Scholar] [CrossRef] [PubMed]
  37. Hempling, H.G. Mass transfer of liquids across biological barriers. In NATO ASI Series A: The Biophysics of Organ Cryopreservation; Springer: Berlin/Heidelberg, Germany, 1987; Volume 147, pp. 51–78. [Google Scholar]
  38. Suzuki, T.; Komada, H.; Takai, R.; Arii, K.; Kosima, T.T. Relation between toxicity of cryoprotectant DMSO and its concentration in several fish embryo. Fish. Sci. 1995, 61, 193–197. [Google Scholar] [CrossRef]
  39. Williams, R.; Schofield, A.; Holder, G.; Downes, J.; Edgar, D.; Harrison, P.; Siggel-King, M.; Surman, M.; Dunning, D.; Hill, S.; et al. The influence of high intensity terahertz radiation on mammalian cell adhesion, proliferation and differentiation. Phys. Med. Biol. 2013, 58, 373–391. [Google Scholar] [CrossRef] [PubMed]
Figure 1. Scheme of the exposure set-up showing the terahertz (THz) wave source in the incubator chamber for measuring cell proliferation (a) and cell viability (b).
Photonics 06 00033 g001
Figure 2. The frequency dependence on the irradiation intensity inside the culture well (a) and 96-well plate (b). (a) The irradiated THz wave covered the well through an aluminum waveguide. The intensity was less than 1 μW/cm2 including coupling and propagating loss by the waveguide and an absorption loss by the bottom of the cell. (b) The irradiated THz wave covered all of the 96-well plate through free space with the intensity approximately 0.1 μW/cm2, including an absorption loss by the bottom of the well.
Photonics 06 00033 g002
Figure 3. Uni-Travelling-Carrier Photodiode (UTC-PD) optical system on the inverted microscope.
Photonics 06 00033 g003
Figure 4. Growth curves of cells that have been exposed to 0.3–0.6 THz waves. The solid line represents exposed cells, the broken line represents unexposed cells, the dash line represents adding 20% of DMSO and the gray line represents the culture medium without cells. Cells were exposed to waves from 0.3 THz to 0.6 THz, increasing at a rate of 1.0 GHz every 18 min and 34 s, over a total of 94 h. (a) NB1RGB cell proliferation curve. (b) HCE-T cell proliferation curve. Data were independently collected three times and the data measured at each frequency was averaged.
Photonics 06 00033 g004
Figure 5. Cells following exposure to 0.3–0.6 THz waves for 94 h (x5).
Photonics 06 00033 g005
Figure 6. Viability of cells exposed to frequencies between 0.3 and 0.6 THz. Viability of NB1RGB and HCE-T cells after 70 h or 3 h of exposure following the MTT assay. Viability of NB1RGB and HCE-T cells subjected to different exposure conditions sham cells incubated at 43 °C for 70 h and cells cultured with 0.7 M DMSO for 3 h as a positive control. The data display the mean of three independent experiments ± standard deviation. * p < 0.01 for t-test comparing the control and heating effects or with DMSO.
Photonics 06 00033 g006
Figure 7. Change in cell shape the before (left) and after (right) (×63), phase contrast (top) and fluorescence (bottom) micrographs. (a) control treatment. (be) 0.3, 0.4, 0.5, 0.6 THz irradiation respectively.
Photonics 06 00033 g007
Figure 8. Change in cell shape (a) with heat treatment (×20) and (b) with dimethylsulfoxide (DMSO) treatment (×63) before (left) and after (right), phase contrast (top) and fluorescence (bottom) micrographs.
Photonics 06 00033 g008
Figure 9. Level of HSP70 mRNA expression observed by RT-PCR for NB1RGB cell (a) and HCE-T cell (b). Lane M is a DNA molecule size marker. Lane 70 shows cells exposed for 70 h during cell proliferation, lane 3 shows cells exposed for 3 h following cell proliferation, and lane 0 shows sham cells. β-actin was used as an internal standard.
Photonics 06 00033 g009
Table 1. List of primers used for RT-PCR.
Gene SequenceAmplified Length (bps)Sequence Reference
HSP70sense:
antisense:
5′- TTCCGTTTCCAGCCCCCAATC -3′
5′- CGTTGAGCCCCGCGATGACA -3′
558Wang. 1999
β-actinsense:
antisense:
5′- CCGCGAGAAGATGACCCAGAT -3′
5′- TTCTCCTTAATGTCACGCACGAT -3′
299Lixia. 2006

