Article

A Rapid Eyebox Characterization Method for Near-Eye Display Systems Based on Sampling Efficiency Optimization and Error Modeling


1
National Research Center for High-Efficiency Grinding, College of Mechanicaland Vehicle Engineering, Hunan University, Changsha 410082, China
2
Shenzhen Yitoa Aurora Micro Technology Co., Ltd., Shenzhen 518000, China
*
Author to whom correspondence should be addressed.
Photonics 2026, 13(9), 883; https://doi.org/10.3390/photonics13090883 (registering DOI)
Submission received: 23 June 2026 / Revised: 15 August 2026 / Accepted: 28 August 2026 / Published: 18 September 2026
(This article belongs to the Special Issue Recent Research on Optical Sensing and Precision Measurement)

Abstract

The standardized eyebox measurement method for AR devices specified in IEC 63145-20-10:2019 is associated with a large traversal range, lengthy measurement time, high operational complexity, and limited accuracy in exit pupil distance positioning. To address these limitations, a predictive framework for eyebox sampling optimization and error estimation based on exit pupil distance is proposed. A geometric optics model describing the relationship between exit pupil distance and eyebox search range is established, and conversion equations for eyebox dimensions at different exit pupil distances are derived. Furthermore, quantitative models for sampling efficiency and measurement error are developed, revealing the relationships among exit pupil distance, sampling interval, measurement efficiency, and characterization accuracy. Based on these models, the trade-off between measurement efficiency and accuracy can be quantitatively predicted and optimized prior to measurement. Experimental validation was conducted on a commercial AR headset using a Riedel I29 optical measurement system, including optical axis alignment, eyebox center localization, exit pupil distance configuration, search range determination, and luminance-ratio-based sampling. The results demonstrate that increasing the exit pupil distance from the standard 16 mm to 38 mm reduces the number of sampling points by 77.99%. Through joint optimization of exit pupil distance and sampling interval, the sampling quantity can be further reduced by up to 94.07% while maintaining a measurement error below 5.1%. The predicted eyebox dimensions and measurement errors show good agreement with both experimental measurements and results obtained using the standard procedure. Without requiring additional hardware, the proposed framework simplifies measurement operations and provides a quantitative basis for balancing efficiency and accuracy. The framework is applicable to both manual and automated measurement scenarios and offers a practical and theoretically grounded solution for eyebox characterization and optical performance evaluation in AR near-eye display systems.

1. Introduction

Augmented reality (AR) technology enables virtual information to be superimposed on the real-world environment and has been increasingly applied in consumer electronics, industrial inspection, healthcare, and other fields [1,2]. To simultaneously achieve a large field of view (FOV), compact form factor, low weight, and sufficient tolerance to eye-position variations, waveguide-based optical combiners have become an important architecture for AR near-eye displays [1,2]. In particular, waveguide architectures enable efficient optical coupling and exit-pupil expansion while maintaining a compact optical form factor, making the eyebox an important parameter in the design and evaluation of AR displays [1,2,3,4].
As a key optical performance metric of AR glasses, the eyebox represents the three-dimensional spatial region within which users can clearly perceive the virtual image under a specified optical performance criterion. Its size and location directly affect the robustness of the viewing experience to variations in eye position. An insufficient eyebox restricts the allowable eye movement and may result in image clipping or partial loss of the virtual image, whereas an excessively large eyebox may increase the complexity and size of the optical system. Therefore, eyebox optimization has remained an important consideration in the development of AR optical systems [3,4,5,6].
Accurate and efficient eyebox characterization is consequently important for both optical-system development and production testing. The International Electrotechnical Commission (IEC) has established IEC 63145-20-10:2019 as a standard for measuring the optical properties of eyewear displays, including see-through AR displays [7]. ISO 9241-305:2008 also provides optical laboratory test methods for electronic visual displays [8]. Conventional eyebox characterization generally involves measuring the optical response at multiple eye positions and determining the spatial region that satisfies a prescribed luminance or image-quality criterion. Although spatial scanning provides direct information about the eyebox, the measurement burden increases with the sampling density and spatial search range.
Several studies have therefore investigated more efficient approaches to eyebox characterization. Hong proposed a rapid measurement method based on ray trajectories extending from positions on the virtual image and subsequently reported a method for rapidly determining the three-dimensional eyebox range of a VR device [9,10]. Yeom et al. developed a light-field-based approach for evaluating the three-dimensional eyebox from luminance distributions acquired at a single measurement distance [11]. More recently, Kerst et al. proposed a rapid eyebox measurement method for AR waveguides and demonstrated that conventional three-dimensional eyebox mapping can be time-consuming and data-intensive [12]. Penczek et al. further investigated rapid eyebox measurements for wide-FOV near-eye displays [13], while Li et al. recently investigated eyebox measurement for AR waveguides with pupil expansion [14]. These studies have demonstrated significant progress in reducing measurement time or simplifying the acquisition process; however, the spatial sampling strategy and measurement-plane selection remain important factors affecting the efficiency and accuracy of eyebox characterization.
In addition to measurement efficiency, the spatial luminance distribution of a waveguide should also be considered when determining the eyebox boundary. The brightness and luminance uniformity of waveguide-based near-eye displays are affected by the optical configuration, waveguide structure, and diffraction optical elements [15]. Non-uniform luminance distributions may therefore influence the local position at which a specified eyebox criterion is reached. Recent studies on waveguide displays have also investigated eyebox enlargement and luminance distribution in relation to pupil-expansion architectures [5,6,16,17]. Nevertheless, when the optical system, luminance criterion, and measurement conditions are fixed, the luminance distribution is an intrinsic property of the tested system, whereas the sampling interval determines the spatial resolution with which the eyebox boundary is located. Separating these two effects provides a basis for independently analyzing system-dependent luminance characteristics and sampling-induced measurement uncertainty.
Although existing studies have substantially improved the speed or automation of eyebox characterization, the intrinsic relationship between the exit pupil distance (EPD) and the spatial search range required for eyebox measurement has received comparatively limited attention. In conventional measurements, the measurement plane is positioned at a specified EPD and sampled over a predetermined spatial range. However, changing the EPD alters the geometric mapping between the virtual image and the measurement plane and consequently changes the spatial extent that needs to be searched to determine the target eyebox. Exploiting this geometric relationship provides an alternative approach for reducing the measurement range and sampling workload without introducing additional measurement hardware.
In this work, we investigate the intrinsic relationship between EPD and the eyebox search range based on geometric-optics principles. The resulting inverse dependence is utilized to develop an EPD-optimized rapid eyebox measurement approach. Furthermore, an eyebox dimension conversion model is established to estimate the target eyebox dimensions from measurements performed at different EPDs. By incorporating an explicit sampling-error model, the proposed method further establishes a quantitative relationship between the sampling interval and measurement error, enabling the sampling density to be optimized under a prescribed error constraint. Experimental validation is performed using a commercial waveguide-based AR headset and a Radiant Vision Systems I29 optical measurement system. The results demonstrate that the proposed approach can substantially reduce the number of sampling points and measurement time without additional hardware modification while maintaining the required measurement accuracy.
Compared with conventional eyebox characterization methods based on spatial scanning, ray-based analysis, or light-field acquisition, the main contributions of this work are summarized as follows:
(1)
A mathematical model describing the relationship between EPD and eyebox search range is established based on FOV geometry and projection principles. An EPD-adjustable sampling strategy is proposed, transforming eyebox measurement into a spatial sampling-density optimization problem.
(2)
An eyebox dimension conversion method is established for measurements performed at different EPDs, enabling the target eyebox dimensions to be estimated from an optimized measurement plane.
(3)
A quantitative relationship between the sampling interval and sampling-induced measurement error is established, providing an explicit criterion for selecting the sampling interval under a prescribed error tolerance.
(4)
The proposed sampling optimization substantially reduces the number of measurement points while maintaining controllable measurement error. Experimental validation is conducted using a commercial AR headset and an I29 optical measurement system, and the proposed method is quantitatively compared with the standard measurement approach in terms of sampling points, measurement time, and dimensional deviation.

2. Theoretical Modeling and Method Design

2.1. Geometric Relationship Between Exit Pupil Distance and Eyebox Search Range

Based on the optical configuration of waveguide-based AR devices, a geometric model is established to characterize the relationship between EPD and eyebox search range. The model is derived from geometric projection principles and provides the theoretical foundation for subsequent sampling-efficiency optimization and error analysis. The corresponding geometric configuration is illustrated in Figure 1.
The key geometric parameters illustrated in Figure 1 are defined as follows. ABCD denotes the light-coupling-out region of the waveguide, which serves as the physical light source for virtual image formation. The exit pupil distance (EPD) is denoted by (L) in the following derivations for simplicity, where   l 1 and l 2 correspond to two different EPD conditions. Segments A 1 B 1 and A 2 B 2 represent the vertical eyebox search range, while segments B 1 C 1 and B 2 C 2 represent the horizontal eyebox search range.
As illustrated in Figure 1a, the central purple square represents the source region corresponding to the central FOV. The four blue corner regions represent the source regions associated with the peripheral FOV at the four boundary positions of the eyebox. These source regions are determined by the waveguide optical architecture and remain unchanged with variations in EPD. Consequently, changes in EPD affect the spatial extent of the eyebox search range rather than the locations of the corresponding source regions on the waveguide.
As shown in Figure 1b and Figure 1c, the geometric relationships satisfy A E O 1 = B E O 1 = θ V 2 , and B F O 2 = C F O 2 = θ h 2 , where θ v and θ h denote the vertical and horizontal FOV, respectively. Let θ x and θ y denote the horizontal and vertical eyebox search ranges, respectively. In addition, h and v represent the horizontal and vertical dimensions of the waveguide light-coupling-out region. According to the geometric relationships illustrated in Figure 1, the eyebox search ranges can be expressed as follows:
S x   =   h - 2 Ltan ( θ h 2 ) ; S y   =   v - 2 Ltan ( θ v 2 ) ;
According to Equation (1), the eyebox search range decreases linearly as the EPD increases. Consequently, the scanning area required for the measurement camera is reduced, leading to a shorter eyebox measurement time.
Furthermore, point E in Figure 1b and point F in Figure 1c correspond to the limiting EPD in the vertical and horizontal directions, respectively.
Under the limiting condition, the pupil aperture is tangent to the boundary ray corresponding to the edge FOV. Therefore, the following relationship holds: A A = B B = B B = C C = D / 2 , where D denotes the diameter of the human pupil or the aperture diameter of the measurement camera.
Accordingly, the limiting exit pupil distances in the horizontal and vertical directions can be expressed as
L h = ( h - D ) / 2 tan ( ; L v = ( v - D ) / 2 tan ( ;
Respectively, the maximum allowable exit pupil distance is therefore given by
L m a x = m i n L h , L v
where L m a x represents the upper bound of the EPD that still guarantees complete visibility of the FOV.

2.2. Derivation of Eyebox Size Conversion Formula

To enable accurate conversion of eyebox dimensions under different EPD conditions, the following assumptions are adopted:
(1)
The waveguide light-coupling-out region exhibits sufficient luminance uniformity. The luminance distributions of both the central and peripheral FOV regions are determined solely by the optical projection geometry and are independent of the EPD.
(2)
During the measurement process, the spectral response characteristics and measurement FOV of the optical measurement system remain unchanged. The luminance measurement error is maintained within ± 2 % , satisfying the accuracy specification of the Riedel I29 optical measurement system.
(3)
The target EPD denoted as L a i m , is specified by the device manufacturer, whereas the corresponding eyebox dimensions are estimated from measurements obtained at other EPD conditions.
Based on the geometric model established in Figure 1, the proposed conversion method relies on the following principle. The eyebox boundary is defined according to the criterion that the luminance at the edge FOV is no less than 50 % of that measured at the central FOV position. When the EPD changes, the luminance corresponding to the central FOV at the eyebox center remains unchanged, while the luminance corresponding to the peripheral FOV at the eyebox boundary also remains unchanged.
Therefore, under the luminance-based eyebox criterion, the horizontal and vertical eyebox dimensions corresponding to an arbitrary EPD can be expressed as
E h = h 0 - 2 Ltan ( θ h 2 ) ; E V = v 0 - 2 Ltan ( θ v 2 ) ;
where h 0 and v 0 denote the theoretical horizontal and vertical eyebox dimensions, respectively, when the EPD is zero.
For a target exit pupil distance L a i m , the corresponding horizontal and vertical eyebox dimensions, denoted by E h a i m and E v a i m , can be expressed as
E h a i m = h 0 - 2 L a i m tan ( θ h 2 ) ; E v a i m = v 0 - 2 L a i m tan ( θ v 2 ) ;
For an arbitrary measurement E P D 1 satisfying L 1 > L a i m the eyebox dimensions corresponding to the target EPD can be obtained from Equation (5) as
E h 1 = h 0 - 2 L 1 tan ( θ h 2 ) ; E v 1 = v 0 - 2 L 1 tan ( θ v 2 ) ;
Combining Equations (5) and (6) yields the eyebox dimensions corresponding to the target EPD:
E h a i m = h 1 + 2 ( L 1 -   L a i m ) tan ( θ h 2 ) ; E v a i m = v 1 + 2 ( L 1 -   L a i m ) tan ( θ v 2 ) ;

3. Eyebox Sampling Efficiency and Error Modeling

3.1. Error Modeling Based on Angular Intensity Distribution

In practical AR display systems, the optical intensity distribution within the eyebox is generally nonuniform due to the angular emission characteristics of display pixels and the transmission characteristics of the optical system.
Most display light sources can be approximated as Lambertian emitters, whose angular intensity distribution follows Lambert’s cosine law:
I α =   I 0 cos α ;
where I 0 denotes the on-axis optical intensity and α represents the emission angle relative to the optical axis.
As the emission angle increases, the contribution of the corresponding rays to the perceived eyebox boundary gradually decreases.
To account for this effect without introducing excessive model complexity, a weighted geometric model is adopted in this study. In this model, the eyebox boundary is primarily determined by the chief rays, while marginal rays are weighted according to the cosine attenuation factor I 0 cos α .
This approximation provides a practical balance between physical fidelity and computational efficiency. It should be noted that the attenuation factor is introduced solely to improve the agreement between theoretical predictions and practical operating conditions. Since the actual display source inherently exhibits Lambertian emission characteristics, no additional attenuation factor is required during experimental measurements.

3.2. Sampling-Based Measurement Framework

Eyebox measurement is performed by sampling luminance at discrete spatial locations on a measurement plane located at an EPD.
Let Δ x denote the sampling interval. For an eyebox dimension E along a given direction, the required number of sampling points N can be approximated as
E = N Δ x
or equivalently
N = E Δ x
Assuming that the acquisition time for each sampling point remains constant, the total measurement time T is proportional to the number of sampling points:
T N
Substituting Equation (10) yields
T E Δ x
This relationship indicates that, for a fixed eyebox dimension, increasing the sampling interval can significantly improve measurement efficiency by reducing the number of sampling points.
Furthermore, according to Equation (4), the eyebox dimension decreases as the exit pupil distance increases. Therefore, under a fixed sampling interval, increasing the EPD can further reduce the required number of sampling points and consequently shorten the measurement time.
However, increasing the sampling interval inevitably introduces discretization error in eyebox boundary detection. Therefore, a quantitative error model is established in the following section to evaluate the trade-off between measurement efficiency and accuracy.

3.3. Sampling-Induced Error Analysis

(1)
Boundary Approximation Error
The eyebox boundary is inherently continuous in space, whereas practical measurements are performed using discrete sampling. Consequently, spatial quantization error is unavoidable.
Assuming that the eyebox boundary is locally smooth, the maximum boundary deviation introduced by discretization can be approximated by the sampling interval:
δ Δ x
In practical measurement systems, additional factors such as boundary interpretation uncertainty, measurement noise, and two-dimensional sampling coupling further contribute to the overall error. Therefore, an empirical correction factor k is introduced, yielding
δ k Δ x
where k is an empirical coefficient reflecting the boundary-position uncertainty under practical measurement conditions. It is not a fundamental optical constant and therefore does not have a universal value. For waveguide-based AR displays, the coupled optical field is generally non-uniform due to propagation loss, out-coupling efficiency, and spatial variations in the optical structure. Such non-uniformity may affect the precise location of the eyebox boundary defined by a given brightness threshold. Nevertheless, under fixed optical and measurement conditions, the brightness distribution and the corresponding threshold-defined boundary remain unchanged, while the sampling interval Δx determines the spatial resolution with which the boundary can be identified.
The value of k therefore depends on the eyebox definition criterion, brightness distribution, measurement noise, boundary-determination method, and sampling strategy, and should be regarded as an adjustable empirical parameter rather than a fixed physical constant. In this study, k = 2 is adopted as a conservative engineering value for theoretical sampling-interval selection, accounting for the possible accumulation of sampling uncertainty at the two boundaries of the measured eyebox. This conservative choice provides a stricter constraint on the sampling interval and helps control the potential measurement error.
For the analysis of the experimental results, however, k = 1 is used to characterize the effective uncertainty associated with a single eyebox boundary. Under the adopted boundary-detection procedure, this uncertainty is approximately one sampling interval. Thus, k = 2 is used for conservative theoretical error control, whereas k = 1 is used to characterize the actual sampling-induced dimensional deviation observed in the experiments. This distinction allows the theoretical sampling criterion to remain conservative while providing a more direct representation of the experimentally observed boundary-position uncertainty.
(2)
Relative Error Definition
The relative measurement error is defined as
ϵ % = E m E t E t × 100 %
where
E m is the measured eyebox dimension;
E t is the true eyebox dimension.
In this work, the nominal eyebox dimensions provided by the device manufacturer are used as the reference values for error evaluation.
(3)
Error Scaling Law
Substituting Equation (14) into Equation (15) yields
Δ E = E 0 + δ E 0 + k Δ x
Equation (14) describes the relationship between the sampling error and the sampling interval ( Δ x ). In practical eyebox measurements, the deviation between the measured and true eyebox sizes, E m E t , may also contain systematic and experimental errors arising from manufacturing tolerances, optical-axis misalignment, optical aberrations, positioning uncertainty, and other factors. In the present experiments, these error sources remain approximately unchanged because the measurement setup and experimental conditions are kept constant while only the sampling interval is varied. Therefore, although these factors may contribute to the absolute measurement error, they do not affect the variation trend of the measurement error with ( Δ x ). Accordingly, ( k Δ x ) in Equation (14) is used to characterize the sampling-dependent component of the measurement error and to analyze the influence of the sampling interval on measurement accuracy.
Accordingly, k Δ x in Equation (14) is used to characterize the sampling-dependent component of the measurement error.
Therefore
ϵ = Δ E E t k Δ x E t  
This result indicates that the relative measurement error is approximately proportional to the sampling interval and inversely proportional to the eyebox dimension.
Combining Equation (4), the relative errors in the horizontal and vertical directions can be expressed as
ϵ h = 2 Δ x h 0 - 2 Ltan ( θ h 2 ) ϵ v = 2 Δ x v 0 - 2 Ltan ( θ v 2 )  
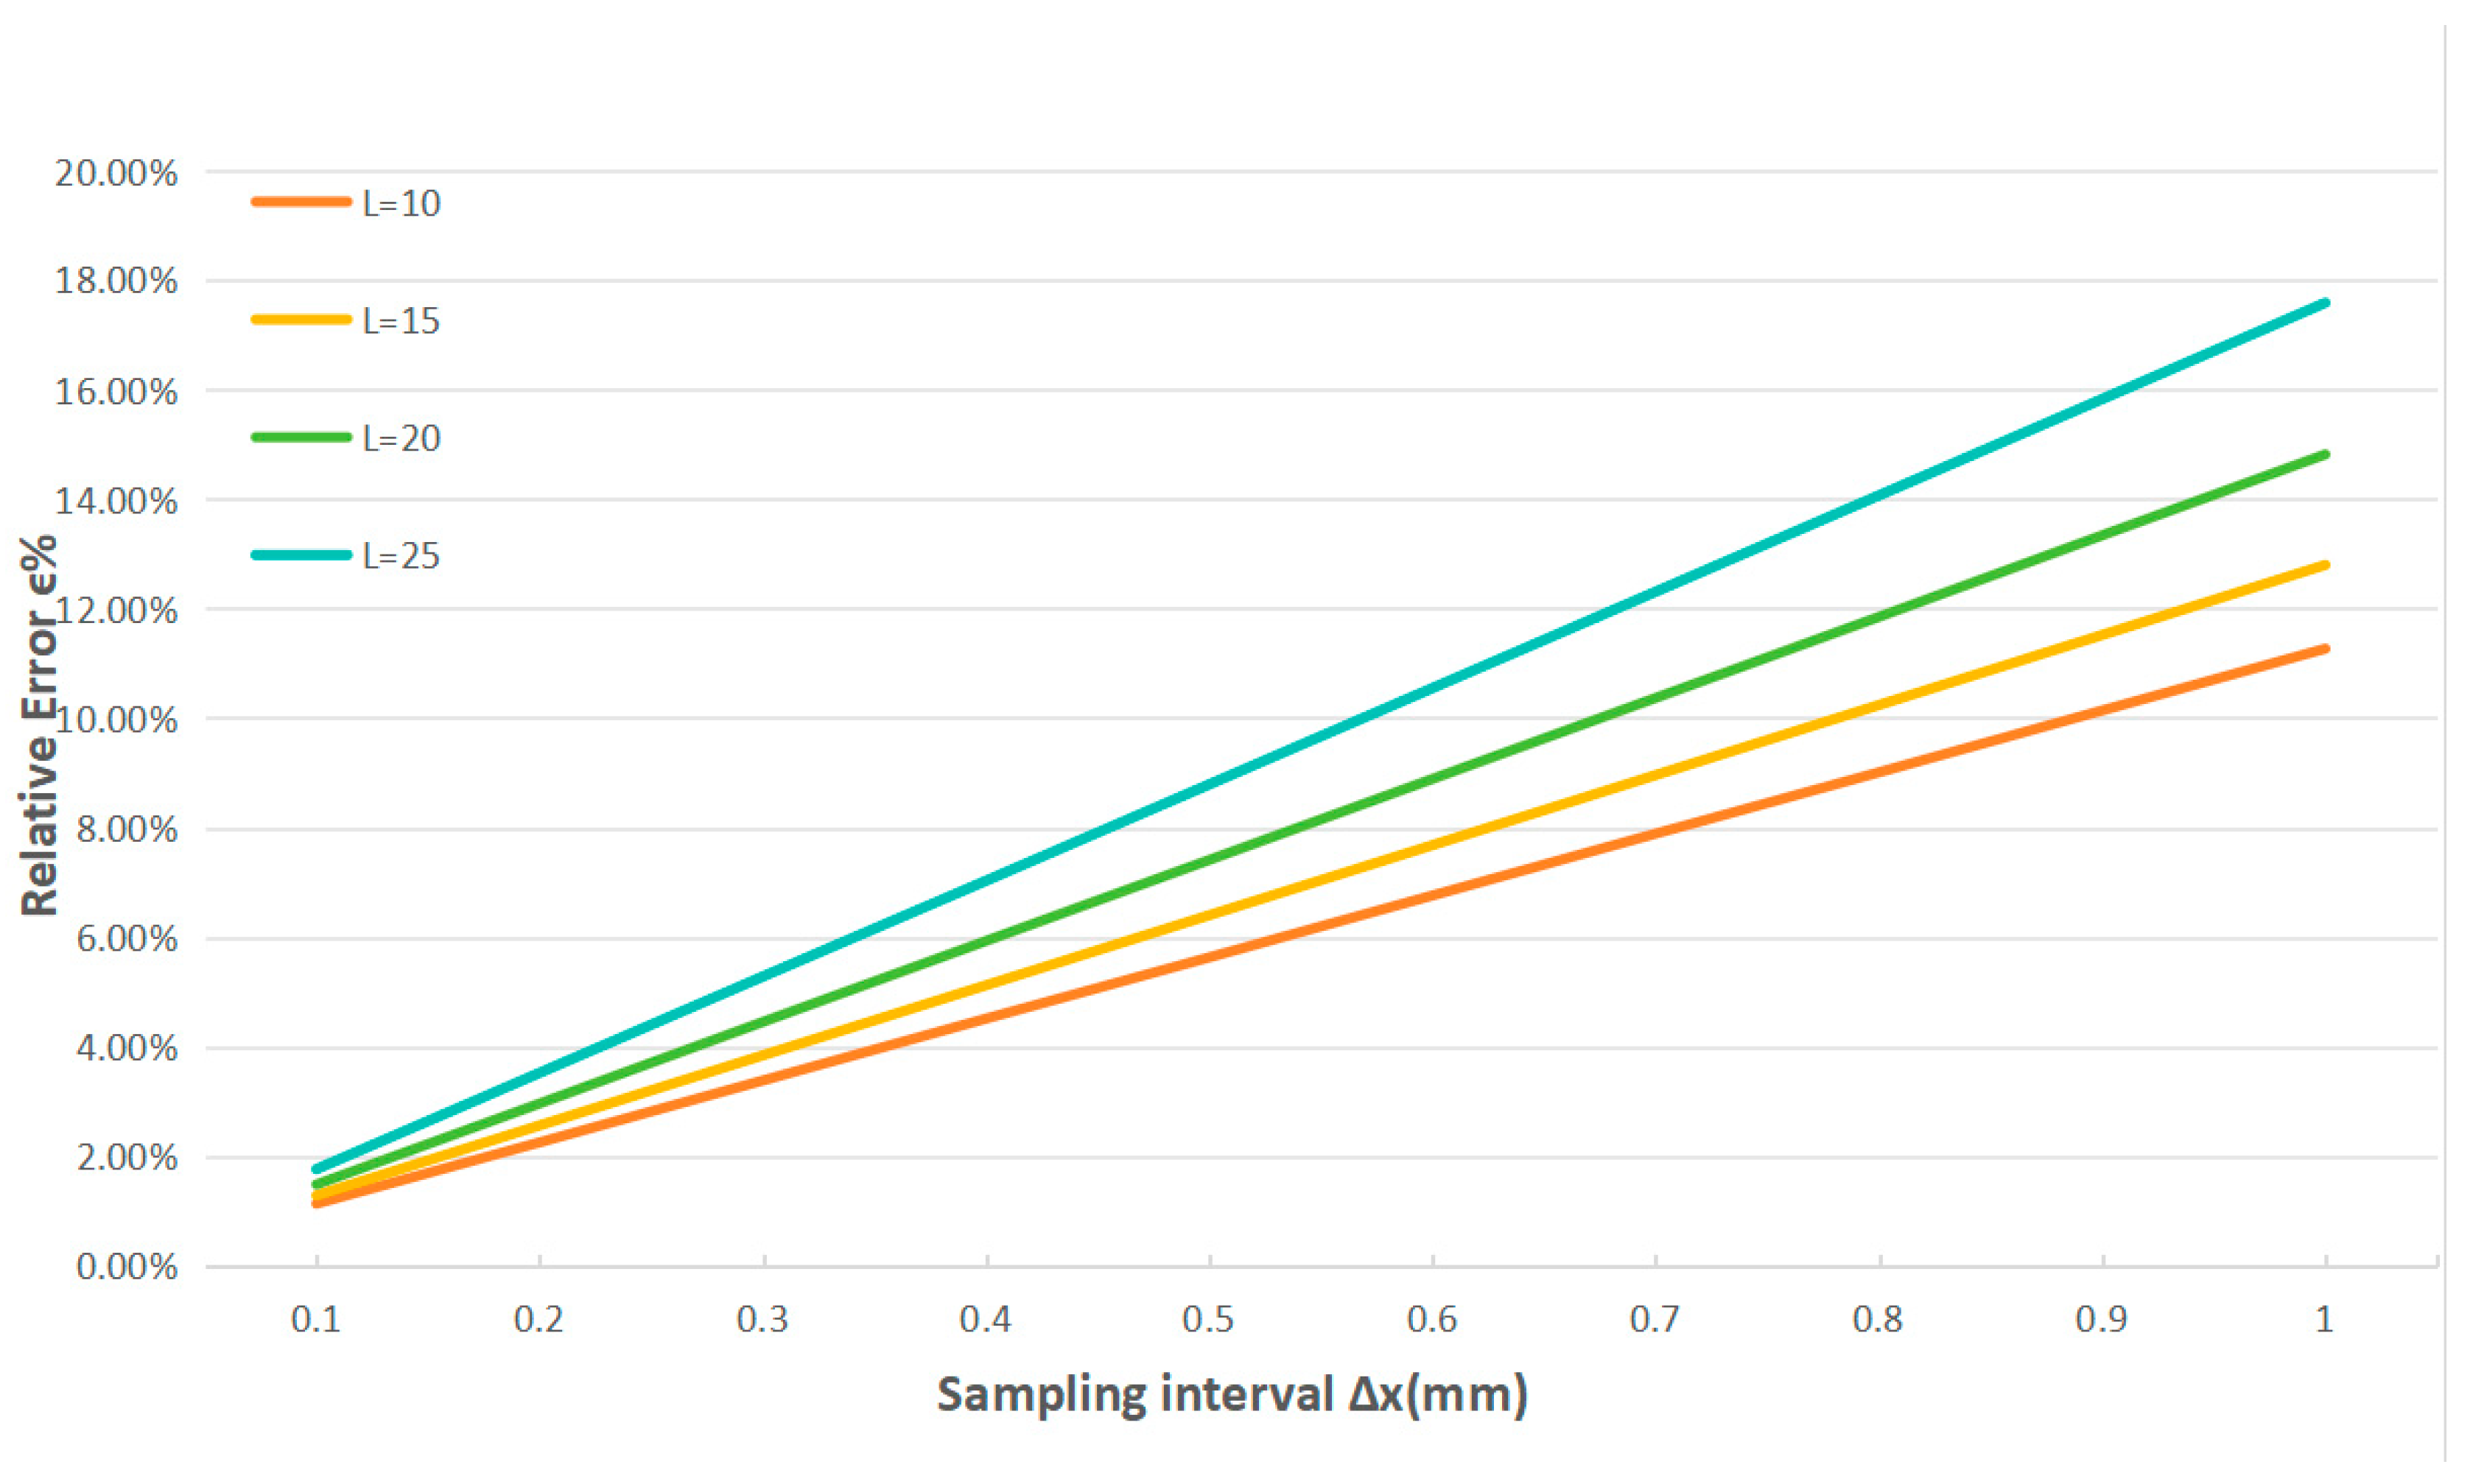
Figure 2 illustrates the relationship among relative measurement error, sampling interval, and EPD. The results show that the relative measurement error increases approximately linearly with the sampling interval. Furthermore, for a fixed sampling interval, increasing the EPD increases the relative measurement error.
By combining Equation (18) and Figure 2, the dominant dependence of the sampling-induced relative measurement error on the measurement parameters can be identified. For the considered geometric configuration, the effective angular range decreases with increasing measurement distance L. Accordingly, the relative sampling error decreases approximately with increasing L, while increasing the sampling interval increases the error. Therefore, the error dependence can be approximately expressed as
ϵ Δ x L

3.4. Sampling Optimization Criterion

For a specified maximum allowable relative error, denoted by ϵ m a x , the sampling interval should satisfy
Δ x E t ϵ max k
where k is the empirical correction coefficient defined in Section 3.3.
For the engineering approximation adopted in this work (k ≈ 2), Equation (19) can be simplified to
Δ x E t ϵ max 2
For conservative sampling-parameter selection, k = 2 is recommended. In contrast, when estimating the actual sampling-induced deviation in the experimental results, k = 1 is adopted.
Equation (21) provides a conservative sampling-interval criterion for a prescribed maximum allowable error. The sampling intervals used in the experiments are selected to evaluate the practical trade-off between measurement accuracy and sampling efficiency and are not necessarily required to satisfy this conservative criterion.
This criterion provides a direct guideline for selecting measurement parameters. By specifying an acceptable error threshold, the maximum allowable sampling interval can be readily determined, thereby maximizing measurement efficiency while maintaining the required measurement accuracy.
Consequently, the proposed framework establishes a quantitative trade-off among eyebox dimension, sampling interval, and measurement error, enabling predictive optimization of the eyebox measurement process.
The resulting predictive optimization framework forms the theoretical basis for the experimental validation presented in Section 4.

4. Experimental Validation and Results Analysis

4.1. Experimental Equipment and Parameters

4.1.1. Test Device

A commercially available full-color AR head-mounted display (HMD) was selected as the device under test (DUT). Its key optical specifications are listed in Table 1.
The DUT employs a Micro-LED display engine coupled with a waveguide-based optical system, which represents one of the mainstream optical architectures used in current consumer AR products. Consequently, the device provides a practical platform for evaluating the effectiveness and applicability of the proposed measurement framework.

4.1.2. Measurement Equipment

Experimental validation is performed using a commercial waveguide-based AR headset. A ProMetric® I29 ultra-high-resolution imaging colorimeter (Radiant Vision Systems, Redmond, WA, USA) is used as the primary measurement instrument.The main specifications of the system are listed in Table 2.
The I29 is a two-dimensional imaging colorimeter capable of high-accuracy luminance measurement and automated field scanning. Owing to its high spatial resolution and measurement repeatability, the system is well suited for eyebox characterization in near-eye display systems. Furthermore, its performance complies with the photometric measurement requirements defined in IEC 63145-20-10:2019 [3].

4.1.3. Measurement Platform

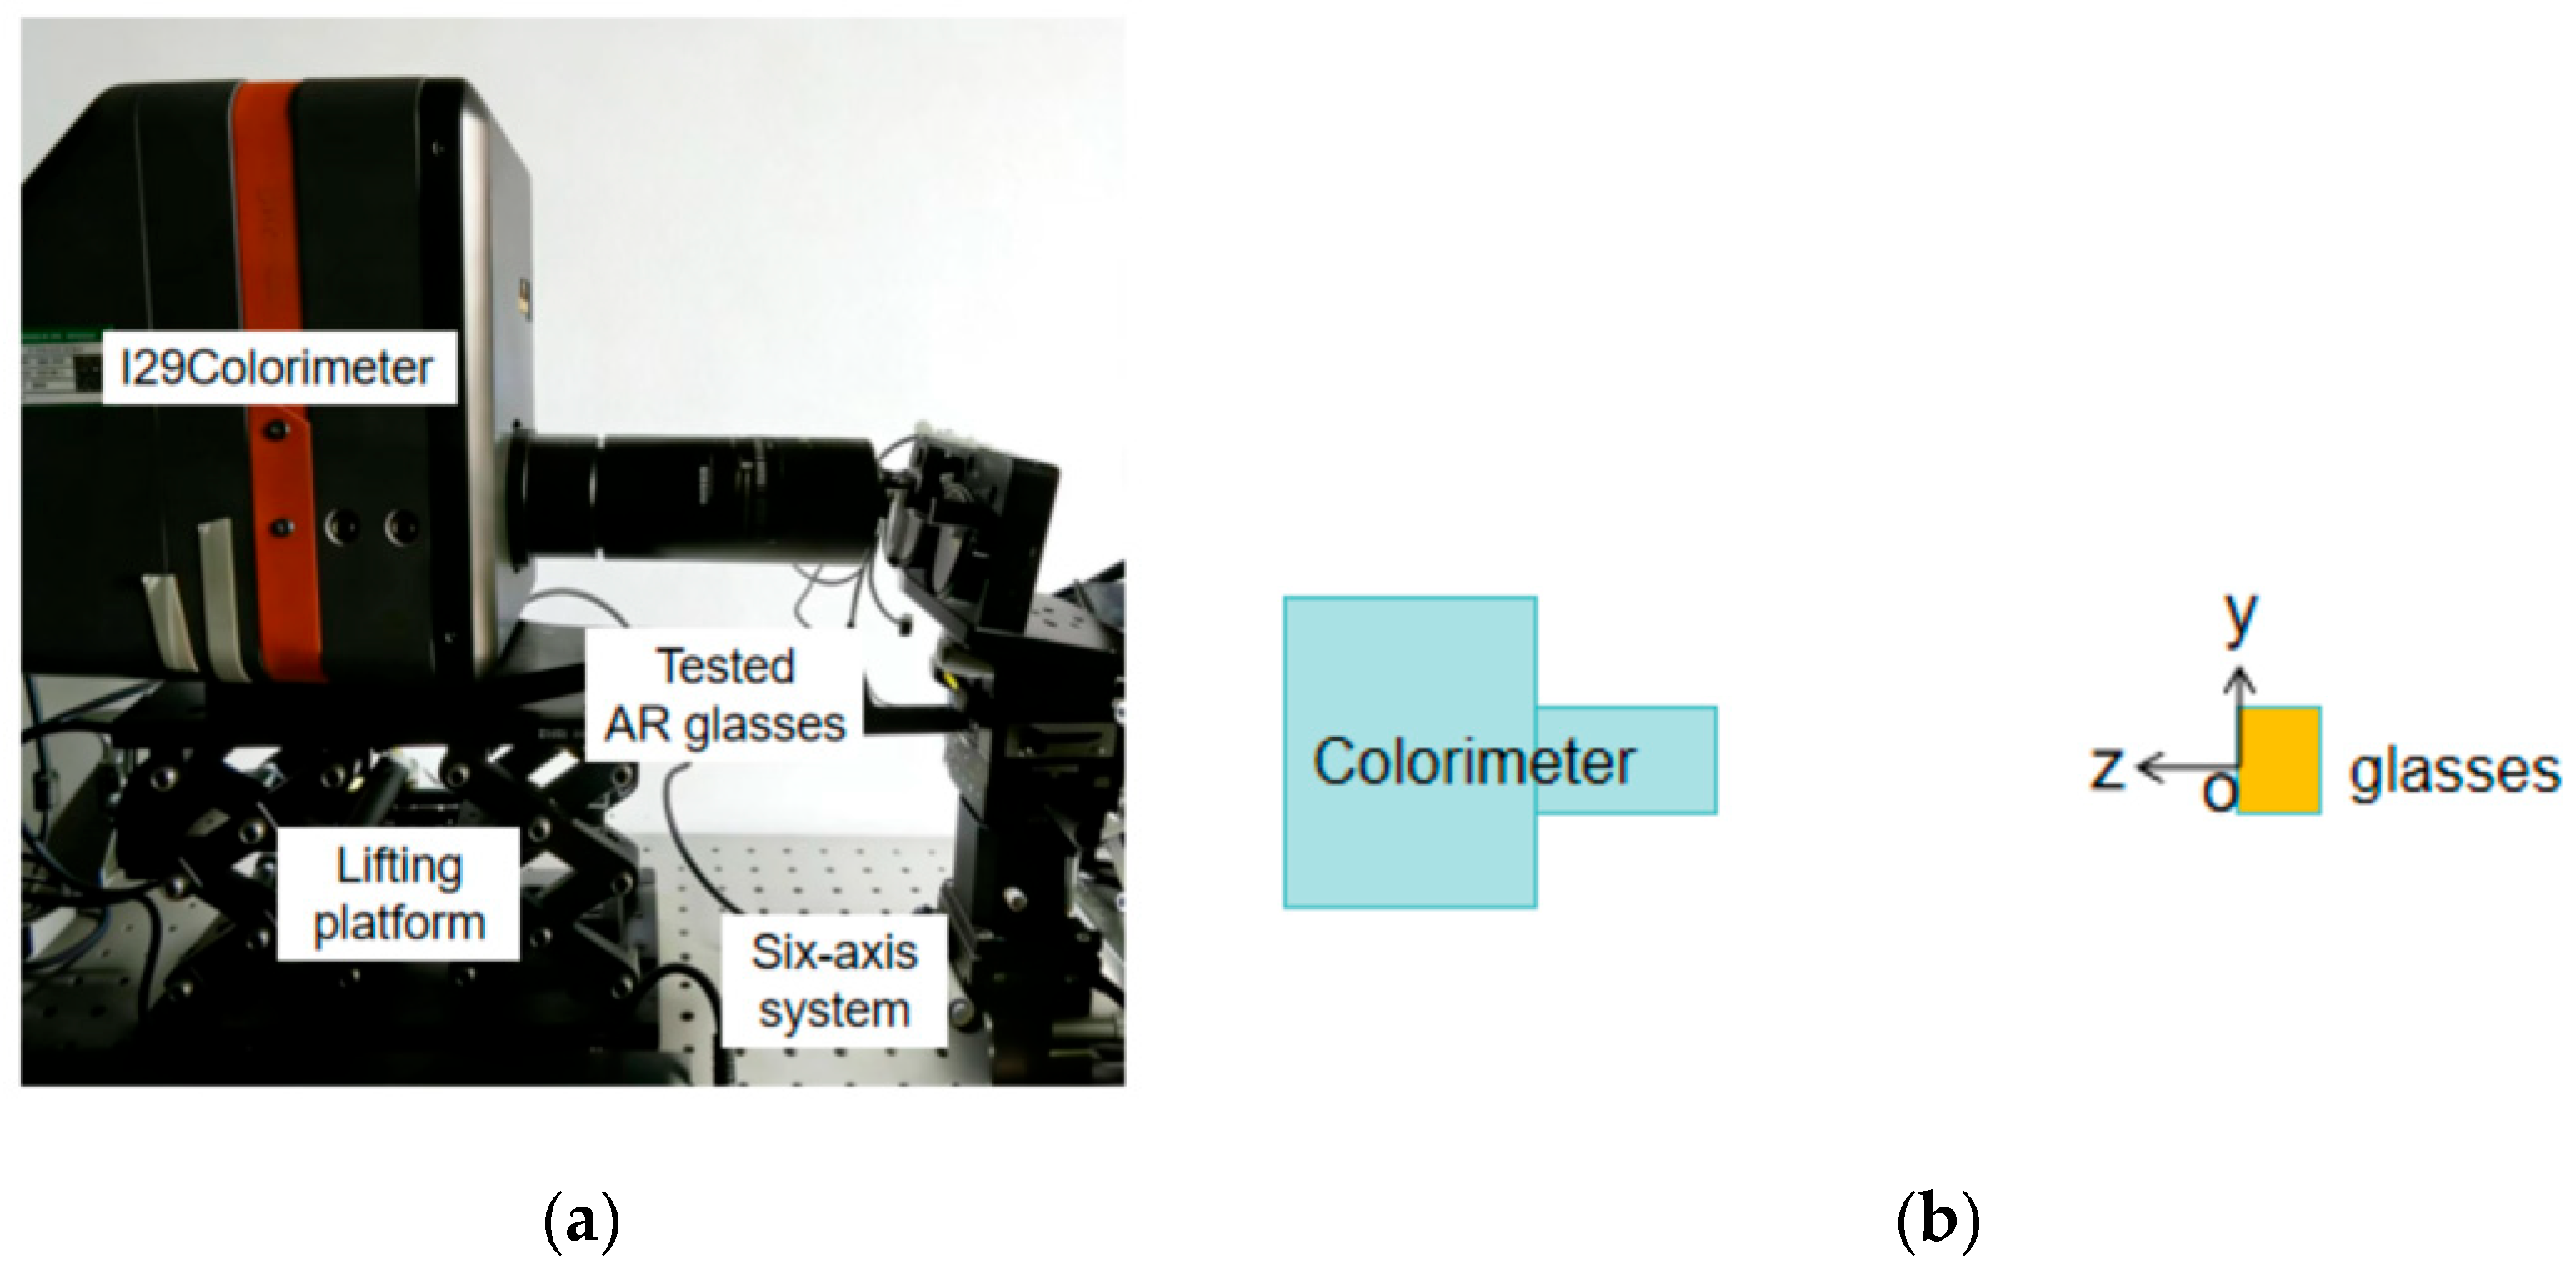
A schematic diagram of the experimental setup is shown in Figure 3a. The measurement platform consists of the following components:
(1)
Photometric measurement instrument: a Radiant Vision Systems I29 imaging colorimeter, which is used for high-accuracy luminance measurements and quantitative evaluation of the optical performance of the AR display.
(2)
Device under test (DUT): the AR head-mounted display, mounted on a six-degree-of-freedom (6-DoF) positioning stage to enable precise alignment and position adjustment during the measurement process.
(3)
Precision motion system: consisting of the colorimeter translation stage and the DUT 6-DoF positioning stage, providing sufficient motion range and positioning accuracy for eyebox characterization.
The coordinate system adopted in this study is illustrated in Figure 3b. The optical axis of the imaging colorimeter is aligned with the output optical axis of the AR display and is defined as parallel to the z-axis. The y-axis is defined as shown in Figure 3b, while the x-axis is perpendicular to the yoz plane, thereby forming a right-handed Cartesian coordinate system.

4.2. Test Procedure Arrangement

To systematically verify the reliability and general applicability of the quantitative relationship between the EPD and the eyebox search range established by Equation (1), a series of repeated measurements was performed.
First, the three rotational degrees of freedom of the positioning stage were adjusted to align the optical axis of the imaging colorimeter with the output optical axis of the AR display. Alignment was achieved by superimposing the crosshair projected by the AR device onto the reference crosshair displayed at the center of the colorimeter field of view.
After alignment, the z-axis position was adjusted until the EPD reached the limiting value defined by Equation (3) in Section 2.1. Subsequently, the x- and y-axis positions were fine-tuned until the images observed in the four corner regions of the field of view exhibited approximate symmetry. The corresponding coordinates were recorded as the eyebox center position, denoted by x 0 , y o .
Since the aperture diameter of the imaging colorimeter is 3.6 mm, where h = 22 mm and v = 16 mm are obtained from the DUT specifications listed in Table 1. According to Equation (2),
L h = ( 22 - 3.6 ) / 2 tan ( = 43 . 2   mm ; L v = ( 16 - 3.6 ) / 2 tan ( = 39 . 1   mm ;
According to Equation (3),
L m a x = m i n L h , L v = 39.1   mm
The smaller value was adopted as the maximum allowable EPD.
The symmetry of the four corner images was evaluated using
min B 1 , B 2 , B 3 , B 4 max B 1 , B 2 , B 3 , B 4
where B 1 ~ B 4 denote the luminance values measured in the four corner regions.
After determining the eyebox center position, the z-axis was adjusted to establish different EPD conditions satisfying L > L a i m . For each EPD, the corresponding eyebox search range was determined according to Equation (1):
S x   =   x - 2 Ltan ( θ x 2 )   +   1 ; S y   =   y - 2 Ltan ( θ y 2 )   +   1 ;
where an additional 1 mm safety margin was introduced to compensate for uncertainties associated with x 0 , y o localization and EPD positioning, thereby preventing insufficient search coverage. The search ranges and corresponding numbers of sampling points under different EPD conditions are summarized in Appendix A.
Images were acquired at uniformly spaced sampling locations within the search range. For each sampling position, the luminance ratio between the corner regions and the central field region was calculated. The largest inscribed rectangle satisfying a luminance ratio greater than 0.5 was defined as the effective eyebox.
The corner regions were defined as 1 ° × 1 ° areas located 1.1 ° inward from each field-of-view corner. The central region was defined as a 1 ° × 1 ° area centered within the field of view.

4.3. Test Data

4.3.1. Determination of the Central EPD Position

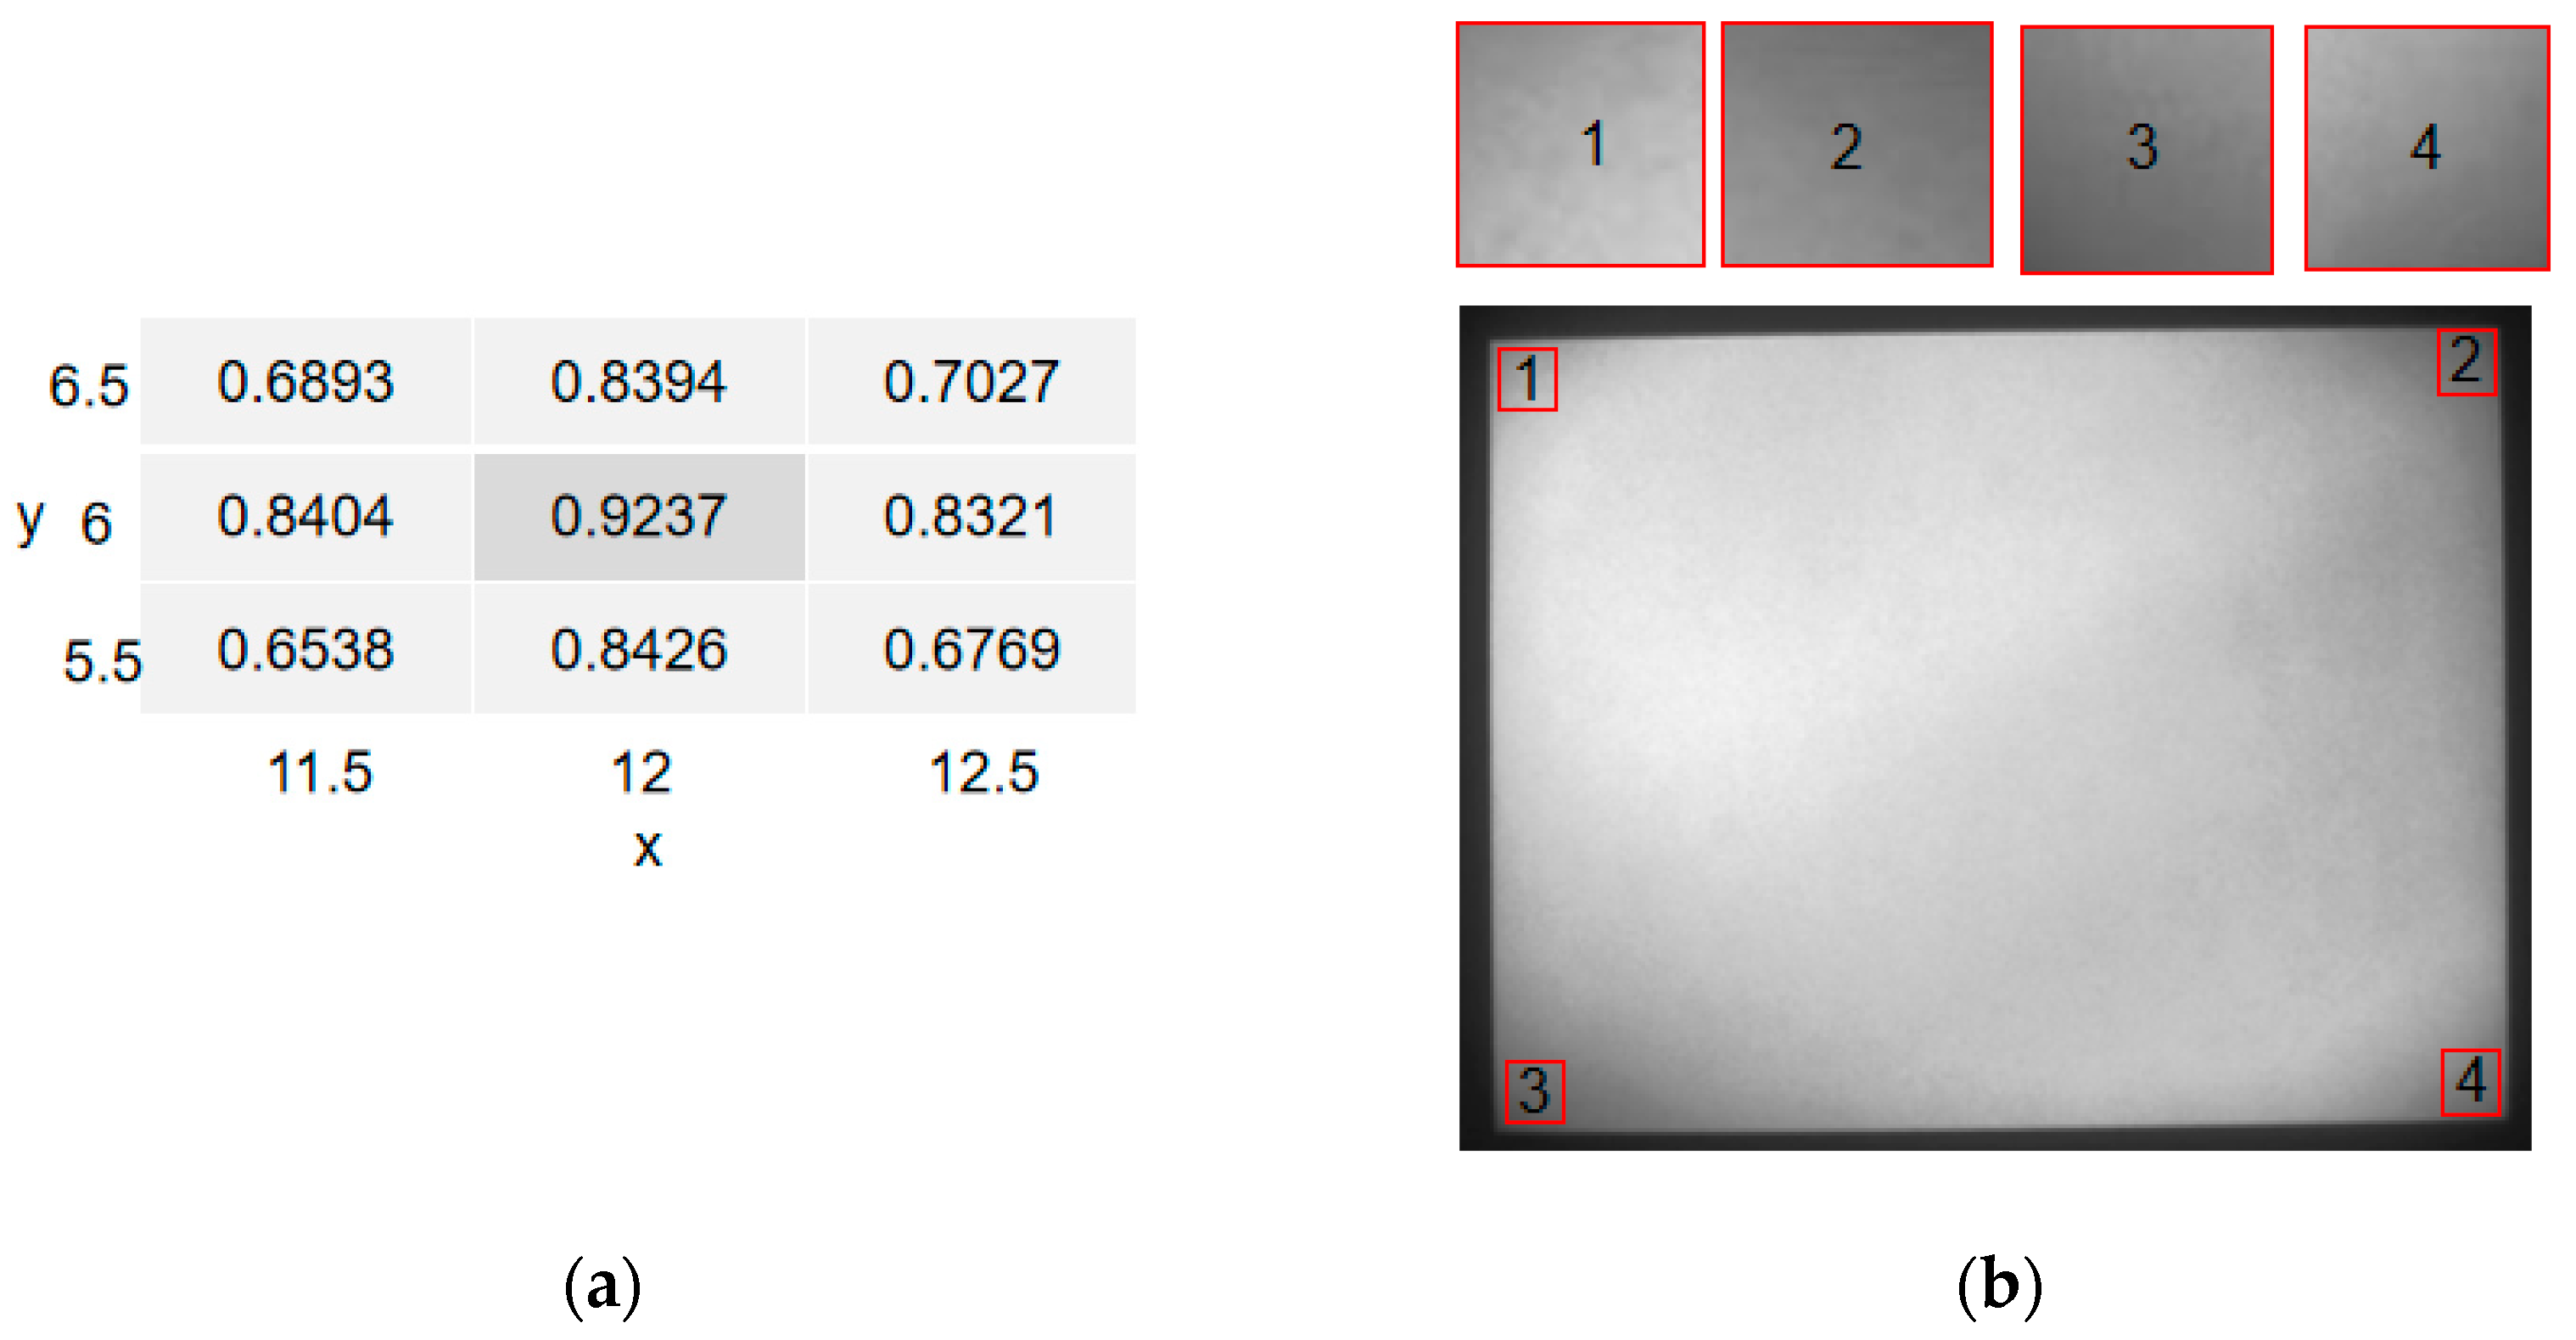
Figure 4a presents the quadrant symmetry distribution measured at the limiting exit pupil distance of 39.1 mm with a sampling interval of 0.5 mm in both the x - and y -directions. The highest symmetry was observed at x = 12   mm and y = 6   mm . The corresponding grayscale image is shown in Figure 4b.
For visualization purposes, grayscale images are presented in the figure, whereas all quantitative analyses were performed using luminance data. At the identified center position, the luminance values measured in the four corner regions were 1403, 1304, 1296, and 1398 nits, respectively. According to the symmetry metric defined in Section 4.2, the corresponding luminance uniformity was calculated as
min B 1 , B 2 , B 3 , B 4 max B 1 , B 2 , B 3 , B 4 = 0.9237
indicating a high degree of quadrant symmetry. Therefore, the eyebox center position was determined to be located at x 0 , y o = 12   mm , 6   mm .
The average luminance of the central field region was measured to be 1736 nits.
To validate the proposed dimension-conversion model and sampling optimization framework, subsequent experiments were conducted at two representative exit pupil distances: the target EPD of 16 mm specified by the standard method and an optimized EPD of 30 mm.

4.3.2. Data Corresponding to Measurement Exit Pupil Distance 1 (30 mm)

Figure 5a shows the grayscale image acquired at L = 30   mm with the eyebox center position fixed at x 0 , y o = 12   mm , 6   mm . Under this measurement condition, the average luminance of the central field region was measured to be 1748 nits. Compared with the reference luminance of 1736 nits obtained at the limiting EPD of 39.1   mm , the difference was only 0.69%, indicating that the central-field luminance remained essentially unchanged with variation in the EPD.
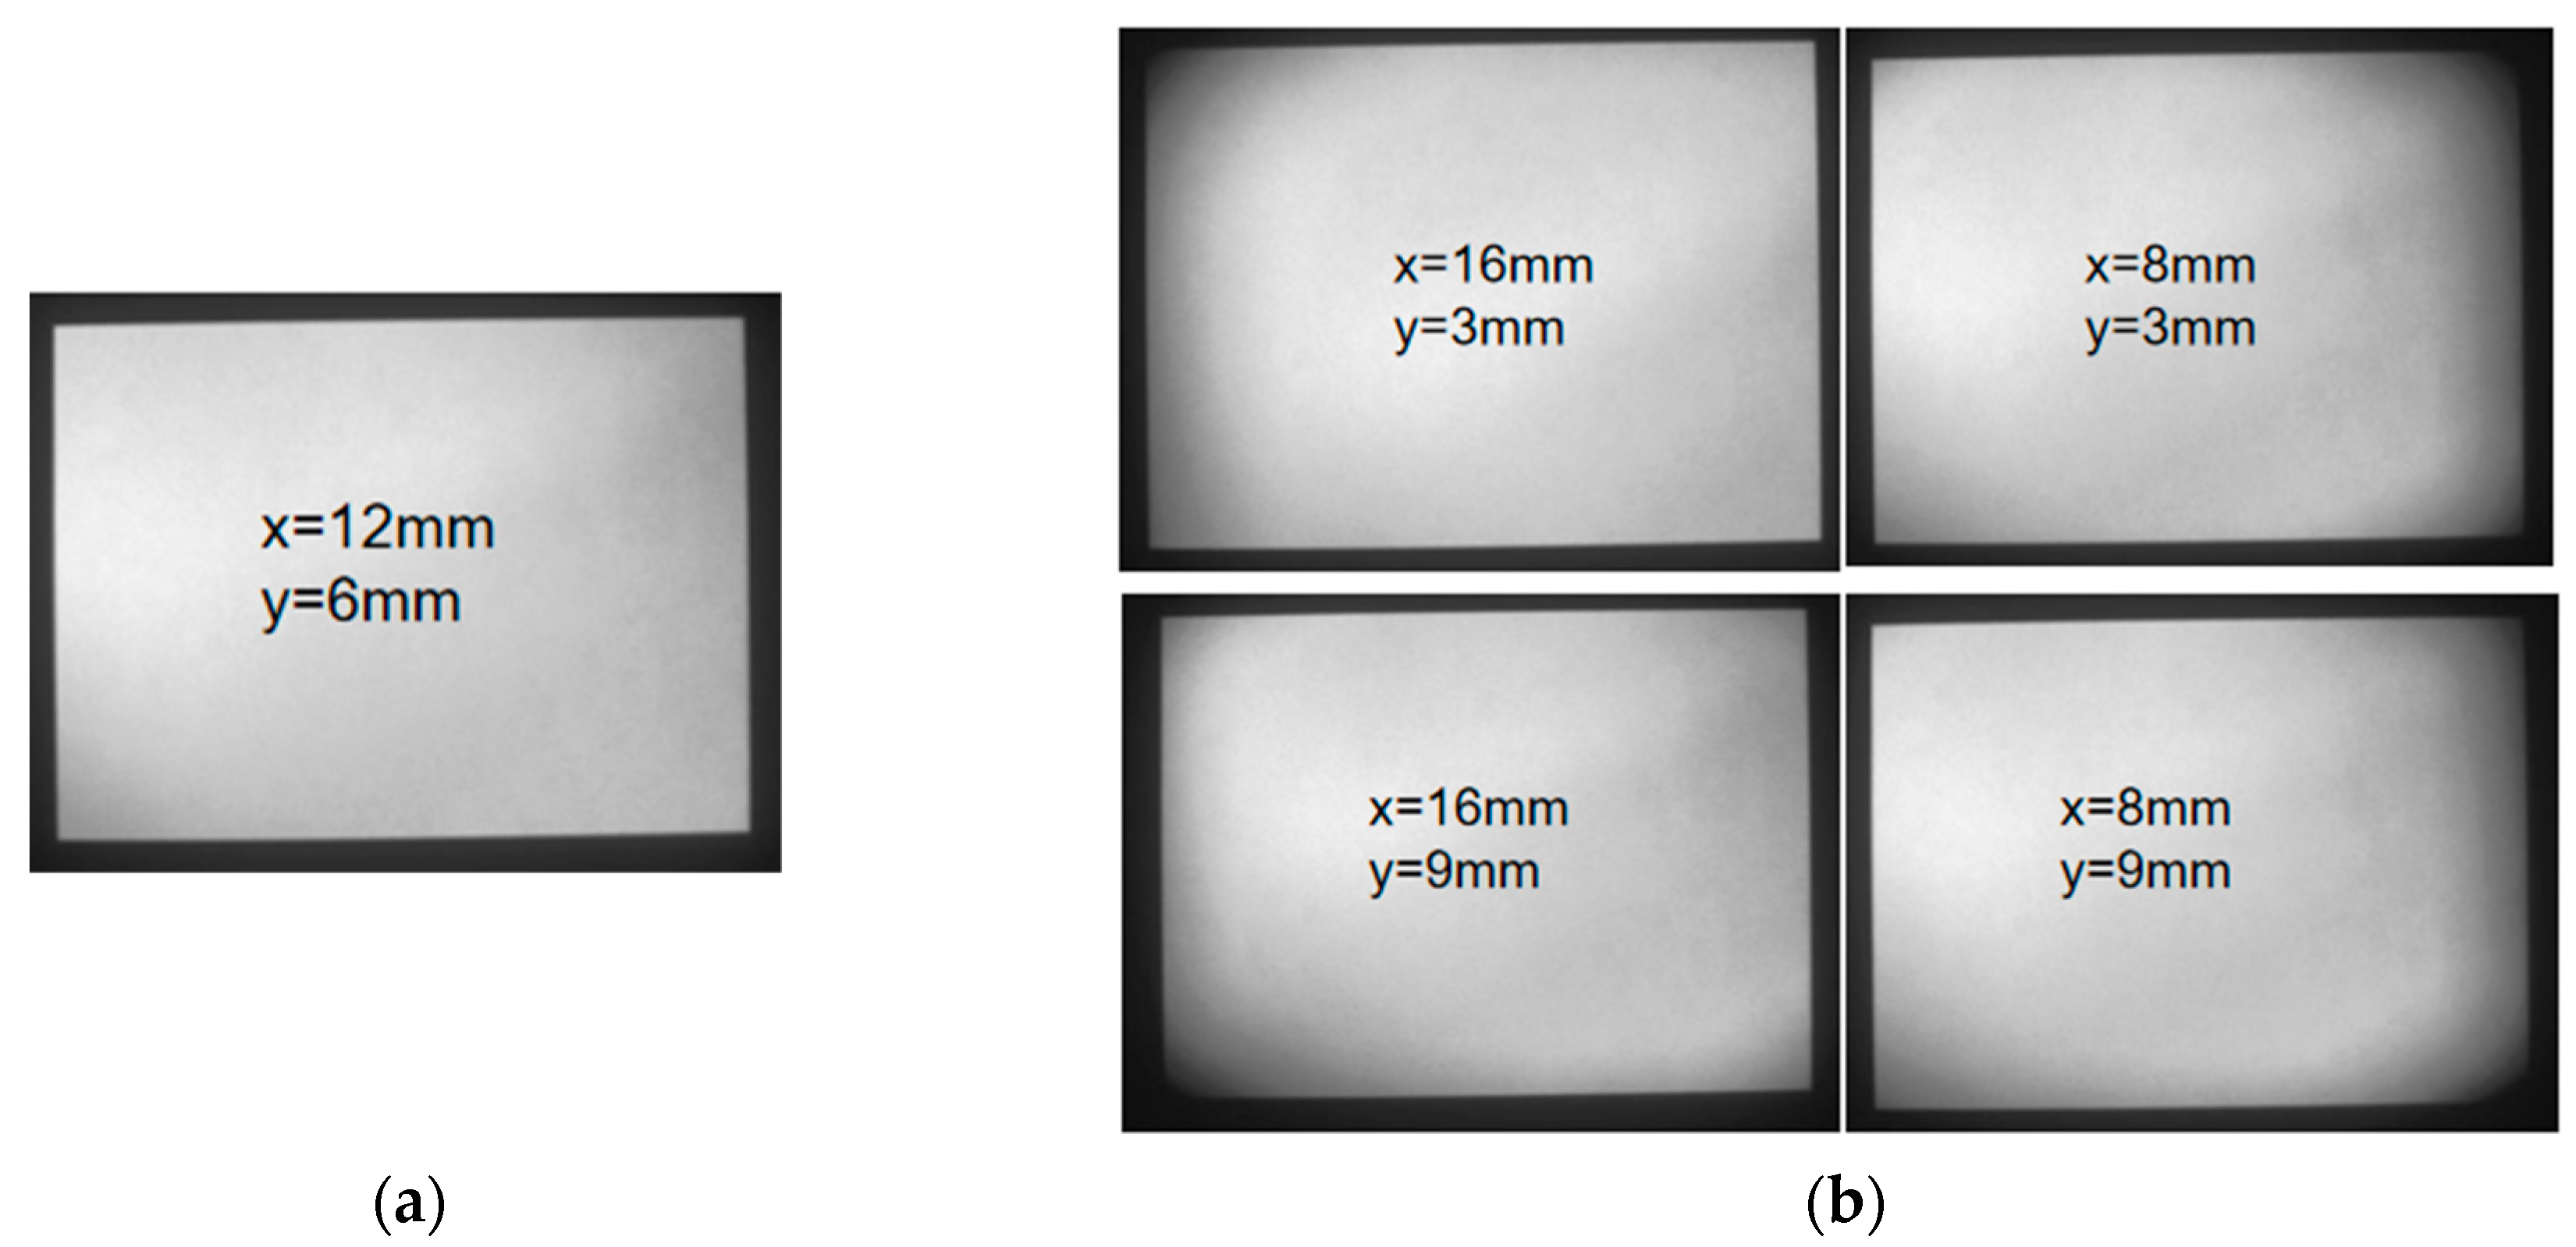
Figure 5b presents the grayscale images corresponding to the four boundary positions of the search range. The ratio between the minimum average luminance of the corner regions and the reference luminance of 1736 nits was defined as the eyebox luminance ratio. The resulting values were 0.1214, 0.1425, 0.1367, and 0.1298, respectively. All values were substantially lower than the threshold of 0.5, confirming that the predefined search range fully covered the effective eyebox region.
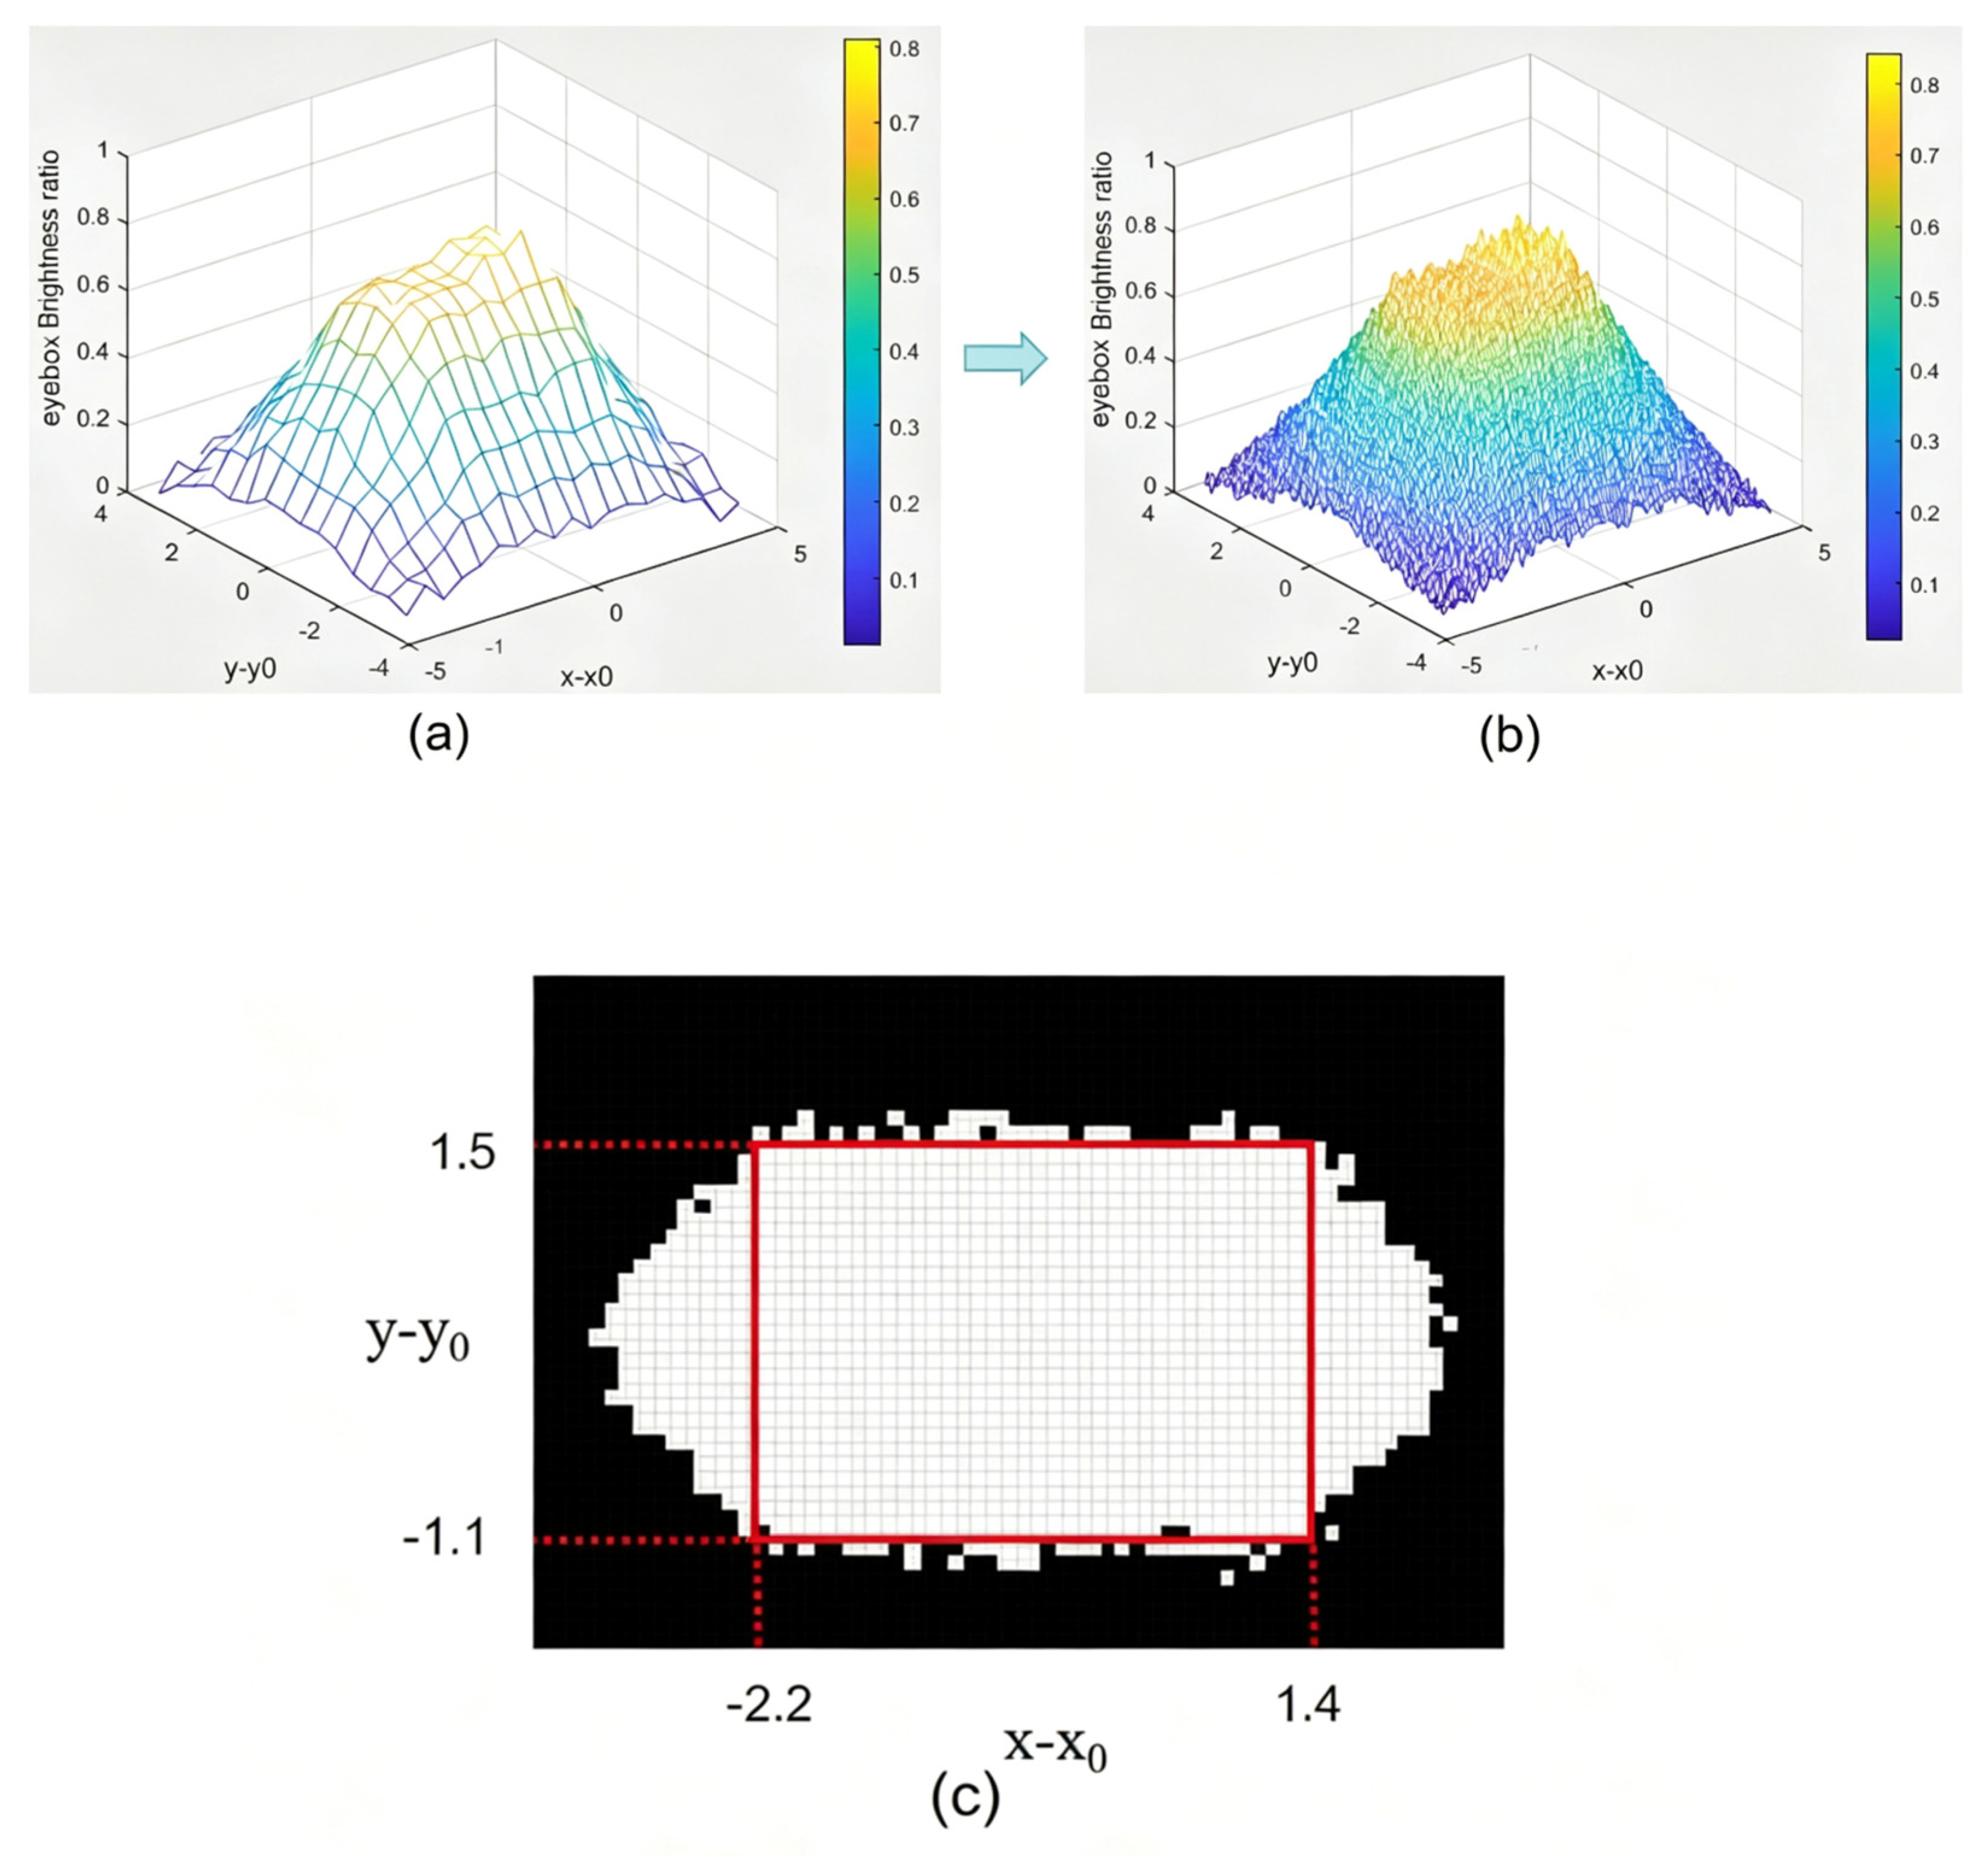
Figure 6 illustrates the spatial distribution of the eyebox luminance ratio at different eye positions. The largest inscribed rectangle in Figure 6c was defined as the effective eyebox region. The measured dimensions of this rectangle were 3.6   mm   ×   2.6   mm . Therefore, the eyebox size obtained at an exit pupil distance of 30 mm was determined to be 3.6   mm   ×   2.6   mm .
The measured eyebox dimensions at 30 mm EPD serve as the input for the proposed dimension-conversion model, enabling prediction of the eyebox size at the target EPD without performing an additional full-range measurement.
Using Equation (7), the corresponding eyebox dimensions at the target exit pupil distance of 16 mm can be calculated as
E h a i m = 3 . 6 + 2 ( 30   -   16 ) tan ( 24 ° 2 ) = 9 . 6   mm ; E v a i m = 2 . 6 + 2 ( 30   -   16 ) tan ( 18 ° 2 ) = 7 . 0   mm ;

4.3.3. Direct Measurement at the Target Exit Pupil Distance of 16 mm

To validate the accuracy of the proposed eyebox dimension-conversion model, a direct measurement was performed at the target exit pupil distance of 16 mm.
Following the same measurement procedure described for the 30 mm EPD condition, the z-axis position was adjusted to establish an exit pupil distance of 16 mm, and the corresponding eyebox dimensions were measured directly. The measurement results are presented in Figure 7.
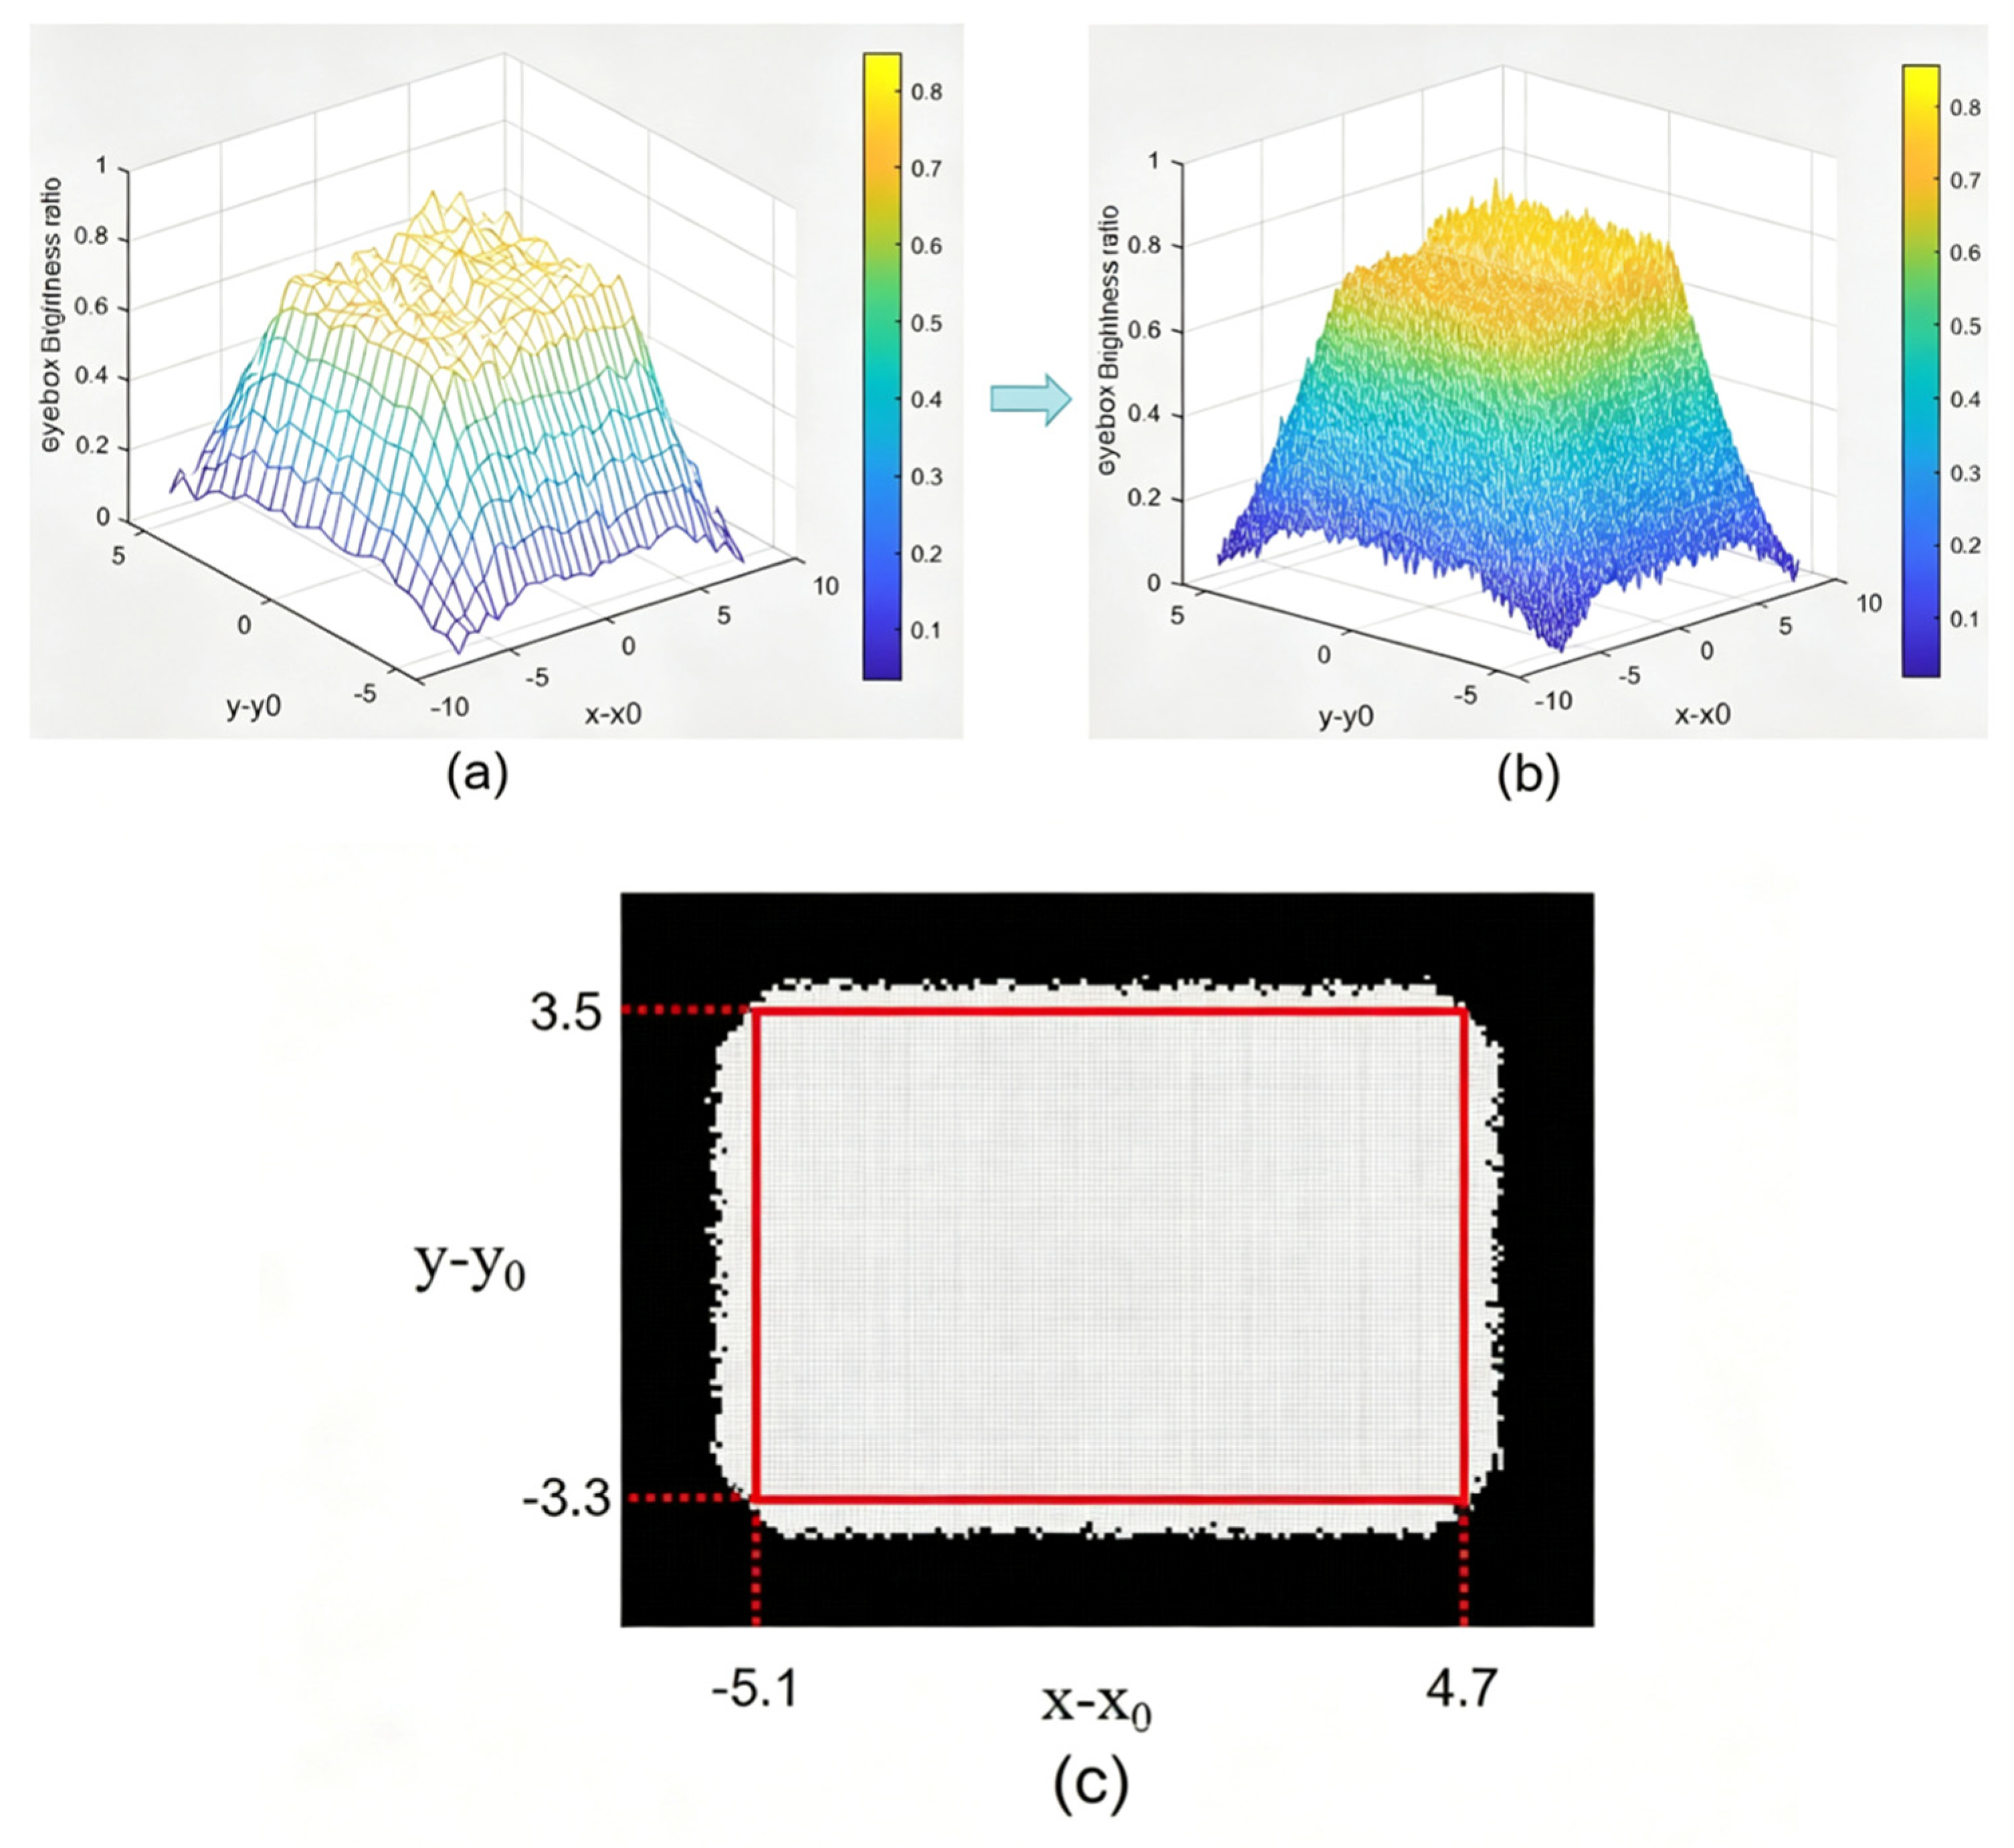
As shown in Figure 7c, the largest inscribed rectangle satisfying the luminance-ratio criterion was identified as the effective eyebox region. The dimensions of the extracted rectangle were measured to be 9.8 mm × 6.8 mm.
Therefore, the eyebox size obtained by direct measurement at the target exit pupil distance of 16 mm was determined to be 9.8 mm × 6.8 mm. These results serve as the reference values for evaluating the prediction accuracy of the proposed dimension-conversion model.

4.3.4. Measurement Results for Different Sampling Intervals and Exit Pupil Distances

To evaluate the effects of the sampling interval and exit pupil distance on measurement efficiency and accuracy, a series of experiments was conducted following the measurement procedure described in Section 4.3.2.
Measurements were performed under different combinations of sampling interval Δ x and EPD. For each measurement condition, the eyebox dimensions, number of sampling points, measurement time, and relative measurement error were recorded and analyzed.
The experimental results are summarized in Table 3.

4.4. Data Analysis

4.4.1. Analysis of Measurement Efficiency Improvement

The experimental results summarized in Table 3 demonstrate that the proposed optimization strategy can substantially improve eyebox measurement efficiency.
As the EPD increases, the eyebox search range decreases significantly, resulting in a corresponding reduction in the number of sampling points and total measurement time. Compared with the standard measurement condition at an EPD of 16 mm, increasing the EPD to 30 mm reduced the number of sampling points by 58.62%. When the EPD was further increased to 38 mm, the reduction reached 77.99%. These results are consistent with the inverse relationship between EPD and eyebox search range predicted by Equation (1).
Increasing the sampling interval also effectively reduced the sampling density and measurement time. When the sampling interval was increased from 0.5 mm to 1.0 mm, the number of sampling points decreased by 72.38%, demonstrating that sampling interval is another key factor affecting measurement efficiency.
The greatest improvement was achieved by simultaneously increasing both the EPD and the sampling interval. Under the condition of an EPD of 38 mm and a sampling interval of 1.0 mm, the number of sampling points was reduced by 94.07% compared with the standard measurement condition. Correspondingly, the measurement efficiency increased by more than one order of magnitude. These results confirm that optimizing the EPD and sampling interval simultaneously provides an effective approach for reducing measurement time while maintaining acceptable measurement accuracy.
These findings experimentally validate the proposed sampling-efficiency model and demonstrate that EPD optimization is an effective means of reducing measurement complexity.

4.4.2. Measurement Accuracy Validation

To evaluate the measurement accuracy of the proposed method, the eyebox dimensions obtained under the standard measurement condition (EPD = 16 mm, sampling interval = 0.5 mm) were used as the reference values.
The results summarized in Table 4 indicate that the measurement error increases with increasing EPD. When the sampling interval remained constant, increasing the EPD from 16 mm to 30 mm or 38 mm resulted in a maximum observed error of 4.41%. This trend is consistent with the error model developed in Section 3, which predicts that measurement uncertainty increases as the effective eyebox size decreases.
A similar trend was observed with respect to the sampling interval. For a fixed EPD, enlarging the sampling interval increased the discretization error introduced by spatial sampling. When the sampling interval was increased from 0.5 mm to 1.0 mm, the maximum relative measurement error reached 5.10%.
Although larger EPDs and sampling intervals lead to increased measurement errors, the error growth remained within an acceptable range for all tested conditions. By appropriately selecting the EPD and sampling interval, substantial reductions in measurement time can be achieved while maintaining a relative measurement error below 5.1%.
These results demonstrate that the proposed method effectively balances measurement efficiency and accuracy. The experimental observations are in good agreement with the theoretical predictions presented in Section 3, confirming the validity of the proposed sampling-efficiency and error-prediction models. Therefore, the proposed method provides a practical and efficient solution for rapid eyebox characterization in AR optical testing applications.
The agreement between the predicted and measured errors further validates the quantitative relationship established among EPD, sampling interval, and measurement accuracy.
A quantitative relationship model among eyebox sampling efficiency, exit pupil distance, and sampling error was established.

5. Discussion

The proposed eyebox sampling-efficiency optimization and error-modeling method is based on geometric-optics principles and does not rely on proprietary parameters of a specific AR display system. Consequently, the method exhibits good generality and can be directly applied to mainstream waveguide-based AR displays. With minor parameter adjustments, it can also be extended to non-waveguide architectures, such as prism-based and freeform-optics systems, thereby providing a unified engineering framework for eyebox characterization across different AR display configurations.

5.1. Validation of the Error Model

As shown in Figure 2, both the experimental measurements and theoretical predictions indicate that the measurement error increases approximately linearly with the sampling interval Δ x . This trend is consistent with the analytical error model developed in Section 3.
The close agreement between the experimental results and theoretical predictions demonstrates that the proposed model can effectively characterize the sampling-induced error in eyebox measurements. Therefore, the model can serve as a practical tool for predicting measurement uncertainty under different sampling conditions.

5.2. Effect of Exit Pupil Distance

The experimental results further show that, for a fixed sampling interval, increasing the exit pupil distance (EPD) effectively suppresses error growth.
This behavior can be explained by the geometric scaling characteristics of the eyebox. According to Equation (1), increasing the EPD reduces the eyebox search range. As a result, the same sampling interval corresponds to a finer relative sampling resolution within the effective measurement region. Consequently, the influence of spatial discretization errors is reduced.
These findings suggest that the EPD can be treated as an additional optimization parameter for balancing measurement efficiency and measurement accuracy.

5.3. Trade-Off Between Measurement Efficiency and Accuracy

Measurement efficiency is directly related to the number of sampling points. Increasing the sampling interval reduces the required sampling density and measurement time, thereby improving efficiency. However, larger sampling intervals also increase spatial quantization errors and reduce measurement accuracy.
The proposed error model establishes a quantitative relationship between sampling interval and measurement error, providing a practical framework for determining the maximum allowable sampling interval under a specified error tolerance. This capability enables systematic optimization of measurement parameters rather than relying solely on empirical experience.

5.4. Comparison with Conventional Methods

Compared with conventional dense-grid scanning methods, the proposed approach offers several advantages.
First, the required sampling density is significantly reduced through optimization of the exit pupil distance. Second, the proposed method provides predictable error characteristics through the established quantitative error model. Third, the reduction in sampling points leads directly to shorter measurement times and improved operational efficiency.
Unlike empirical measurement approaches, which typically lack quantitative uncertainty estimation, the proposed framework establishes an explicit relationship among sampling interval, exit pupil distance, and measurement error, enabling systematic optimization of the measurement process.

5.5. Limitations

It should be noted that the current model is derived under a simplified geometric-optics framework. In practical AR systems, additional error sources may arise from optical distortion, assembly tolerances, luminance nonuniformity, detector noise, and environmental factors.
For simplicity, the proposed model considers only the sampling-induced component of the total measurement error. The total measurement error can therefore be expressed as
ϵ t o t a l = ϵ s a m p l i n g + ϵ s y s t e m
where ϵ s a m p l i n g represents the sampling-induced error predicted by the proposed model and ϵ s y s t e m represents additional system-level uncertainties.
Future work will focus on incorporating these factors into a more comprehensive error framework and extending the proposed method to a broader range of near-eye display architectures.
Although the proposed method is theoretically applicable to various near-eye display architectures because it is based on general geometric-optics relationships, the experimental validation in this study is limited to a waveguide-based AR headset. Extension to other architectures, such as prism- and free-form-optics-based systems, requires appropriate adjustment of the corresponding optical and geometric parameters.

6. Conclusions

In this work, a rapid measurement method for eyebox characterization in near-eye display systems was proposed and systematically investigated. Unlike conventional approaches that rely on dense spatial sampling or full-field scanning, the proposed method reformulates eyebox measurement as a sampling-optimization problem, in which measurement efficiency and accuracy can be quantitatively balanced through the adjustment of sampling interval and exit pupil distance (EPD).
A geometric model describing the relationship between EPD and eyebox search range was first established. Based on this model, eyebox-dimension conversion formulas applicable to different EPD conditions were derived, enabling measurements performed at nonstandard EPDs to be converted to the target EPD specified by the device manufacturer. Furthermore, a quantitative relationship model among sampling efficiency, EPD, and measurement error was developed. The derived error model indicates that the measurement error is proportional to the sampling interval and inversely proportional to the effective eyebox size, thereby providing a theoretical basis for parameter optimization.
Based on the proposed model, a predictive optimization framework was established to determine appropriate measurement parameters under specified error-tolerance requirements. Both simulations and experimental results demonstrated consistent relationships among sampling interval, EPD, and measurement error, validating the effectiveness of the proposed framework.
Experimental validation using a commercial AR headset and a Radiant Vision Systems I29 photometric measurement system showed that increasing the EPD from the standard 16 mm to 38 mm reduced the number of sampling points by 77.99%. By jointly optimizing the EPD and sampling interval, the number of sampling points was reduced by up to 94.07%, while the relative measurement error remained below 5.1%. The calculated eyebox dimensions showed good agreement with those obtained using the standard measurement method.
Compared with conventional eyebox measurement approaches, the proposed method offers three main advantages: (1) reduced sampling density; (2) predictable and controllable measurement error; and (3) significantly improved measurement efficiency. These characteristics make the method particularly suitable for rapid characterization and calibration of AR near-eye display systems. While numerous prior studies [13,14,15] have proposed dense sampling frameworks and intricate light-field reconstruction algorithms, the approach developed in this work targets efficiency optimization from an engineering deployment perspective, establishing a novel error-controllable framework to accelerate quantitative eyebox characterization for near-eye display systems.
It should be noted that the current model is developed under a simplified geometric-optics framework. Future work will focus on incorporating additional system-level factors, including optical distortion, luminance nonuniformity, assembly tolerances, and detector noise, to further improve the accuracy and applicability of the proposed method.

Author Contributions

Methodology was designed for the eyebox detection system, including the establishment of test procedures, error control schemes, and algorithm frameworks: Y.L. Validation, formal analysis, data curation, and manuscript writing were implemented to ensure the accuracy and reliability of experimental results and the quality of the article: H.X. Investigation and experimental resources were provided to support the smooth progress of the whole research: C.H. Conceptualization, project supervision, and theoretical guidance were offered throughout the entire study: Y.H. All authors have read and agreed to the published version of the manuscript.

Funding

This research was funded by the National Natural Science Foundation of China, grant number 62275078. The APC was funded by Shenzhen Yitoa Aurora Micro Technology Co., Ltd.

Informed Consent Statement

Not applicable.

Data Availability Statement

The original contributions presented in this study are included in the article. Further inquiries can be directed to the corresponding author.

Acknowledgments

The authors also wish to express their sincere gratitude to Yueqiang Hu from Hunan University for his valuable guidance and constructive suggestions throughout this work. The authors also acknowledge the financial support for this work from Shenzhen Yitoa Aurora Micro Technology Co., Ltd.

Conflicts of Interest

The authors has received financial support from Shenzhen Yitoa Aurora Micro Technology Co., Ltd. The funder had no role in the design of the study; in the collection, analyses, or interpretation of data; in the writing of the manuscript; or in the decision to publish the results. Authors Yuqian Li and Chunqiang Huang were employed by the Shenzhen Yitoa Aurora Micro Technology Co., Ltd. The remaining authors declare that the research was conducted in the absence of any commercial or financial relationships that could be construed as a potential conflict of interest.

Abbreviations

The following abbreviations are used in this manuscript:
ARAugmented Reality
IECInternational Electrotechnical Commission
EREye Relief
EPDExit Pupil Position
FOVField of View
LMDlight measurement device
ISOInternational Organization for Standardization
HMDHead-Mounted Display
DUTDevice Under Test

Appendix A

Search Ranges and Sampling Numbers under Different EPD.
Assuming L = 38   mm , S X x 0 5.6   , x 0 + 5.6 mm, S y y 0 4.2   , y 0 + 4.2 mm, sampling count: 13 × 16 = 208 ;
Assuming L = 30   mm , S X x 0 5.6   , x 0 + 5.6 mm, S y y 0 4.2   , y 0 + 4.2 mm, sampling count: 17 × 23 = 391 ;
Assuming L = 30   mm , S X x 0 8.6   , x 0 + 8.6 mm, S y y 0 6.5   , y 0 + 6.5 mm, sampling count: 27 × 35 = 945 .

References

  1. Rolland, J.P.; Goodsell, J. Waveguide-Based Augmented Reality Displays: A Highlight. Light Sci. Appl. 2024, 13, 22. [Google Scholar] [CrossRef] [Scilit]
  2. Ding, Y.; Yang, Q.; Li, Y.; Yang, Z.; Wang, Z.; Liang, H.; Wu, S.-T. Waveguide-Based Augmented Reality Displays: Perspectives and Challenges. eLight 2023, 3, 24. [Google Scholar] [CrossRef] [Scilit]
  3. Jang, C.; Bang, K.; Chae, M.; Lee, B.; Lanman, D. Waveguide Holography for 3D Augmented Reality Glasses. Nat. Commun. 2024, 15, 66. [Google Scholar] [CrossRef] [Scilit]
  4. Gopakumar, M.; Lee, G.-Y.; Choi, S.; Chao, B.; Peng, Y.; Kim, J.; Wetzstein, G. Full-Colour 3D Holographic Augmented-Reality Displays with Metasurface Waveguides. Nature 2024, 629, 791–797. [Google Scholar] [CrossRef] [Scilit]
  5. Cui, J.; Zhang, Y. Exit Pupil Expansion Based on Polarization Volume Grating. Crystals 2021, 11, 333. [Google Scholar] [CrossRef] [Scilit]
  6. Ni, D.; Cheng, D.; Wang, Y.; Yang, T.; Wang, X.; Chi, C.; Wang, Y. Design and Fabrication Method of Holographic Waveguide Near-Eye Display with 2D Eye Box Expansion. Opt. Express 2023, 31, 11019–11040. [Google Scholar] [CrossRef] [Scilit]
  7. IEC 63145-20-10:2019; Eyewear Display—Part 20-10: Fundamental Measurement Methods—Optical Properties. International Electrotechnical Commission (IEC): Geneva, Switzerland, 2019.
  8. ISO 9241-305:2008; Ergonomics of Human-System Interaction—Part 305: Optical Laboratory Test Methods for Electronic Visual Displays. International Organization for Standardization (ISO): Geneva, Switzerland, 2008.
  9. Hong, H. Fast Measurement of Eyebox and Field of View (FOV) of Virtual and Augmented Reality Devices Using the Ray Trajectories Extending from Positions on Virtual Image. Curr. Opt. Photonics 2020, 4, 336–344. [Google Scholar] [CrossRef]
  10. Hong, H. Novel Method for the Fast Measurement of the Three-Dimensional Range of the Eyebox of a VR Device. J. Soc. Inf. Disp. 2020, 28, 752–758. [Google Scholar] [CrossRef] [Scilit]
  11. Yeom, J.; Lim, S.; Yang, Y.; Son, Y.; Choi, K.-S. Efficient Evaluation of a Three-Dimensional Eye-Box in a Near-Eye Display Using Light-Field Acquisition of Luminance Distribution. Opt. Express 2023, 31, 17304–17320. [Google Scholar] [CrossRef] [Scilit]
  12. Kerst, T.; Bitarafan, M.H.; Jokinen, L.; Alasaarela, I.; Tillanen, S.; Zautasvili, D.; Pachhandara, N. Rapid Eyebox Measurement for Augmented Reality Waveguides. Appl. Opt. 2023, 62, 2998–3002. [Google Scholar] [CrossRef] [Scilit]
  13. Penczek, J.; Austin, R.L.; Lipscomb, J.D.; Akcakir, O. 82-2: Rapid Eyebox Measurements for Wide Field of View Near-Eye Displays. SID Symp. Dig. Tech. Pap. 2024, 55, 1143–1146. [Google Scholar] [CrossRef] [Scilit]
  14. Li, X.; Chai, C.; Li, Y.; Zhao, L. 45-3: Eye-Box Measurement for Augmented-Reality Waveguides with Pupil Expansion. SID Symp. Dig. Tech. Pap. 2025, 56, 591–594. [Google Scholar] [CrossRef] [Scilit]
  15. Solomashenko, A.; Lushnikov, D.; Shishova, M.; Afanaseva, O.; Zlokazov, E. Image Quality for Near-Eye Display Based on Holographic Waveguides. Appl. Sci. 2022, 12, 11136. [Google Scholar] [CrossRef] [Scilit]
  16. Kalinina, A.; Putilin, A.; Kopenkin, S. Eyebox Enlargement in Holographic AR Glasses. Appl. Opt. 2023, 62, D163–D170. [Google Scholar] [CrossRef] [Scilit]
  17. Guo, X.; Song, Q.; Ma, S.; Wang, J.; Ma, G.; Duan, H. Design and Fabrication of Polygonal Grating Waveguide Display with Full-Color 2D Eye-Box Expansion. Opt. Lasers Eng. 2024, 180, 108311. [Google Scholar] [CrossRef] [Scilit]
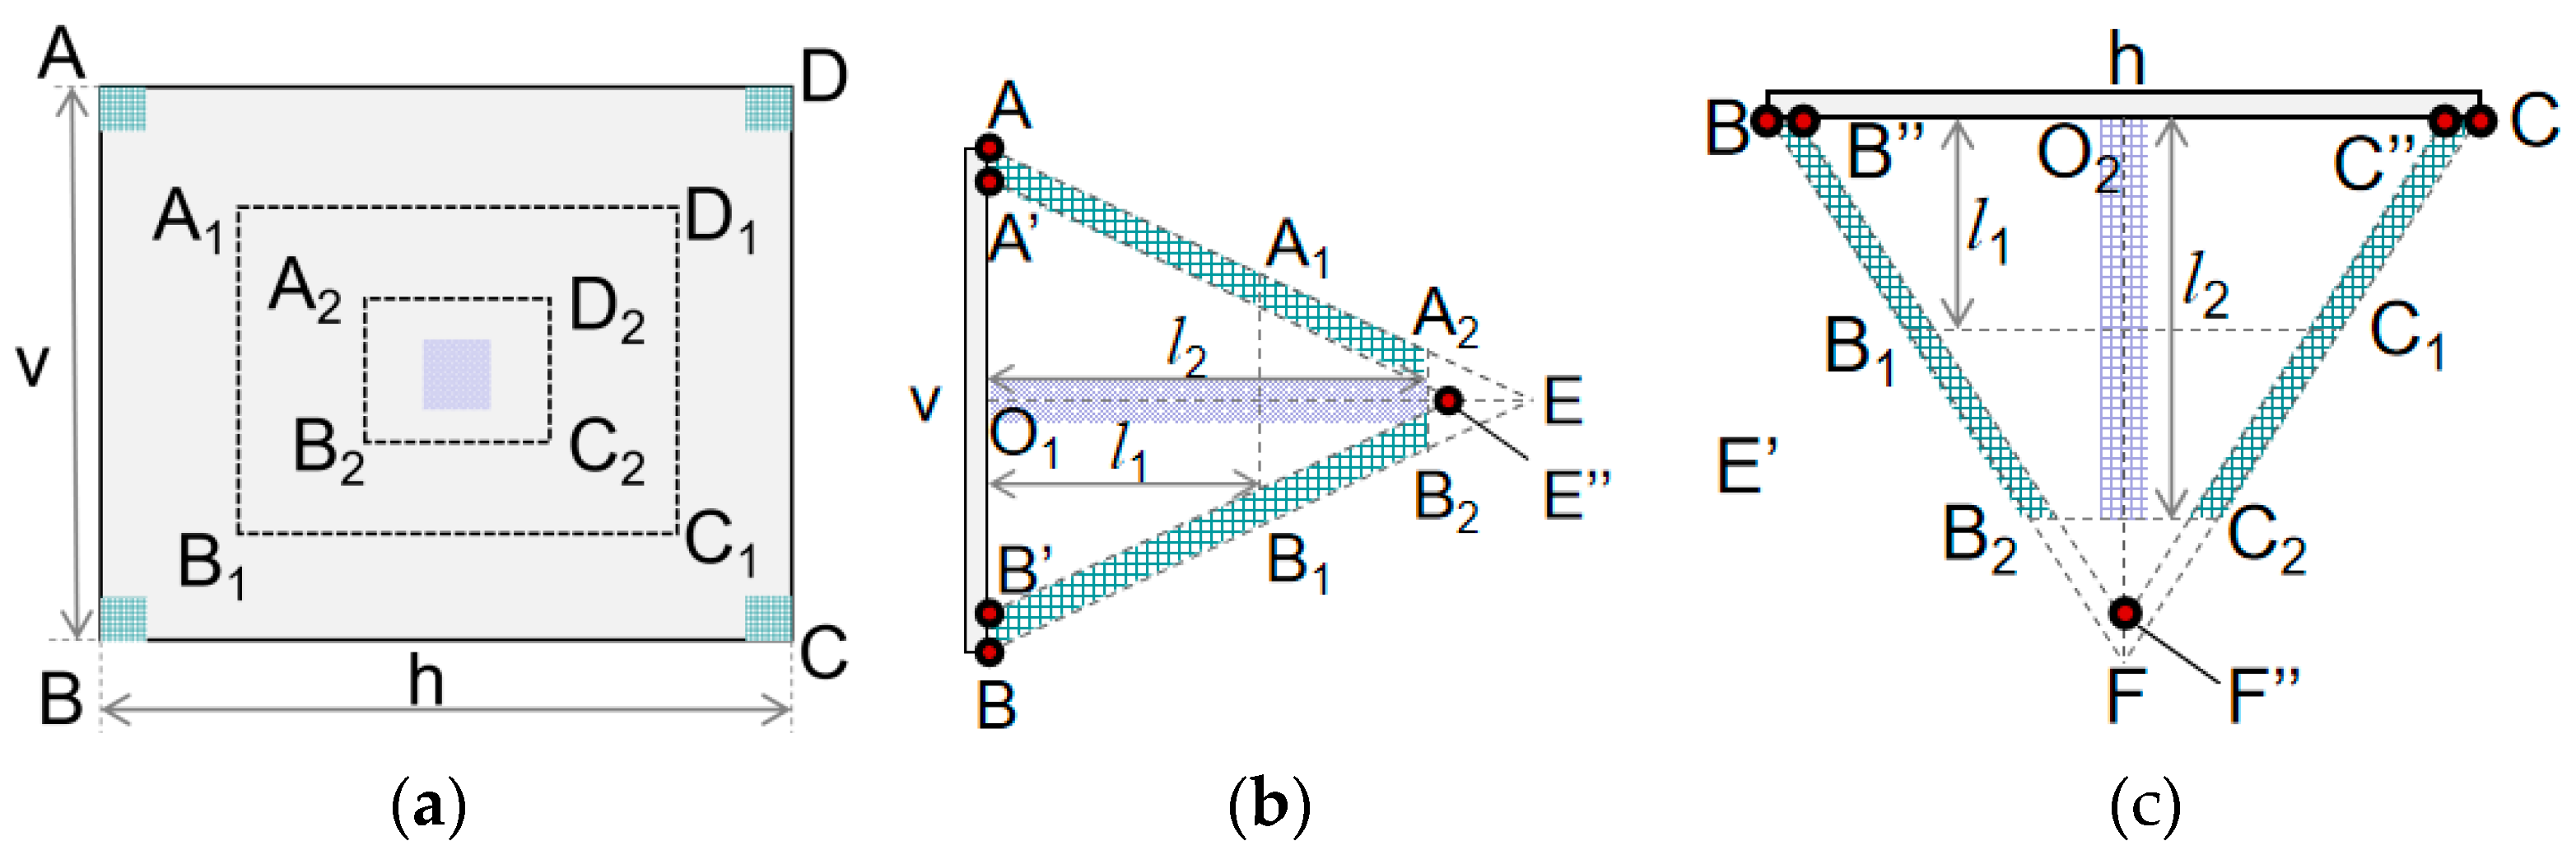
Figure 1. Geometric relationship between EPD, eyebox dimensions, and field of view (FOV): (a) front-view representation of the eyebox at different EPDs; (b) side-view representation of the eyebox at different EPDs; and (c) top-view representation of the eyebox at different EPDs.
Photonics 13 00883 g001
Figure 2. Relationship among sampling interval, EPD, and relative error.
Photonics 13 00883 g002
Figure 3. Experimental setup and coordinate system. (a) Schematic diagram of the eyebox measurement platform; (b) Definition of the coordinate system used in the measurements.
Photonics 13 00883 g003
Figure 4. Determination of the eyebox center position. (a) Four-corner symmetry metric as a function of x - y position at the limiting exit pupil distance; (b) Grayscale image corresponding to the optimum center position.
Photonics 13 00883 g004
Figure 5. Measurement results at an exit pupil distance of 30 mm. (a) Grayscale image acquired at the eyebox center position; (b) Grayscale images corresponding to the four boundary positions of the search range.
Photonics 13 00883 g005
Figure 6. Determination of the effective eyebox at an exit pupil distance of 30 mm. (a) Measured luminance-ratio distribution obtained with a sampling interval of 0.5 mm; (b) Two-dimensional interpolation result derived from (a) with an interpolation interval of 0.1 mm; (c) Binary eyebox map obtained using a luminance-ratio threshold of 0.5, where the largest inscribed rectangle defines the effective eyebox region.
Photonics 13 00883 g006
Figure 7. Determination of the effective eyebox at an exit pupil distance of 16 mm. (a) Measured eyebox luminance-ratio distribution obtained with a sampling interval of 0.5 mm; (b) Two-dimensional interpolation result derived from (a) with an interpolation interval of 0.1 mm; (c) Binary eyebox map obtained using a luminance-ratio threshold of 0.5, where the largest inscribed rectangle defines the effective eyebox region.
Photonics 13 00883 g007
Table 1. Key Optical Specifications of the Device Under Test (DUT).
ParameterSpecification
Display TechnologyMicro-LED
Horizontal Field of View24°
Vertical Field of View18°
Standard Exit Pupil Distance16 mm
Waveguide Coupling Area Dimensions22 × 16 mm
Center eyebox Center Field Brightness≤6000 nits (adjustable)
Table 2. Key Specifications of the Radiant Vision Systems I29 Imaging Colorimeter.
ParameterSpecification
Measurement Type2D imaging luminance meter
Luminance Measurement Range10−5t–1010 nits
Luminance Measurement Accuracy±3%
Mobile Platform Accuracy±0.02 mm
Table 3. Measurement Results for Different Sampling Intervals and EPD.
EPDSampling IntervalNumber of SamplesEyebox Size at 16 mm EPD
16 mm0.5 mm9459.8 × 6.8 mm
30 mm0.5 mm3919.6 × 7.0 mm
1 mm1089.4 × 6.5 mm
38 mm0.5 mm2089.5 × 7.1 mm
1 mm569.3 × 6.6 mm
Note: Eyebox Size at 16 mm EPD denotes the eyebox dimensions converted to the target exit pupil distance of 16 mm using Equation (7).
Table 4. Relative measurement errors (compared with the reference result at EPD = 16 mm, sampling interval = 0.5 mm).
EPDSampling IntervalMeasurement Error
16 mm0.5 mm---
30 mm0.5 mm2.04%, 2.94%
1 mm4.08%, 4.41%
38 mm0.5 mm3.06%, 4.41%
1 mm5.1%, 4.94%
Disclaimer/Publisher’s Note: The statements, opinions and data contained in all publications are solely those of the individual author(s) and contributor(s) and not of MDPI and/or the editor(s). MDPI and/or the editor(s) disclaim responsibility for any injury to people or property resulting from any ideas, methods, instructions or products referred to in the content.