2. Analysis of Near-Monochromatic Light Illumination Imaging
In the field of optical imaging, the improvement of color imaging quality is closely related to lens design, the CCD imaging mechanism, and the characteristics of illumination light sources. On the one hand, color optical lenses are usually designed based on several discrete monochromatic spectral lines rather than continuous wide-band visible light, with the core goal of correcting chromatic aberration of the optical system. In engineering, several representative characteristic spectral lines (such as the commonly used combination of F light 486.1 nm, C light 656.3 nm, and D light 587.6 nm in the industry) are often selected as the design benchmark. Chromatic aberration correction is achieved by optimizing parameters such as lens material and curvature, ensuring that the light of the optical system is accurately focused at the benchmark wavelength, thus providing a basic guarantee for high-quality color imaging.
On the other hand, color CCD sensors accomplish imaging through a complete workflow involving spectral decomposition, photoelectric conversion, and signal reconstruction. The color filter array integrated on the sensor surface—represented by the conventional Bayer filter array—spatially separates the incident broadband white light into distinct wavelength bands. Each pixel channel converts the optical signal within its corresponding band into an electrical signal, which is further processed via interpolation, calibration, and fusion to reconstruct a color image consistent with human visual perception.
Notably, under illumination from continuous-spectrum light sources, inter-channel crosstalk readily occurs among different wavelengths owing to the relatively broad and overlapping spectral response of the CCD color filter array. This inevitably degrades the imaging resolution of the RGB channels. In contrast, illumination using narrow-spectrum light sources such as near-monochromatic LEDs can effectively suppress inter-band crosstalk and avoid problems such as strong single-wavelength absorption exhibited by certain materials, thereby significantly improving overall imaging quality.
Near-monochromatic LEDs exhibit prominent advantages including narrow spectral bandwidth and stable central emission wavelength. Theoretically, when illuminated by a near-monochromatic LED whose central wavelength precisely matches the design reference wavelength of the optical lens, the system can fully exploit the chromatic aberration correction capability and optimal focusing performance of the optical system, while achieving high compatibility with the spectral imaging mechanism of the CCD. This approach effectively alleviates imaging blur and channel crosstalk induced by deviations from the reference wavelength, thereby significantly improving the independent resolution of each RGB channel and ensuring both the sharpness and color reproduction accuracy of color imaging.
3. Experimental Verification
3.1. Experimental System
To verify the advantages of near-monochromatic light illumination in color imaging, this paper performs comparative experiments using a commercial CW-VM0850-3MP (Shenzhen Chuangwei Video Co., Ltd., Shenzhen, China) zoom lens. A YIXIAN-15W-950 D50 (Dongguan Chuanggu Lighting Technology Co., Ltd., Dongguan, China) continuous-spectrum light source is adopted as the reference light source for comparison.
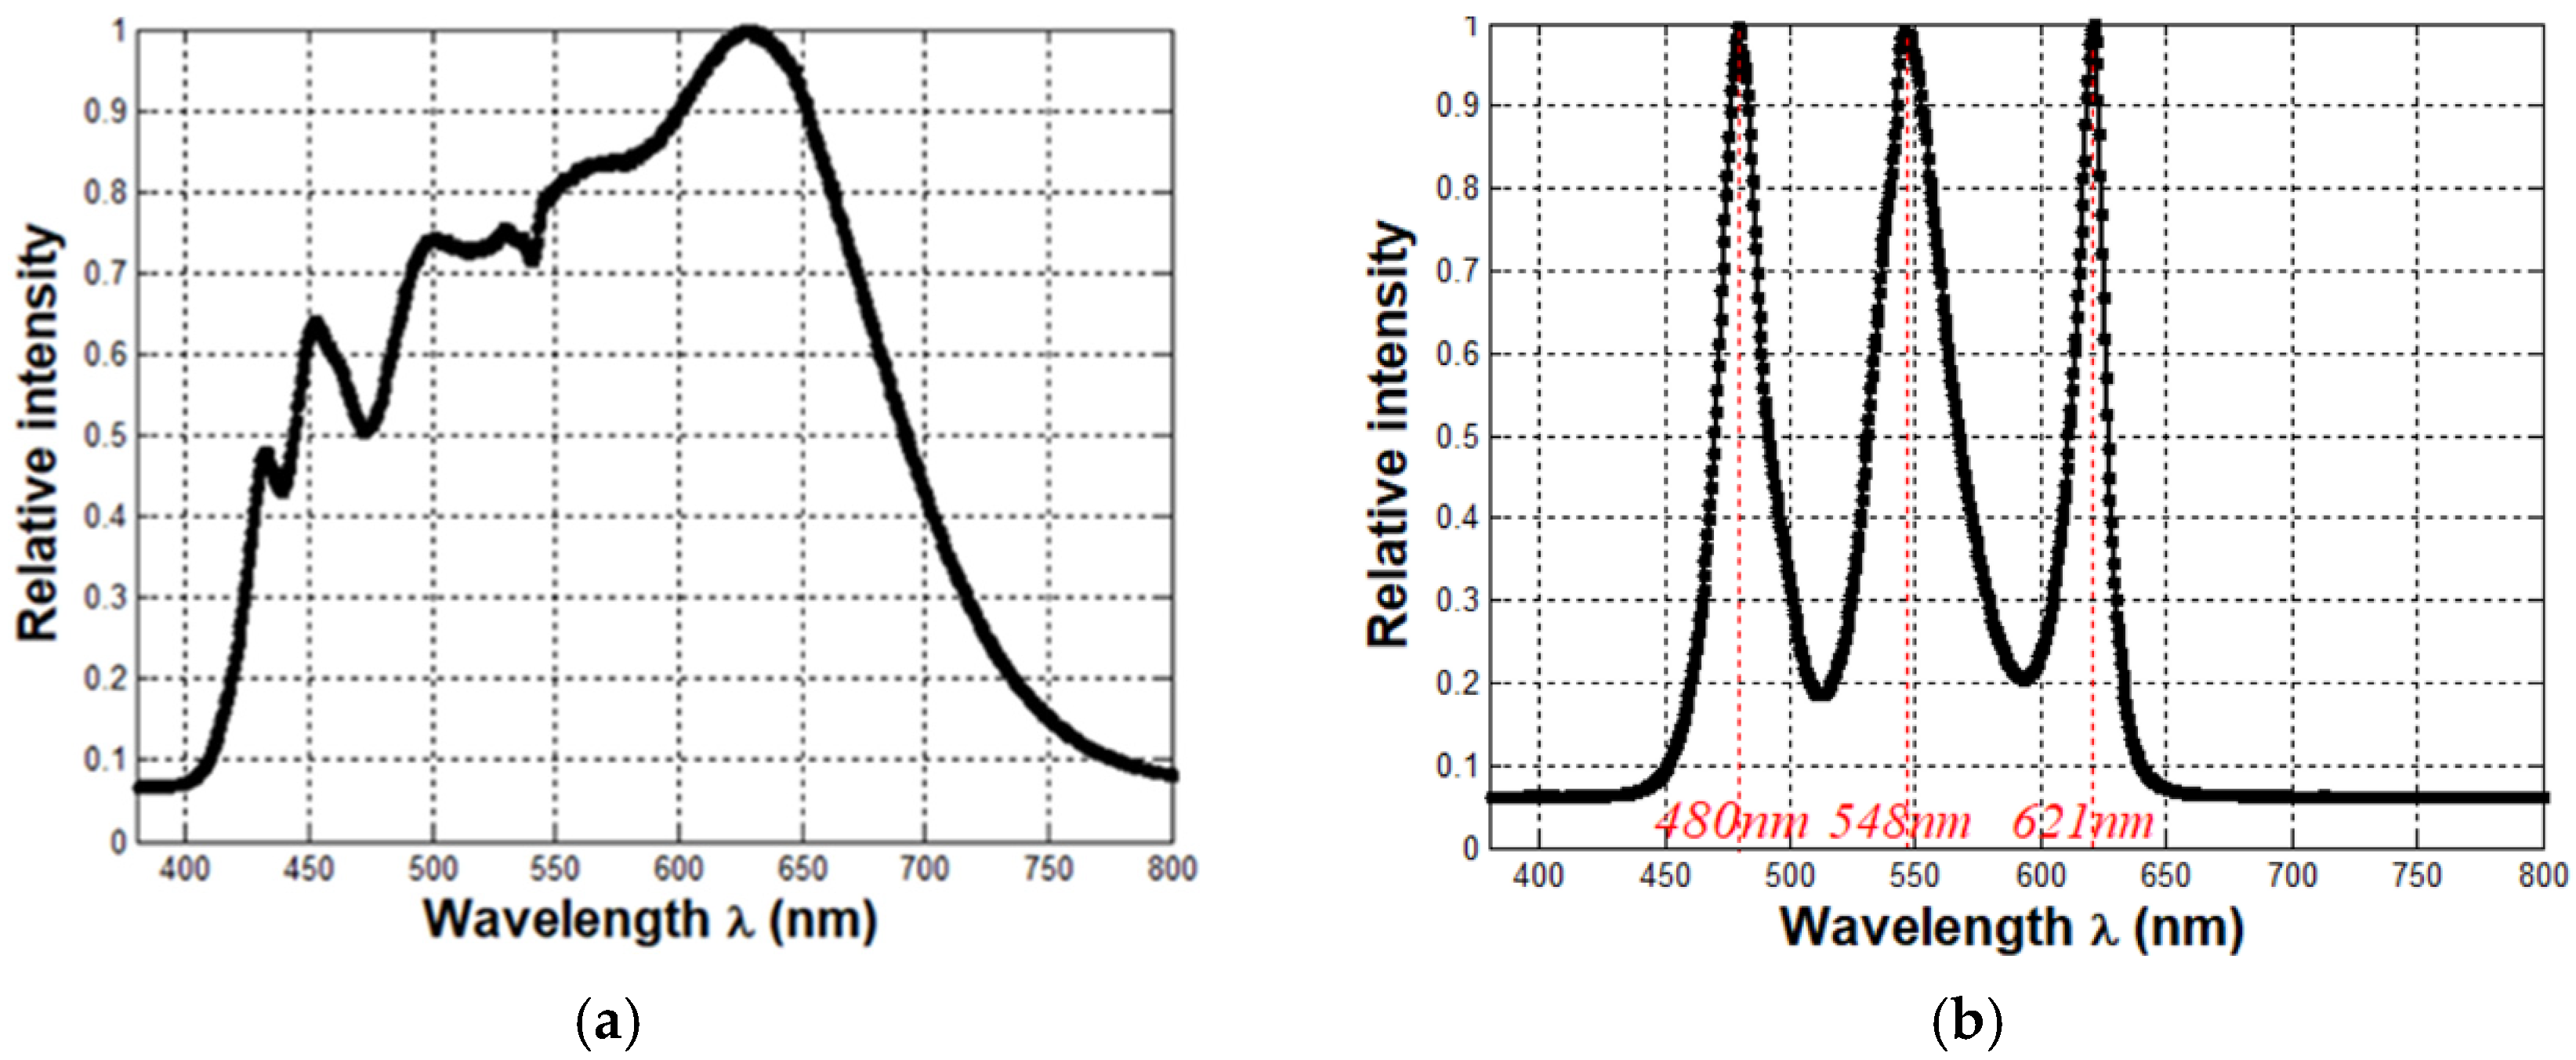
Since the exact design reference spectrum of the CW-VM0850-3MP zoom lens could not be obtained from the manufacturer, this study uses LED emission spectra close to the lens design wavelengths, based on the fact that optimal imaging performance is achieved near the design wavelengths. Through multiple groups of imaging comparison experiments using LEDs with different peak wavelengths, three sets of narrow-band LEDs were finally selected as near-monochromatic illumination sources. Their central wavelengths are approximately 480 nm, 548 nm, and 621 nm, with typical full widths at half-maximum (FWHM) within 470–491 nm, 531–567 nm, and 611–627 nm, respectively.
Figure 1 shows the spectral distribution of the D50 continuous-spectrum light source and the near-monochromatic LEDs, measured by the Fuxiang PG2000-EVO high-sensitivity spectrometer (Ideaoptics Co., Ltd., Shanghai, China) [
18]. As observed in
Figure 1, the D50 light source exhibits a continuous spectrum covering the visible band from 400 to 800 nm, which can faithfully characterize the imaging performance under broadband continuous illumination. In contrast, the near-monochromatic LEDs feature an extremely narrow spectral bandwidth and high central wavelength concentration, which effectively suppress spectral crosstalk among different wavelength bands in the CCD channels.
In the experimental setup, an MV-GE500C industrial CCD camera (MindVision, Shenzhen MindVision Technology Co., Ltd., Shenzhen, China) is employed as the imaging device, and the ISO 12233 eSFR Resolution Test Chart (IRTC) is adopted for accurate quantitative evaluation of imaging quality.
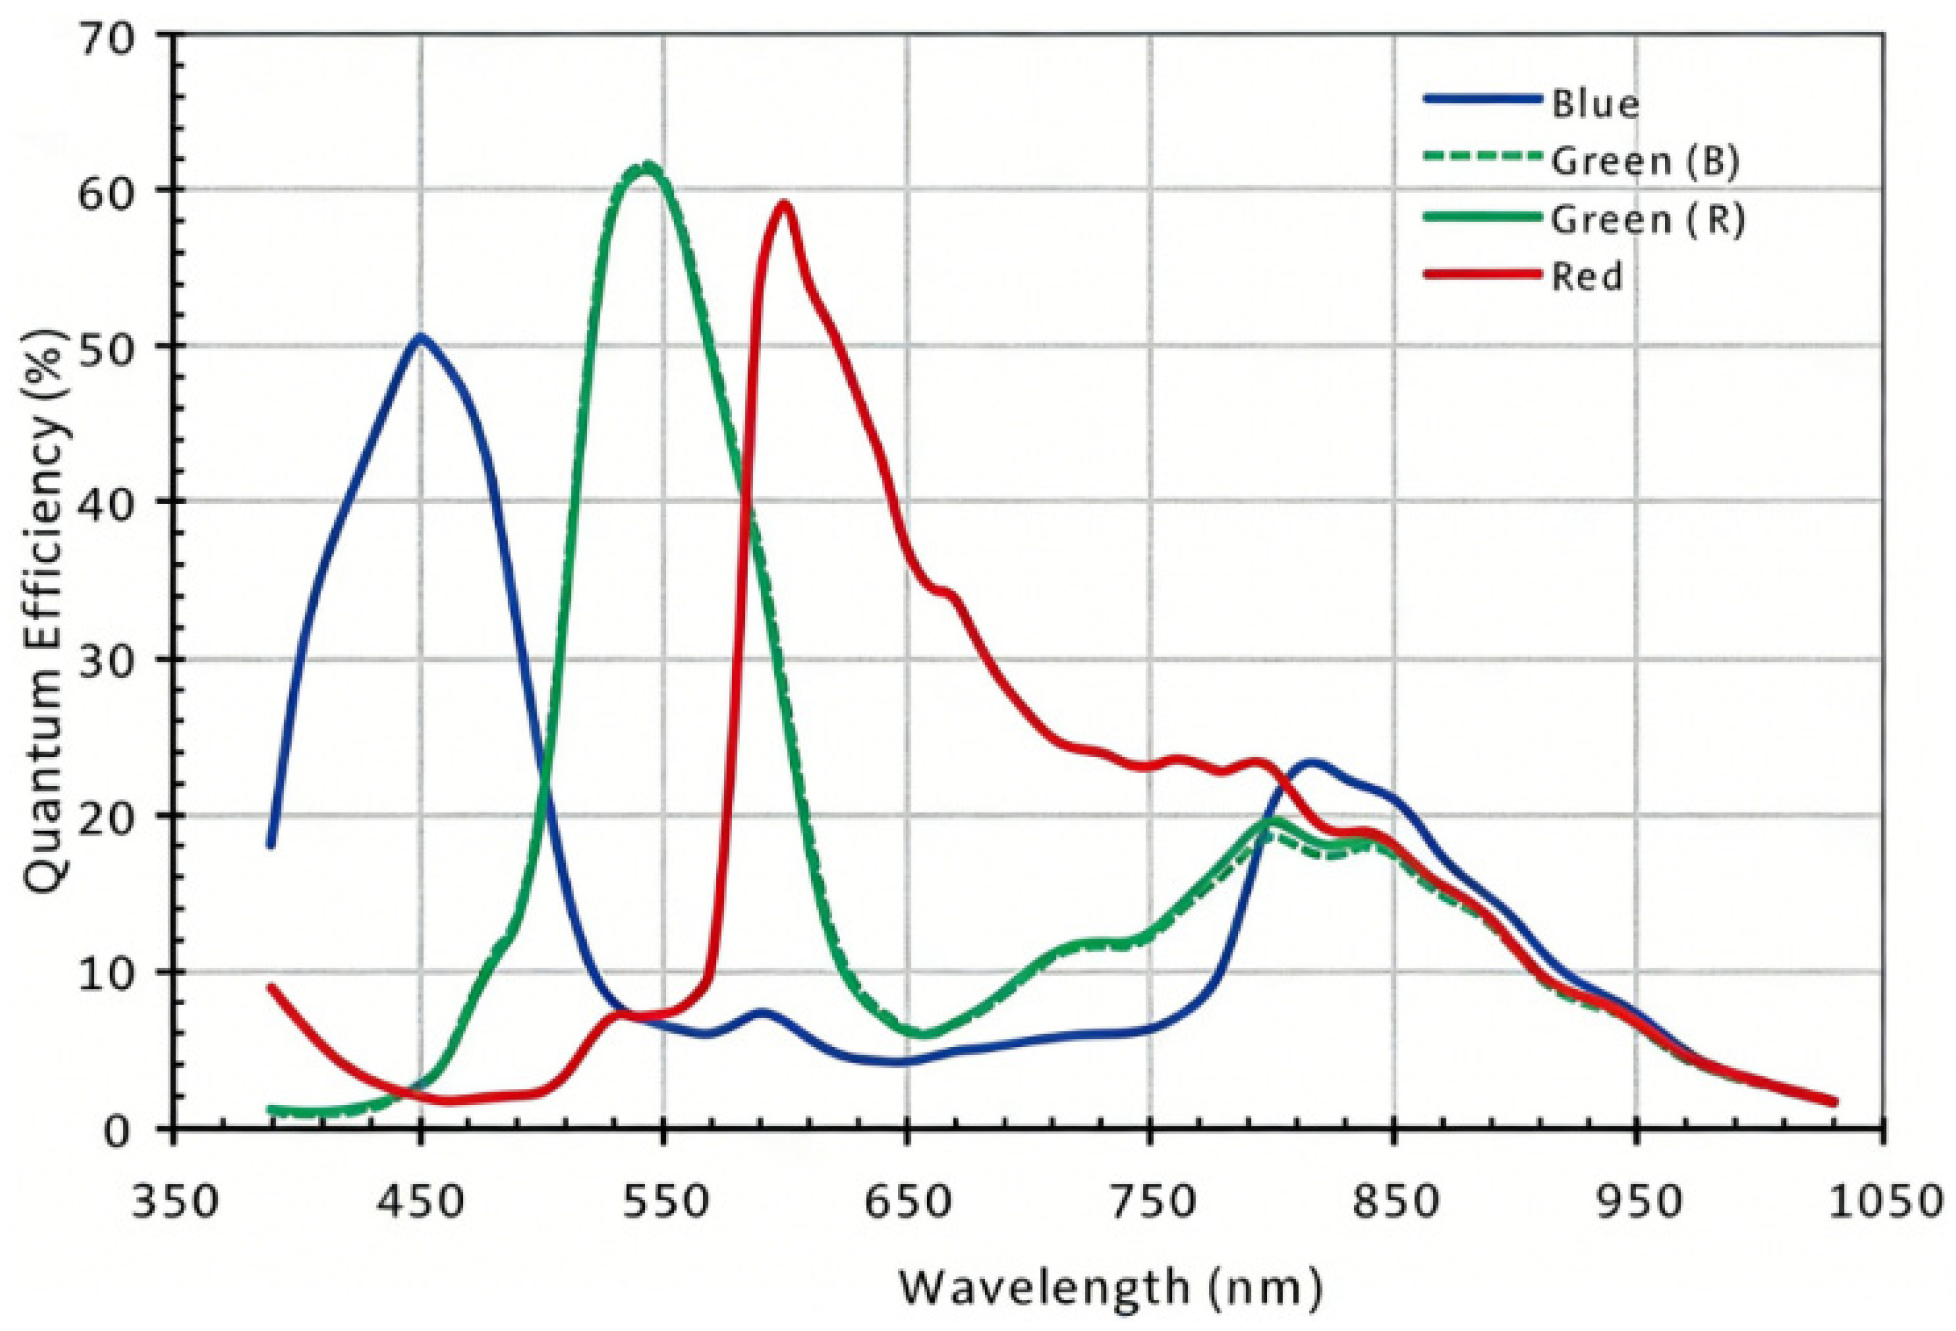
As shown in
Figure 2, the built-in color filters of the CCD cannot fully isolate different wavelength bands. Obvious spectral response overlap exists between the red and green channels, as well as between the green and blue channels, which introduces severe inter-channel crosstalk. Since the green spectral band is located between the red and blue bands, the green channel is particularly susceptible to crosstalk from both red and blue light.
3.2. Experimental Setup and MTF Evaluation Mechanism
Prior to image collection, the camera is aligned perpendicular to the target plane, and the light source is arranged with an approximate 45° incident angle to the surface to suppress imaging glare. The lens focus is then optimized based on the sharpness of the green channel, enabling clear presentation of the IRTC. The flowchart of the experimental test process is presented in
Figure 3.
To strictly compare the impact of different illumination sources on imaging quality, the experiment strictly unified and fixed the imaging parameters of the MV-GE500C CCD. All automatic optimization algorithms, including auto-exposure, auto-white-balance, auto-focus, auto-noise-reduction, auto-sharpening, auto-contrast, auto-brightness, auto-HDR, auto-chroma-correction, and auto-saturation-adjustment, were turned off. In the experiment, all parameters such as ISO gain, lens aperture, focus position, white balance R/G/B gain ratio (1:1:1), sharpening strength, noise reduction strength, gamma value, brightness, contrast, and saturation were fixed. To balance the light intensity differences among various light sources, the exposure time was appropriately adjusted based only on the exposure intensity at the reference position, while all other imaging parameters were kept constant.
The uniformity of object-plane illumination significantly affects the measurement accuracy of resolution. Nevertheless, illumination uniformity, light source wavelength and overall light intensity exert distinct influences on resolution characterization. Taking the modulation transfer function (MTF) of wedge stripes as the research object, the rigorous physical definition is expressed as:
where
is the intrinsic modulation degree of wedge patterns on the test chart, and
for standard targets;
denotes the Michelson contrast of the captured fringe image:
in which
and
represent the imaging intensity or pixel signal of bright and dark fringe regions, respectively.
When the illumination intensity changes, the overall light intensity is scaled by a factor of . Accordingly, the signal values of both bright and dark regions are synchronously adjusted to and , respectively. By substituting the scaled signals into the contrast calculation formula, it can be concluded that the overall proportional scaling of illumination intensity theoretically exerts no effect on the MTF value.
Inhomogeneous object-plane illumination leads to spatially inconsistent signal attenuation, which can be equivalent to introducing a modulation coefficient
for dark-region signals. Specifically,
corresponds to uniform illumination;
means the dark-region signal decays under uneven illumination, while
indicates an enhanced dark-region response. The image contrast under non-uniform illumination is rewritten as:
Since the overall scaling of light intensity does not affect the measured resolution value, different scaling factors
can be configured to keep
as a constant
under various illumination levels. On this premise, variations in light source wavelength and spectral distribution directly modify the photoelectric response of dark regions, transforming the original dark-field signal
into
. An optimized illumination scheme for high-precision detail discrimination yields a reduced
, whereas inferior lighting conditions produce an elevated
. Combined with the illumination non-uniformity coefficient
, the apparent
under actual non-uniform illumination is formulated as:
Restricted by sensor saturation and intrinsic noise, the valid pixel signal obeys boundary constraints:
where
is the pixel saturation limit (maximum digital quantization value), and
is the sensor intrinsic noise.
Within a reasonable dynamic range (, ), the influence of overall light intensity on resolution measurement is negligible. However, once the pixel falls into saturation or noise-dominated region, global light intensity variation will severely degrade MTF accuracy.
This work aims to propose an effective method for improving imaging resolution under conventional ordinary illumination conditions. Nevertheless, the above analysis demonstrates that highly stringent lighting conditions are required to acquire accurate quantitative resolution measurements. Accordingly, we abandon the comparative analysis based on precise resolution data, and adopt the variation trend of resolution as a reasonable evaluation criterion to assess the performance of the proposed method.
Taking the first-order partial derivative of Equation (4) with respect to
:
Since , , and are all positive, the partial derivative is always negative. This monotonic relationship reveals that a reduction of corresponds to an increase in apparent . Although inhomogeneous illumination deviates the measured from the ideal value, the variation trend of at the same spatial position under different light sources remains credible. Therefore, a point-to-point comparison strategy is adopted in this work. For all effective test positions of the ISO 12233 eSFR chart, MTF indicators before and after light source replacement are compared one by one. The consistent improvement of resolution at each measuring position sufficiently demonstrates that the proposed near-monochromatic illumination and crosstalk correction method can effectively enhance imaging resolution under actual non-uniform illumination.
As can be seen from Equation (5) and the subsequent analysis, underexposure or overexposure will severely degrade the measurement accuracy of imaging resolution. In the experiments, the High-Reflectance White Area (HRWA) of the IRTC is adopted as the unsaturation judgment reference region. This region is the brightest standard area on the entire test chart. Therefore, once HRWA remains unsaturated, all other areas including the IRTC edge regions are naturally unsaturated. Define as the RGB channel intensity vector of HRWA, which denotes the photoelectric response digital intensity of red, green and blue channels of CCD sensor in HRWA region. During image acquisition, light source intensity and CCD exposure time are adjusted to keep each component of unsaturated. This strategy eliminates resolution measurement distortion caused by improper exposure and guarantees accurate and reliable experimental results.
3.3. Experimental Testing
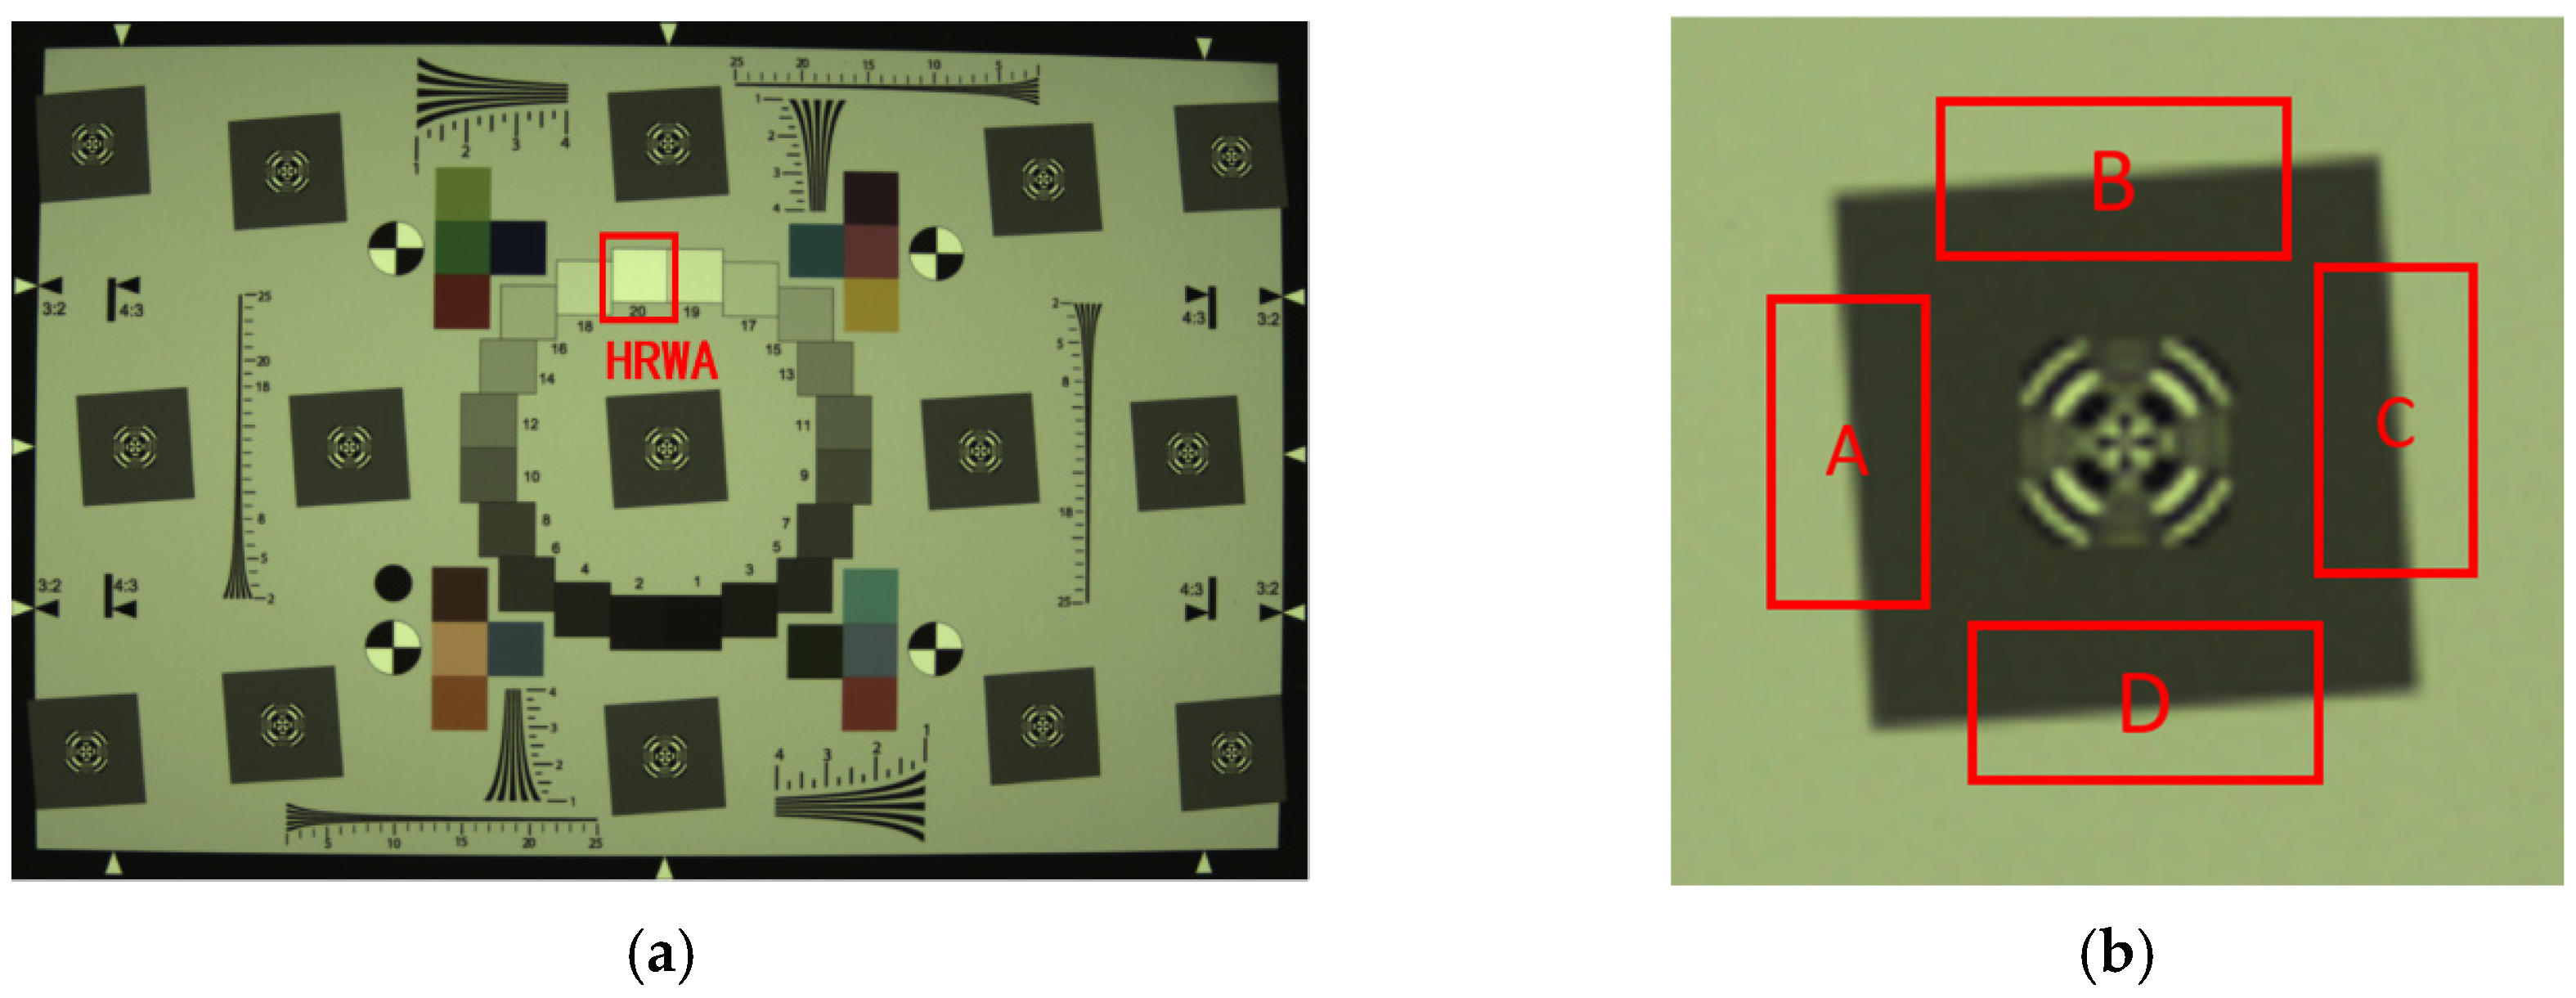
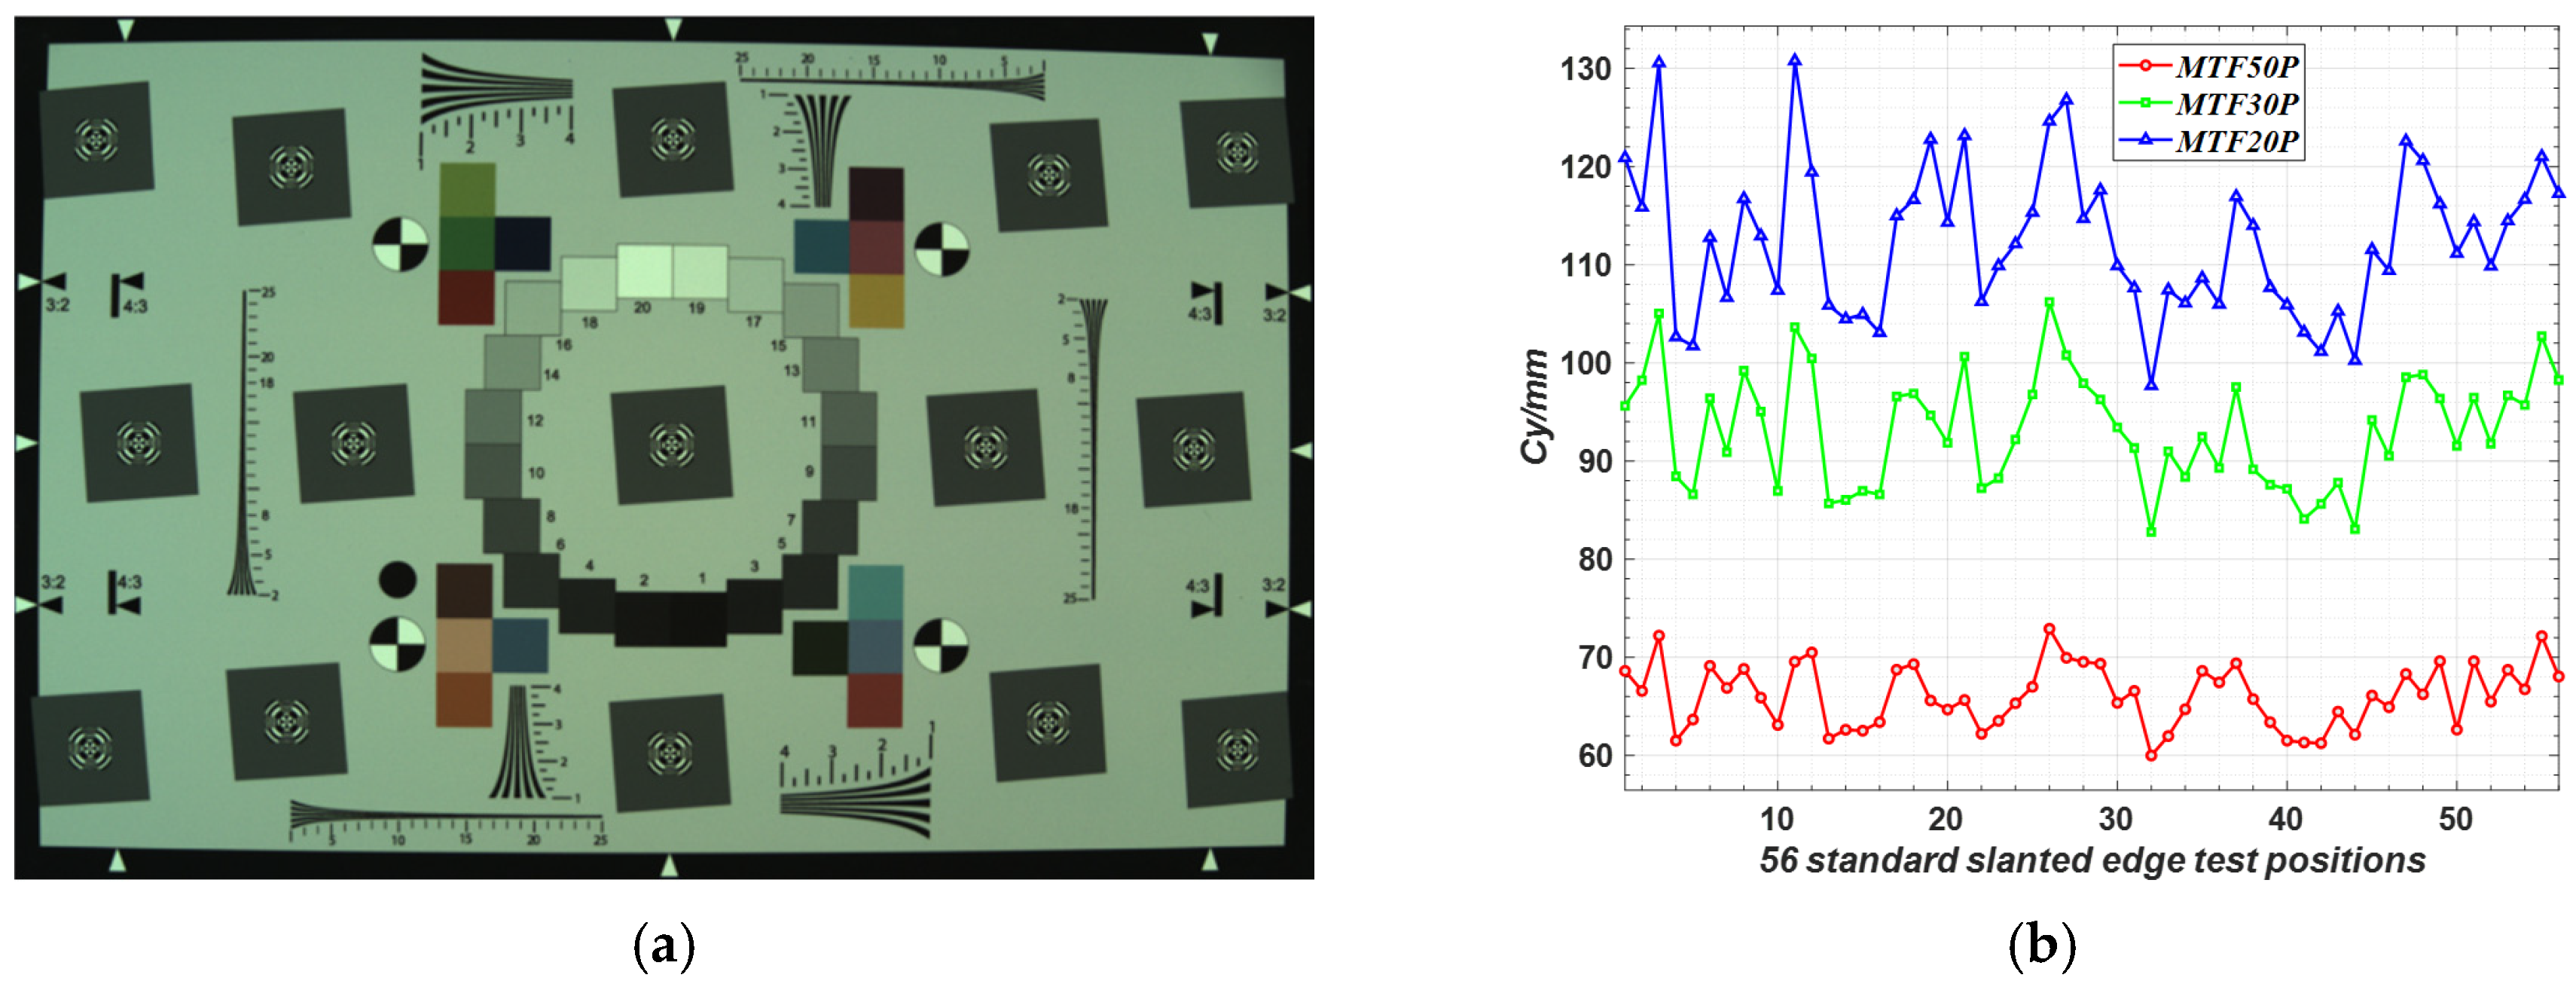
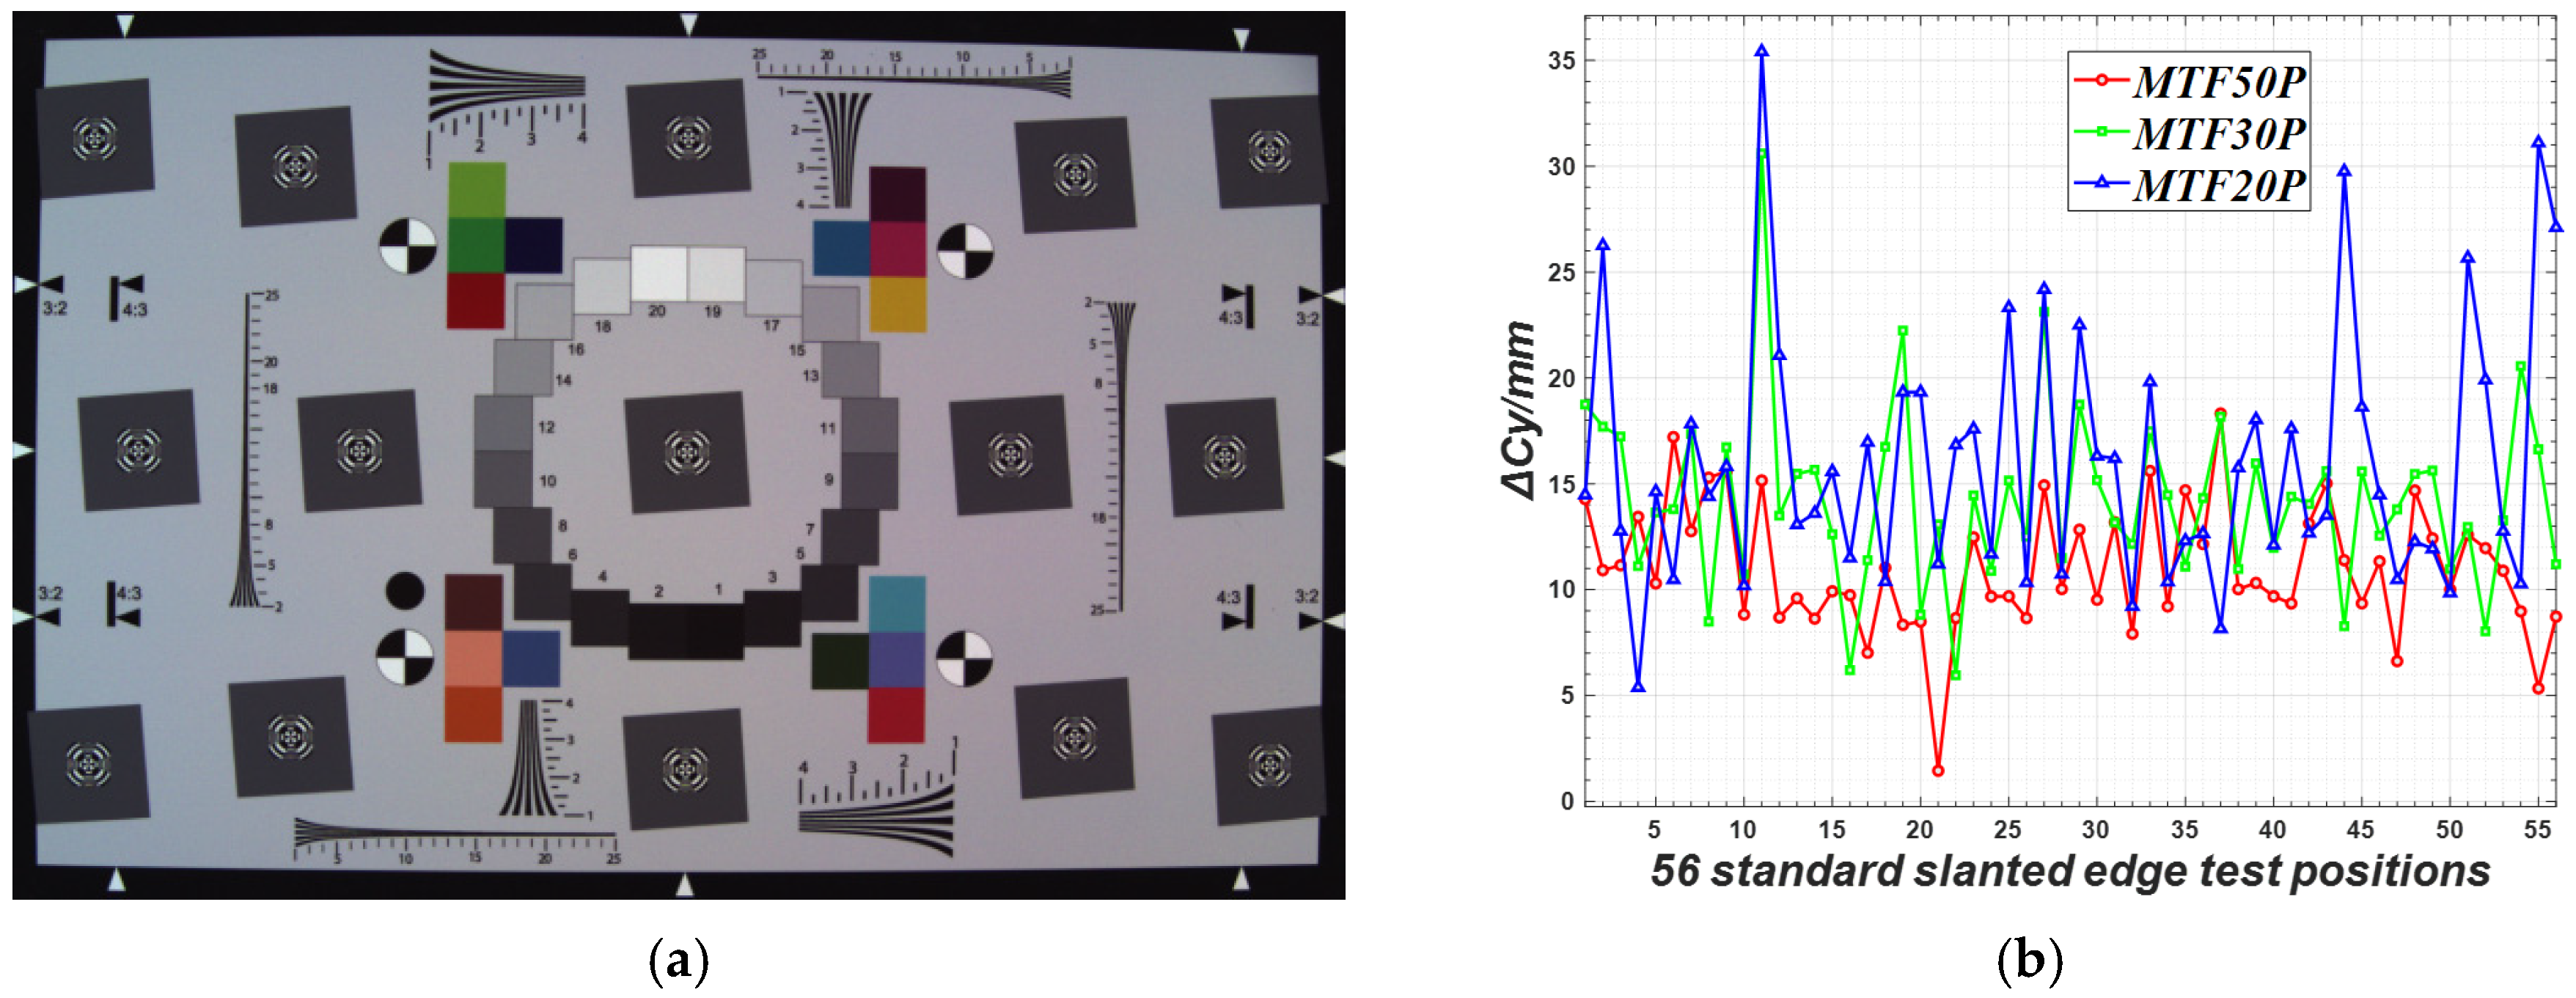
Figure 4a shows a captured image of the IRTC under illumination by the D50 continuous-spectrum light source. In the HRWA region illustrated in
Figure 4a, the maximum RGB intensity vector
is measured as approximately (226,253,166), and the corresponding average RGB intensity values are (212,241,157), respectively. As the gains of the CCD R/G/B channels were fixed at unity during the experiment, the response intensity of the green channel under D50 illumination is considerably higher than those of the red and blue channels, leading to an overall greenish tint in the captured image.
Figure 4b shows a slanted edge block on the IRTC. The IRTC contains a total of 15 slanted edge blocks, whose slanted edges (marked A, B, C, and D in
Figure 4b) serve as resolution test positions for measuring the horizontal and vertical resolution of the corresponding object-plane field-of-view regions. The entire IRTC has 56 effective test positions, and each of the four-corner slanted edge blocks features three effective slanted edges. Based on these slanted edges, the Slanted Edge Method is applied with commercial software (Imatest, IQstest), open-source algorithms (sfrmat3, Mitre SFR1.4), or custom image processing programs to calculate the resolution and MTF curve for each field-of-view position.
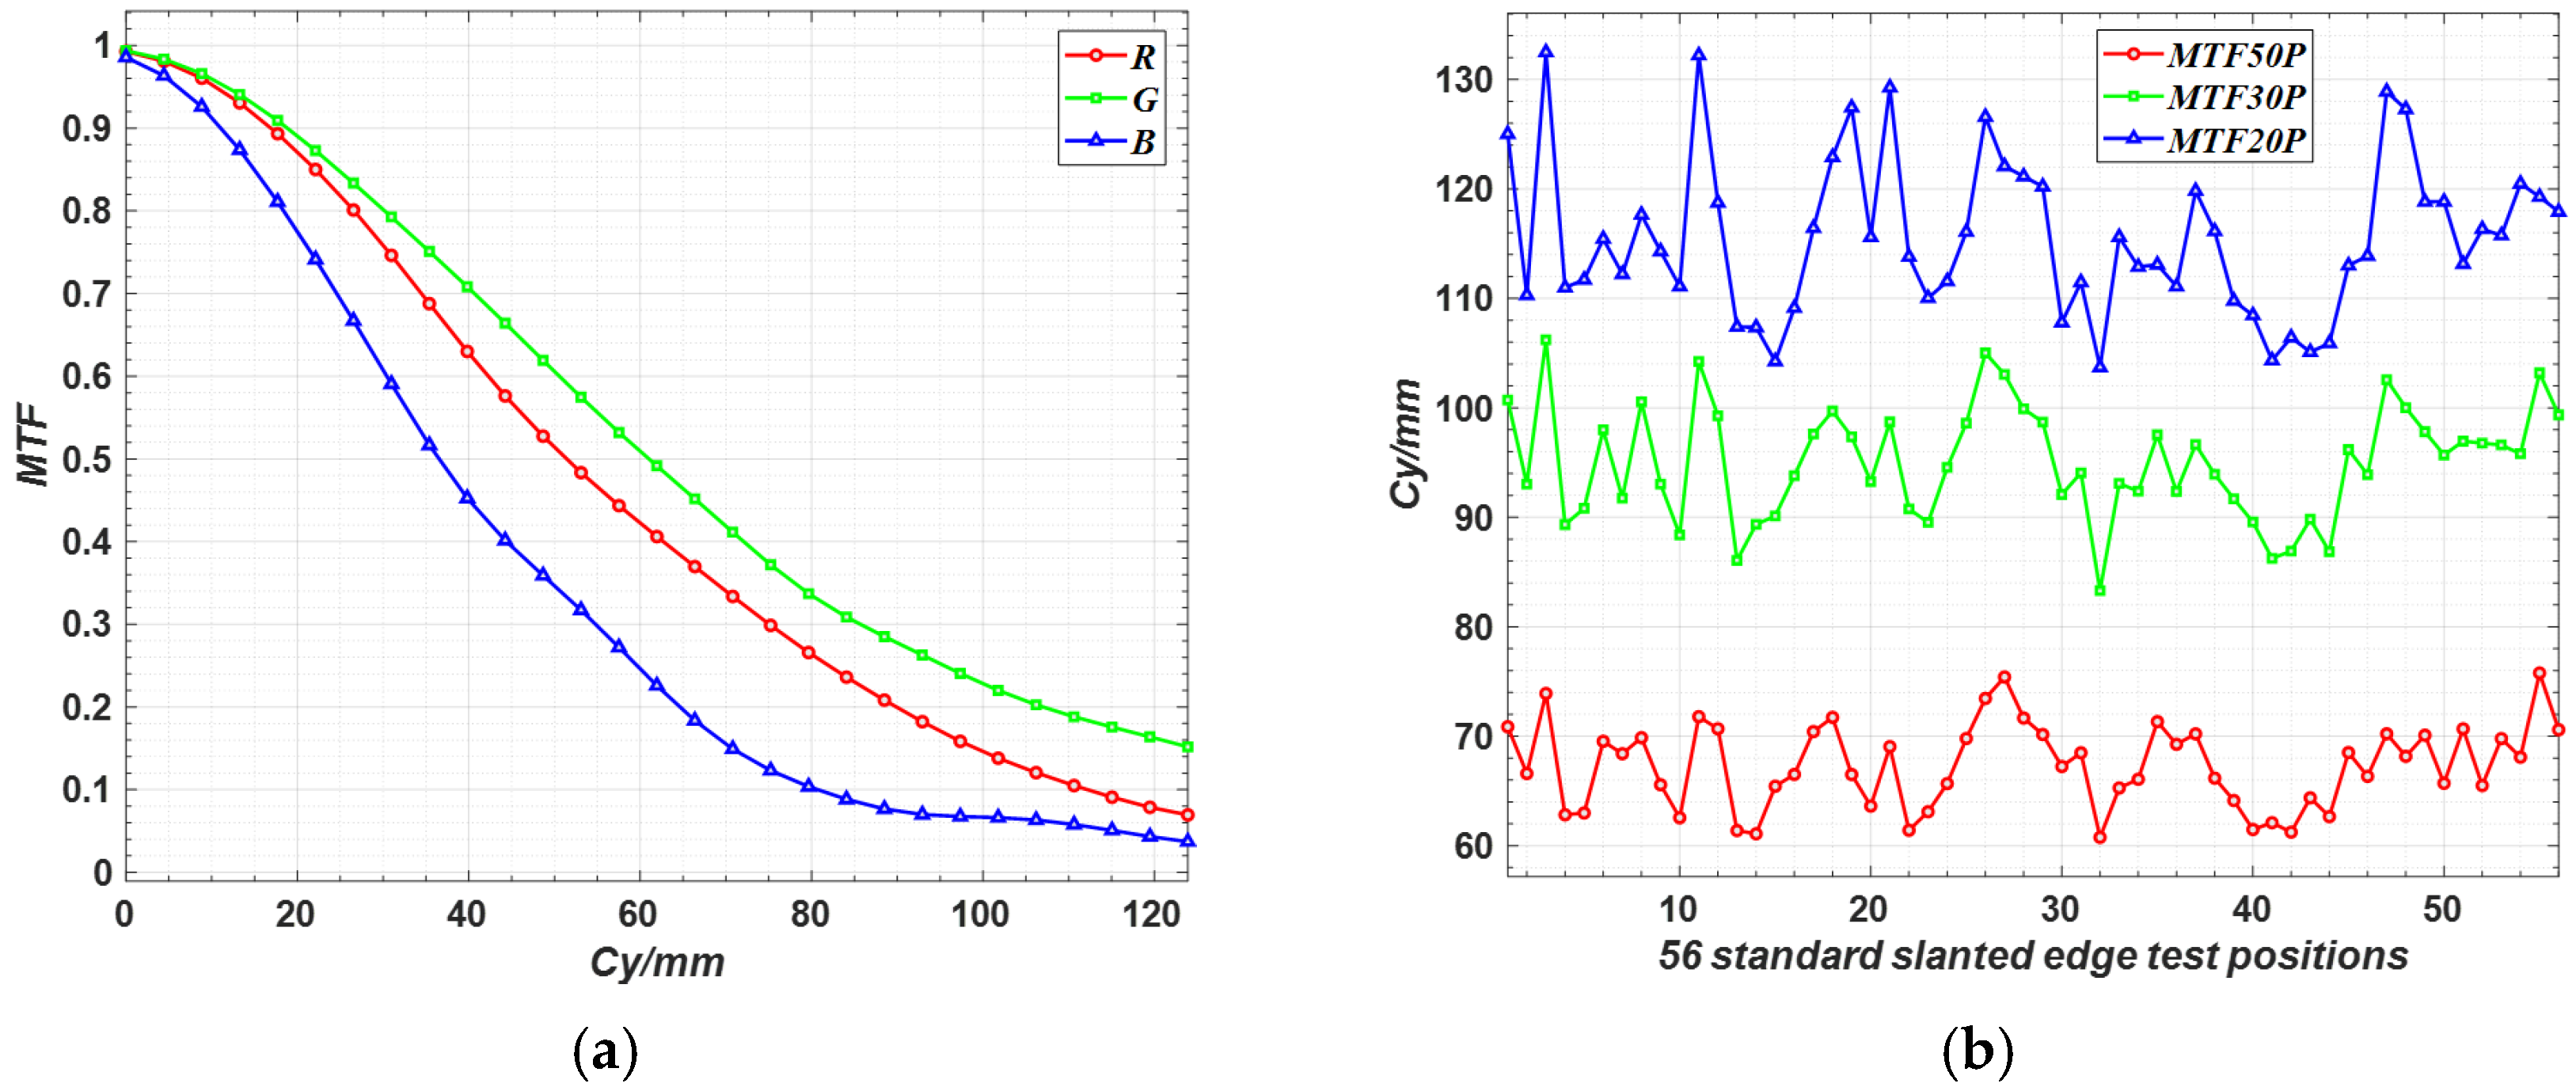
Figure 5 presents the MTF calculation results obtained from the IRTC shown in
Figure 4a. Specifically,
Figure 5a illustrates the MTF curves of the three RGB color channels at slanted edge A (
Figure 4b) of the central slanted block in the IRTC. In optical lens design, the green channel is usually the primary optimization target, and experimental focusing is adjusted to achieve the sharpest imaging in the green channel. Consequently, the MTF performance of the green channel in
Figure 5a is superior to that of the red and blue channels.
Based on the MTF data of 56 test positions across 15 slanted blocks on the IRTC, a quantitative comparison of the resolution performance across different images can be performed. However, a direct comparison of the full-band MTF curves for all 56 positions and three color channels entails a substantial workload and hinders intuitive performance evaluation. Therefore, this paper adopts MTF50P, MTF30P, and MTF20P Indicators (MTFI) as the key evaluation metrics; these correspond to the spatial frequencies at which the MTF value decreases to 50%, 30%, and 20% of the peak value, respectively. MTF50P and MTF20P are widely used MTF-based metrics in imaging evaluation [
20]. MTF50P correlates strongly with human-perceived sharpness, while MTF20P reflects the system’s limit for resolving fine details. As an intermediate indicator, MTF30P is employed to assess mid-high frequency detail preservation. These indicators enable a comprehensive and efficient assessment of the imaging resolution performance.
Figure 5b presents the statistical results of these MTFI for the 56 test positions on the IRTC, based on the green channel data.
To compare the resolution differences between imaging systems under D50 continuous-spectrum illumination and near-monochromatic LED illumination, the most direct approach is to capture images of an IRTC using both light sources under otherwise identical conditions, followed by a quantitative comparison based on the MTFI. Since the red, green, and blue channels of the near-monochromatic LED source allow for independent intensity adjustment, the brightness of each channel is calibrated in the experiment to balance their contributions. This ensures similar intensity responses from the HRWA of the IRTC under each monochromatic channel and prevents overexposure during trichromatic imaging.
If the HRWA on the IRTC exhibits similar intensity levels under individual illumination of the three-color LEDs, the mixed-color imaging effect in
Figure 6a should theoretically approximate that of white light. However, due to incomplete cross-channel crosstalk by the CCD color filters, the mean intensity vector
of the R/G/B channels in the HRWA is (194, 242, 187). The significantly higher intensity level of the green channel causes a noticeable color cast in the IRTC image of
Figure 6a. Similarly, affected by cross-channel interference, the green-channel MTFI in
Figure 6b does not show a significant improvement over that in
Figure 5b. To facilitate intuitive quantitative comparison, this study adopts three comprehensive evaluation metrics based on the MTFI differences at all measurement points of the RGB three channels, including ΔMTF-AVG for the mean of MTFI differences, ΔMTF-MED for the median of MTFI differences, and ΔMTF-STD for the standard deviation of MTFI differences.
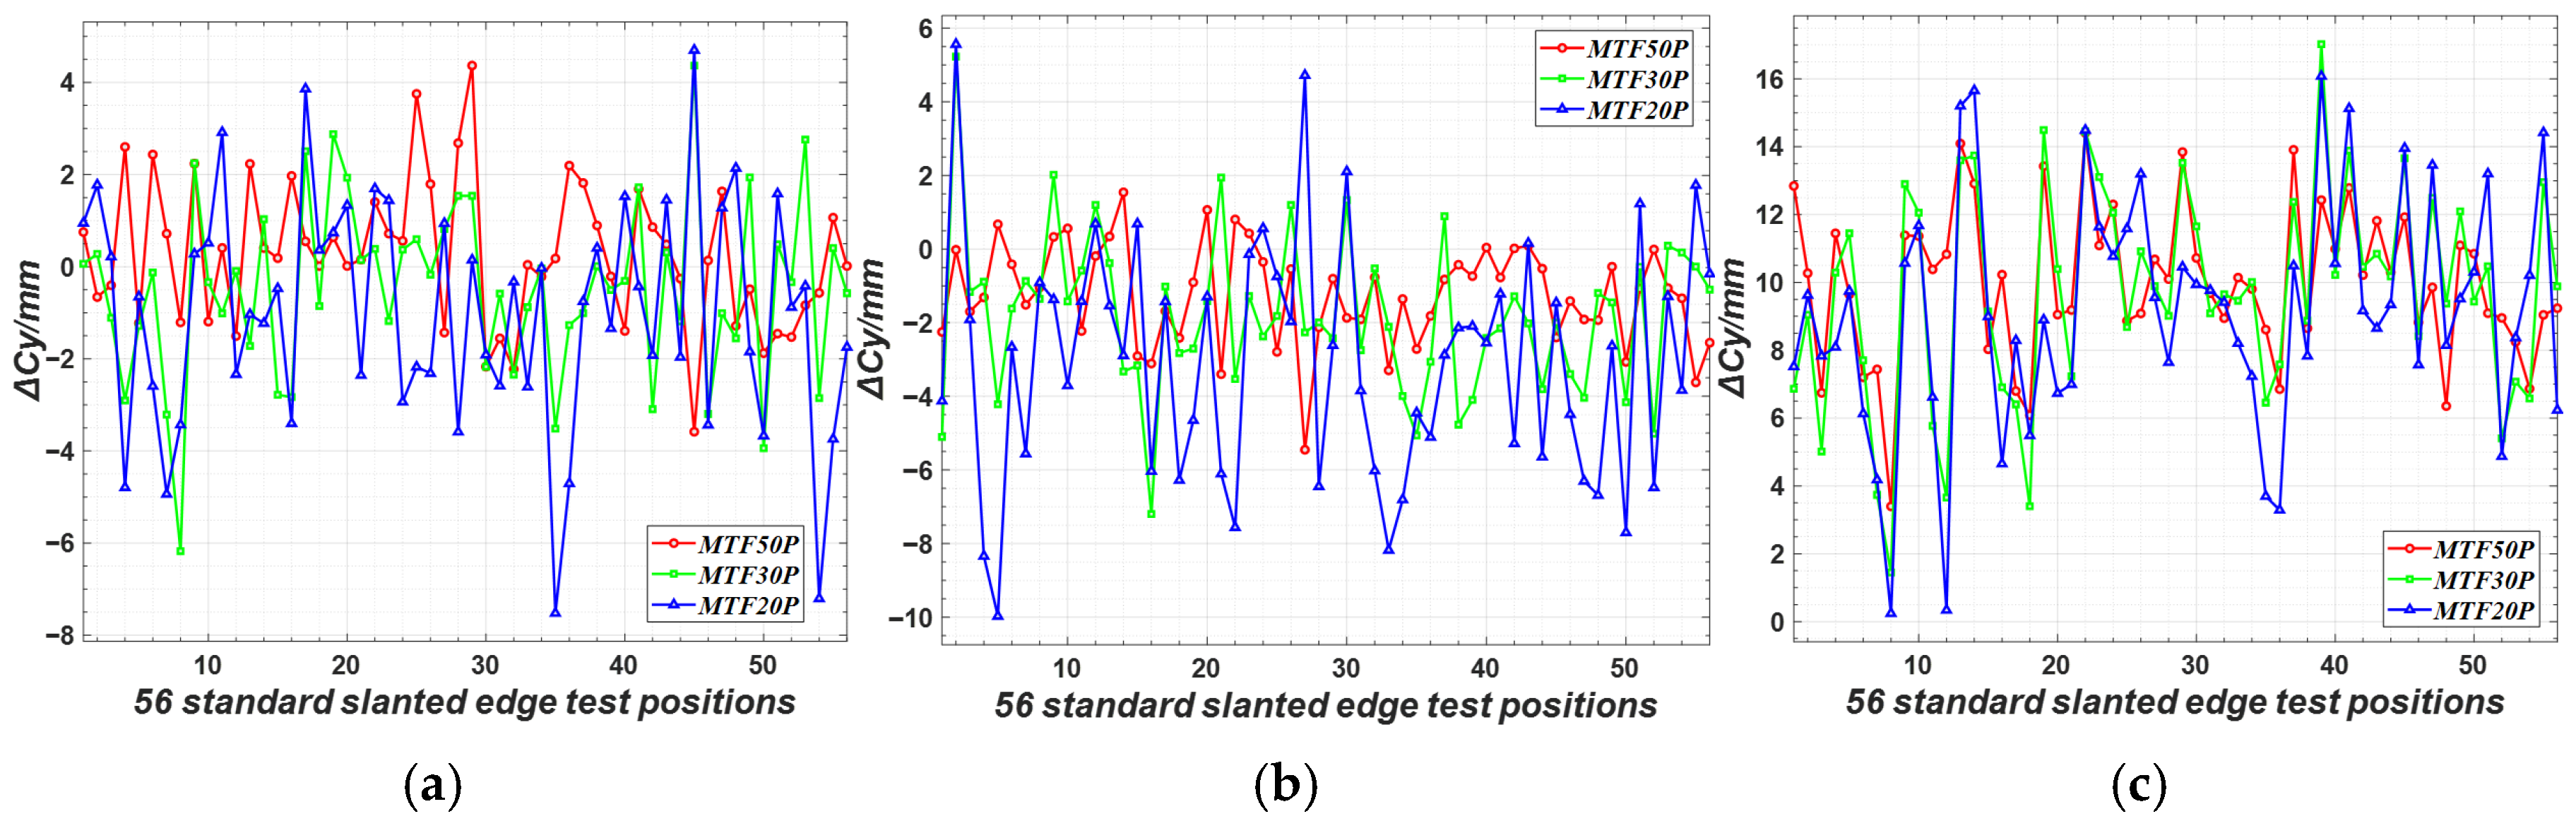
Figure 7 illustrates the three-channel MTFI differences at 56 effective test positions of the IRTC under two illumination sources.
Figure 7a presents the red-channel results, with ΔMTF-AVG values of 0.3, −0.5, and −1.0, ΔMTF-MED values of 0.2, −0.3, and −0.8, and ΔMTF-STD values of 1.6, 1.9, and 2.5;
Figure 7b shows the green-channel data, with ΔMTF-AVG of −1.2, −1.8, and −3.0, ΔMTF-MED of −1.1, −1.9, and −2.6, and ΔMTF-STD of 1.4, 2.1, and 3.2;
Figure 7c provides the blue-channel outcomes, with ΔMTF-AVG of 10.0, 9.7, and 9.4, ΔMTF-MED of 10.1, 9.8, and 9.2, and ΔMTF-STD of 2.2, 3.2, and 3.5.
Since strict uniform illumination is not required in this application, the measured MTF values in this work are not strictly accurate. Nevertheless, the signs and magnitudes of parameters ΔMTF-AVG and ΔMTF-MED can reliably reflect the resolution variation. Positive ΔMTF-AVG and ΔMTF-MED values indicate resolution improvement, and larger values correspond to a more prominent enhancement, while negative values represent a reduction in imaging resolution. ΔMTF-STD quantifies the spatial fluctuation of MTFI variations across the field of view. A lower ΔMTF-STD corresponds to more uniform resolution enhancement under non-uniform lighting, while a higher ΔMTF-STD reveals prominent regional inconsistencies in the optimization effect.
As illustrated by the MTFI differences in
Figure 7 and the corresponding ΔMTF-AVG and ΔMTF-MED indicators, the red and green channels exhibit a slight resolution decline under near-monochromatic LED illumination, while the blue channel achieves a prominent resolution improvement.
Theoretically, the resolution of all three CCD channels should be improved to some extent under near-monochromatic LED illumination. However, the resolution degradation observed in
Figure 7 is mainly attributed to inter-channel crosstalk interference caused by multi-color light. To mitigate this issue, a color-separated independent illumination scheme can be implemented: sequentially illuminate with three sets of near-monochromatic LEDs corresponding to red, green, and blue, collect effective imaging data from the respective channels under each monochromatic light source, and then synthesize the images.
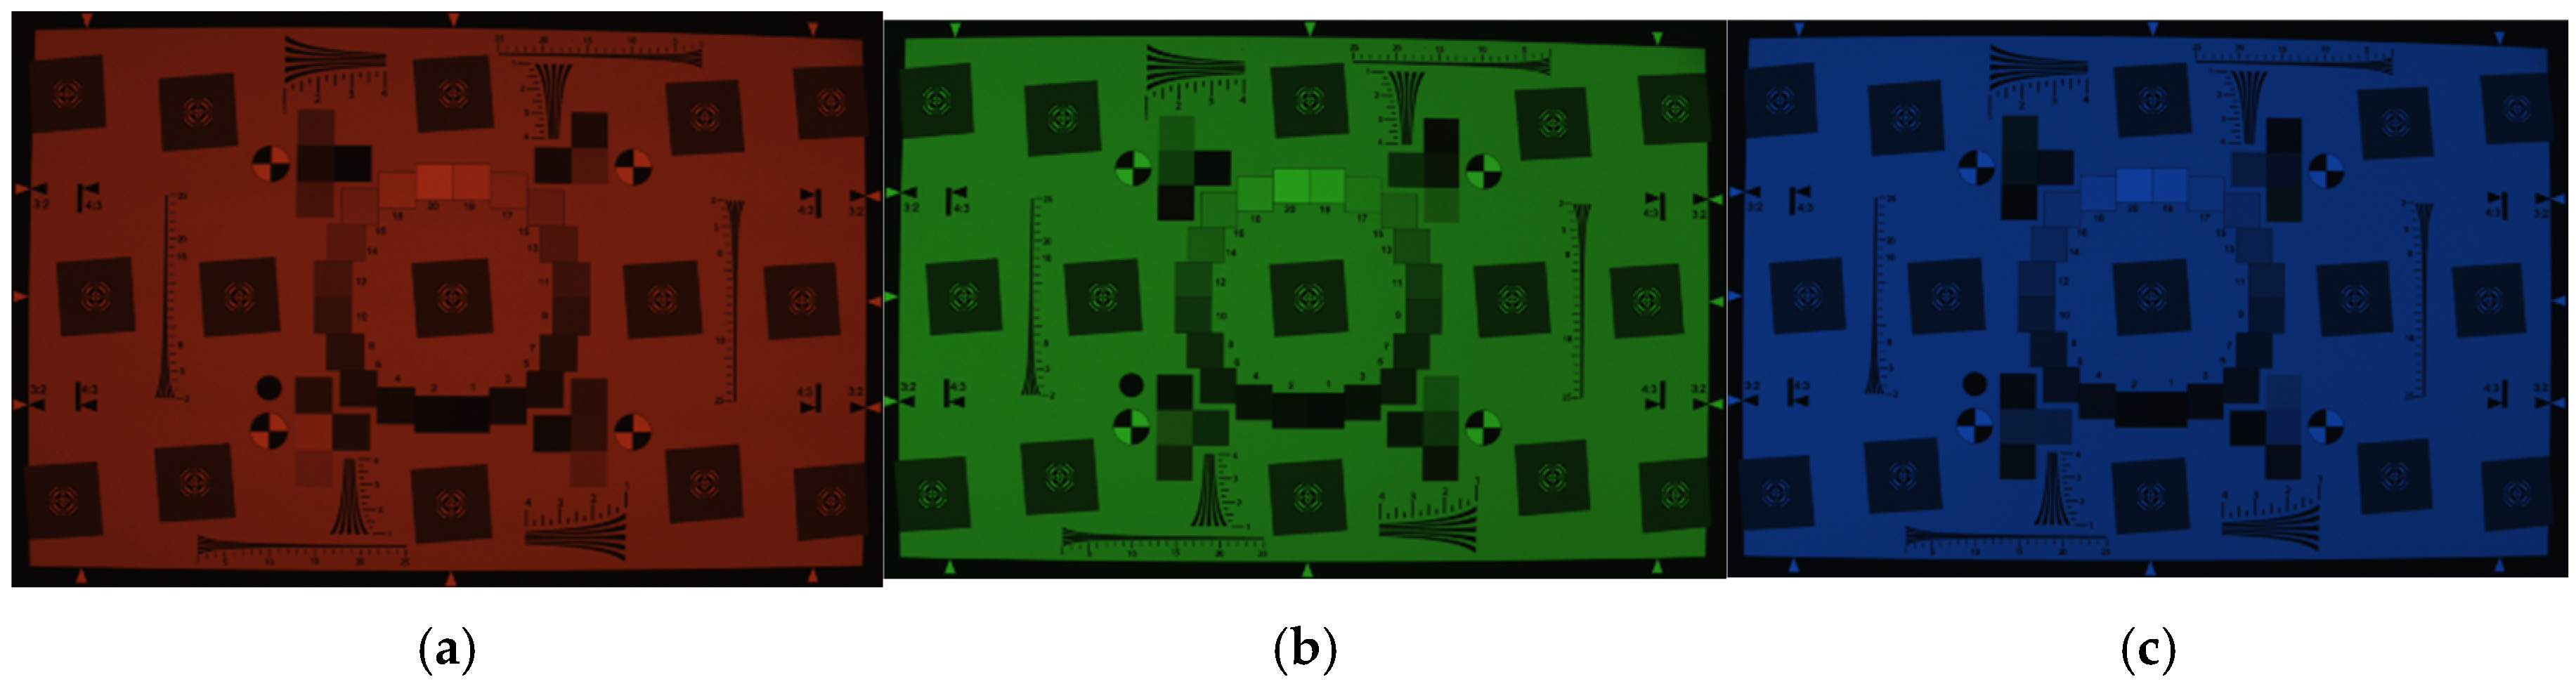
Figure 8 presents the images of the IRTC captured by the sensor under independent color-separated near-monochromatic LED illumination. Specifically,
Figure 8a shows the image captured under red LED illumination alone, where the red channel data is free from crosstalk interference from green and blue light. Likewise, the green and blue channel data in
Figure 8b,c are also unaffected by crosstalk from other color components. Extracting the red, green, and blue channel data from
Figure 8a,
Figure 8b and
Figure 8c respectively for color image synthesis can effectively eliminate the resolution degradation caused by inter-channel crosstalk.
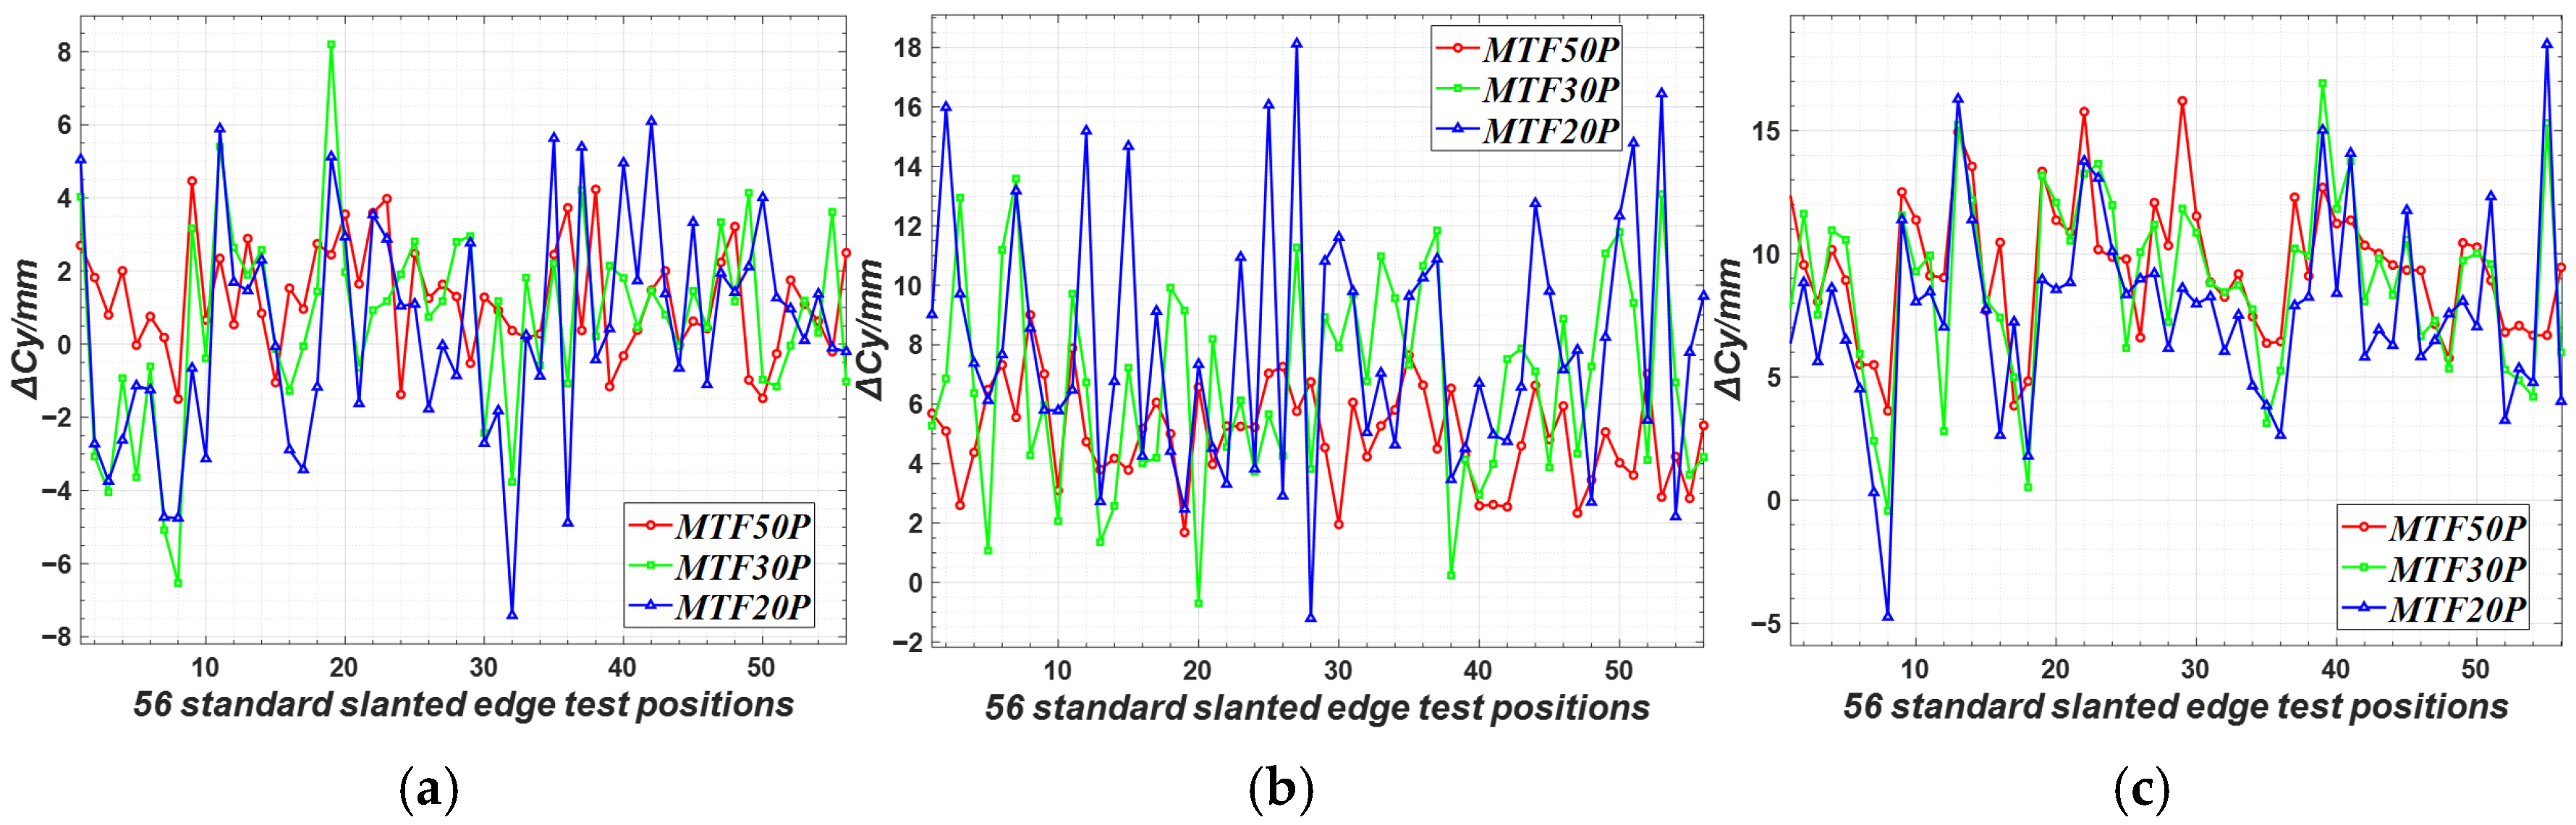
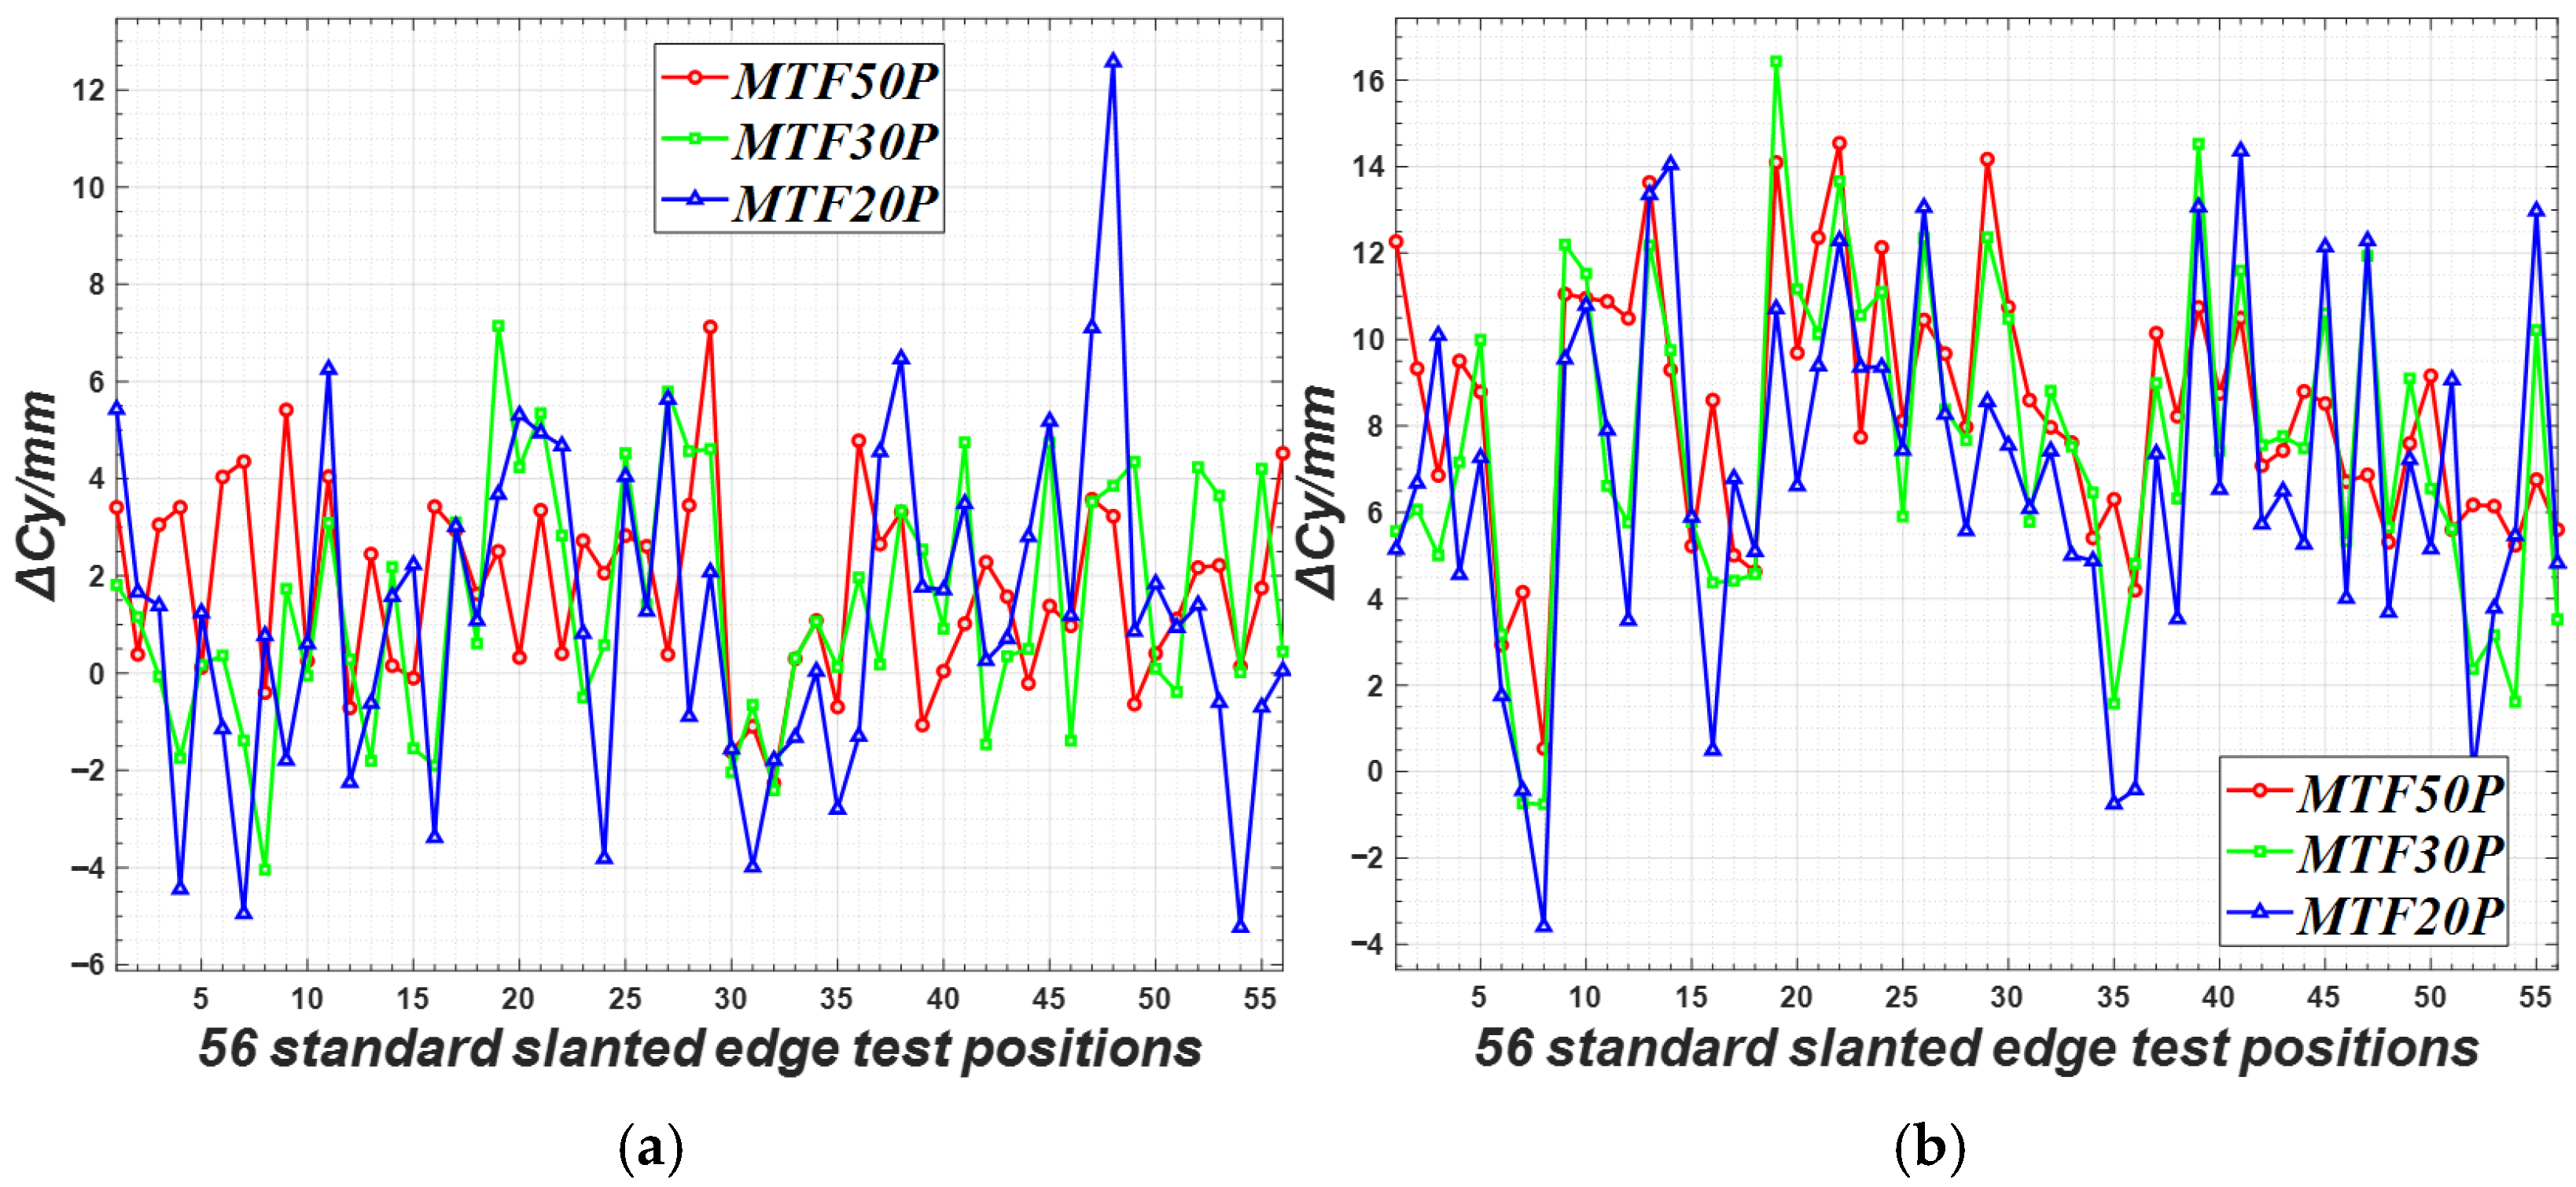
Figure 9 presents the MTFI differences across 56 field-of-view positions on the IRTC for three CCD channels, by comparing the results obtained under single LED illumination (
Figure 8) with those under D50 broadband illumination (
Figure 4a). Specifically,
Figure 9a plots the red-channel differences, with ΔMTF-AVG of 1.2, 0.7, and 0.4, ΔMTF-MED of 1.0, 1.0, and 0.2, and ΔMTF-STD of 1.5, 2.6, and 3.0.
Figure 9b shows the green-channel differences, with ΔMTF-AVG of 5.0, 6.7, and 8.0, ΔMTF-MED of 5.0, 6.7, and 7.4, and ΔMTF-STD of 1.7, 3.4, and 4.2.
Figure 9c provides the blue-channel differences, with ΔMTF-AVG of 9.5, 8.9, and 7.7, ΔMTF-MED of 9.5, 9.4, and 7.8, and ΔMTF-STD of 2.7, 3.6, and 3.9.
Combined with the MTFI differences in
Figure 9 and the corresponding ΔMTF-AVG and ΔMTF-MED indicators, it is evident that near-monochromatic LED separated imaging can effectively suppress cross-channel crosstalk and greatly improve the overall resolution of the green and blue channels. By comparison, the red channel exhibits only limited resolution improvement, which may be mainly affected by the optical lens design, the three-channel acquisition mode of the CCD sensor, and the actual focusing position.
In addition, the ΔMTF-STD data reveal that the MTF20P values are markedly higher than the MTF50P values. This indicates that fine structural regions corresponding to high-frequency MTF metrics are more susceptible to noise, uneven illumination and other interfering factors, leading to larger data dispersion and deviation in resolution measurement.
The data in
Figure 9 demonstrates that the optimal approach to mitigate inter-channel crosstalk under near-monochromatic LED illumination is to sequentially acquire images with red, green, and blue LEDs and fuse the three-channel data. However, this method requires three exposures per color image, which limits its practical application in most color sensor-based imaging systems.
4. Linear Crosstalk Image Correction Method
Under different color light illumination, the intensity values of each sensor pixel follow an approximately linear superposition relationship. The mixed-light imaging result in
Figure 6a can thus be considered the linear superposition of images captured under independent illumination by red, green, and blue near-monochromatic LEDs. Let the three-channel intensity matrices of the image sensor under separate red, green, and blue LED illumination be denoted as
,
,
;
,
,
; and
,
, respectively.
denotes the image data captured by the camera’s green channel under near-monochromatic red LED illumination. Other notations follow the same definition rule by analogy. The three-channel intensity matrices
,
,
corresponding to the mixed-light imaging in
Figure 6a can then be expressed as:
In Equation (7), if the regional differences in the Bayer color filter array are ignored, when a single wavelength LED illuminates alone, the intensity values output by the three channels of the sensor can be regarded as having only an intensity scaling relationship, such as
,
, so Equation (7) can be changed to:
where
Given that the three channels follow the approximate linear relationship in Equation (8), this study calibrates using the three-channel intensity values of the HRWA region on the IRTC.
Under individual red, green, and blue LED illumination, the average intensity vectors
of the R/G/B channels in the HRWA region of
Figure 8 are approximately (153, 38, 17), (37, 154, 26), and (13, 60, 152), respectively. Linear superposition of these values yields theoretical average intensity values of approximately (203,252,195) for the three channels. As shown by the normalized proportional relation 203:252:195 ≈ 194:242:187, the theoretical inter-channel ratio is highly consistent with the measured values of (194, 242, 187) in
Figure 6a. This result validates the rationality of the linear superposition assumption for image intensity values in Equation (8).
Under monochromatic illumination, the coefficient
can be calculated from the average intensity values of the three channels in the HRWA region of
Figure 8a as follows:
Theoretically, given the proportionality coefficient and the red, green, and blue channel matrices , , and , the individual illumination matrices , , and can be derived from Equation (8). However, generating a complete color image with a color CCD requires the introduction of additional image processing mechanisms, making it impossible to directly use Equation (8) to solve for , , and .
Most color CCDs adopt a Bayer filter array for color image acquisition. In the 2 × 2 basic repeating unit of the Bayer filter array, the distribution ratio of red, green, and blue pixels is . This means that no single color channel can obtain complete spatial details in a single-frame raw image, with the green channel retaining up to 50% of the original details. Subsequent interpolation algorithms are required to reconstruct each channel to obtain full-resolution image data. Due to the high proportion of green pixels, the green channel exhibits higher resolution during the initial sampling stage, leading to significant differences in the degree of crosstalk between different color channels.
When crosstalk from green light occurs in red and blue channels, each containing only one pixel in a Bayer array basic repeating unit, with the remaining pixels reconstructed via interpolation, such crosstalk is primarily low-frequency. In contrast, crosstalk from red and blue light in the green channel, which has a higher sampling density, is dominated by high-frequency crosstalk. The crosstalk from red to the blue channel and from blue to the red channel also exhibits low-frequency characteristics, similar to that associated with green light. In other words, for images captured by a practical color camera, the green-channel values of
,
, and
in Equation (8) are inconsistent with those of the red and blue channels.
In Equation (11),
,
, and
of the green channel are high-resolution imaging data captured by the green channel under mixed white light illumination with near-monochromatic light. After appropriate smoothing, the processed results of
,
, and
are approximately equivalent to
,
, and
. Let
denote the smoothing operation. The smoothed result of
,
, and
are expressed as:
In practical processing, the red and blue channels matrices (
,
in Equation (11)) are first corrected using data from the green channel (
). Prior to correction, smoothing filtering is applied to the green channel data
.
In Equation (13), represents the green-channel data in Equation (11) after appropriate smoothing processing. We first use Equation (13) to separately compute the approximate values of matrices and , and then employ these results in Equation (11) to solve for the approximate value of matrix .
However, since and are low-frequency data, directly using them to correct the green channel data and in Equation (11) only compensates for their low-frequency components. This causes the corrected green channel to exhibit an apparent resolution higher than the actual resolution obtained under pure green light illumination.
Figure 10a shows the image obtained by correcting the green channel using Equations (11) and (13) based on
Figure 6a, followed by color temperature correction with the HRWA as the benchmark (constrained by scaling the HRWA of each channel to a maximum value of 254 and proportionally rescaling the intensity values across the entire channel).
When correcting the red and blue channels, the green channel data is preprocessed with Gaussian blur (implemented via the imgaussfilt function in MATLAB R2024b). The blur kernel parameter σ directly impacts the resolution of the optimized image. Experimental comparison across multiple imaging positions shows that σ = 0.8 is optimal for the lens-camera combination used in this study.
Figure 10b illustrates the MTFI deviation between the corrected green channel and the reference data acquired under D50 continuous spectrum illumination in
Figure 4. The corresponding quantitative metrics are as follows: ΔMTF-AVG of 11.0, 14.2 and 15.9, ΔMTF-MED of 10.3, 14.0 and 14.6, and ΔMTF-STD of 3.0, 4.1 and 6.1. Both ΔMTF-AVG and ΔMTF-MED of the corrected green channel are significantly higher than those obtained under single green light illumination, where
Figure 9b reports ΔMTF-AVG values of 5.0, 6.7, 8.0 and ΔMTF-MED values of 5.0, 6.7, 7.4. This finding verifies the foregoing analysis. Specifically, the calculation of
and
based on Equation (13), followed by the derivation of
from Equation (11), only eliminates the low-frequency crosstalk induced by red and blue light in the green channel, which eventually leads to overcorrection of the green channel image resolution. The slightly larger ΔMTF-STD values of 3.0, 4.1, and 6.1 demonstrate that residual high-frequency components of red and blue light lead to obvious fluctuations in the corrected resolution values.
Figure 11 presents the MTFI difference curves of the red and blue channels for the corrected image in
Figure 6a, in comparison with the counterpart channels under continuous-spectrum illumination in
Figure 4a. The red channel achieves ΔMTF-AVG values of 1.7, 1.4 and 1.2, ΔMTF-MED values of 1.7, 0.8 and 1.1, and ΔMTF-STD values of 1.9, 2.4 and 3.4, while the blue channel obtains ΔMTF-AVG of 8.3, 7.5 and 6.8, ΔMTF-MED of 8.3, 7.4 and 6.6, and ΔMTF-STD of 2.9, 3.7 and 4.0. These data are in great agreement with the ΔMTF-AVG, ΔMTF-MED and ΔMTF-STD results measured under independent LED illumination in
Figure 9a,c, i.e., red channel: 1.2, 0.7, 0.4 (ΔMTF-AVG), 1.0, 1.0, 0.2 (ΔMTF-MED), 1.5, 2.6, 3.0 (ΔMTF-STD); blue channel: 9.5, 8.9, 7.7 (ΔMTF-AVG), 9.5, 9.4, 7.8 (ΔMTF-MED), 2.7, 3.6, 3.9 (ΔMTF-STD). This demonstrates that the corrected resolution of both red and blue channels closely approximates the performance obtained under separate monochromatic LED illumination.
The core goal of the algorithm in this paper is to make the corrected image approach the ideal reference image synthesized by separate RGB time-sharing near-monochromatic light illumination. Peak Signal-to-Noise Ratio (PSNR) and Structural Similarity Index Measure (SSIM) were used for objective quality evaluation, to quantify pixel intensity deviation, residual color crosstalk and structural differences. Taking the image synthesized by RGB time-sharing near-monochromatic light as the ideal benchmark, the quantitative results are as follows: the RGB three-channel PSNR and SSIM of the corrected image relative to the ideal benchmark are 29.8 dB, 29.1 dB, 29.5 dB and 0.89, 0.84, 0.88, respectively; the RGB three-channel PSNR and SSIM of the original mixed image relative to the ideal benchmark are 25.9 dB, 35.6 dB, 23.5 dB and 0.80, 0.88, 0.78, respectively.
Channel-by-channel analysis shows that compared with the original mixed image, the PSNR of the R and B channels after correction is increased by 3.9 dB and 6.0 dB, and the SSIM is increased by 0.09 and 0.10 respectively, which are closer to the ideal benchmark; the G channel has a PSNR decrease of 6.5 dB and an SSIM decrease of 0.04 due to the constraint of multi-channel joint optimization, which is a reasonable trade-off. The RGB three-channel PSNR and SSIM between the corrected image and the original mixed image are 27.9 dB, 24.5 dB, 27.1 dB and 0.89, 0.80, 0.94, respectively, indicating that the algorithm does not copy the original image, but completes pixel reconstruction and crosstalk correction on the basis of retaining the main structure. Overall, the processed image is closer to the ideal benchmark, which can effectively suppress channel crosstalk and achieve high-quality restoration, conforming to objective evaluation standards, verifying the effectiveness of the algorithm and achieving the design goal.
For a given imaging system, the proportionality coefficient is a constant associated with the illumination wavelength, CCD quantum efficiency, and other relevant factors. It can be observed that when imaging with near-monochromatic LED sources matched to the lens design wavelength band, pre-calibrating the crosstalk ratio coefficient for each color channel using a standard white reference surface (e.g., the HRWA) allows partial crosstalk correction through the linear channel crosstalk relationship (Equations (11) and (13)), thus improving the resolution of individual channels and the overall imaging system.