Article

Enhanced Thermal Stability in Compact ASE Sources Enabled by Optimized Erbium-Doped Fiber Design

1
School of Electrical Engineering, University of South China, Hengyang 421001, China
2
School of Mathematics and Physics, University of South China, Hengyang 421001, China
3
School of Mechanical Engineering, University of South China, Hengyang 421001, China
*
Authors to whom correspondence should be addressed.
Photonics 2026, 13(5), 424; https://doi.org/10.3390/photonics13050424
Submission received: 5 March 2026 / Revised: 17 April 2026 / Accepted: 22 April 2026 / Published: 24 April 2026
(This article belongs to the Special Issue Advancements in Ultrafast Laser Science and Technology)

Abstract

Amplified Spontaneous Emission (ASE) sources are widely employed as highly stable broadband sources in fields such as high-precision navigation and optical detection. Erbium-doped fiber (EDF), as the core active component in ASE sources, has long been a key subject of thermal stability research. We fabricated a low-doped EDF with an 80 μm-cladding using the vapor phase doping (VPD) technique. This EDF was compared with a commercial 125 μm-cladding EDF using a double-pass forward (DPF) optical path configuration with a narrowband filter. We investigated the temperature-dependent characteristics of the ASE spectra generated by the two EDFs with different parameters. The temperature drift performance of the two EDFs was analyzed based on three critical indicators of the spectrum: mean wavelength, spectral bandwidth, and output power. In comparison with the commonly used EDF, the results show that a properly designed small-cladding EDF with an appropriate length can deliver higher ASE output power and exhibit a lower mean-wavelength temperature drift. This study provides an important guideline for promoting the miniaturization of high-precision fiber-optic sensing devices.

1. Introduction

ASE sources based on erbium-doped fiber (EDF) feature high power, low coherence, excellent spectral stability, and easy coupling to optical fibers. Due to these advantages, ASE sources have been widely utilized across various fields, especially serving as a key component in high-precision fiber-optic gyroscopes (FOGs) [1,2,3].
Interferometric FOGs measure angular velocity via the Sagnac effect, so light-source stability is critical to minimizing gyro errors [4]. Studying the thermal stability of ASE sources informs design optimizations that ensure stable output under harsh temperature conditions and reduce environment-induced errors [5,6]. Concurrently, increased precision and miniaturization are major development trends and research priorities for FOGs [7]. However, most research has focused on miniaturizing and integrating FOG components. Miniaturizing light sources remains a major challenge [8]. Therefore, research on compact, highly stable ASE sources is important.
It is well known that temperature fluctuations cause changes in the ASE spectrum, which is influenced by multiple factors. Research on improving the thermal stability of ASE sources has been ongoing [9,10,11,12]. There are currently several mainstream approaches to improving ASE sources: optimization of the ASE source optical path, dynamic adjustment of the source feedback, and optimization of the rare-earth (RE)-doped fibers [7]. For instance, Wan et al. used a thermally controlled component with spectral shaping capabilities to achieve a mean wavelength temperature drift of 1.3 ppm/°C across the full spectrum [13]. Kikilich et al. achieved an ASE output with a mean wavelength of 1669 nm, a 3 dB spectral width exceeding 16.5 nm, and a mean wavelength stability of 0.32 ppm/°C through real-time adjustment of the dual-laser pumping diode ratio in a double-pass bidirectional optical path structure [11]. These studies have made notable progress in improving ASE sources. However, many efforts prioritize ultra-wide spectra at the expense of output power and spectral stability. Meanwhile, most proposed schemes rely on complex optical designs and higher system power consumption, which present significant obstacles to device miniaturization. Since EDF is the sole active component in the ASE process, its properties critically determine the source’s overall thermal stability. Therefore, studying EDF properties is essential for developing high-stability, compact ASE sources.
This paper introduces an 80 μm-cladding EDF fabricated via the vapor phase doping (VPD) technique. This EDF has a lower doping concentration than the widely available commercial EDF. After being generated in a double-pass forward (DPF) optical path and filtered by a 1530 nm narrow-band filter, the ASE outputs from both EDFs were characterized in terms of output power, mean wavelength, and spectral width. The results demonstrate that the ASE source using a small-cladding EDF with a lower concentration achieves higher power conversion efficiency (24.7%) and a 3-dB bandwidth exceeding 6.9 nm. It also exhibits a lower mean wavelength drift of 0.102 ppm/°C over the temperature range from −50 °C to 75 °C, indicating its potential for use in compact ASE sources for high-precision FOGs. Table A1 in Appendix A shows comparisons between the proposed method and other published methods.

2. Experimental Setup and Fiber Fabrication

Currently, most ASE light source configurations are derived from four basic ASE source structures [14]. Erbium ions have many absorption peaks; however, when they are pumped at short wavelengths below 900 nm, excited-state absorption becomes very severe. Therefore, the mainstream pump wavelengths are primarily 980 nm and 1480 nm. Meanwhile, although both 1480 nm and 980 nm lasers can pump EDF-based ASE sources, 980 nm offers higher conversion efficiency and requires a shorter EDF length [15]. This makes it more widely used in ASE sources for FOGs.
For a pump wavelength of 980 nm, the spectrum can be divided into n intervals, each with a bandwidth Δ ν i . Let λ i and ν i denote the wavelength and frequency of the monochromatic component in the i -th interval, respectively. Its propagation can then be expressed as follows [5]:
d P A S E ± z , λ i d z = ± P A S E ± z , λ i Γ λ i σ e λ i N 2 σ a λ i N 1 α λ i ± 2 Γ λ i σ e λ i N 2 h ν i Δ ν i
d P p z d z = P p z Γ λ p σ e λ p N 2 σ a λ p N 1 α λ p
where P A S E ± z , λ i denotes the forward and backward ASE power at position (z) and wavelength λ i , and P p z is the pump power at position (z). The term α λ i is the intrinsic attenuation of the EDF at wavelength λ i , and Γ λ i is the overlap factor of the monochromatic component at λ i . Here, λ p is the pump wavelength. N 1 and N 2 are the populations of erbium ions in the ground and metastable states, respectively. σ e λ i and σ a λ i are the emission and absorption cross sections of the EDF at wavelength λ i , respectively. Under thermal equilibrium, they are related by the McCumber relation:
σ e λ = σ a λ e h c k B T 1 λ 0 1 λ
In this expression, k B is the Boltzmann constant, T denotes the thermodynamic temperature. λ 0 is the wavelength where the absorption and emission cross sections are equal. Under thermal equilibrium, N1 and N2 strictly obey the Boltzmann distribution:
N 2 N 1 = g 2 g 1 e E k B T
g i is the degeneracy of the i -th energy level, and Δ E is the energy difference between the two energy levels. The overlap factor Γ ( λ i ) arises because the light is not entirely confined to propagate within the fiber core, a portion of the optical energy propagates in the cladding. Its expression is given by:
Γ λ i = 0 2 π 0 a / 2 E r , φ , λ i 2 r d r d φ
where a is the core diameter, and the normalized transverse electric field E r , φ , λ i can be obtained by solving the Helmholtz eigenvalue equation. In summary, the ASE spectrum is jointly determined by the emission and absorption cross sections of the EDF. Both cross sections are temperature dependent, and this temperature dependence is one of the key causes of the thermal drift of the ASE source.
Because spontaneously emitted photons propagate in random directions, ASE components traveling opposite to the output direction are attenuated in single-pass forward (SPF) and single-pass backward (SPB) configurations. Consequently, single-pass ASE sources have much lower output power than double-pass configurations and are now rarely used.
In double-pass schemes, the backward configuration is relatively insensitive to the EDF length and provides stable spectra over a wide range of EDF lengths. By contrast, in the DPF configuration, the stability of the ASE output spectrum is more sensitive to the EDF length, and precise adjustment of the EDF length is required to achieve a highly stable spectrum [16]. Furthermore, several studies have adopted a double-stage dual-pump configuration [11,17,18]. Although this architecture offers various modifications and typically enables a broader ASE spectral width, it remains challenging for ASE sources to achieve both a wide bandwidth and high spectral stability simultaneously. Typically, the raw ASE spectrum is non-flat and asymmetric. Temperature changes alter the gain spectrum of the EDF, which in turn changes the power density of each ASE spectral component. Furthermore, a broader spectrum includes more frequency components. Temperature-induced changes in power density accumulate over a wider band. Therefore, ASE sources with excessively large bandwidths are more strongly affected by temperature.
In error-sensitive sensing systems such as FOGs, the benefit of spectral stability clearly outweighs that of an ultrabroad bandwidth. Narrowband filtering can effectively reshape the spectrum and significantly improve its stability, and it is also one of the most cost-effective approaches for spectral stabilization [4]. However, the spectral bandwidth of the double-pass backward (DPB) configuration is usually much larger than that of the DPF configuration, which leads to a rapid decrease in output power under narrowband filtering. Meanwhile, both double-pass configurations have an optimal EDF length, and the required EDF length for the DPF configuration is shorter [16,19], which is beneficial for integration in compact ASE sources. Table A2 in Appendix A summarizes the features of mainstream ASE-source optical path configurations that were studied in recent years. In summary, the DPF configuration offers high spectral stability and conversion efficiency, the lowest loss under narrowband filtering, and requires the shortest EDF. This makes it an excellent choice for realizing highly stable ASE sources with a compact structure.
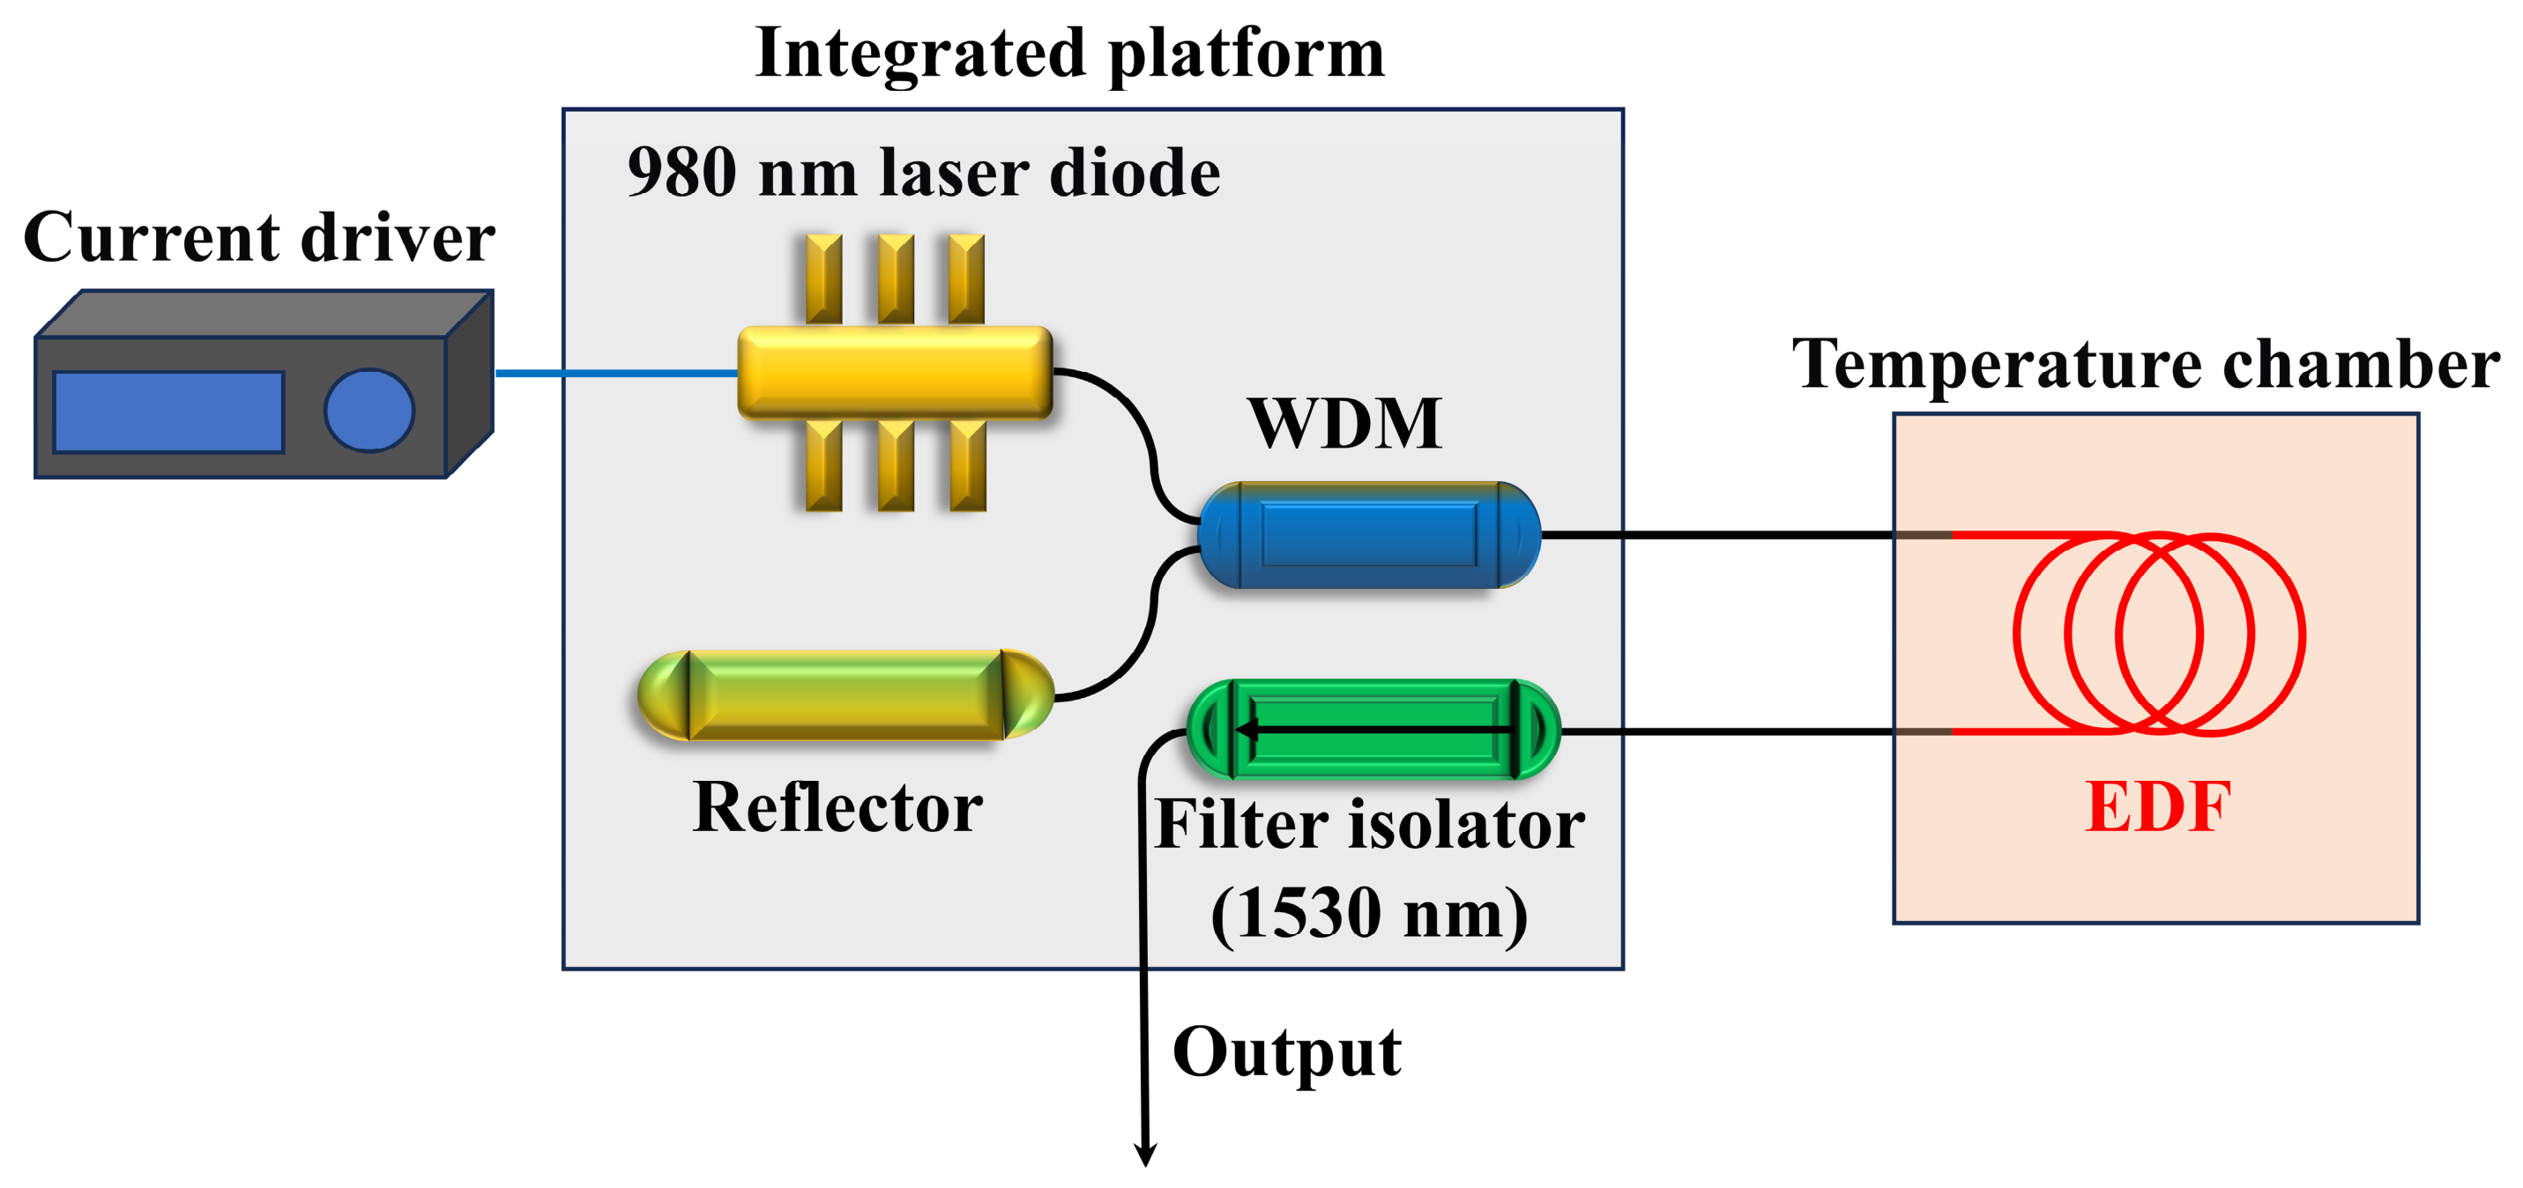
Therefore, under the premise of ensuring high reliability and stability of the ASE source, a DPF configuration combined with a narrowband filter has strong application potential for compact ASE sources. In this study, we therefore adopt a DPF configuration with a narrowband filter isolator (centered at 1530 nm) at the output end. Since this study only focuses on the thermal stability of the EDF, only the EDF was placed in the temperature chamber. The schematic of the experimental setup is shown in Figure 1.
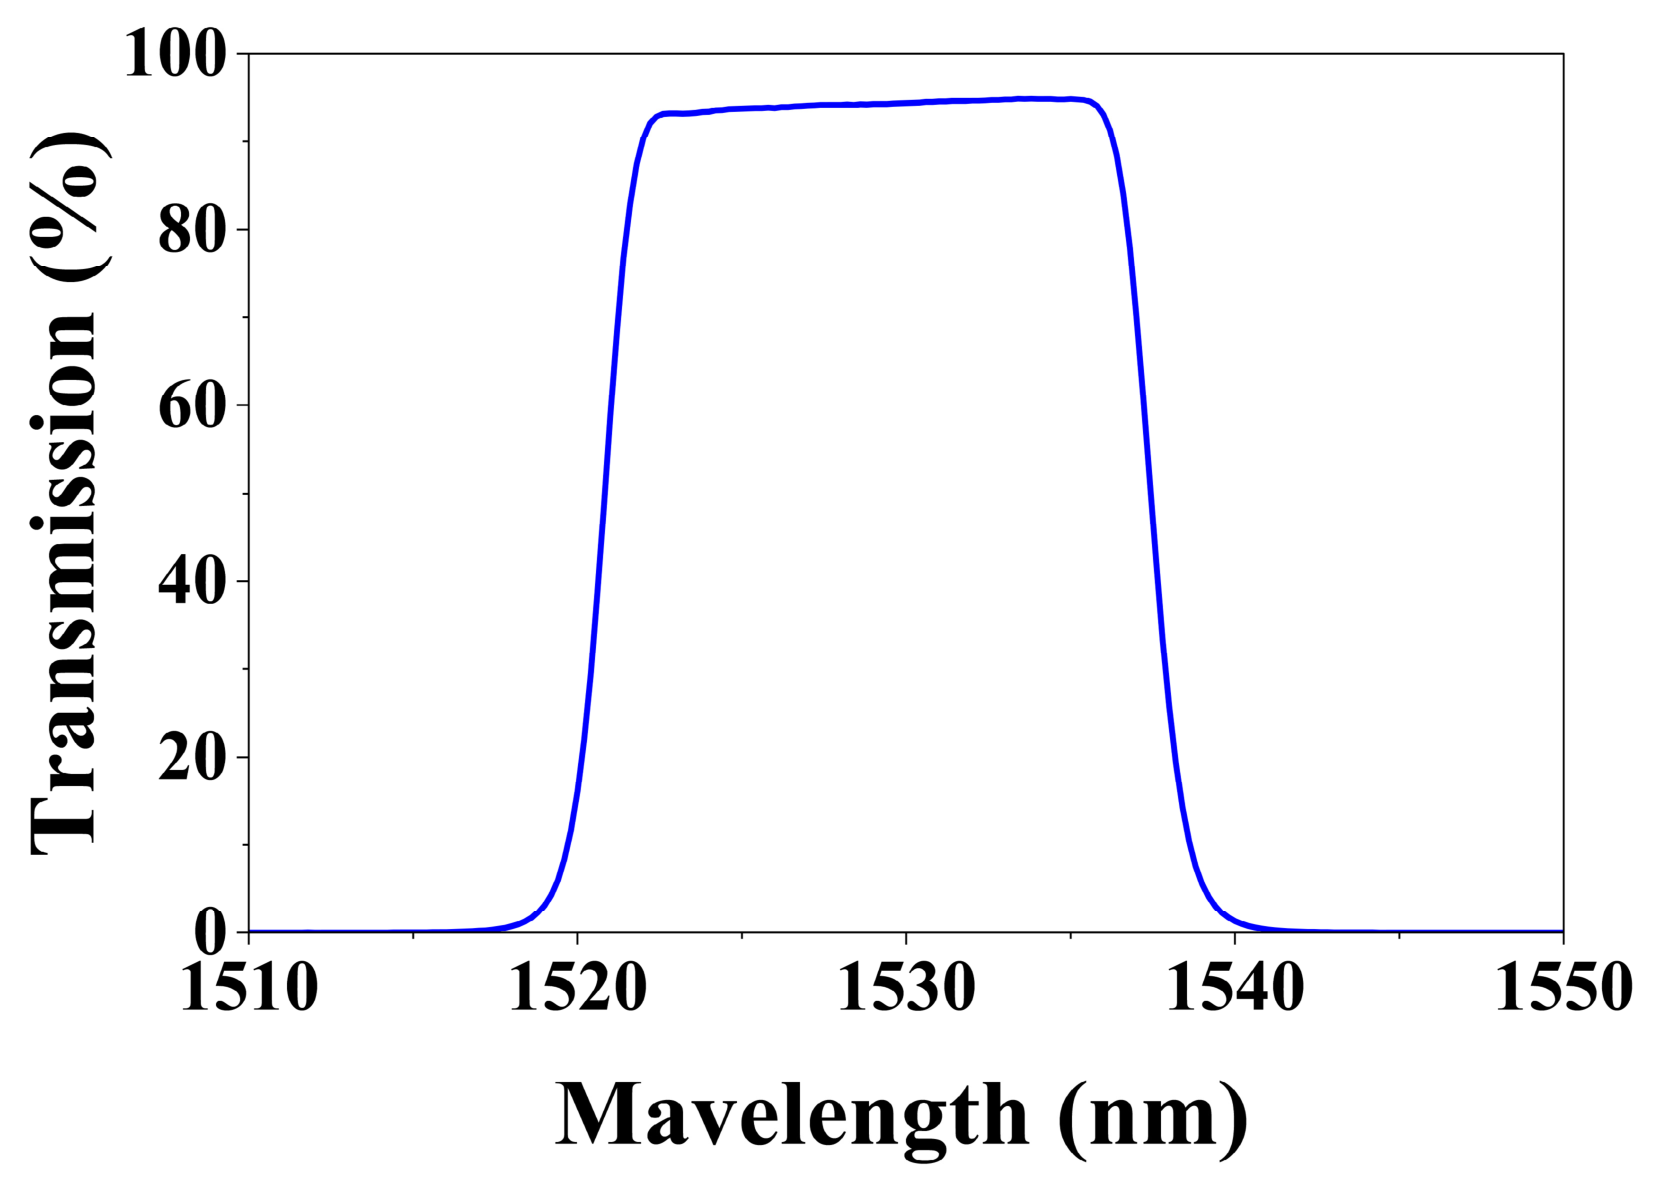
In this setup, the EDF is pumped by a 980 nm source. Erbium ions absorb the pump energy and are excited to higher energy levels, thereby forming a population inversion. Photons generated by spontaneous emission are continuously amplified in the gain medium during propagation. The backward-propagating light is reflected, converted into forward-propagating light, and then re-enters the EDF for further amplification. It is noteworthy that the reflected light first re-enters the EDF region close to the pump source. By adjusting the EDF length, the total gain can be maximized around 1530 nm, so that the ASE spectral power is concentrated near 1530 nm. In this case, the narrowband filtering centered at 1530 nm does not cause excessive loss of output power [20]. The forward-propagating ASE light then passes through a narrowband filter isolator with a center wavelength of 1530 nm and is delivered to the measurement equipment for analysis. The filter isolator is an integrated device that combines a filter and an isolator, suppressing self-oscillation while filtering and shaping the original ASE spectrum. Figure 2 shows the measured transmission spectrum of the filter isolator used in the experiment, which has an in-band transmittance of approximately 95%. The reflectivity of the reflector is about 85% (including the WDM insertion loss). The entire ASE source optical path is connected by fiber splicing to reduce overall optical loss.
Moreover, Equations (1) and (2) together form a set of (n + 1) differential equations, whose boundary conditions depend on the specific optical configuration. The boundary conditions for the DPF configuration are given by:
P A S E + 0 , λ i = P A S E 0 , λ i R P A S E L , λ i = 0 P p 0 = P 0
where L is the length of the EDF, P 0 is the pump optical power, and R is the reflectivity.
Meanwhile, as the gain medium of the ASE source, the EDF has a significant impact on its characteristics. Therefore, the development of high-performance EDFs has long been an engineering priority. The two mainstream doping techniques currently in use—namely the solution-doping (SD) method and the VPD method—are both based on the modified chemical vapor deposition (MCVD) process. After many years of optimization, the solution-doping method now provides the majority of commercially available RE doped fibers. Owing to its simple procedure and wide range of applicable dopants, the SD method remains the most widely used RE doping technique. In this process, a porous soot layer is first deposited by MCVD. The porous tube is then immersed in a prepared RE salt solution so that the RE ions can diffuse into the pore structure. The tube subsequently undergoes dehydration and consolidation and is finally collapsed to form a preform. However, due to the non-uniform pore sizes and their distribution in the deposited porous layer, the process still exhibits poor reproducibility and radial inhomogeneity of the dopant concentration in the preform, even when the process parameters are tightly controlled. These issues are particularly severe when a high RE doping concentration is required. In addition, in the SD method, the porous tube must be removed after the deposition process and subjected to multiple steps such as soaking and drying. During these procedures, the core region is directly exposed to the external environment, making it prone to contamination and structural defects [21].
Compared with the SD method, the VPD process deposits RE ions, co-dopants, and silica simultaneously. This leads to a more homogeneous dopant distribution in the glass and eliminates the core–cladding interface defects associated with solution doping [22]. Meanwhile, in situ doping significantly reduces the introduction of external impurities and OH [23]. Upconversion due to interactions between erbium ions is a key mechanism of fluorescence quenching. Its effect can be partly mitigated by precise waveguide structure optimization. However, quenching caused by erbium clustering at high dopant levels can only be addressed by reducing dopant concentration, using appropriate co-dopants (typically Al), and improving dopant-distribution uniformity [24]. The VPD process offers a significant advantage in this regard.
For a long time, the development of VPD was constrained by the lack of suitable liquid precursors for RE elements at room temperature. The sublimation temperature of RE halides exceeds 800 °C, which makes it difficult to obtain vapor with sufficient pressure. In 1990, R. P. Tumminelli et al. used organic chelates as precursors in a VPD process to fabricate fibers with high RE doping concentrations, laying the foundation for the modern VPD technique [25]. However, chelates can generate sufficient vapor at around 200 °C but decompose rapidly at higher temperatures.
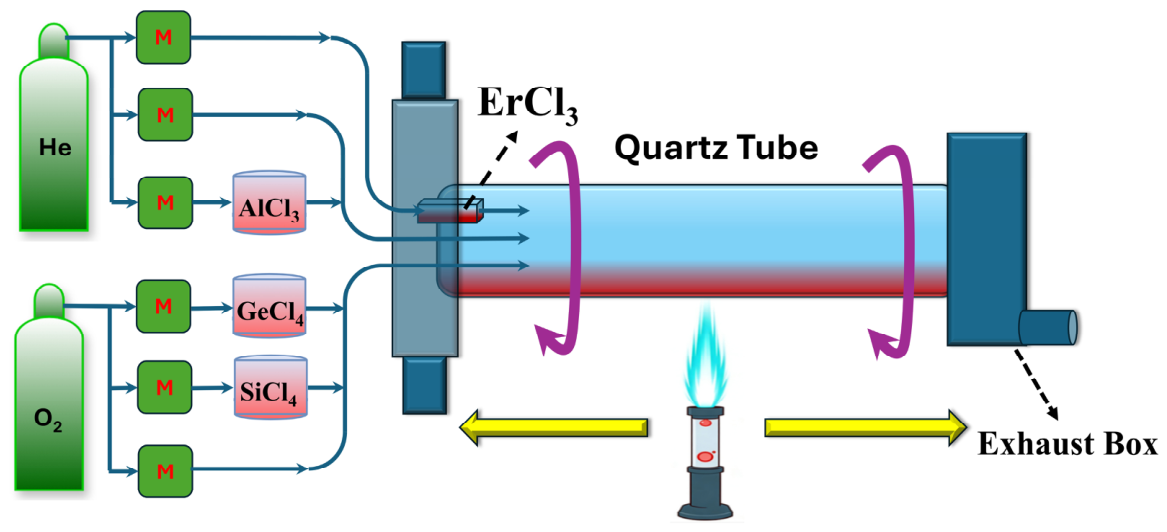
In this study, a VPD process based on an inorganic metal precursor, anhydrous erbium chloride (with a sublimation temperature exceeding 850 °C), was employed. To prevent the precursors from condensing in the delivery lines and causing blockages, the MCVD system was appropriately modified. Each precursor is delivered to the reaction zone through an independent conduit. A simplified schematic of the process is shown in Figure 3, and the reactions proceed as described in Equations (7)–(10).
S i C l 4 + O 2 = S i O 2 + 2 C l 2
G e C l 4 + O 2 = G e O 2 + 2 C l 2
4 A l C l 3 + 3 O 2 = 2 A l 2 O 3 + 6 C l 2
4 E r C l 3 + 3 O 2 = 2 E r 2 O 3 + 6 C l 2
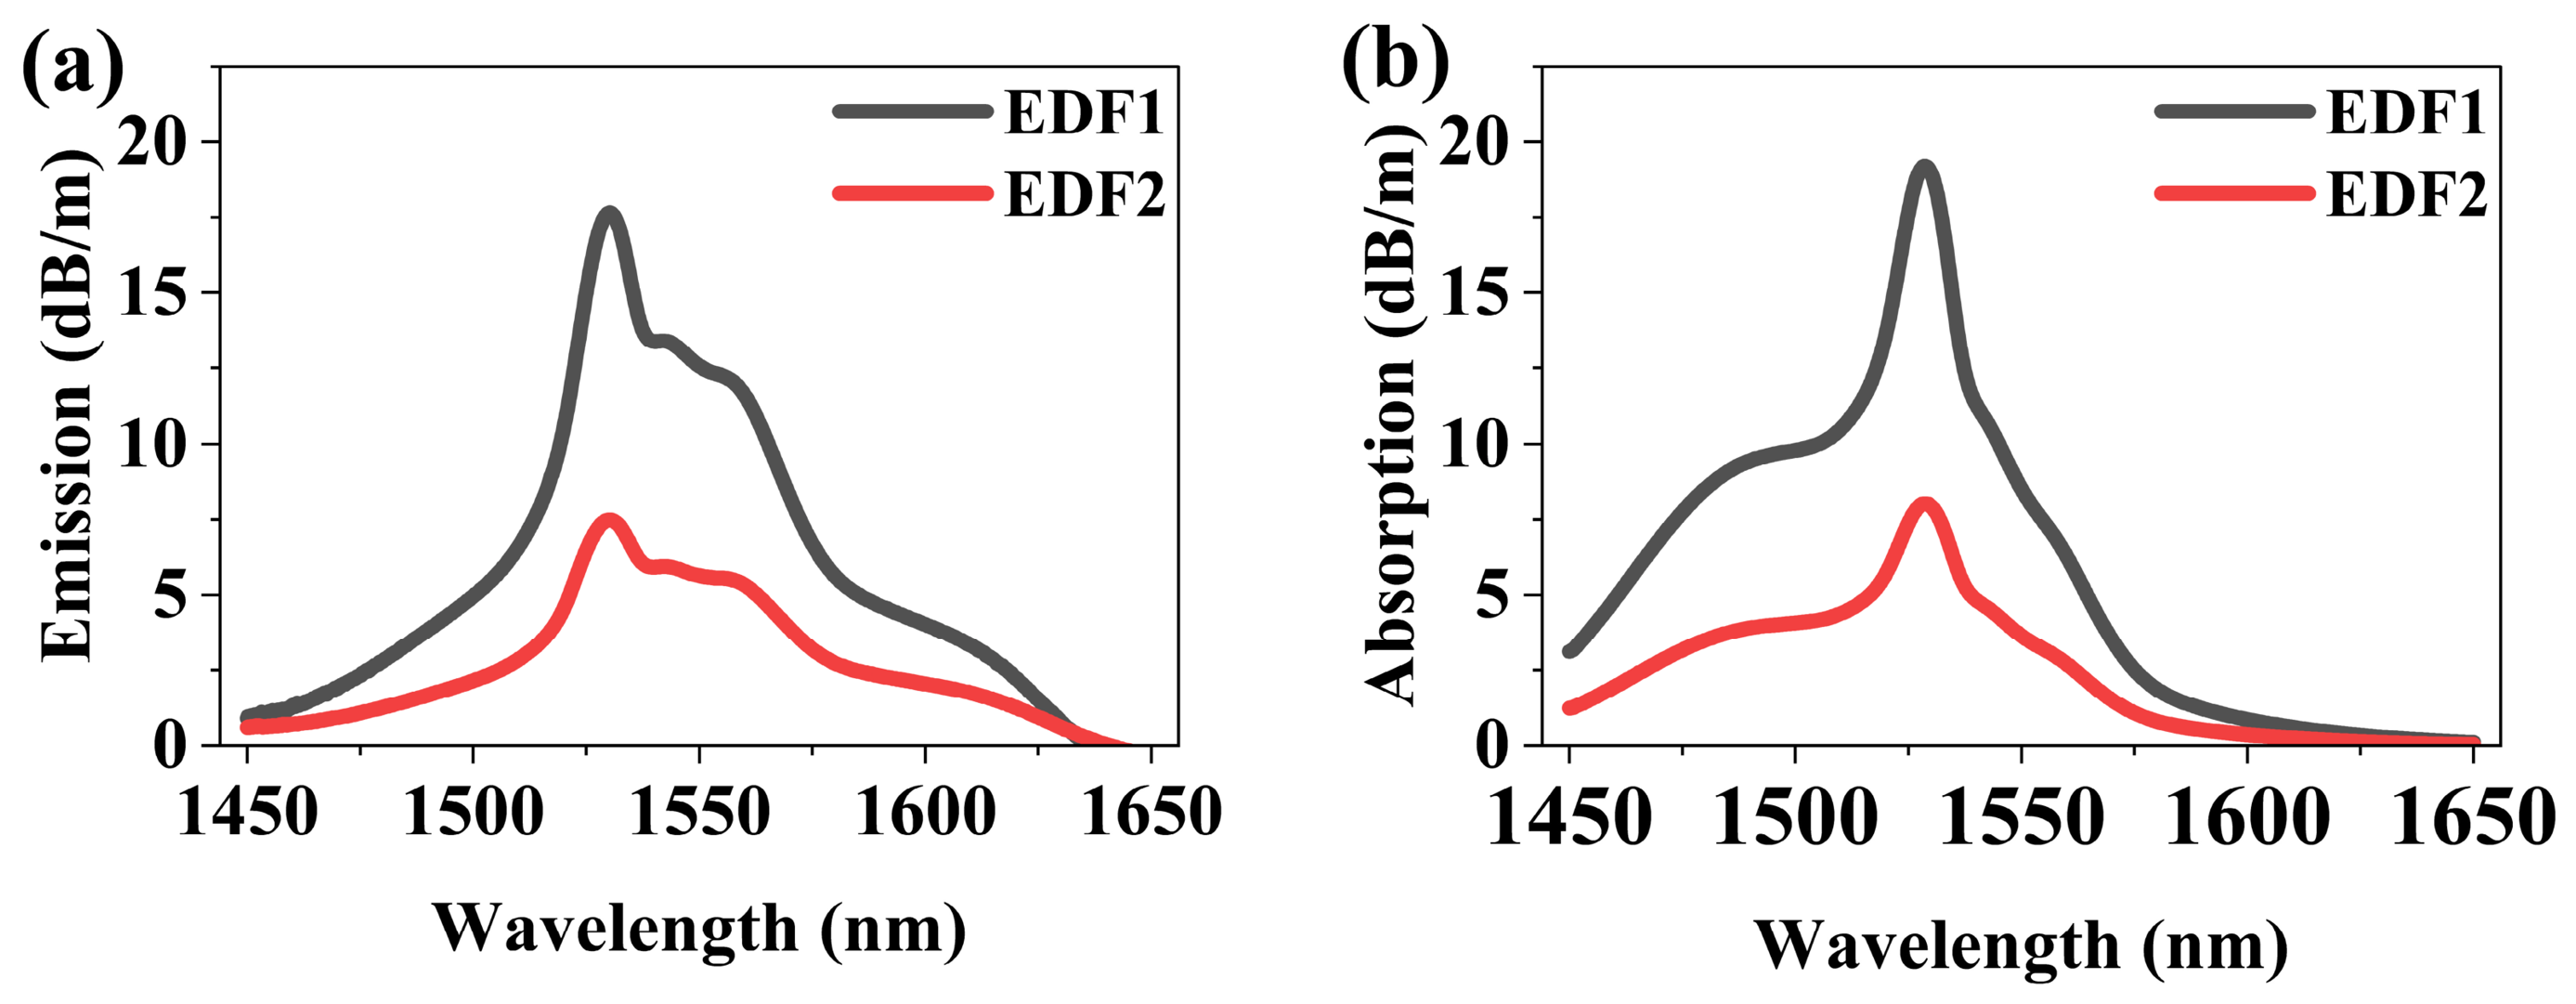
In the VPD process, the dopant concentration is controlled by the carrier-gas flow rate and the sublimator temperature, which allows for precise realization of the target doping level and core refractive index. To compare the ASE output characteristics of differently designed EDFs within the same optical path, the commercially available M12 980/125 fiber (sourced from Fibercore Ltd., Southampton, UK) fabricated by the SD method was employed as EDF1. In addition, a low-doped EDF with an 80 μm cladding was fabricated using the VPD process and used as EDF2. Table 1 lists their key parameters and Figure 4 shows the emission and absorption spectra of the two EDFs.
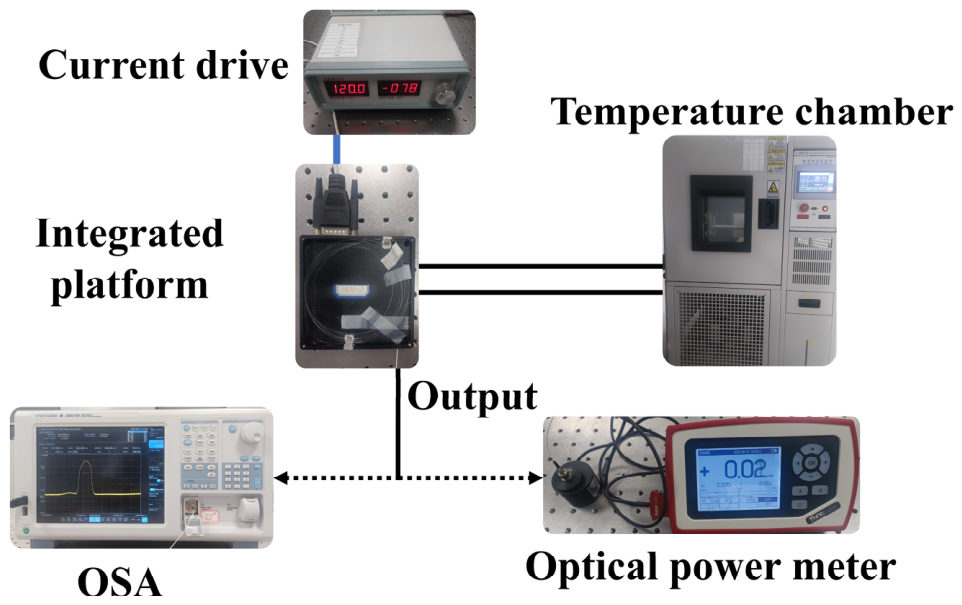
During the temperature drift experiments, the pump power was kept at 66.1 mW. Only the EDF was placed in the temperature chamber (ATH-80L-6D, sourced from Dongguan Aibo Instrument Equipment Co., Ltd., Dongguan, China) and coiled into 60 mm loops. All other components in the optical path were kept outside the chamber and at room temperature. The chamber temperature was raised from −50 °C to 75 °C, and this range was divided into 15 measurement points at 5 °C or 10 °C intervals. Once the temperature inside the chamber stabilized at each target point, an optical spectrum analyzer (OSA, Yokogawa AQ6370D, sourced from Yokogawa Electric Co., Ltd., Musashino, Japan) and an optical power meter (Thorlabs PM100D, sourced from Thorlabs, Inc., Newton, NJ, USA) were used to collect the spectral and power data of the ASE source, respectively. For convenience during the experiment, all optical components were integrated into a single platform. Figure A1 and Figure A2 in Appendix A show a photograph and a schematic diagram of the experimental setup. Because of the narrowband filter, the output spectrum has no secondary peaks; thus the spectral width is defined as the 3-dB bandwidth. The mean wavelength is defined as:
λ ¯ = P A S E λ i λ i P A S E λ i
where P A S E λ i is the power in the sampled spectral interval centered at λ i .
Ten repeated measurements showed that the range of the mean wavelength (maximum minus minimum) was less than 0.01 nm, and the normalized range (range divided by the average of the ten measurements) was less than 0.7 ppm. The normalized range of the output power was less than 1%. These results indicate that the experimental protocol is highly reliable and repeatable.

3. Experimental Results and Discussion

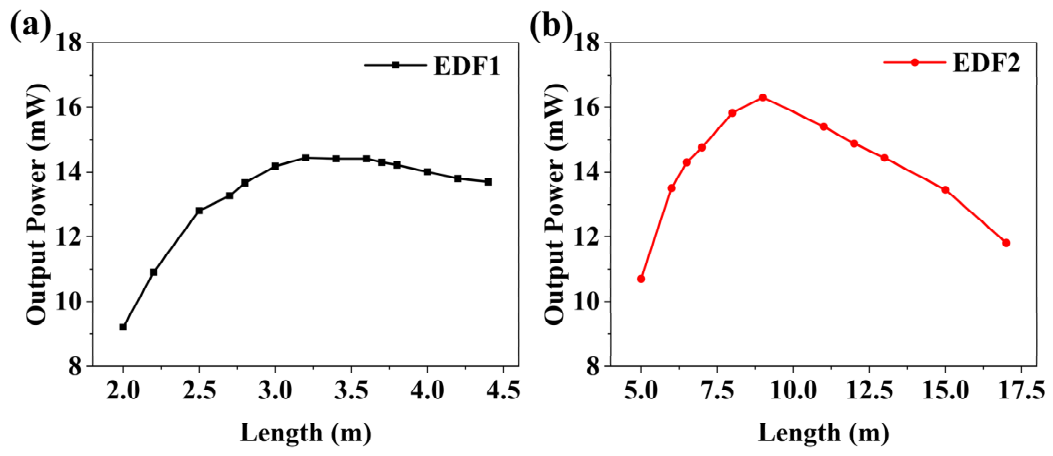
As shown in Figure 5, we measured the output power of ASE sources utilizing two EDF types at different lengths under a pump power of 66.1 mW at room temperature. Due to its lower doping concentration, EDF2 required a longer length than EDF1. Each EDF exhibited an optimal length for maximum ASE output power. When the EDF was too short, the entire EDF was strongly pumped so that the ASE spectrum was dominated by the 1530 nm peak. As the EDF length increased, the output power of the ASE source gradually rose [26]. Conversely, when the EDF was too long, signal saturation and pump depletion led to a low inversion region at the tail end of the EDF. In this case, the energy around 1530 nm was reabsorbed in the tail section by abundant ground-state erbium ions. Meanwhile, the gain at 1560 nm began to increase, and the loss in the EDF gradually rose [20]. The maximum ASE source output powers were 14.44 mW for 3.2 m EDF1 and 16.31 mW for 9.0 m EDF2.
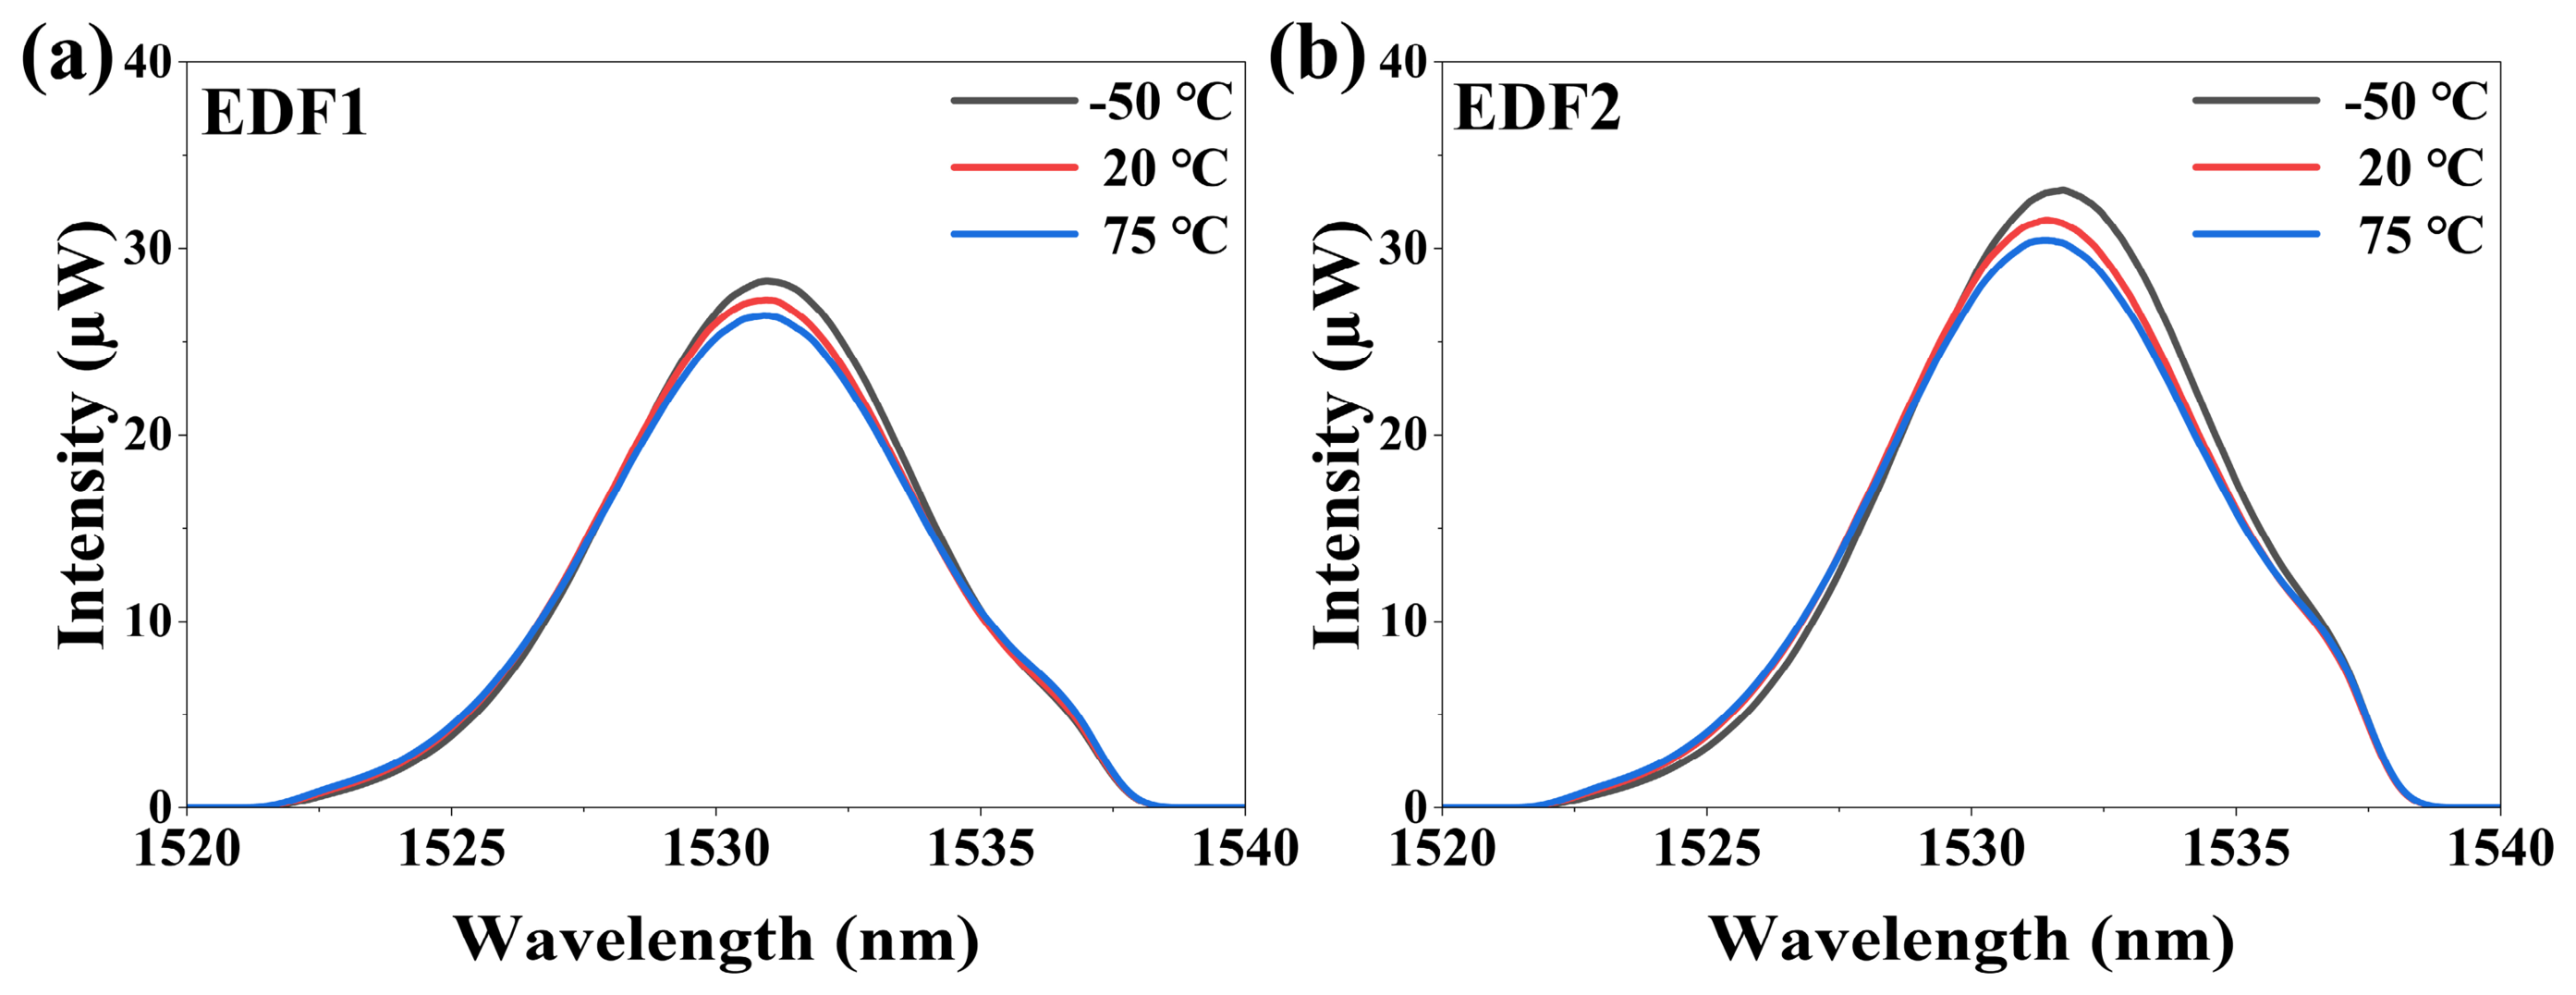
Figure 6 shows the output spectra of ASE from EDF1 (3.2 m) and EDF2 (9.0 m) at different temperatures. The raw ASE light generated by the EDFs was filtered through a narrowband filter isolator, resulting in symmetric, near-Gaussian output spectra. In fact, the narrowband filtering process eliminates the sharp peaks and relaxation oscillations present in the raw ASE spectrum, which effectively suppresses edge noise and parasitic interference. This effectively enhances the thermal stability of the output spectrum and contributes to reducing the nonlinearity of the scale factor in FOGs [4,27]. Meanwhile, the output ASE spectra of both EDFs exhibited relatively stable shapes over the full temperature range of −50 °C to 75 °C. These results demonstrate that the optical path can maintain a well-defined Gaussian spectral output over a wide temperature range without exhibiting spectral distortion, indicating that the proposed scheme can achieve highly stable spectral output in practical applications.
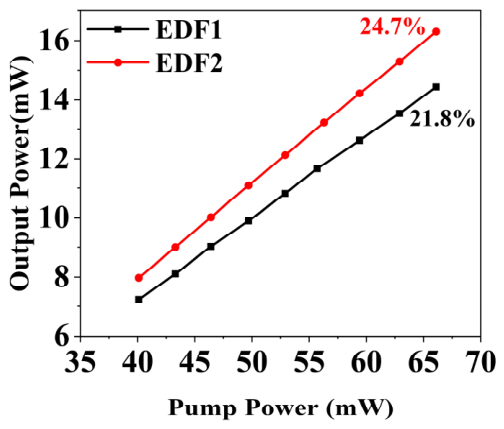
The relationship between the output power of the ASE source and the pump power was further characterized separately using 3.2 m EDF1 and 9.0 m EDF2, with the results shown in Figure 7. In this optical configuration, the output power of the ASE source utilizing EDF2, with its low doping concentration, was significantly higher than that utilizing EDF1, demonstrating a higher signal-to-noise ratio and conversion efficiency. This is attributed to the cluster effect among erbium ions in the heavily doped EDF1, where these clustered erbium ions absorb and waste both pump photons and ASE photons [28,29]. Even a small fraction of erbium ion clusters can significantly reduce the conversion efficiency, and this effect becomes more pronounced at high doping concentrations [21]. As a result, the ASE source using the low-doped EDF2 offers a significant advantage in terms of conversion efficiency and signal-to-noise ratio. When the pump power was 66.1 mW, the conversion efficiencies of EDF1 and EDF2 were 21.8% and 24.7%, respectively.
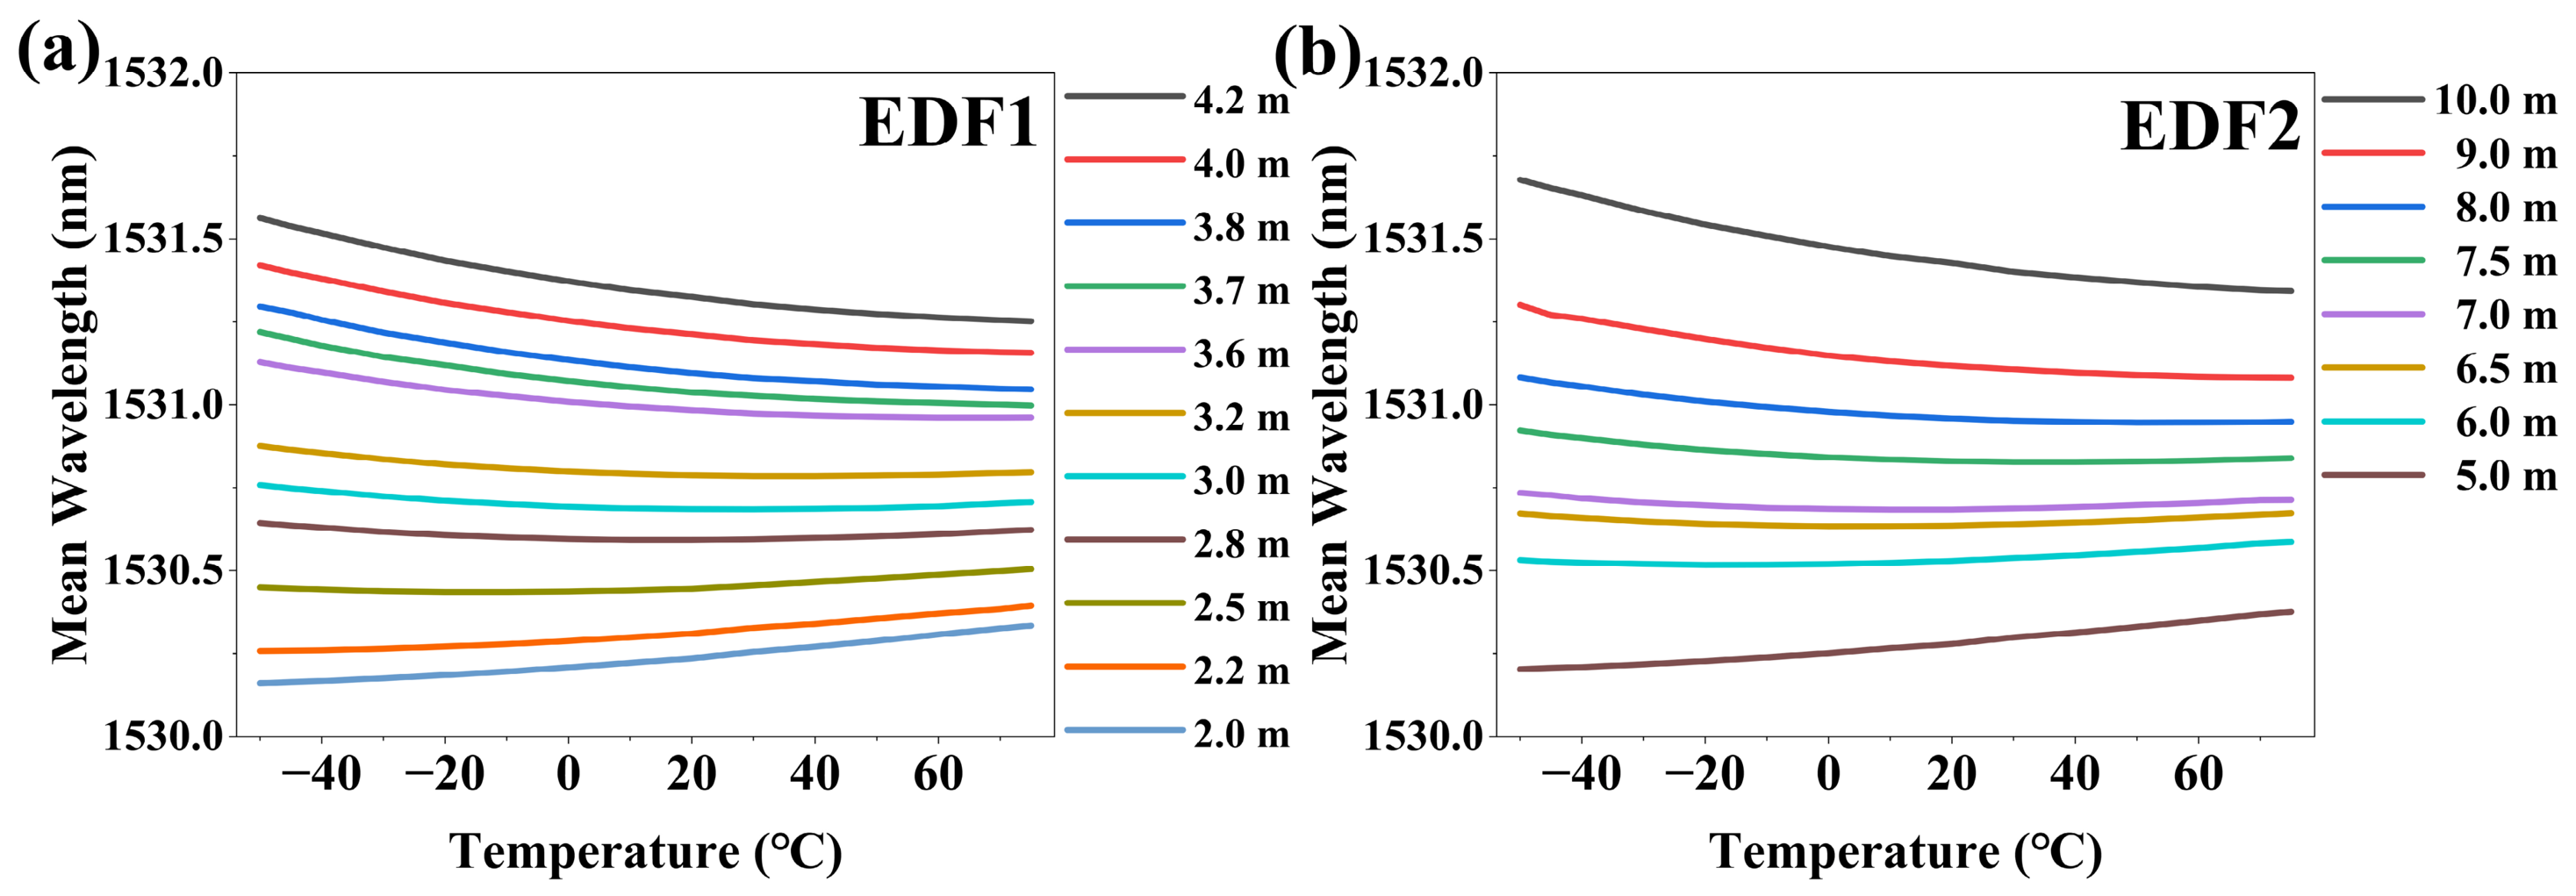
Figure 8 shows the relationship between temperature and mean wavelength of ASE sources utilizing the two EDFs at different lengths in this optical setup. When the pump source cannot provide sufficient energy for the entire EDF length, the ASE light generated near the pump end is reabsorbed by the distal portion of the EDFs as a secondary pump source [15]. Figure 8 also reveals that the mean wavelength as a function of temperature exhibits a minimum point, consistent with previous reports [30]. Furthermore, as the EDF length decreases, the temperature at which this minimum occurs shifts to lower values, accompanied by a change in the variation range of the curve within the temperature interval.
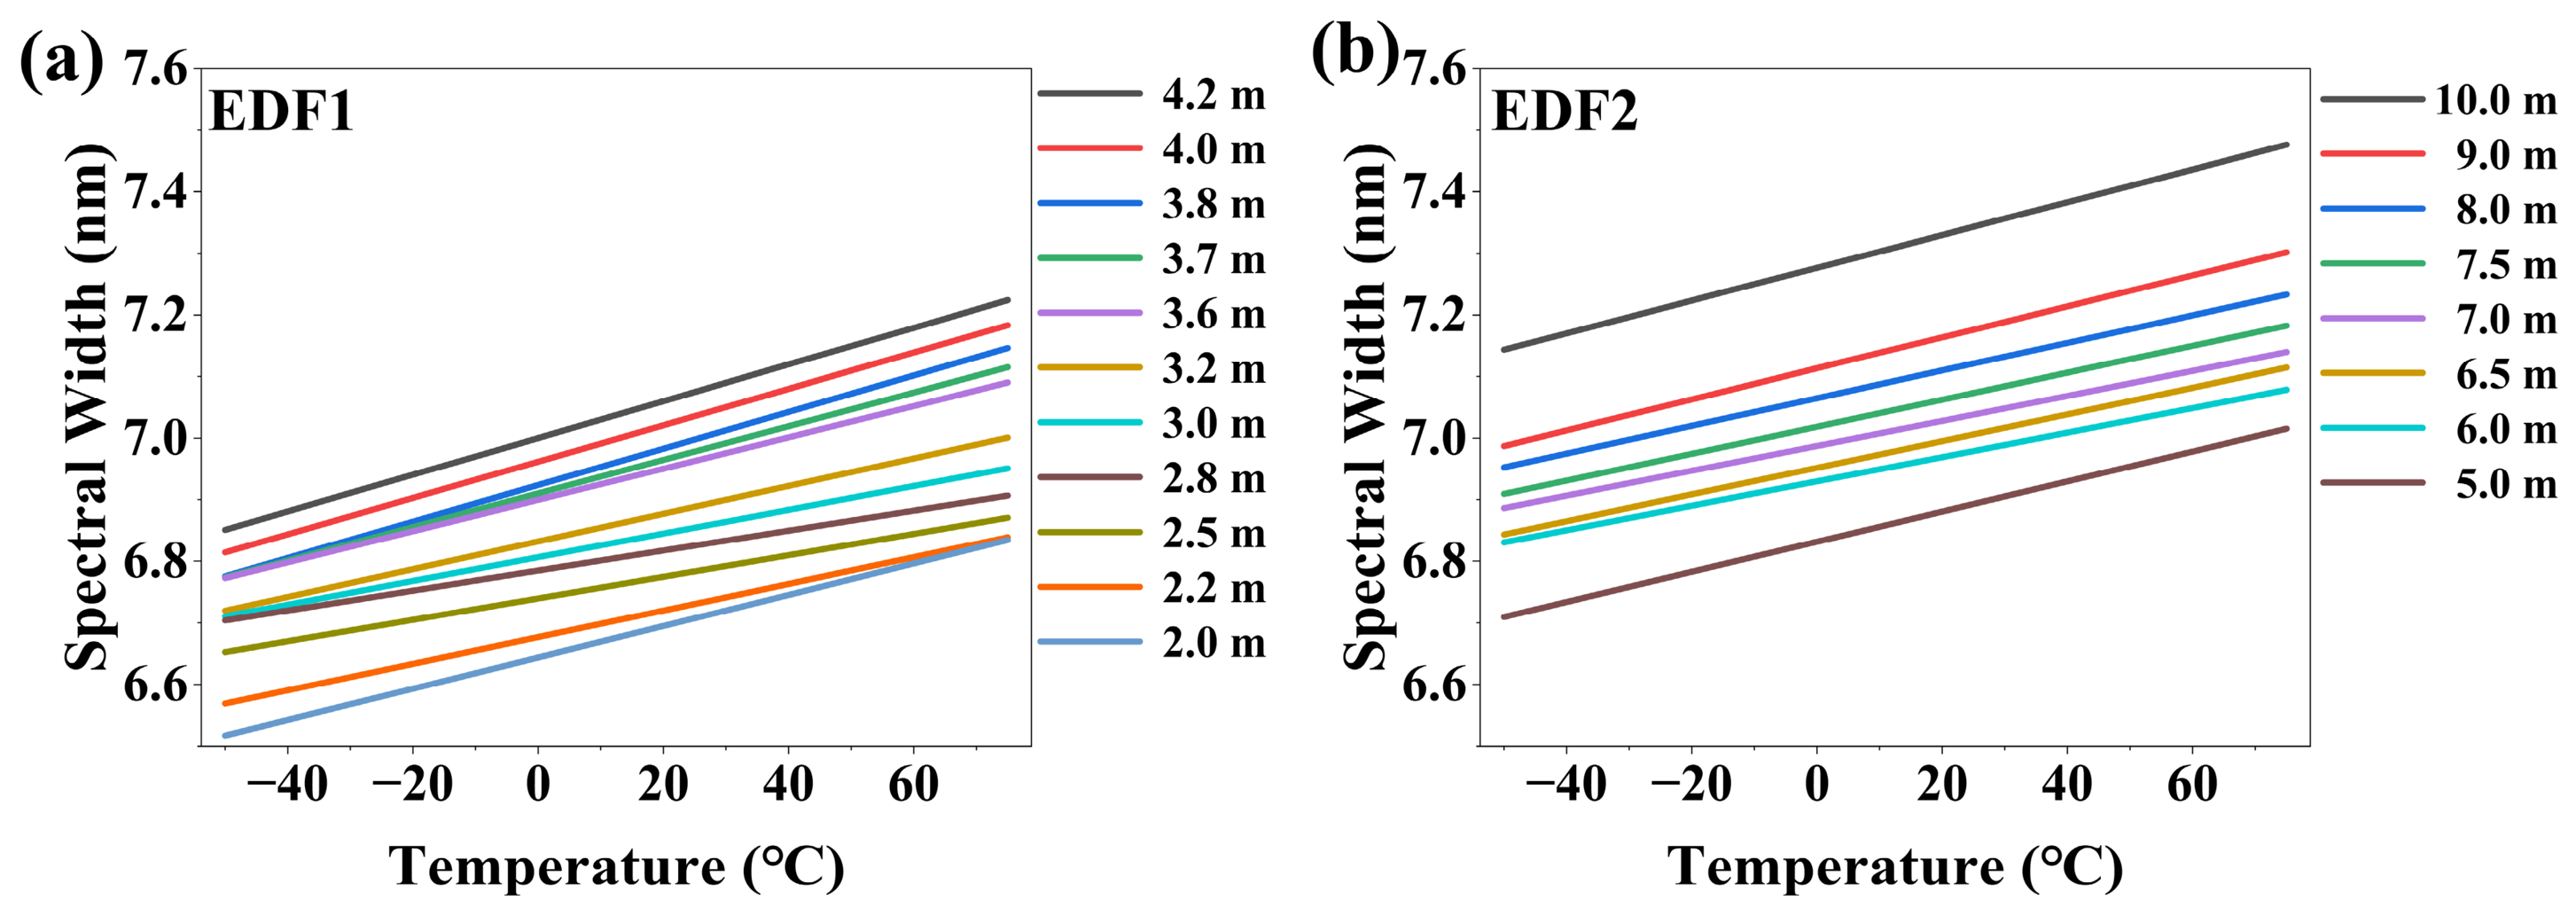
Figure 9 illustrates the variation in the 3-dB bandwidth of ASE sources with temperature when utilizing different lengths of EDF1 and EDF2. For both ASE sources, the spectrum width decreases as EDF length shortens at a given temperature. Moreover, the spectrum width increases approximately linearly with temperature. Notably, the lower-doped EDF2 achieves a generally broader spectrum width than the highly doped EDF1. This characteristic helps suppress various types of optical noise [31,32,33]. Furthermore, similar to the mean wavelength behavior discussed in Figure 8, the temperature drift of the spectrum width is also dependent on the EDF length.
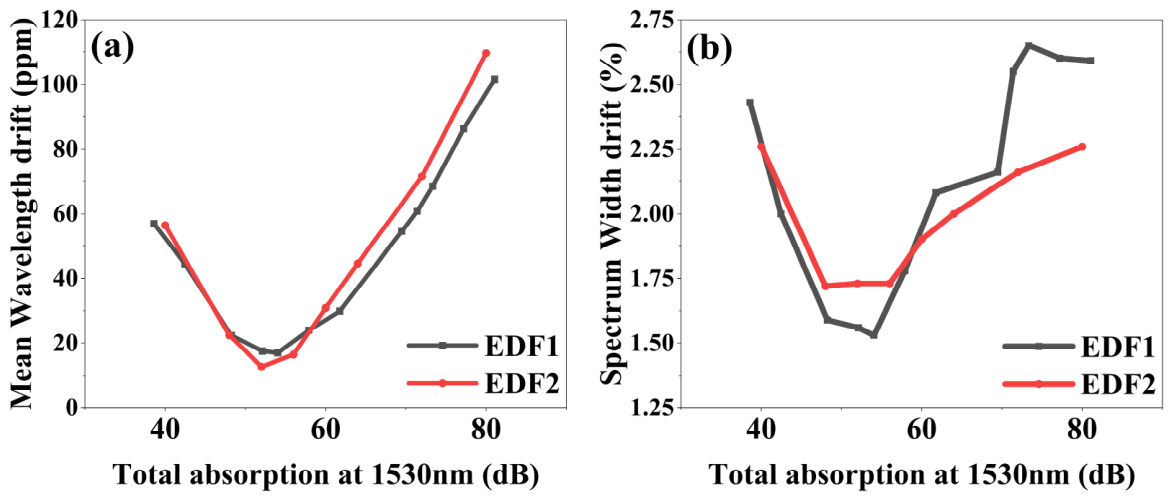
As discussed, the temperature drifts of both the mean wavelength and the spectral width depend on the EDF length. Figure 10 illustrates these drifts for ASE sources utilizing EDF1 and EDF2 under various levels of total absorption at 1530 nm, where total absorption is defined as the absorption per meter at 1530 nm multiplied by the EDF length. For each EDF, both drifts exhibited a minimum. Notably, under the present experimental conditions, when the total absorption at 1530 nm reached approximately 53 dB for the two EDFs (despite their differing parameters), both drifts concurrently reached relatively low levels. Specifically, for EDF1 with a length of 2.8 m, the mean wavelength temperature drift attained its minimum value of 17.0 ppm, with a spectral width temperature drift of 1.53%. Similarly, for EDF2 with a length of 6.5 m, the mean wavelength temperature drift reached its respective minimum of 12.8 ppm, with a spectral width temperature drift of 1.73%.
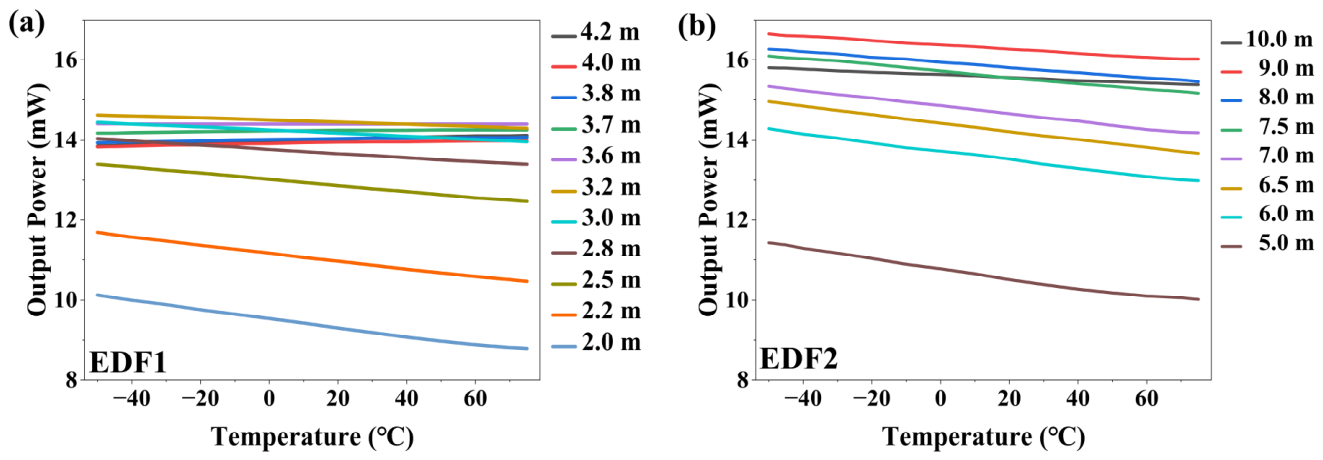
Figure 11 illustrates the output power of ASE sources utilizing EDF1 and EDF2 at different lengths across varying temperatures. Clearly, for both EDFs, the temperature drift of ASE output power varies with length. The small-cladding, low-doped EDF2 maintains an ASE output power above 16 mW across the entire temperature range when its length is 9 m. Meanwhile, the high-doping-concentration EDF1 shows almost no change in ASE output power over the temperature range when its length is 3.6 m. Furthermore, it can be observed in Figure 11a that for EDF1 lengths exceeding 3.6 m, the ASE output power increases with temperature. In fact, within this optical setup, changes in output power are influenced by two main factors. Theoretically, within a certain temperature range, an increase in temperature shortens the fluorescence lifetime of erbium ions and reduces the absorption coefficient at 980 nm [34], which would typically cause the ASE output power to decrease approximately linearly with rising temperature.
However, because a filter is present in the optical path, the entire ASE spectrum generated by the EDF is filtered and reshaped, retaining only the 1530 nm peak. As the EDF length increases, the energy of the original ASE spectrum at the 1530 nm peak is gradually absorbed, while the 1560 nm peak begins to grow [13], thus more spectral energy falls into the filter stopband. Conversely, when temperature rises, the overall ASE spectrum shifts toward shorter wavelengths. This shift moves more ASE energy from the filter’s stopband into its passband, preserving a larger portion of the original spectral energy. When these two effects combine, the ASE output power of excessively long EDFs can increase with rising temperature. In fact, EDF2 exhibited this phenomenon when its length exceeded 13 m.
Experimental results show that the ASE output power of highly doped EDF1 was less affected by temperature than that of low-doped EDF2. However, due to erbium clustering at high concentrations, the maximum ASE output power of EDF1 was significantly lower than that of EDF2. Furthermore, by adjusting the EDF length, a light source with a relatively low temperature drift can be obtained, which is crucial for improving the accuracy of FOGs. When the lengths of EDF1 and EDF2 were 2.8 m and 6.5 m, respectively, they achieved their minimum mean wavelength temperature drifts, corresponding to 17.0 ppm and 12.8 ppm. At these lengths, the temperature stability of ASE output power for the high-doping EDF1 was slightly better than that of EDF2, but the mean wavelength drift of EDF2 was significantly lower than that of EDF1. This can substantially enhance the scale factor stability of FOGs [4]. Additionally, the 80 µm-cladding EDF2 offers a lighter weight, smaller volume, and longer mechanical lifetime at small coil diameters [35,36], making it more suitable for compact ASE sources. The detailed temperature-drift data are presented in Table 2.
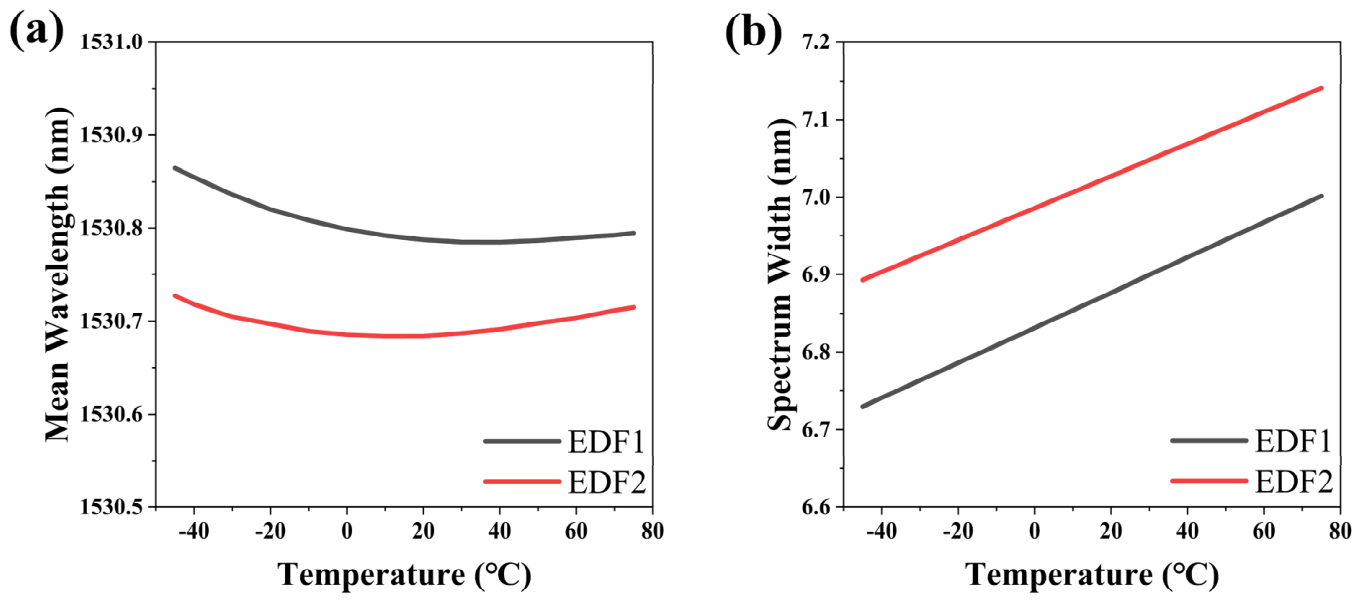
Furthermore, in practical applications, the EDF length corresponding to the highest output power is often selected to achieve a high signal-to-noise ratio. For EDF1, the maximum filtered ASE output power of 14.44 mW was obtained with a 3.2 m length. Benefiting from the high ASE output power of its low doping concentration, an appropriate length for EDF2 can be chosen that provides both higher output power than EDF1 and a more stable output spectrum. For instance, when the length of EDF2 was 7.0 m, the output power was 14.76 mW. The ASE output characteristics of both EDFs at these lengths are summarized in Table 3 and illustrated in Figure 12. It can be observed that the 7.0 m EDF2 outperforms the 3.2 m EDF1 in output power, spectral width, mean wavelength temperature drift, and spectral width temperature drift.

4. Conclusions

In summary, within the experimental optical setup, we observed that when the total absorption at 1530 nm for EDFs with varying parameters is approximately 53 dB, the temperature drift of both the mean wavelength and the 3-dB spectrum width concurrently reaches a relative minimum. This finding enables rapid determination of EDF lengths corresponding to low temperature drift by calculating total absorption. In addition, the low-doping-concentration, 80 μm-cladding EDF fabricated via VPD process achieved a conversion efficiency of 24.7% and a maximum ASE output power of 16.3 mW at a length of 9.0 m, while exhibiting a minimum mean wavelength temperature drift of 0.102 ppm/°C at 6.5 m. Most importantly, because of its high output, this 80 μm-cladding EDF allows selection of an optimized length that delivers a thermally stable output spectrum while maintaining a required signal-to-noise ratio. These advantages make it particularly well suited for applications in miniaturized optical devices. These results demonstrate that, through coordinated optimization of the optical configuration and EDF parameters, it is possible to achieve high spectral stability in a compact ASE source while maintaining structural simplicity. This study experimentally demonstrates the application potential of VPD in producing high-performance EDFs. It also provides an important foundation for fiber-level optimization strategies aimed at next-generation compact ASE sources.

Author Contributions

Conceptualization, W.X.; methodology, W.X.; software, J.L.; formal analysis, W.X. and J.G.; investigation, J.G. and W.L. (Wenbin Lin); resources, W.X. and J.G.; data curation, J.L. and W.L. (Wei Liu); writing—original draft preparation, J.L.; writing—review and editing, J.G., J.C. and C.H.; visualization, J.C. and C.H.; supervision, W.L. (Wenbin Lin); project administration, W.X. All authors have read and agreed to the published version of the manuscript.

Funding

This work was partially funded by the Natural Science Foundation of Hunan Province (Grant No. 2025JJ60405) and the Fund of the University of South China (Grant No. 231RGC011).

Institutional Review Board Statement

Not applicable.

Informed Consent Statement

Not applicable.

Data Availability Statement

Data is contained within the article.

Conflicts of Interest

The authors declare no conflicts of interest.

Appendix A

Table A1. Comparison between the proposed method and other published methods.
MethodMean Wavelength Drift (ppm/°C)Spectral Width (nm)Configuration
Proposed method0.1026.8DPF incorporating a narrow-band filter
Method No. 1 [13]1.310DPB incorporating a thermal management unit
Method No. 2 [19]0.0776DPF using photonic crystal fiber
Method No. 3 [37]0.6715DPB incorporating a broadband fiber grating
Method No. 4 [10]0.712double-stage dual-pump
Method No. 5 [11]0.3216.5double-stage dual-pump
Method No. 6 [6]0.0092SPB incorporating an ultra-narrow-band filter
Table A2. Comparison of mainstream ASE source configuration characteristics.
ConfigurationMain FeaturesAdvantagesDisadvantages
Single-pass(1) No ASE light reflection(1) Simplest structure(1) Very long EDF
(2) No reamplification of reflected ASE light(2) Lowest cost(2) Low conversion efficiency
Double-pass forward(1) Output in the same direction as the pump light(1) High conversion efficiency(1) sensitive to the EDF length
(2) ASE light reflection and reamplification(2) Less loss under narrowband filtering(2) Risk of self-oscillation
(3) Shortest EDF(3) Narrower spectral width
(4) High spectral stability
Double-pass backward(1) Output in the opposite direction to the pump light(1) Insensitive to the EDF length(1) Slightly longer EDF
(2) ASE light reflection and reamplification(2) High conversion efficiency(2) Larger loss under narrowband filtering
(3) High spectral stability
(4) Broader spectral width
Double-stage dual-pump(1) Two pump sources(1) Flatter spectrum(1) Larger size
(2) Two segments of EDF with different parameters(2) Easy to adjust the spectral shape(2) Extremely long EDF
(3) Many novel variant configurations(3) Capable of generating an ultra-broadband spectrum(3) Overly complex structure
Figure A1. Photos of the experimental setup.
Photonics 13 00424 g0a1
Figure A2. Schematic diagram of the experimental setup.
Photonics 13 00424 g0a2

References

  1. Zakirov, R.; Umarov, A. Fiber optic gyroscope and accelerometer application in aircraft inertial system. In Proceedings of the 2020 International Conference on Information Science and Communications Technologies (ICISCT), Tashkent, Uzbekistan, 4–6 November 2020; pp. 1–3. [Google Scholar]
  2. Ciminelli, C.; Dell’Olio, F.; Campanella, C.E.; Armenise, M.N. Photonic technologies for angular velocity sensing. Adv. Opt. Photonics 2010, 2, 370–404. [Google Scholar] [CrossRef]
  3. Zuo, W.; Yan, M.; Song, C.; Hu, X. High flat C+ L band broad spectrum ASE light source for high precision fiber optic gyroscope. In Proceedings of the AOPC 2022: Optical Sensing, Imaging, and Display Technology, Beijing, China, 18–22 July 2022; pp. 535–540. [Google Scholar]
  4. Lefèvre, H. The Fiber-Optic Gyroscope, 3rd ed.; Artech House: Boston, MA, USA, 2014; pp. 7–48, 202–210. [Google Scholar]
  5. Aubry, M.; Mescia, L.; Morana, A.; Robin, T.; Laurent, A.; Mekki, J.; Marin, E.; Ouerdane, Y.; Girard, S.; Boukenter, A. Temperature Influence on the Radiation Responses of Erbium-Doped Fiber Amplifiers. Phys. Status Solidi A 2021, 218, 2100002. [Google Scholar] [CrossRef]
  6. Xie, L.; Gong, X.; Zhang, B.; Fan, X.; Zhang, C. Research on temperature dependent mean wavelength stability of Erbium-doped fiber super fluorescent source for fiber optic gyroscopes. In Proceedings of the AOPC 2017: Fiber Optic Sensing and Optical Communications, Beijing, China, 4–6 June 2017; pp. 388–393. [Google Scholar]
  7. Song, N.; Xu, X.; Zhang, Z.; Gao, F.; Wang, X. Advanced Interferometric Fiber Optic Gyroscope for Inertial Sensing: A Review. J. Light. Technol. 2023, 41, 4023–4034. [Google Scholar] [CrossRef]
  8. Dell’Olio, F.; Natale, T.; Wang, Y.-C.; Hung, Y.-J. Miniaturization of interferometric optical gyroscopes: A review. IEEE Sens. J. 2023, 23, 29948–29968. [Google Scholar] [CrossRef]
  9. Akbaş, E.E.; Yertutanol, A.; Andaç, T.; Özbay, E.; Azizian-Kalandaragh, Y. Optimization of ASE Light Source Design for Enhancement of Wavelength Stability. In Proceedings of the 2023 IEEE Sensors, Vienna, Austria, 29 October–1 November 2023; pp. 1–4. [Google Scholar]
  10. Vostrikov, E.; Kikilich, N.; Zalesskaya, Y.; Aleinik, A.; Smolovik, M.; Deyneka, I.; Meshkovskii, I. Stabilisation of central wavelength of erbium-doped fibre source as part of high-accuracy FOG. IET Optoelectron. 2020, 14, 218–222. [Google Scholar] [CrossRef]
  11. Kikilich, N.; Aleinik, A.; Pogudin, G.; Vostrikov, E.; Smolovik, M.; Vinogradov, A.; Zalesskaia, I.; Motorin, E. Stabilization of the mean wavelength of an erbium-doped fiber source as part of high-accuracy FOG with increased spectrum width. Appl. Opt. 2022, 61, 6827–6833. [Google Scholar] [CrossRef]
  12. Li, M.; Sun, Y.; Gao, S.; Zhao, X.; Hui, F.; Luo, W.; Hu, Q.; Chen, H.; Wu, H.; Wang, Y.; et al. Navigation-grade interferometric air-core antiresonant fibre optic gyroscope with enhanced thermal stability. Nat. Commun. 2025, 16, 3449. [Google Scholar] [CrossRef] [PubMed]
  13. Wan, H.; Zhang, D.; Sun, X. Stabilization of a superfluorescent fiber source with high performance erbium doped fibers. Opt. Fiber Technol. 2013, 19, 264–268. [Google Scholar] [CrossRef]
  14. Tsai, S.-C.; Lee, C.-M.; Hsu, S.; Chen, Y.-K. Characteristic comparison of single-pumped L-band erbium-doped fiber amplified spontaneous emission sources. Opt. Quantum Electron. 2002, 34, 1111–1117. [Google Scholar] [CrossRef]
  15. Wysocki, P.F.; Digonnet, M.J.F.; Kim, B.Y.; Shaw, H.J. Characteristics of erbium-doped superfluorescent fiber sources for interferometric sensor applications. J. Light. Technol. 1994, 12, 550–567. [Google Scholar] [CrossRef]
  16. Wang, L.A.; Chen, C.D. Characteristics comparison of Er-doped double-pass superfluorescent fiber sources pumped near 980 nm. IEEE Photonics Technol. Lett. 1997, 9, 446–448. [Google Scholar] [CrossRef]
  17. Lee, J.; Chung, Y.C.; Shim, C. Bandwidth optimization of a spectrum-sliced fiber amplifier light source using an angle-tuned Fabry-Perot filter and a double-stage structure. IEEE Photonics Technol. Lett. 2002, 6, 1197–1199. [Google Scholar] [CrossRef]
  18. Huang, W.; Ming, H. Simulation analysis of one-stage C+ L-band erbium-doped fiber ASE source with double-pass bi-directional pumping configuration. Chin. Opt. Lett. 2004, 2, 125–127. [Google Scholar]
  19. Wu, X.; Zhang, L.; Liu, C.-x.; Ruan, S.-c. High-stable, double-pass forward superfluorescent fiber source based on erbium-doped photonic crystal fiber. Appl. Phys. B 2014, 114, 433–438. [Google Scholar] [CrossRef]
  20. Wysocki, P.F.; Digonnet, M.J.F.; Kim, B.Y. Wavelength stability of a high-output, broadband, Er-doped superfluorescent fiber source pumped near 980 nm. Opt. Lett. 1991, 16, 961–963. [Google Scholar] [CrossRef]
  21. Saha, M.; Sen, R. Vapor phase doping process for fabrication of rare earth doped optical fibers: Current status and future opportunities. Phys. Status Solidi A 2016, 213, 1377–1391. [Google Scholar] [CrossRef]
  22. Saha, M.; Pal, A.; Sen, R. Vapor Phase Doping of Rare-Earth in Optical Fibers for High Power Laser. IEEE Photonics Technol. Lett. 2014, 26, 58–61. [Google Scholar] [CrossRef]
  23. Saha, M.; Pal, A.; Sen, R. Vapor phase chelate delivery technique for fabrication of rare earth doped optical fiber. In Proceedings of the 2012 International Conference on Fiber Optics and Photonics (PHOTONICS), Tamil Nadu, India, 9–12 December 2012; pp. 1–3. [Google Scholar]
  24. Pasquale, F.D.; Federighi, M. Modelling of uniform and pair-induced upconversion mechanisms in high-concentration erbium-doped silica waveguides. J. Light. Technol. 1995, 13, 1858–1864. [Google Scholar] [CrossRef]
  25. Tumminelli, R.P.; McCollum, B.C.; Snitzer, E. Fabrication of high-concentration rare-earth doped optical fibers using chelates. J. Light. Technol. 1990, 8, 1680–1683. [Google Scholar] [CrossRef]
  26. Desurvire, E.; Simpson, J.R. Amplification of spontaneous emission in erbium-doped single-mode fibers. J. Light. Technol. 1989, 7, 835–845. [Google Scholar] [CrossRef]
  27. Gaiffe, T.P.; Simonpietri, P.; Morisse, J.; Cerre, N.; Taufflieb, E.M.; Lefevre, H.C. Wavelength stabilization of an erbium-doped fiber source with a fiber Bragg grating for high-accuracy FOG. In Proceedings of the Fiber Optic Gyros: 20th Anniversary Conference, Denver, CO, USA, 5–9 August 1996; pp. 375–380. [Google Scholar]
  28. Kir’Yanov, A.V.; Barmenkov, Y.O. The effect of Erbium concentration on the optical spectrum of Erbium-doped fiber laser. Laser Phys. 2006, 16, 312–316. [Google Scholar] [CrossRef]
  29. Wysocki, P.F.; Wagener, J.L.; Digonnet, M.J.; Shaw, H.J. Evidence and modeling of paired ions and other loss mechanisms in erbium-doped silica fibers. In Proceedings of the Fiber Laser Sources and Amplifiers IV, Boston, MA, USA, 10–11 September 1992; pp. 66–79. [Google Scholar]
  30. Guo, J.; Zhang, H.; Lin, W.; Xu, W. Optimization of Erbium-Doped Fiber to Improve Temperature Stability and Efficiency of ASE Sources. Photonics 2025, 12, 115. [Google Scholar] [CrossRef]
  31. Cutler, C.C.; Newton, S.A.; Shaw, H.J. Limitation of rotation sensing by scattering. Opt. Lett. 1980, 5, 488–490. [Google Scholar] [CrossRef] [PubMed]
  32. Bergh, R.A.; Culshaw, B.; Cutler, C.C.; Lefevre, H.C.; Shaw, H.J. Source statistics and the Kerr effect in fiber-optic gyroscopes. Opt. Lett. 1982, 7, 563–565. [Google Scholar] [CrossRef]
  33. Iwatsuki, K. Excess noise reduction in fiber gyroscope using broader spectrum linewidth Er-doped superfluorescent fiber laser. IEEE Photonics Technol. Lett. 1991, 3, 281–283. [Google Scholar] [CrossRef]
  34. Qi, Y.; Chen, W.M.; Lei, X.H.; Zhang, W.; Li, J.F.; Xu, H.Y.; Liu, X.M. Temperature Effects on Erbium-Doped Optical Fiber Properties. Spectrosc. Spectr. Anal. 2016, 36, 2006–2010. Available online: https://www.gpxygpfx.com/EN/10.3964/j.issn.1000-0593(2016)07-2006-05 (accessed on 21 April 2026). [CrossRef]
  35. Mishra, P.; Saxena, S.; Dorairaj, C.; Ekhande, K.; Kandwal, A.; Chaugule, R.; Maity, A.; Khan, A.; Mishra, A. 20 Tb/s Signal Transmission Over 50 km Optical Link of 80 μm Clad Fiber. In Proceedings of the 2023 IEEE Workshop on Recent Advances in Photonics (WRAP), Prayagraj, India, 7–9 December 2023; pp. 1–3. [Google Scholar]
  36. Song, N.; Cai, W.; Song, J.; Jin, J.; Wu, C. Structure optimization of small-diameter polarization-maintaining photonic crystal fiber for mini coil of spaceborne miniature fiber-optic gyroscope. Appl. Opt. 2015, 54, 9831–9838. [Google Scholar] [CrossRef]
  37. Wang, H.; Lu, Y.-H.; Lu, T.-Y.; Liu, R.-Y.; Liaw, S.-K. Superfluorescent fiber source with ultra-low thermal coefficiency operating in the conventional band. In Proceedings of the Conference on Lasers and Electro-Optics/Pacific Rim, Hong Kong, China, 29 July–3 August 2018; pp. 2277–2281. [Google Scholar]
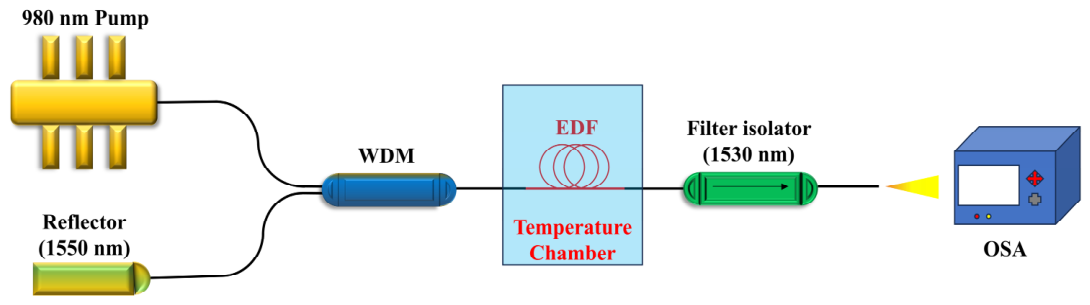
Figure 1. Schematic of the experimental setup for a double-pass forward ASE source with narrowband filtering.
Photonics 13 00424 g001
Figure 2. Transmission spectrum of the filter isolator.
Photonics 13 00424 g002
Figure 3. Schematic diagram of VPD system.
Photonics 13 00424 g003
Figure 4. (a) Emission spectra and (b) absorption spectra of EDFs.
Photonics 13 00424 g004
Figure 5. Output power of ASE sources utilizing EDF1 (a) and EDF2 (b) at different lengths with a pump power of 66.1 mW.
Photonics 13 00424 g005
Figure 6. Output spectra of ASE sources utilizing (a) 3.2 m EDF1 and (b) 9.0 m EDF2 at different temperatures.
Photonics 13 00424 g006
Figure 7. Output power of ASE sources utilizing EDF1 (3.2 m) and EDF2 (9.0 m) under different pump powers.
Photonics 13 00424 g007
Figure 8. Mean wavelength of ASE sources utilizing (a) EDF1 and (b) EDF2 with different lengths at various temperatures.
Photonics 13 00424 g008
Figure 9. Spectral width of ASE sources utilizing (a) EDF1 and (b) EDF2 at different lengths under various temperatures.
Photonics 13 00424 g009
Figure 10. Relationship of total absorption at 1530 nm to (a) mean wavelength temperature drift and (b) spectral width temperature drift of ASE sources utilizing different EDFs.
Photonics 13 00424 g010
Figure 11. Output power of ASE sources utilizing EDF1 (a) and EDF2 (b) with different lengths at various temperatures.
Photonics 13 00424 g011
Figure 12. Relationship between (a) mean wavelength and (b) spectrum width of ASE sources utilizing 3.2 m EDF1 and 7.0 m EDF2 versus temperature.
Photonics 13 00424 g012
Table 1. Parameters of EDFs.
ParameterEDF1EDF2
Numerical aperture (NA)0.2300.230
Peak Absorption (dB/m @980 nm)12.65.4
Peak Absorption (dB/m @1530 nm)19.38.0
Background Loss (dB/km @1200 nm)4.705.05
Cutoff Wavelength (nm)9221127
Mode Field Diameter at 1550 nm (μm)5.905.42
Erbium Ion Concentration (1/m3)2.81 × 10251.16 × 1025
Core Diameter (μm)5.14.6
Cladding Diameter (μm)12580
Coating Diameter (μm)245165
Table 2. Temperature-dependent characteristics of ASE sources utilizing EDF1 (2.8 m) and EDF2 (6.5 m).
FiberOutput Power
(mW)
Mean Wavelength Drift (ppm)Spectral Width Drift
(%)
Output Power Drift
(%)
EDF1 (2.8 m)13.6017.01.53−2.4
EDF2 (6.5 m)14.3012.81.72−4.5
Table 3. Temperature-dependent characteristics of ASE sources utilizing EDF1 (3.2 m) and EDF2 (7.0 m).
FiberOutput Power
(mW)
Mean Wavelength Drift (ppm)Spectral Width Drift
(%)
Output Power Drift (%)
EDF1 (3.2 m)14.4429.92.14−1.7
EDF2 (7.0 m)14.7616.51.73−3.9
Disclaimer/Publisher’s Note: The statements, opinions and data contained in all publications are solely those of the individual author(s) and contributor(s) and not of MDPI and/or the editor(s). MDPI and/or the editor(s) disclaim responsibility for any injury to people or property resulting from any ideas, methods, instructions or products referred to in the content.