Article

Research on Coal and Rock Identification by Integrating Terahertz Time-Domain Spectroscopy and Multiple Machine Learning Algorithms


1
School of Artificial Intelligence, Anhui Polytechnic University, Wuhu 241000, China
2
Aviation Industry Corporation Huadong Photoelectric Co., Ltd., Wuhu 241003, China
3
School of Intelligent Manufacturing, Wuhu University, Wuhu 241008, China
4
State Key Laboratory of Intelligent Mining Equipment Technology, Taiyuan 030032, China
5
Shanxi TZCO Intelligent Mining Equipment Technology Co., Ltd., Taiyuan 030032, China
6
Anhui Key Laboratory of Mine Intelligent Equipment and Technology, Anhui University of Science and Technology, Huainan 232001, China
7
State Key Laboratory of Digital Intelligent Technology for Unmanned Coal Mining, Anhui University of Science and Technology, Huainan 232001, China
8
Key Laboratory of Opto-Electronics Information Technology, Ministry of Education, School of Precision Instruments and Opto-Electronics Engineering, Tianjin University, Tianjin 300072, China
*
Authors to whom correspondence should be addressed.
Photonics 2026, 13(5), 409; https://doi.org/10.3390/photonics13050409
Submission received: 26 March 2026 / Revised: 12 April 2026 / Accepted: 20 April 2026 / Published: 22 April 2026

Abstract

Aiming to address the problems of low accuracy in coal–rock identification during coal mining, which lead to energy waste and safety hazards, a high-precision coal–rock medium identification method combining terahertz time-domain spectroscopy technology and multiple machine learning algorithms is proposed. By preparing coal–rock samples with a gradient change in coal content, terahertz time-domain spectroscopy data of coal–rock mixed media are collected, and optical parameters such as the refractive index and absorption coefficient are extracted. Principal component analysis is used to reduce the dimensionality of the terahertz data, and machine learning algorithms such as support vector machine, least squares support vector machine, artificial neural networks, and random forests are adopted for classification and identification. The study found that terahertz waves are more sensitive to coal–rock media in the 0.7–1.3 THz frequency band, and that the refractive index and absorption coefficient of coal–rock mixed media are significantly positively correlated with coal content within the range of 0–30%. After feature extraction and K-fold cross-validation, the random forest model achieved a coal–rock classification accuracy of over 96% on the test set, significantly outperforming other comparison algorithms. The research verifies the efficiency and practicality of terahertz technology combined with multiple machine learning algorithms in coal–rock identification, providing a new method for fields such as mineral separation. This method has, to a certain extent, broken through the accuracy bottleneck of traditional coal–rock identification technologies within its applicable range, providing a new solution for real-time detection of coal–rock interfaces and is expected to further reduce the risks of ineffective mining and roof accidents in the future.

1. Introduction

China’s energy structure is characterized by “abundant coal and relatively insufficient oil and natural gas”. At present, fossil energy is the dominant energy source, but the proportion of clean energy is also gradually increasing. Coal still remains the mainstay supporting China’s energy demand. In 2023, coal accounted for more than 55% of primary energy consumption, while oil consumption was 756 million tons, with over 70% dependent on imports. The proportion of natural gas consumption was only 9.6%, but its import dependence exceeded 40%. According to the prediction of the Chinese Academy of Engineering, the proportion of coal will still remain around 50% by 2050, and the energy pattern dominated by coal is unlikely to change in the coming decades [1]. Currently, China’s coal mining industry is in a critical period of transformation, aiming to ensure safe and efficient operation, promote intelligent and green development, and provide stable and reliable support. The development path is characterized by controlling the scale of new additions, improving the efficiency of existing resources, relying on technological innovation, and shifting towards clean utilization [2,3,4,5]. In the process of coal mining, coal–rock identification is one of the core technical links restricting intelligent mining [6,7,8]. As a core perception node in the underground environment, accurate identification of the coal–rock interface not only directly determines the efficiency of cutting path planning and equipment life but also has a deeper impact on the sustainability of energy extraction and national resource security strategy [9].
In recent years, significant achievements have been made in the field of coal–rock interface identification technology, such as acoustic wave detection, machine vision imaging, vibration signal analysis, gamma-ray methods, and radar detection. Particularly, force-coupled machine learning (ML) technology, with its powerful capabilities in pattern recognition, feature extraction, and nonlinear modeling, is demonstrating great potential in solving the coal–rock identification problem [10,11,12]. Lu et al. [13] revealed the dynamic disaster mechanism of deep coal and rock under three-dimensional static and dynamic stress through real three-dimensional disturbance stress experiments combined with acoustic emission monitoring. They found that a necessary condition for disaster occurrence is that the coupling of the maximum static stress and disturbance amplitude exceeds the damage threshold, and that acoustic emission parameters and high-energy events in the roof and floor can be used as precursors of disaster. Zhang Yun et al. [14] proposed an improved DeepLabV3+ model integrating dual attention mechanisms and combined it with the MobileNetV2 lightweight backbone network and an adaptive defogging algorithm to achieve high-precision real-time identification of the coal–rock cutting interface in the tunneling face under coal dust conditions. Liu et al. [15] proposed a time–frequency analysis method for electromagnetic signals during drilling based on continuous wavelet transform combined with a genetic algorithm–particle swarm optimization algorithm–random optimization algorithm to identify coal and rock characteristics. The time–frequency diagrams generated by this method have significant differences in the frequency and time ranges, greatly improving the accuracy of the coal and rock characteristic identification model. Wei Dongbo [16] studied a non-contact method for detecting coal seam thickness using gamma rays to achieve automatic height adjustment of the coal mining machine’s boom. This method has high measurement accuracy when the coal seam thickness is less than 400 mm, with strong anti-interference ability and suitability for harsh underground environments, providing a new technical idea for coal mining automation. Shi Congwei et al. [17] revealed the relationship between the root mean square height of the coal–rock interface and the wavelength of the electrical wave through Monte Carlo simulations of rough coal–rock interfaces and time-domain finite difference forward experiments, as well as its impact on the identification accuracy in ground-penetrating radar.
However, despite the significant progress made in the aforementioned research, it is necessary to be acutely aware of the limitations and application barriers that still exist. Most of the above-mentioned methods have a strong dependence on the environment and working conditions. The universality and robustness of the existing technologies still need to be verified. More profoundly, the selection of these technical paths has, to a certain extent, set a fixed pattern for future research. Therefore, future exploration should focus on breaking the limitations of single technologies and developing intelligent perception systems that integrate multi-sensor information, thereby constructing a coal–rock identification solution that is insensitive to environmental disturbances, adaptive to coal seam changes, and truly meets the high reliability and high real-time requirements of underground coal mines.
Terahertz time-domain spectroscopy (THz-TDS) is a novel detection method that breaks through the limitations of traditional spectral analysis. In recent years, it has shown significant advantages in mineral identification [18]. The terahertz band is located in a special transition zone of the electromagnetic spectrum, with frequencies ranging from 0.1 to 10 THz. This frequency band combines the unique properties of adjacent bands, retaining the strong penetration ability of microwaves for non-polar substances while also having the spectral sensitivity of infrared light coupled with molecular vibrational energy levels. Importantly, the energy of terahertz photons is highly compatible with the weak interactions of organic molecules, such as hydrogen bond vibrations and crystal phonon modes, as well as the vibrational energy levels of carbon-based compounds. This enables the specific excitation of resonant responses of chemical bonds such as carbon–hydrogen (C-H) and carbon–carbon (C-C) in organic substances [19]. Qu et al. [20] used THz-TDS to measure the terahertz dielectric response of coal with different amounts of pyrite, focusing on identifying potential differences and mechanisms. Zhang et al. [21] studied the absorption coefficient and refractive index of high-quality rare earth ores and their associated minerals, fluorite and dolomite, using THz-TDS. Moffa et al. [22] used a high-resolution coherent terahertz continuous-wave spectrometer to characterize the physical properties of natural azurite and two of its synthetic forms for the first time in the terahertz spectral range, revealing distinct absorption spectra for these three chemically related pigments and demonstrating specific features that can be used to distinguish natural compounds from synthetic forms. Zhu et al. [23] combined terahertz dielectric properties with ML detection technology, achieving non-contact rapid identification of unoxidized and oxidized coal samples by analyzing changes in the imaginary part of the dielectric constant in the 75–110 GHz frequency band, thereby providing a new method for early monitoring of coal spontaneous combustion.
To address the above challenges and fully exploit the unique potential of THz-TDS in mineral identification, this study proposes a research method for coal–rock identification based on THz-TDS and multiple ML algorithms. Specifically, coal–rock mixed samples with different gradient ratios were prepared by mechanical pressing, and their original time-domain spectral signals were collected using a THz-TDS system. Through time–frequency conversion and parameter extraction, multi-dimensional optical features, including the complex refractive index and absorption coefficient, were obtained, and a systematic terahertz spectral database of coal–rock mixed samples was constructed. Further, principal component analysis was introduced to reduce the dimensionality of high-dimensional features, and different coal–rock ratios were accurately classified and predicted based on relevant ML models. The database and method framework constructed in this study have good scalability and can be adapted to interface identification scenarios in different geological structures in the future, providing reliable multi-source data support and solutions for the adaptive cutting of coal mining machines and intelligent mining in coal mines.

2. Experiment and Methods

2.1. Experimental Setup

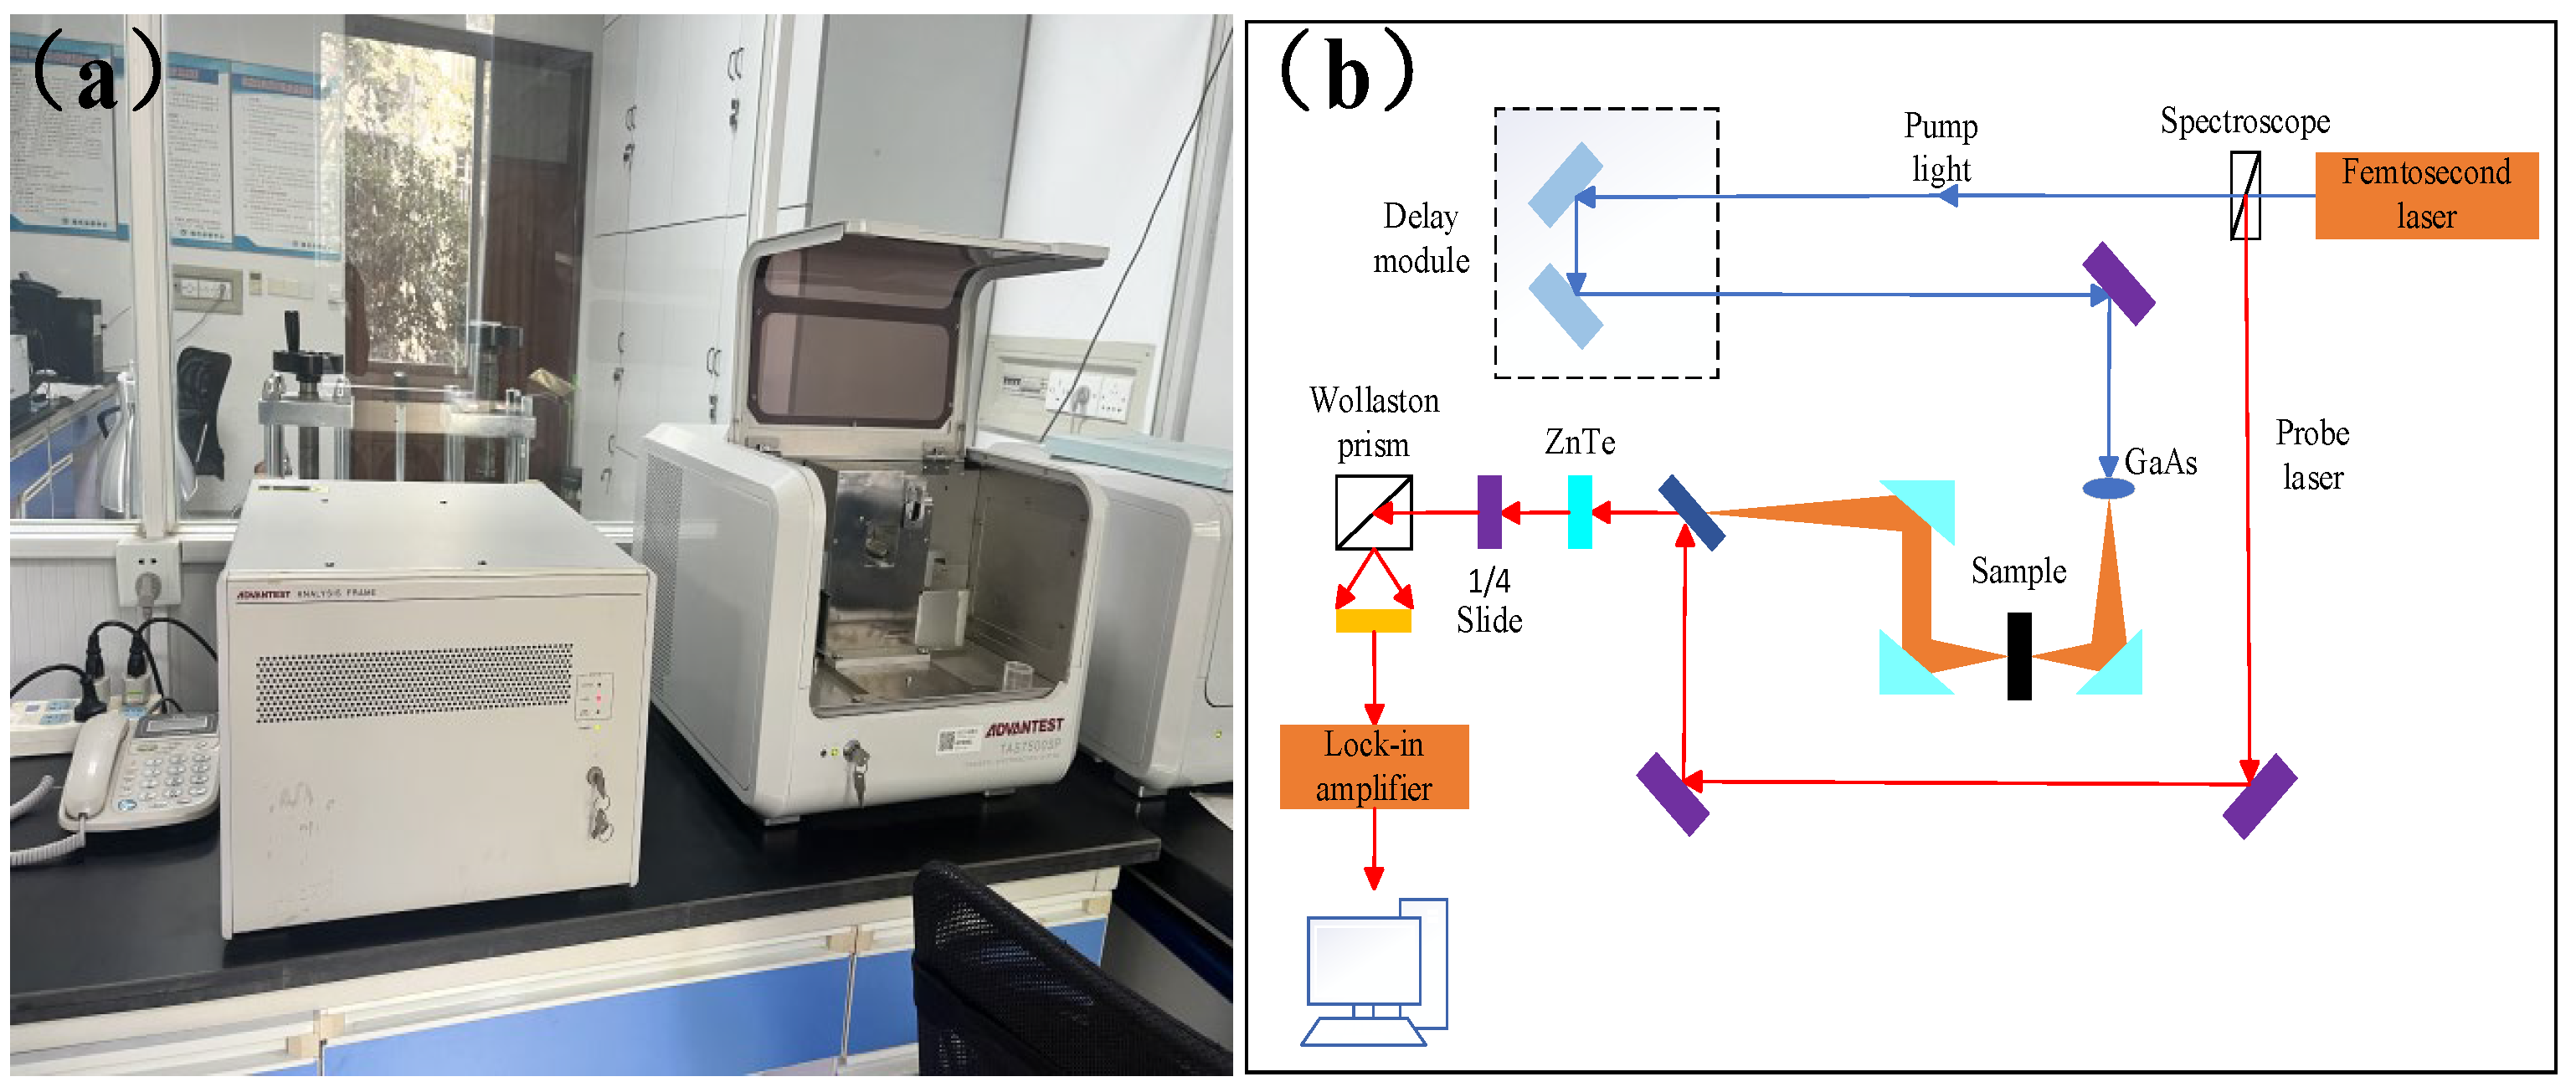
As shown in Figure 1a, the transmission THz-TDS detection system (TAS7500SP, ADVANTEST Company, Tokyo, Japan) used in this experiment has a broadband frequency range of 0.1–4 THz (in an environment of 23 ± 5 °C), a single scan speed of less than 8 ms, and a signal-to-noise ratio greater than 57 dB. As shown in Figure 1b, the principle diagram of transmission THz-TDS technology is presented. By sending short pulse electromagnetic waves, the propagation process of the waves in the measured object is observed. Commonly used light sources include femtosecond lasers and optical pulse sources. Nonlinear optical processes are utilized to generate broadband terahertz pulses. These pulses propagate under the guidance of terahertz optical components and interact with the measured sample. The measured sample has different absorption, transmission, and reflection characteristics for terahertz waves [24,25]. These characteristics are closely related to the physical, chemical, and structural properties of the measured object; thus, information about the sample can be obtained by analyzing the interaction between the terahertz waves and the measured sample. After the terahertz pulse passes through the sample, its amplitude and phase changes can be measured by the detector [26].

2.2. Sample Preparation

Before conducting the experiment to detect samples using THz-TDS technology, the samples need to undergo certain pre-treatment. The coal powder, rock powder, and polyethylene powder are respectively dried and sieved to an appropriate particle size, and then mixed evenly according to the predetermined coal–rock ratio. The polyethylene powder only serves a bonding function and does not affect the detection of terahertz waves in the coal–rock mixed samples [27]. The mixed powder was pressed into pellets with a diameter of 10 mm and a thickness of approximately 1 mm using a hydraulic press under a pressure of 15 MPa, with a holding time of 2 min. After the pellet is formed, the thickness is measured using a thickness gauge, and it is then sealed and labeled.
The test samples are mixtures of coal powder, quartz sand (rock) powder and polyethylene powder, with different proportions of these substances. Table 1 shows the 11 different coal–rock ratios studied. The specific weight data of the three substances are shown in Table 1. For each of these ratios, five samples were pressed separately, resulting in a total of fifty-five samples. The specific sample data information is shown in Table 2. These 55 samples then underwent transmission terahertz spectroscopy testing for related research. The terahertz spectroscopy instrument was used to conduct five tests on each of these 55 samples, obtaining 275 sets of data. After terahertz spectroscopy testing, the 275 sets of terahertz spectroscopy data were numbered to facilitate subsequent related research.

2.3. Optical Parameter Extraction Method

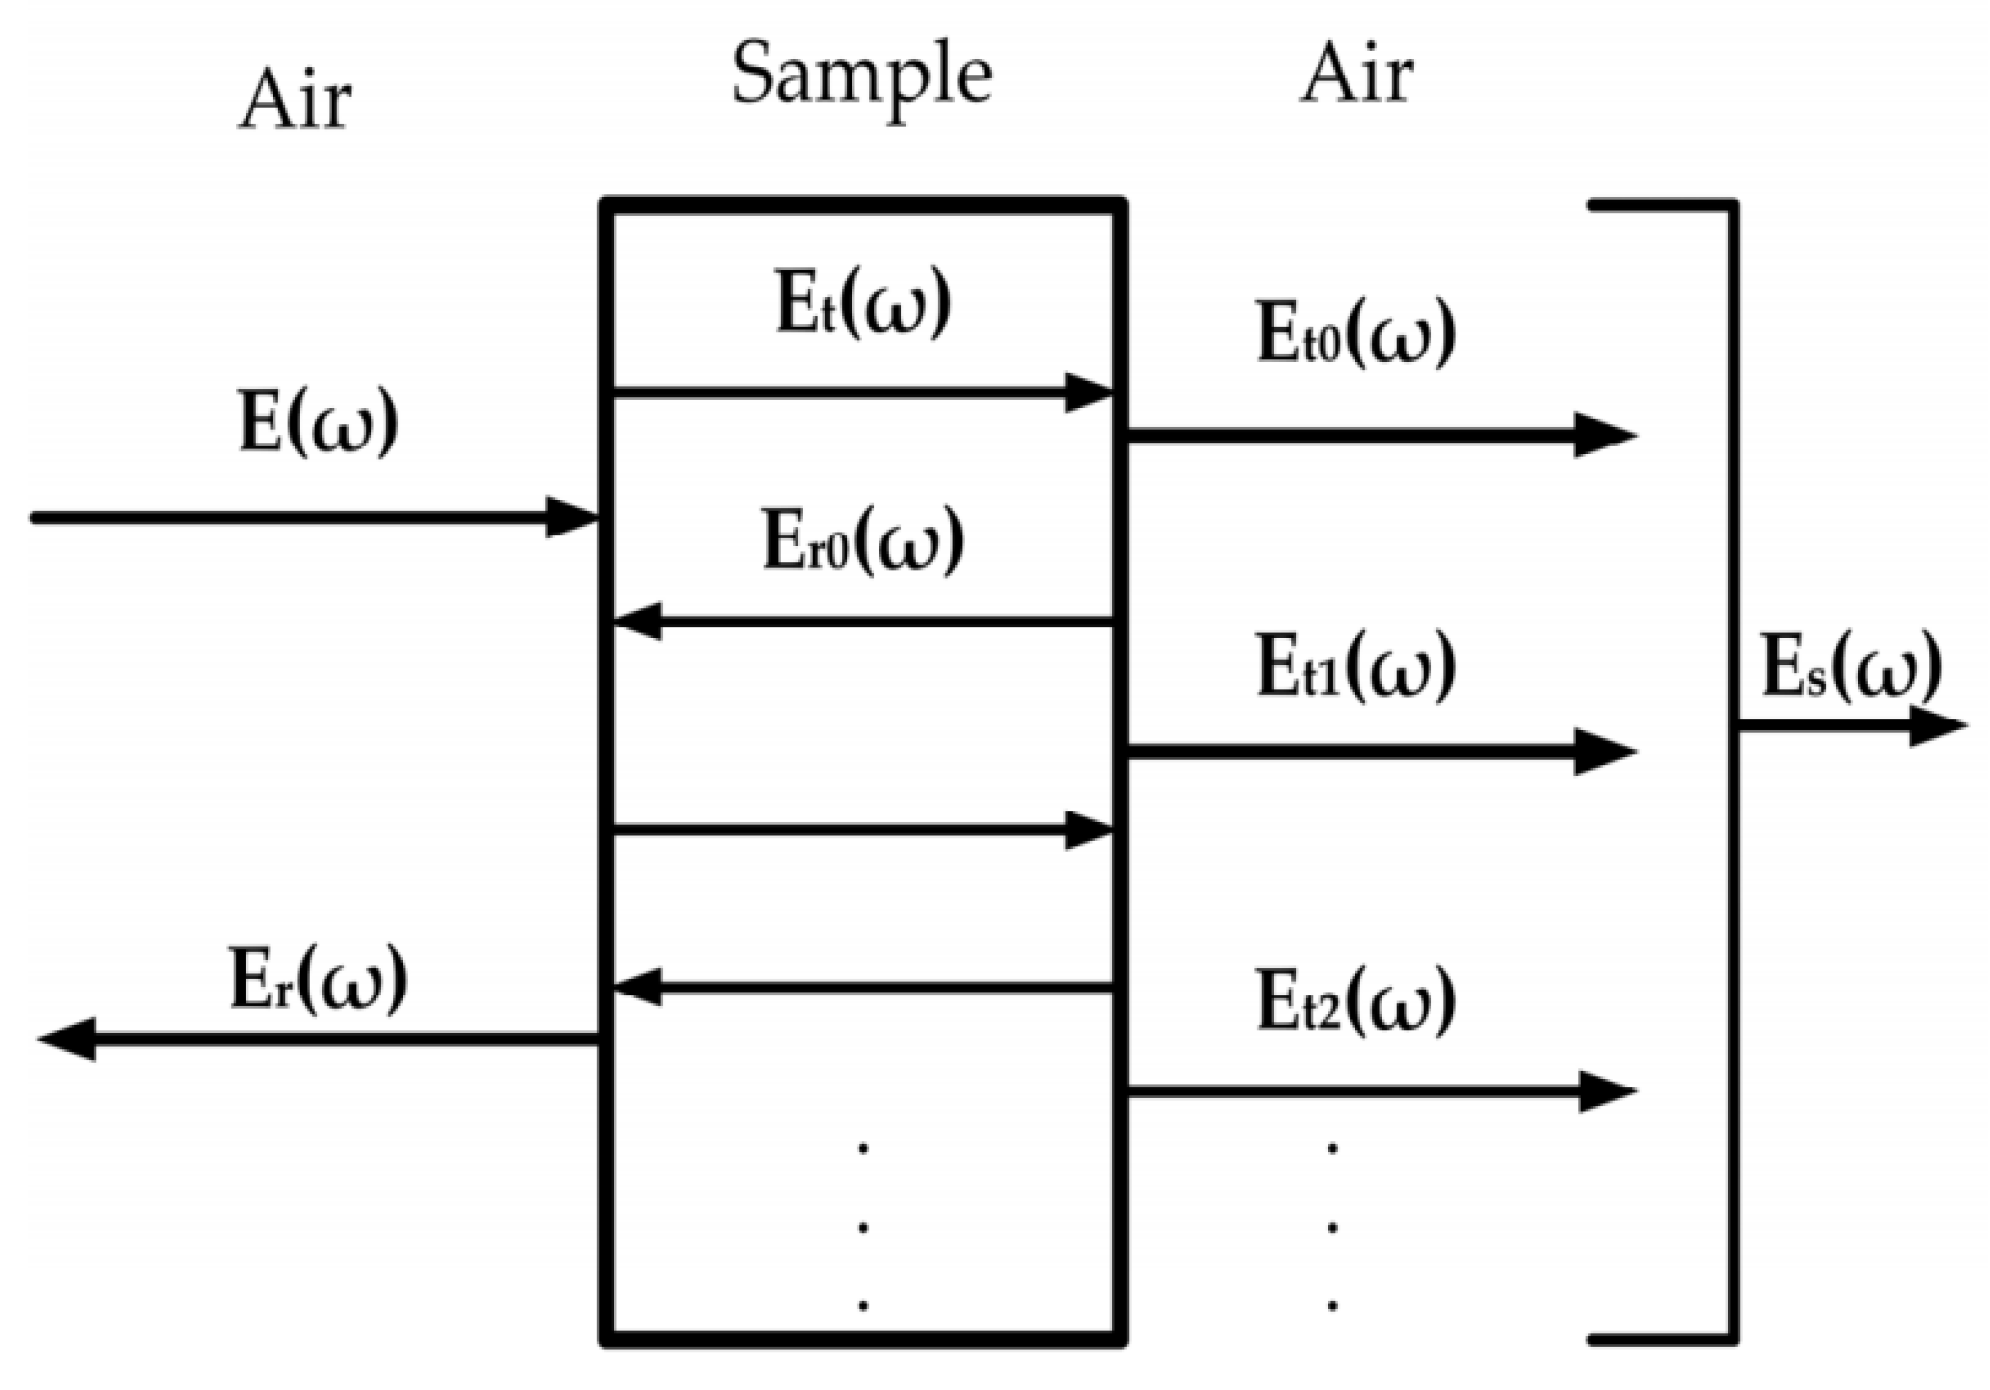
Given the type of samples in this experiment, the transmission THz-TDS system was adopted for the research. Here, we introduce the calculation formulas for the optical parameters of the measured object using the transmission THz-TDS system as an example. As shown in Figure 2, this is a schematic diagram of terahertz waves passing through the sample. When a terahertz wave E(w) enters the sample from the air medium, according to Fresnel’s law [28,29], it is known that terahertz waves will undergo multiple reflections and transmissions inside the sample. The reflected wave and the transmitted wave are denoted as Er(w) and Et(w), respectively. In sequence, when the terahertz waves pass through the sample and enter the air medium, the reflected wave is denoted as Erm(w), and the transmitted wave is denoted as Etm(w). m represents the number of reflections.
Duvillaret and Dorney et al. [30,31] proposed a method for calculating the optical parameters of samples in the terahertz frequency band. The reference signal of the terahertz wave propagating in the air is Eref(w), and the actual terahertz signal passing through the sample is Esamp(w). Then, the transmission coefficient of the sample is
T ( ω ) = E samp ( ω ) E ref ( ω )
The refractive index n(w), extinction coefficient k(w) and absorption coefficient α(w) are calculated as follows
n ( ω ) = 1 + φ ( ω ) c ω d
k ( ω ) = c ω d ln E ref   ( ω ) E samp   ( ω )
α ( ω ) = 2 d ln E ref   ( ω ) E samp   ( ω )

2.4. Modeling in Machine Learning

In order to verify the effectiveness of terahertz spectral data combined with ML algorithms in the classification of coal–rock mixed media. In this study, four typical ML models, support vector machine (SVM), least squares support vector machine (LS-SVM), artificial neural network (ANN) and random forest (RF), were used to classify and identify the feature data after dimensionality reduction. The experimental process is as follows:
Samples with coal content of 0%, 10%, 20%, 30%, 40%, and 50% (six classes in total) were used for classification. For each ratio, five samples were prepared, and each sample was measured five times, resulting in 25 data points per class and a total of 150 data points. These 150 data groups were divided into a training set and a test set in a ratio of 7:3 (105 training, 45 testing). Data standardization was carried out using the Z-score method to eliminate the influence of dimensional differences on model performance. SVM and LS-SVM: The radial basis function was selected as the kernel function, and the penalty factor C and kernel parameter γ were optimized through grid search with fivefold cross-validation on the training set. ANN: A three-layer network structure was constructed (the number of nodes in the input layer is equal to the number of principal components, the number of nodes in the hidden layer is 10, and the number of nodes in the output layer is 1). The activation function was selected as the rectified linear unit, the learning rate was set to 0.01, and the maximum number of iterations was 1000. RF: The number of decision trees was set to 200, the maximum depth was 8, and the proportion of feature subset selection was d (d is the feature dimension).
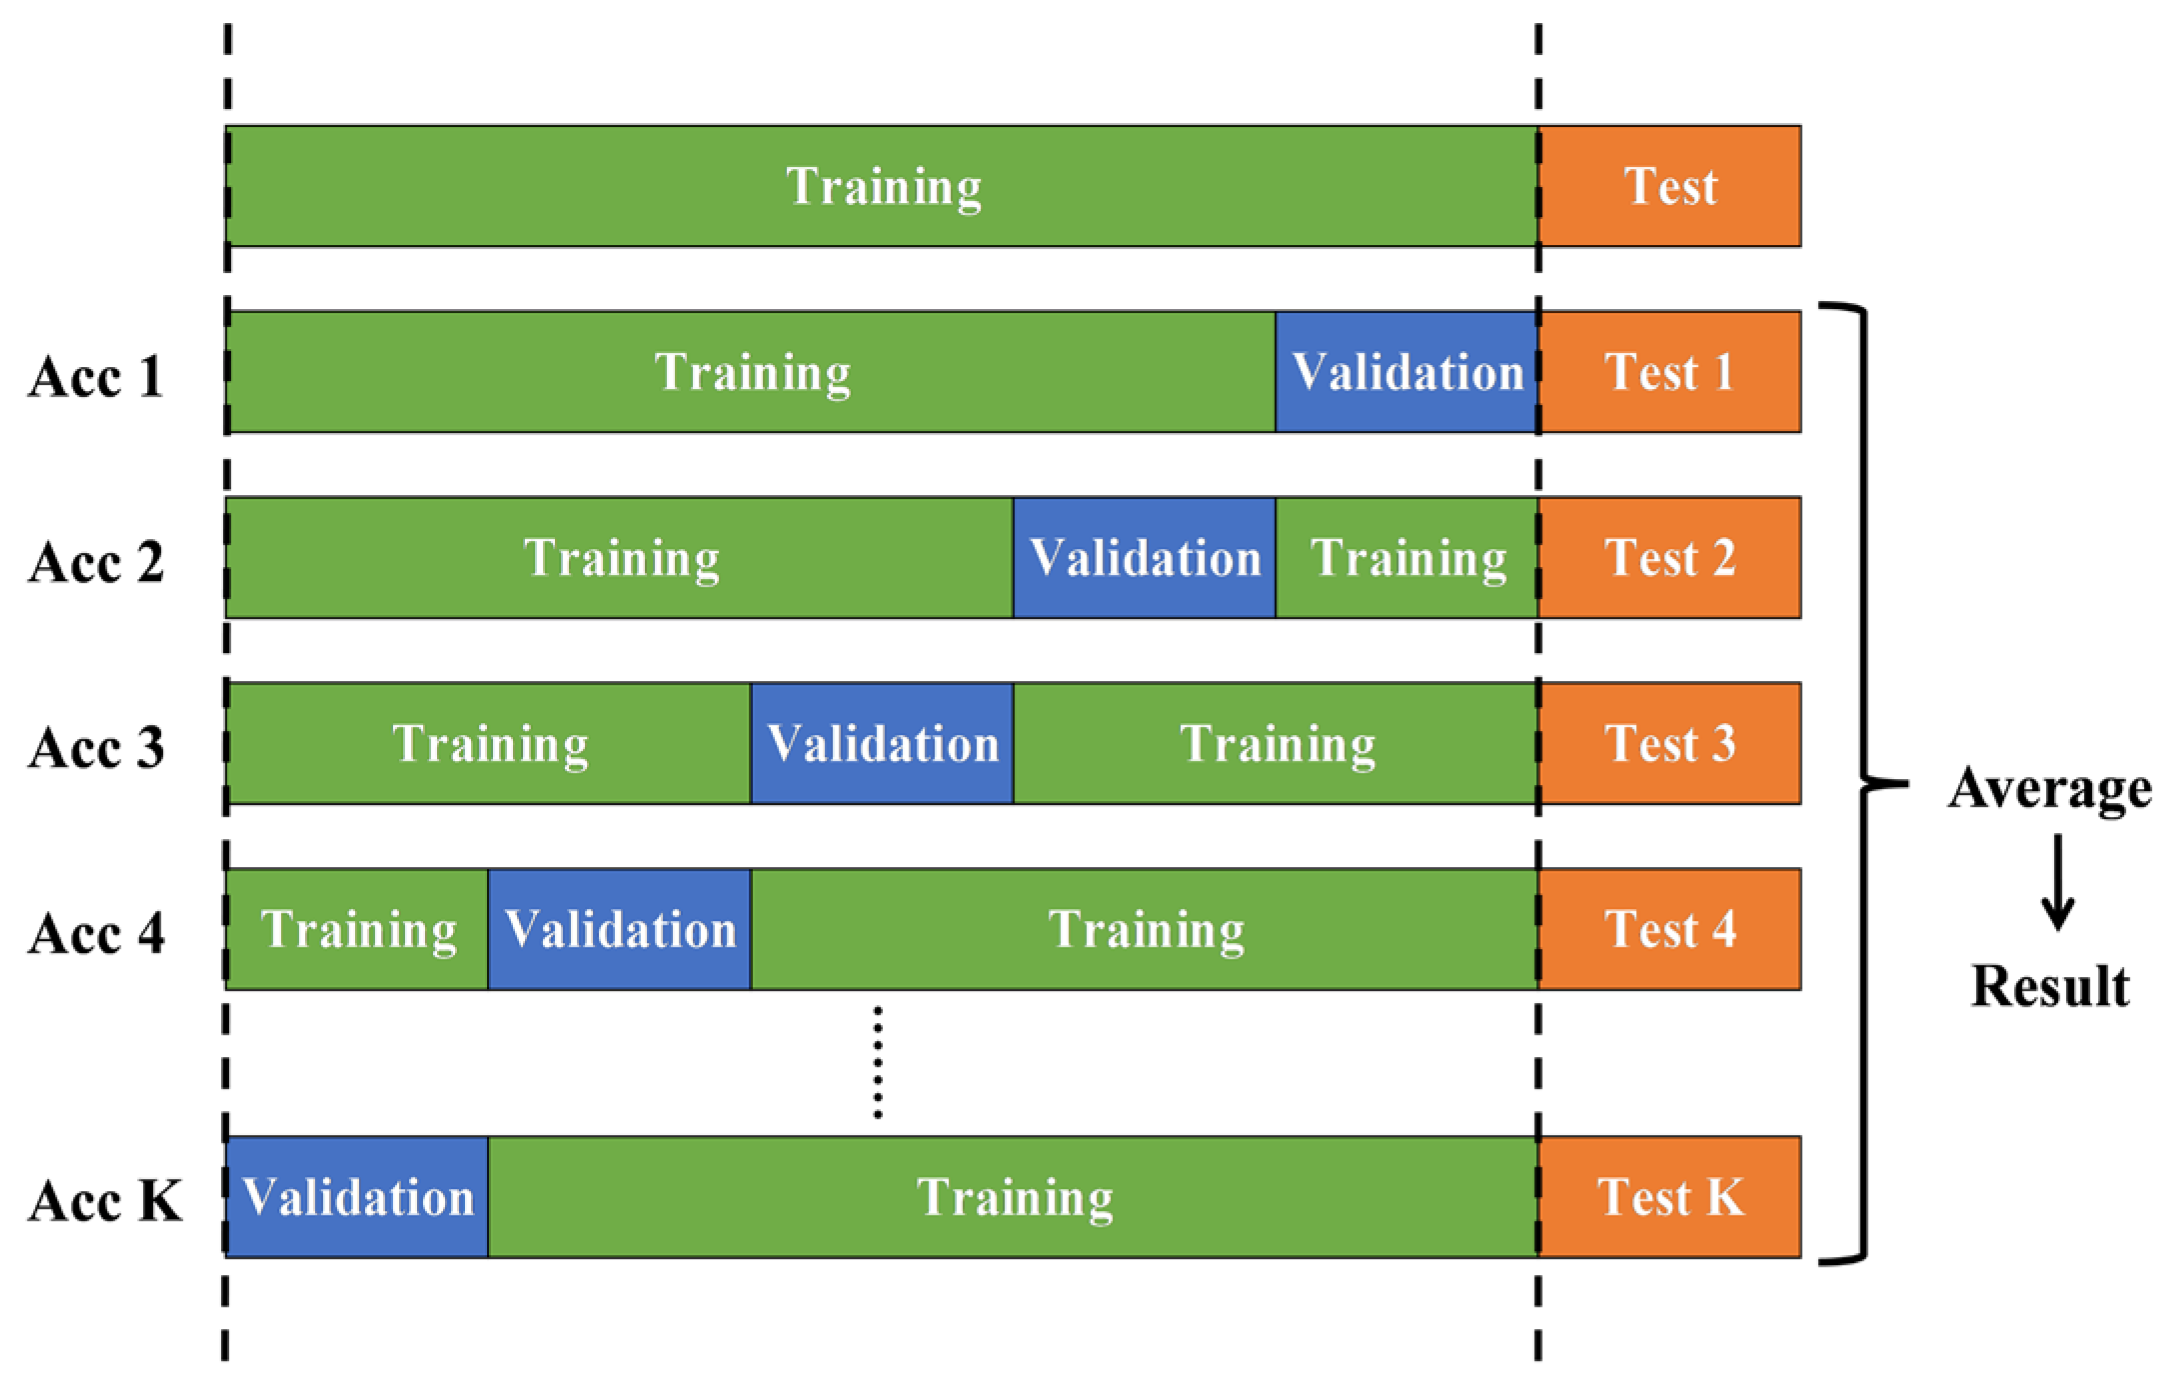
Finally, the stability of the model was evaluated using 10-fold cross-validation. K-fold cross-validation is a statistical technique used to evaluate the performance of machine learning models and select appropriate parameters [32]. Figure 3 shows the principle diagram of K-fold cross-validation. Data division in K-fold cross-validation: The training set is divided into K subsets. In this paper, K is set to 10. Each subset is used as a part of the validation set, while the remaining K − 1 subsets form the training set. For each iteration of cross-validation, the optimized SVM, LS-SVM, ANN, and RF models were trained respectively, and the remaining one subset was used as the validation set to evaluate performance. The mean and standard deviation of accuracy across the 10 folds were recorded.
In addition, to obtain statistically robust results, the 7:3 random split was repeated 10 times, and the mean test accuracy, standard deviation, and 95% confidence intervals were calculated for each model. A paired t-test was performed to compare the significance of differences between models. Although the number of physically prepared samples is 55, each sample was measured five times, resulting in 275 terahertz spectral datasets for model training and testing. To mitigate the potential bias introduced by the limited sample size, 10-fold cross-validation was adopted. Future work will involve collecting more diverse samples from different mining areas to further validate and improve the model’s generalization capability.

3. Results and Analysis

3.1. THz Spectral Characteristics of Samples Mixed with Different Coal–Rock Ratios

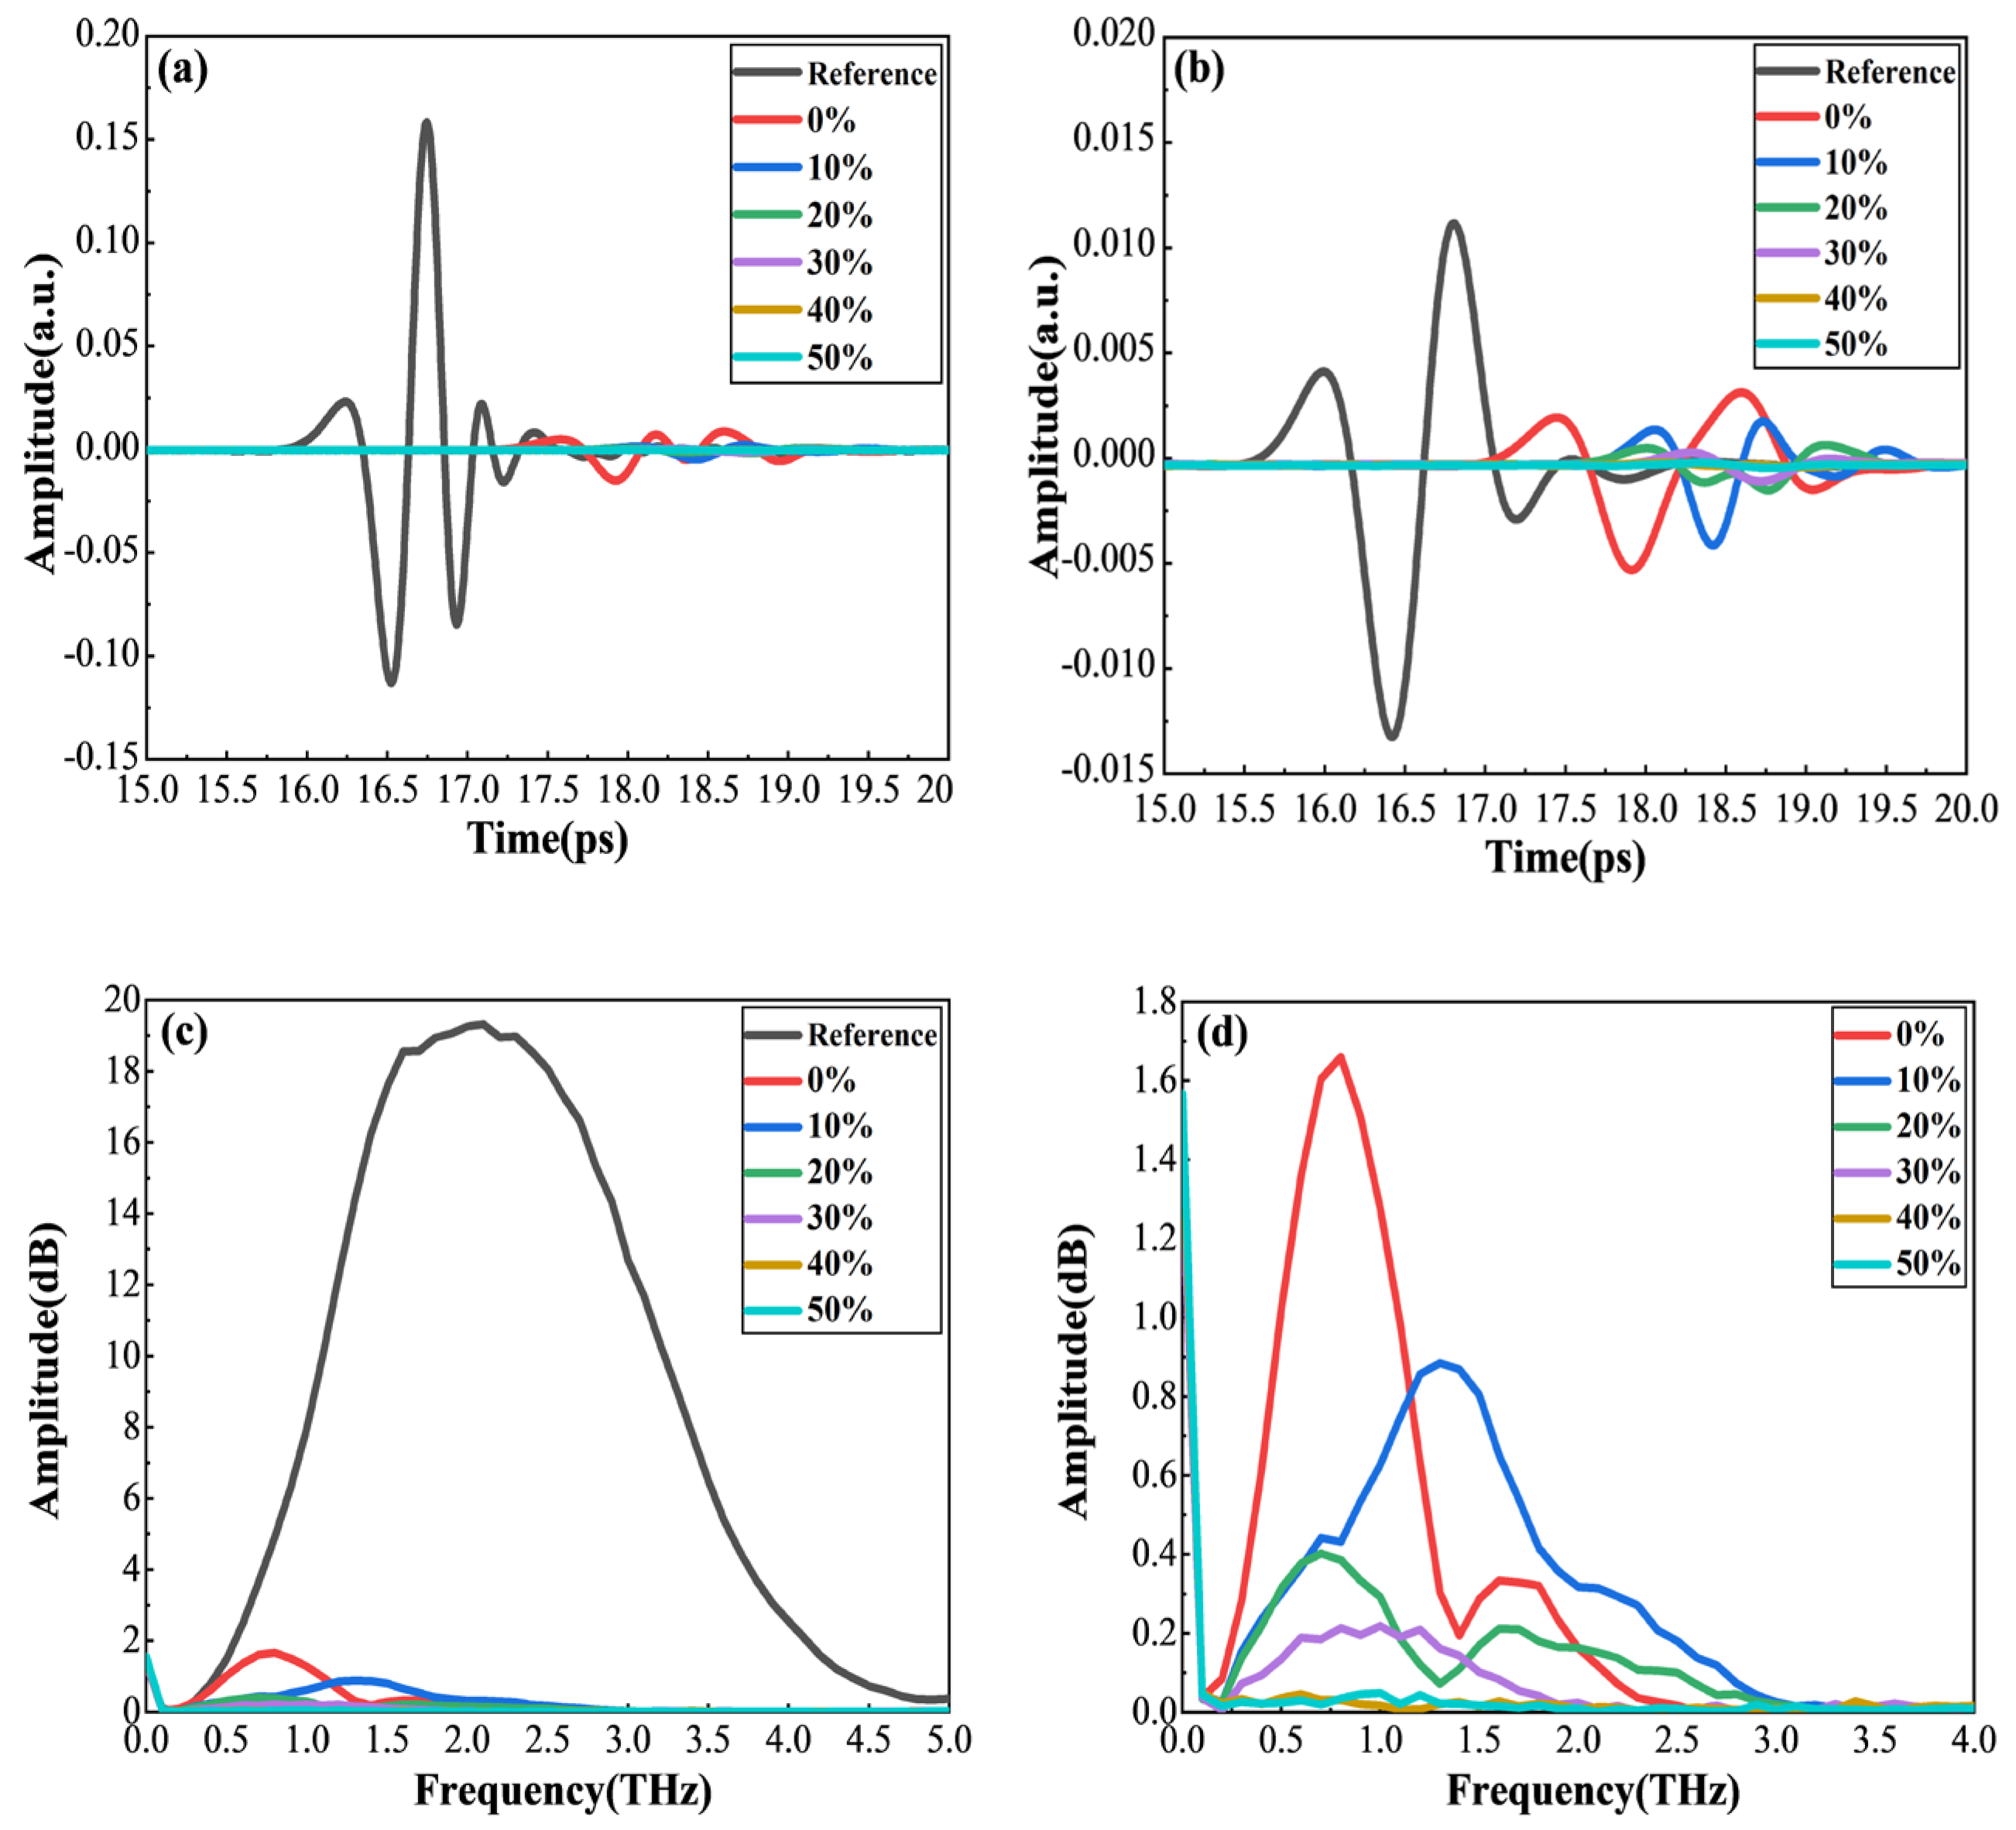
Before starting the sample tests, it is necessary to wait for the femtosecond laser to stabilize and re-calibrate in advance to ensure the safety and stability of the measurements. Firstly, the THz reference signal is obtained without placing the sample on the sample stage. Then, the tests are conducted on samples with different coal–rock ratios. The THz spectral scanning range is 0–131 ps, with a step size of 0.002 ps, to obtain 275 THz time-domain spectral data for the 55 samples described in Section 2.2. Finally, the data are processed by averaging, and 11 sets of THz data are obtained, including one reference signal. It was found that, for samples with coal content exceeding 30%, the transmitted THz signal power dropped below the noise floor of the detection system, likely due to strong absorption and scattering by the coal component. Consequently, reliable spectral features could not be extracted from these samples. Therefore, the subsequent analysis focuses only on sample data with coal content ranging from 0% to 30%, and the obtained THz time-domain spectral data are shown in Figure 4a.
The spectral data of the prepared coal–rock pellets were collected using a terahertz time-domain spectrometer. The collected time-domain signals were converted into frequency-domain signals through Fourier transformation for further analysis. By analyzing the spectral characteristics of samples with different coal–rock ratios, the spectral response differences in coal and rock in the terahertz band could be observed. To improve the signal-to-noise ratio and the accuracy of the spectral data, pre-processing of the original spectral data is required. As shown in Figure 4b, this paper uses the Gaussian smoothing method to process the terahertz time-domain data. This method can effectively eliminate noise interference and improve the reliability of the spectral data. After Fourier transformation of the processed terahertz time-domain data, the terahertz frequency-domain data of the samples can be obtained.
From the analysis of the sample time-domain spectra, the following observations can be made:
(1)
For samples with coal content between 0% and 30%, the THz time-domain signals exhibit clear and measurable features. Terahertz waves are sensitive to intermolecular vibrations, lattice phonon modes, and hydrogen-bonding networks in organic matter, which can generate characteristic absorption in this frequency range. However, for samples with coal content of 40% and above, the transmitted terahertz signal becomes extremely weak (transmission approaches zero) due to strong absorption and scattering by the coal matrix, making reliable extraction of optical parameters impossible. The proposed method is effective for coal content in the range of 0–30%, which corresponds to the early stage of coal–rock mixing or rock-dominated interfaces. Therefore, the following optical parameter analysis focuses on sample data with coal content ranging from 0% to 30%.
(2)
The difference in refractive index (n) between samples leads to variation in the optical path length (n·d) for the THz pulse. This results in different time delays between the reference signal and the sample signals, as observed in the time-domain spectra [33]. In the time-domain spectra, it can be observed that the peak of the reference signal appears at 16.7 ps, while the signals of samples with coal content ranging from 0% to 30% have a large time delay difference relative to the reference signal, with peaks appearing between 18.6 and 19.1 ps. The time delay difference increases with increasing coal content.
(3)
The THz wave suffers amplitude attenuation during propagation. This attenuation is mainly caused by absorption by the medium on the THz wave, as well as the reflection and scattering of the THz wave at the surface of the medium. Compared with the reference signal, the amplitude of the sample’s time-domain spectrum has significant attenuation. In addition, the amplitude attenuation of samples’ time-domain spectrum with higher coal content is greater than that of samples with lower coal content.
As shown in Figure 4c,d, analysis of the sample frequency-domain spectra indicates that the bandwidth of the reference signal is between 0 and 5 THz, while the signal bandwidth of the samples is between 0 and 3 THz, with a peak at 0.7–1.3 THz. That is, the effective frequency band of the sample signal is between 0.7 and 1.3 THz. Therefore, the following analysis will be conducted within the frequency range of 0.7–1.3 THz. Attenuation is observed in the frequency spectra of all samples. Moreover, at a given frequency point, the attenuation of the spectral amplitude increases with higher coal content, a trend consistent with the time-domain spectra.
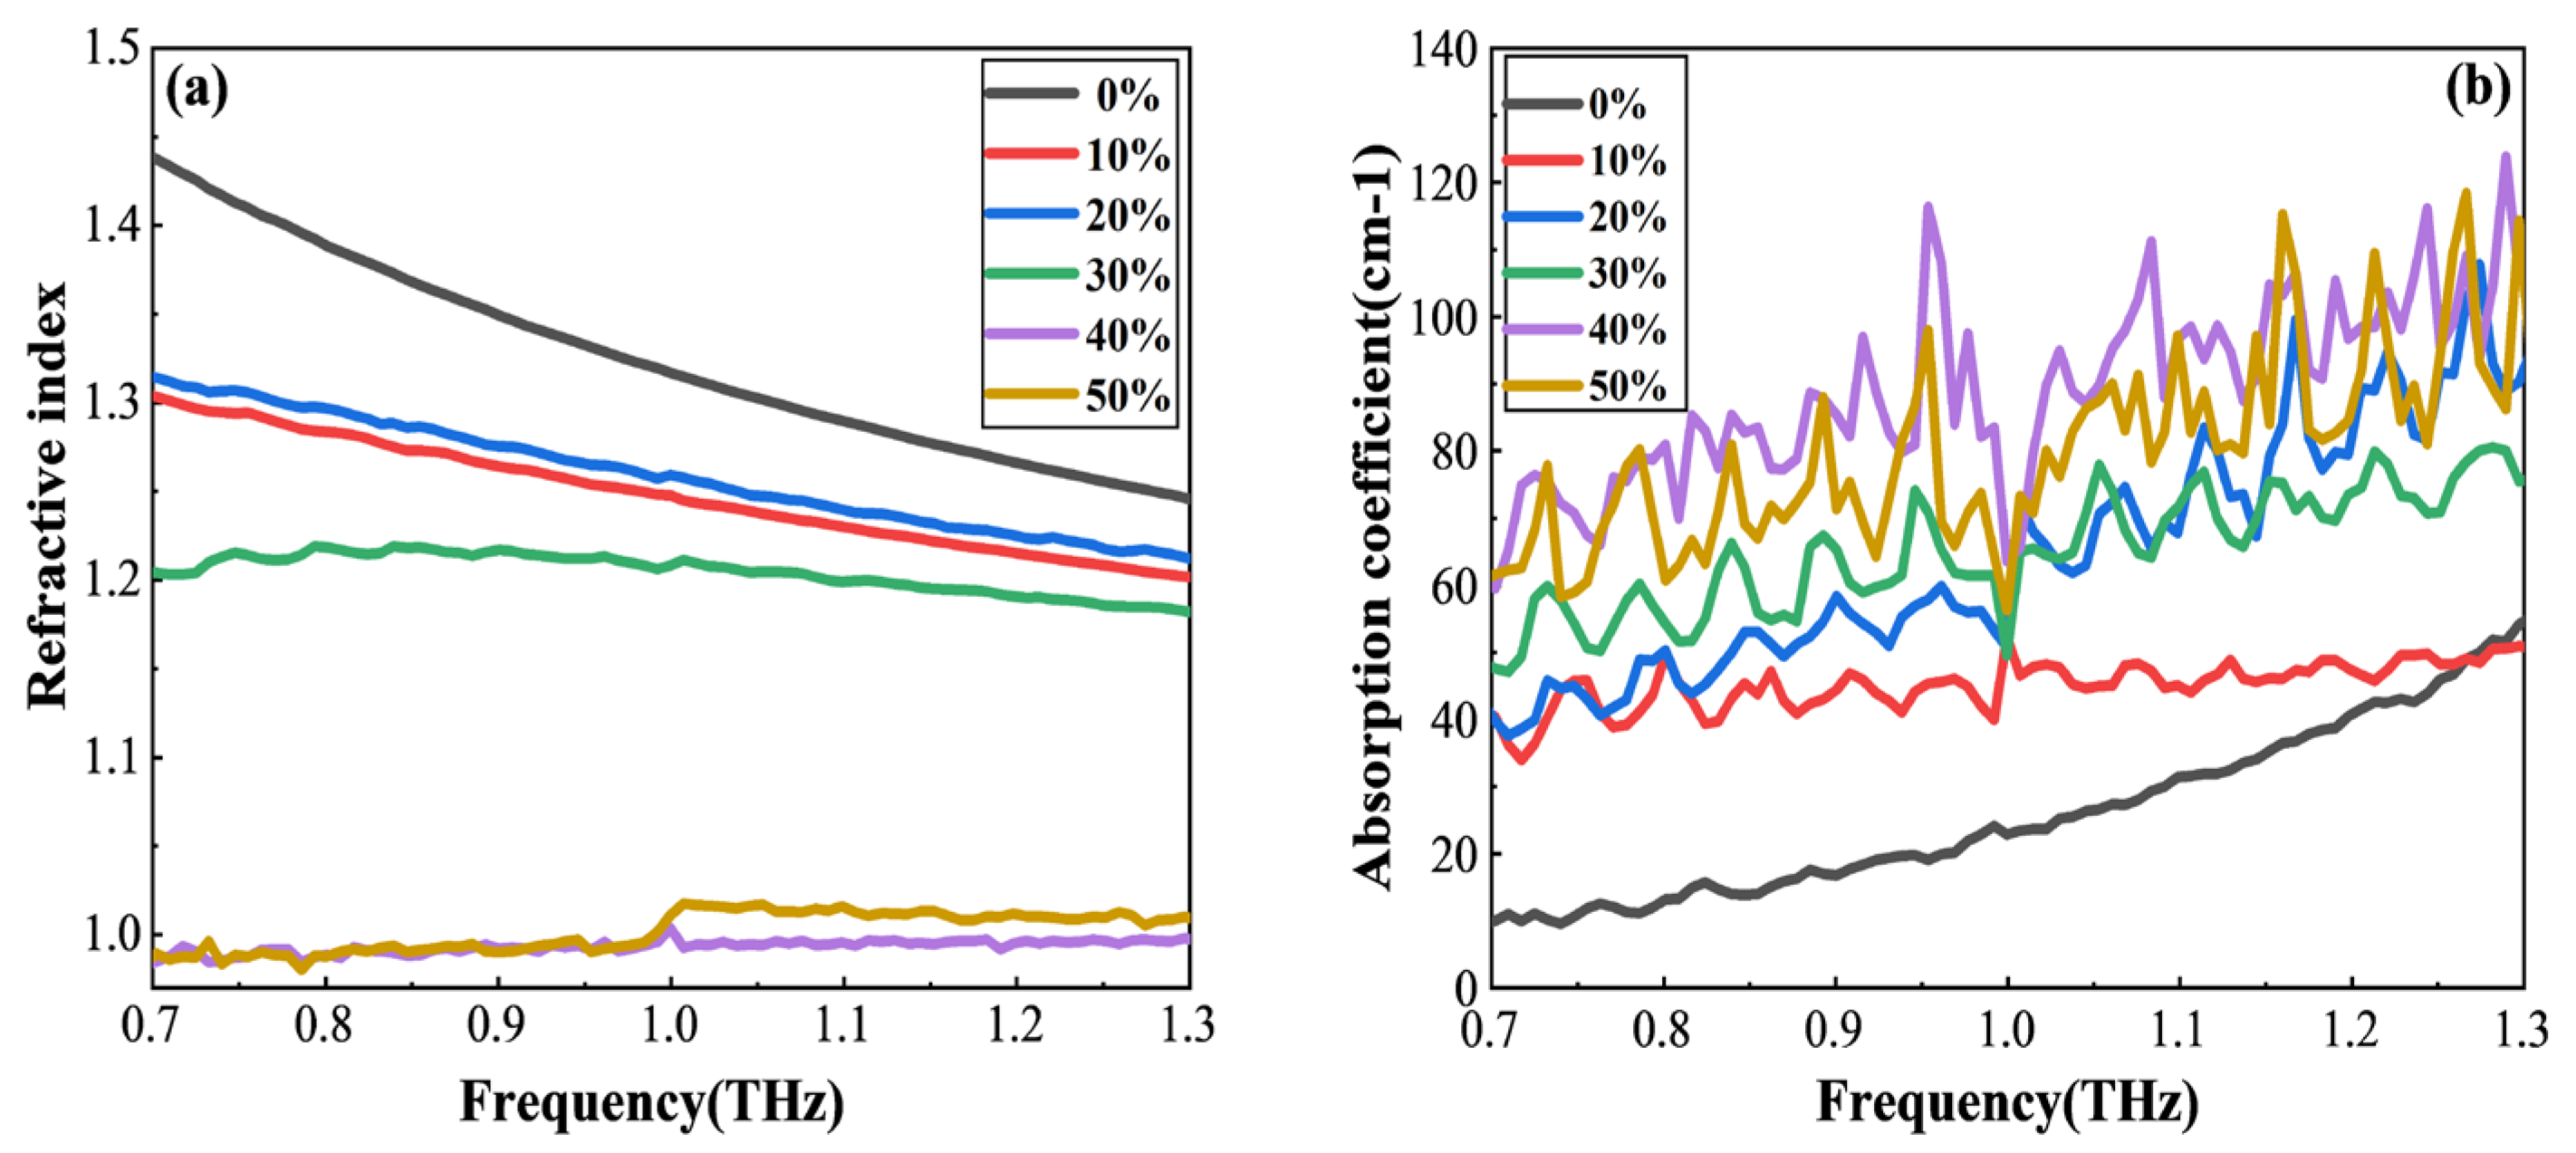
As shown in Figure 5a, by analyzing the refractive index spectrum of the samples, it can be observed that the refractive index of samples with a coal content of 0–30% shows a monotonically decreasing trend, while the refractive index of samples with a coal content of 40–50% is close to 1, indicating that terahertz waves are not sensitive to this range of sample composition, which is consistent with the analysis of the time-domain spectrum.
It should be noted that the absolute refractive index values measured in Figure 5a are lower than the typical terahertz refractive indices of bulk coal and quartz. This is primarily due to the porous nature of our pellet samples, which were prepared by compressing fine powders. The unavoidable air voids (with a refractive index of approximately 1.0) significantly reduce the effective refractive index according to effective medium theory. Numerous studies have reported that the refractive index of porous powder pellets in the terahertz band can be as low as 1.1–1.3 [34]. Therefore, the absolute values in Figure 5a reflect the combined effects of porosity and coal content, rather than the intrinsic bulk values. Nevertheless, the relative trend of a monotonic increase in refractive index with increasing coal content remains reliable, as higher coal content introduces more organic matter with higher polarizability. This trend is consistent with the absorption coefficient data and provides valid feature inputs for machine learning classification.
As shown in Figure 5b, analysis of the absorption spectrum of the samples indicates the following:
(1)
The absorption coefficient of the samples exhibits large fluctuations at frequencies below 0.7 THz or above 1.3 THz, primarily due to a low signal-to-noise ratio in these spectral regions. Therefore, the calculated absorption coefficient outside the 0.7–1.3 THz range is unreliable, and only the absorption spectrum within this effective band is analyzed.
(2)
At lower frequencies, the absorption coefficients of samples with different coal contents have small differences. As the frequency increases, the absorption coefficients of all six sets of data show an upward trend, and the differences between samples in absorption coefficients become increasingly obvious.
(3)
At the same frequency point, the higher the coal content of the sample, the higher its absorption coefficient.
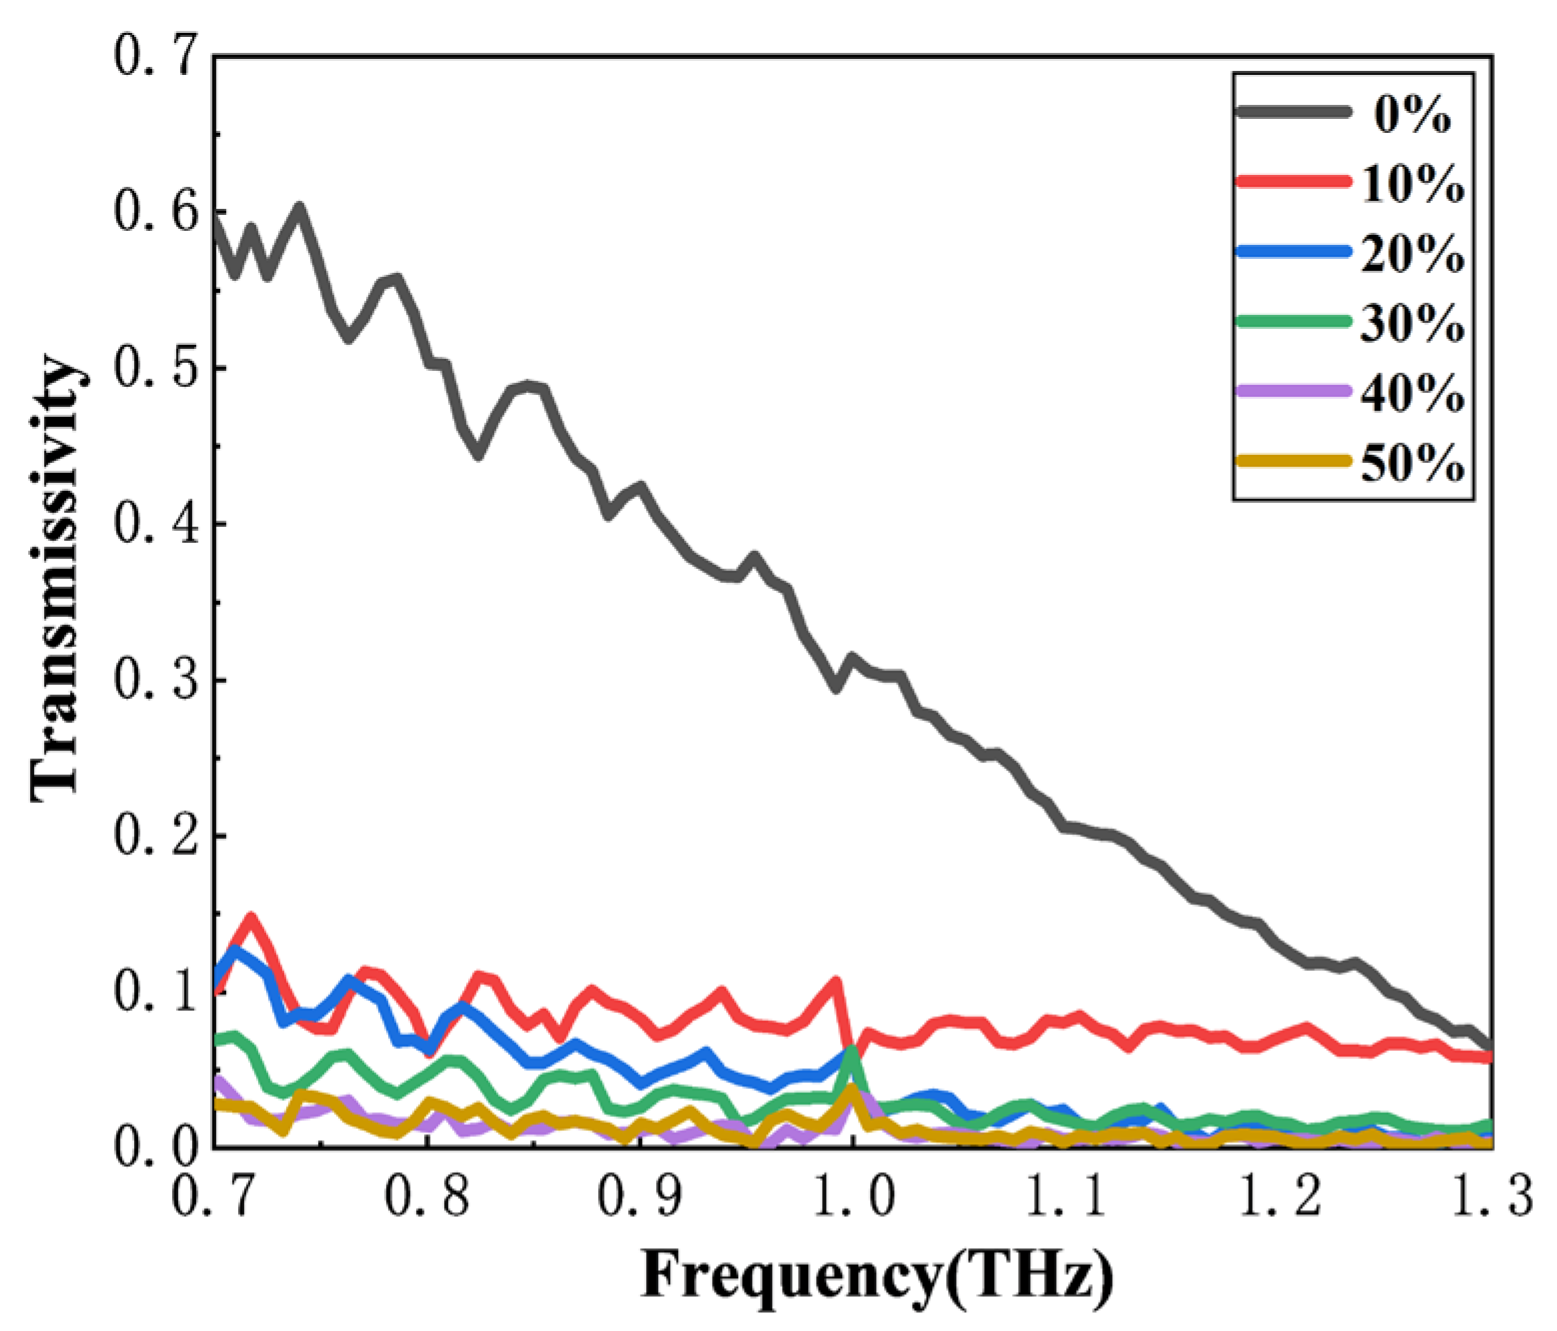
As shown in Figure 6, analysis of the transmission spectra of the samples indicates that there are significant differences in the transmission spectra between whole rock samples and mixed coal–rock samples. At the same frequency point, as the coal content increases, the amplitude of the sample transmission spectra gradually decreases, which is consistent with the patterns in the time-domain spectra and frequency-domain spectra. Moreover, as the coal content continues to increase, the transmission rate of the samples gradually approaches 0, indicating that the coal samples may contain a large amount of metallic substances, which may cause certain obstruction to the transmission of terahertz waves through the samples.
Finally, it should be noted that the pellet preparation method using polyethylene as a binder inevitably introduces porosity. The presence of pores can significantly affect the effective terahertz optical parameters, particularly leading to a reduction in the measured refractive index [35]. In this study, the influence of porosity was not calibrated, which may contribute to the relatively low refractive index values observed in Figure 5a and represents a limitation of the current methodology. Future work will incorporate effective medium theory to correct for porosity effects.

3.2. Classification and Identification of Samples Using Machine Learning Algorithms

3.2.1. Dimensionality Reduction Data Research Based on Principal Component Analysis

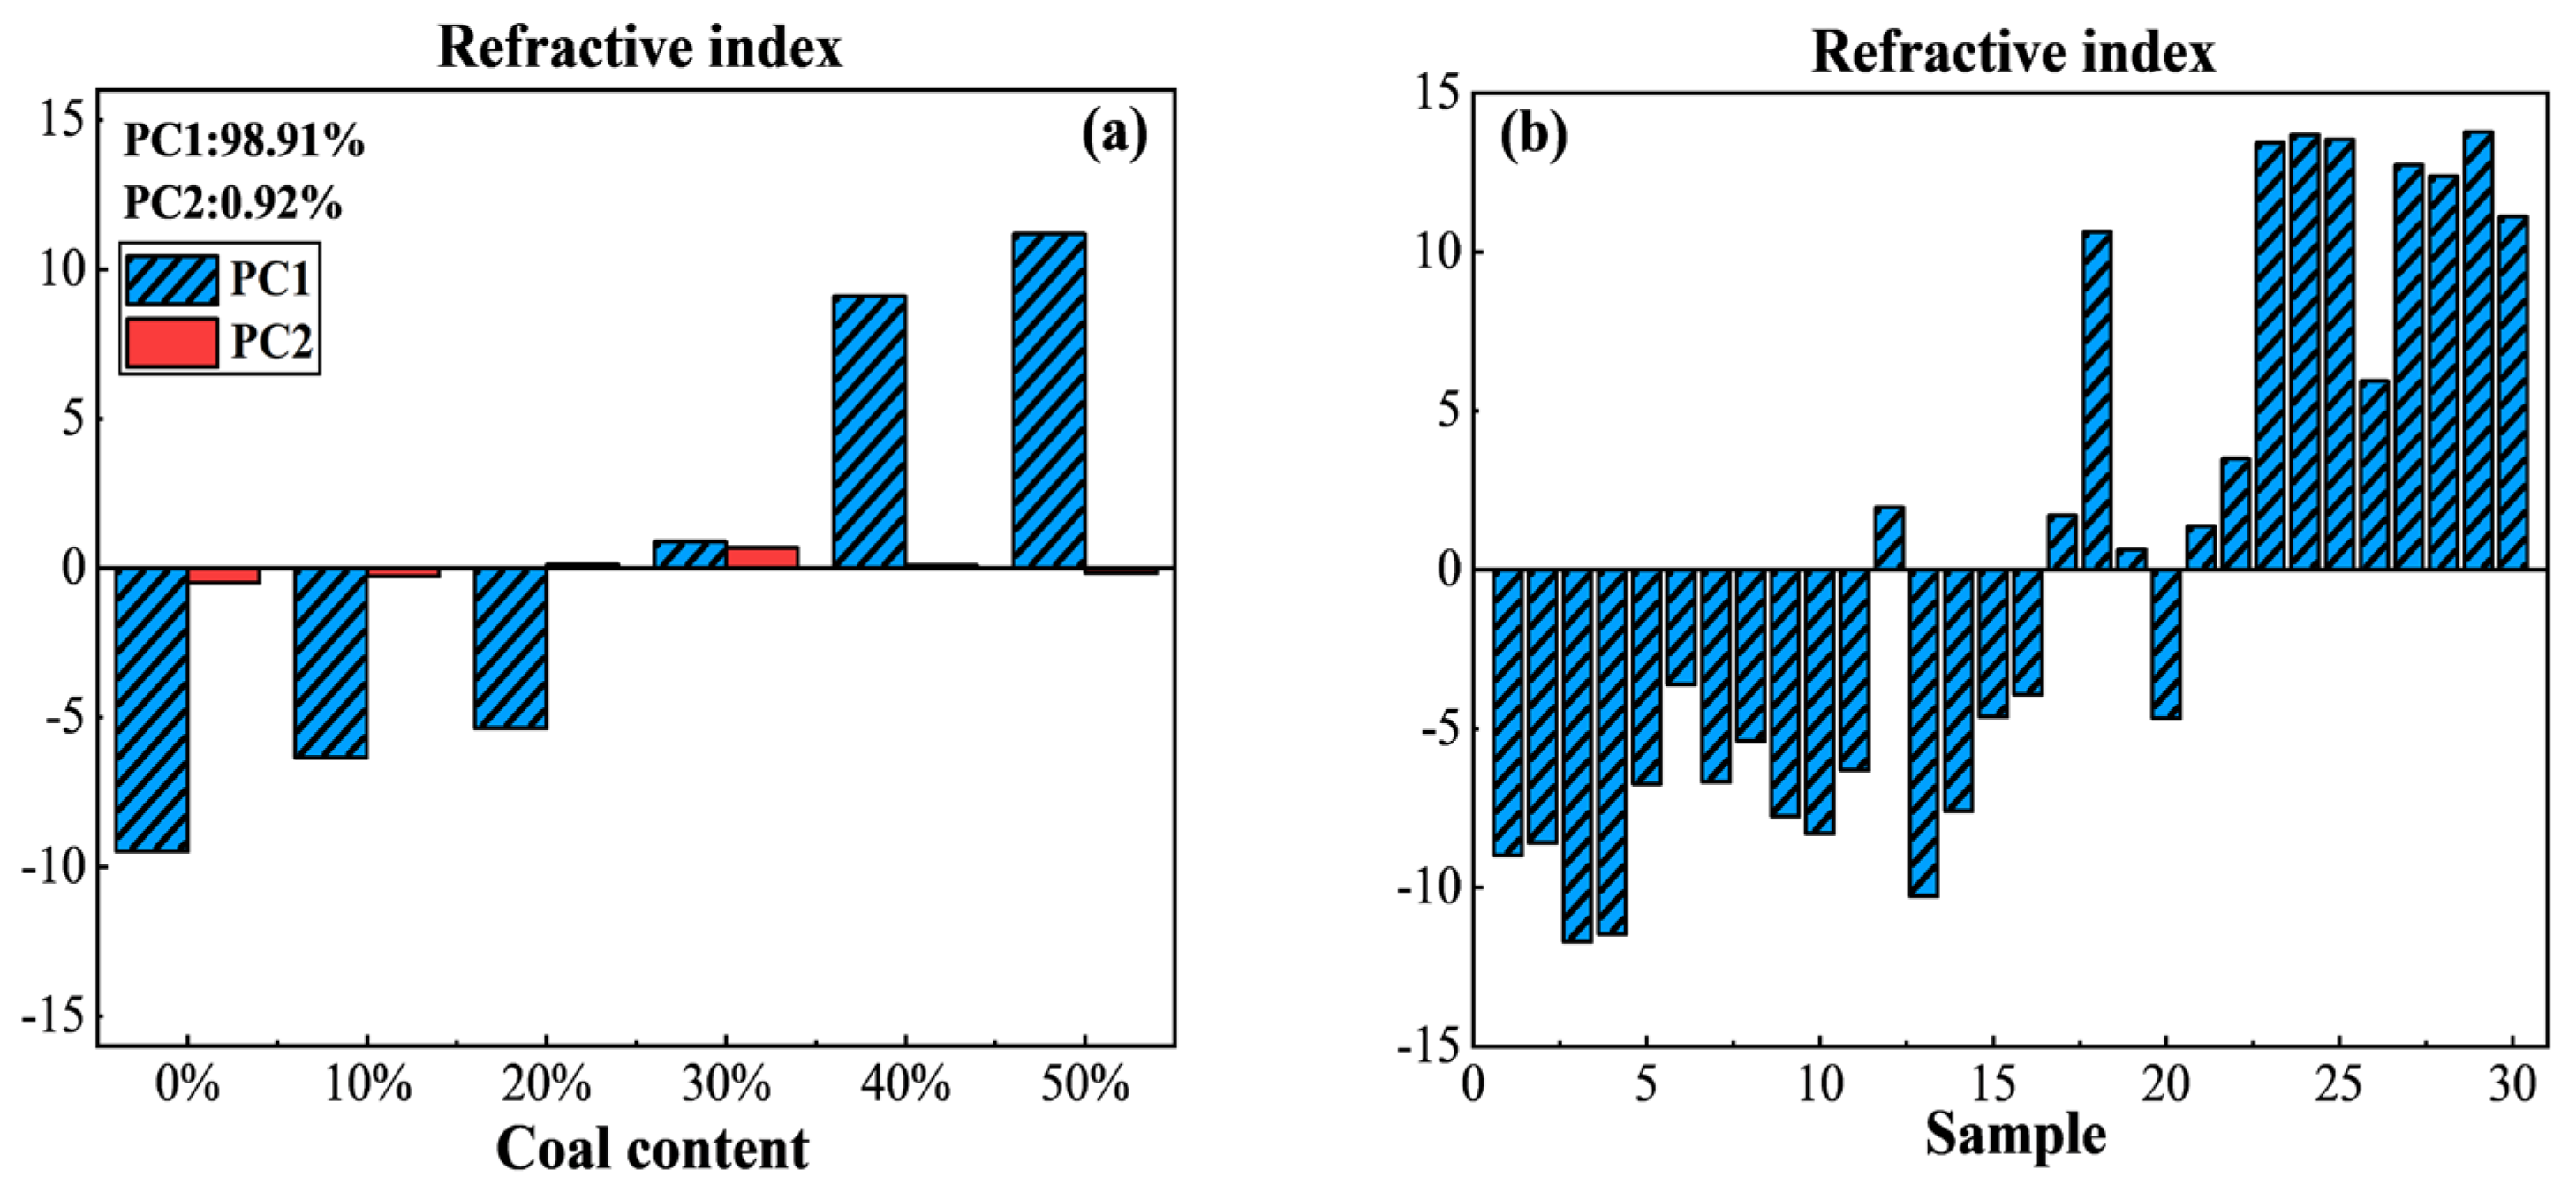
As shown in Figure 7a,b, the results of principal component analysis on the refractive indices of the samples indicate:
(1)
The variance contribution rates of the first principal component (principal component 1, PC1) and the second principal component (principal component 2, PC2) are 98.91% and 0.92%, respectively. The cumulative sum of the variance contribution rates reaches 99.83%, indicating that the use of principal component analysis to extract features from the refractive index spectra of the samples can achieve very good results.
(2)
The PC1 scores of the three samples with coal contents of 30%, 40%, and 50% are positive, while the PC1 scores of the other three samples with different coal contents are negative. Among them, for the sample with a coal content of 30%, the scores of PC1 and PC2 are not significantly different.
(3)
As the coal content increases, the PC1 score changes from negative to positive, and there is a proportional relationship between it and coal content.
(4)
Among all the negative scores, the PC1 score of the sample with a coal content of 0% (the whole rock sample) is the highest, and among all the positive scores, the PC1 score of the sample with a coal content of 50% is the highest.
Figure 7. (a) PC1 and PC2 scores of the refractive index; (b) PC1 scores of each sample.
Photonics 13 00409 g007
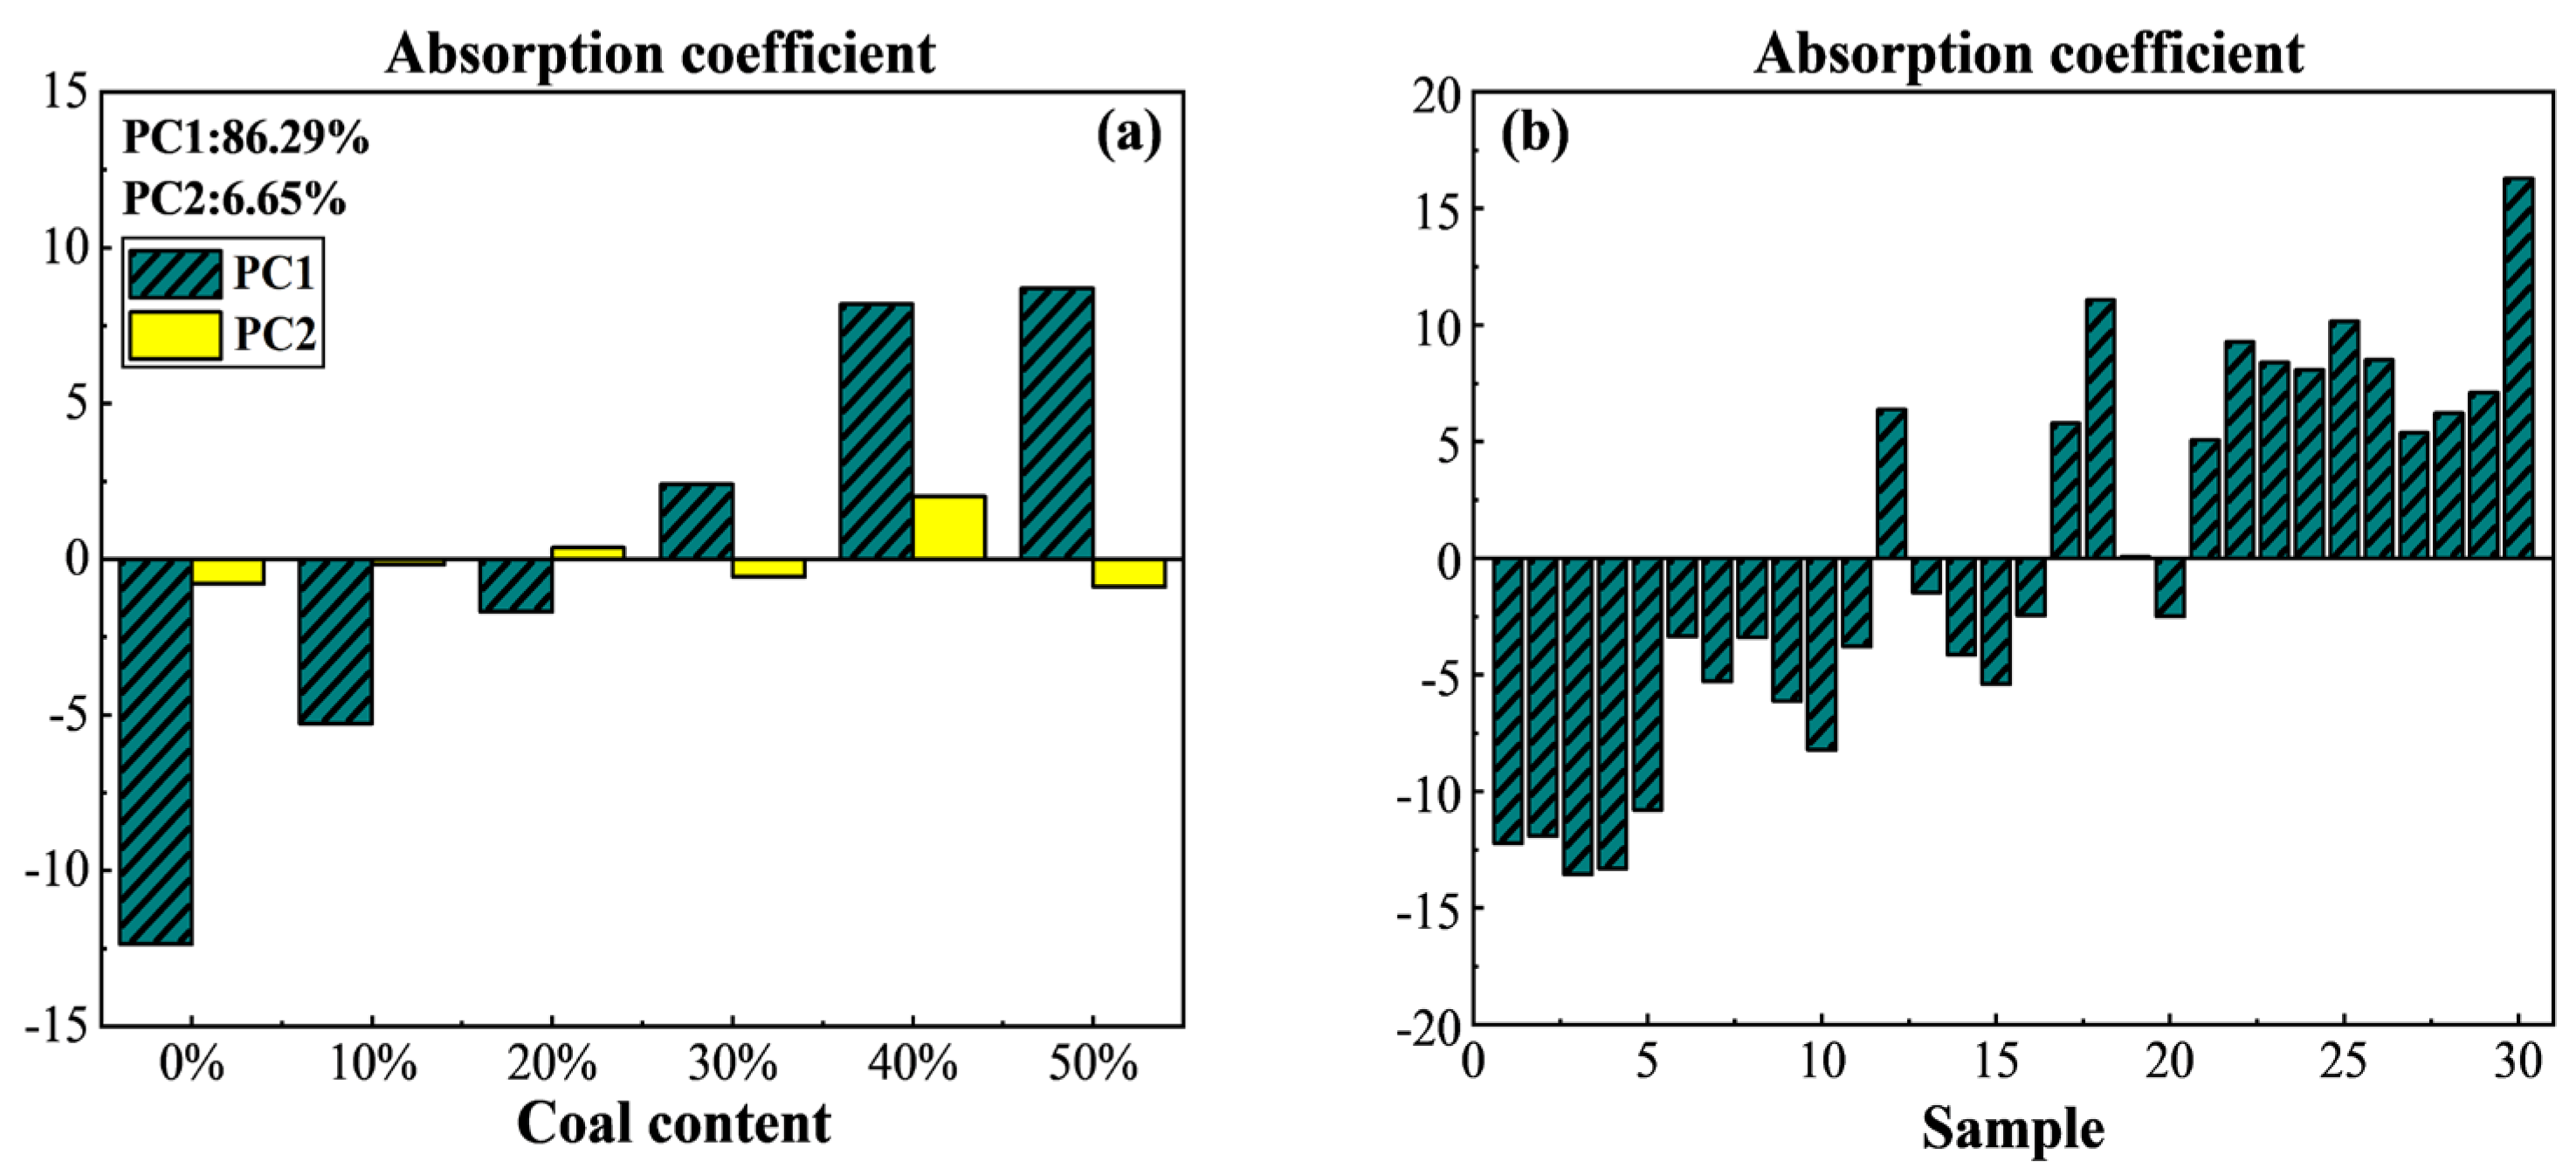
As shown in Figure 8a,b, the results of principal component analysis on the absorption coefficients of the samples indicate:
(1)
The variance contribution rates of the first two principal components are 86.29% and 6.65%, respectively, and the cumulative sum of variance contribution rates reaches 92.94%, which indicates that using the principal component analysis method to extract features from the absorption spectra of the samples can also achieve good results.
(2)
The PC1 scores of the three samples with coal contents of 0%, 10%, and 20% are negative values, while the PC1 scores of the other three samples with different coal contents are positive values.
(3)
As the coal content increases, the PC1 score changes from a negative value to a positive value, showing a proportional relationship with coal content.
(4)
Among all the negative scores, the PC1 score of the sample with 0% coal content (the whole rock sample) is the highest, and among all the positive scores, the PC1 score of the sample with 50% coal content is the highest.
Figure 8. (a) PC1 and PC2 scores of the absorption coefficient; (b) PC1 scores of each sample.
Photonics 13 00409 g008
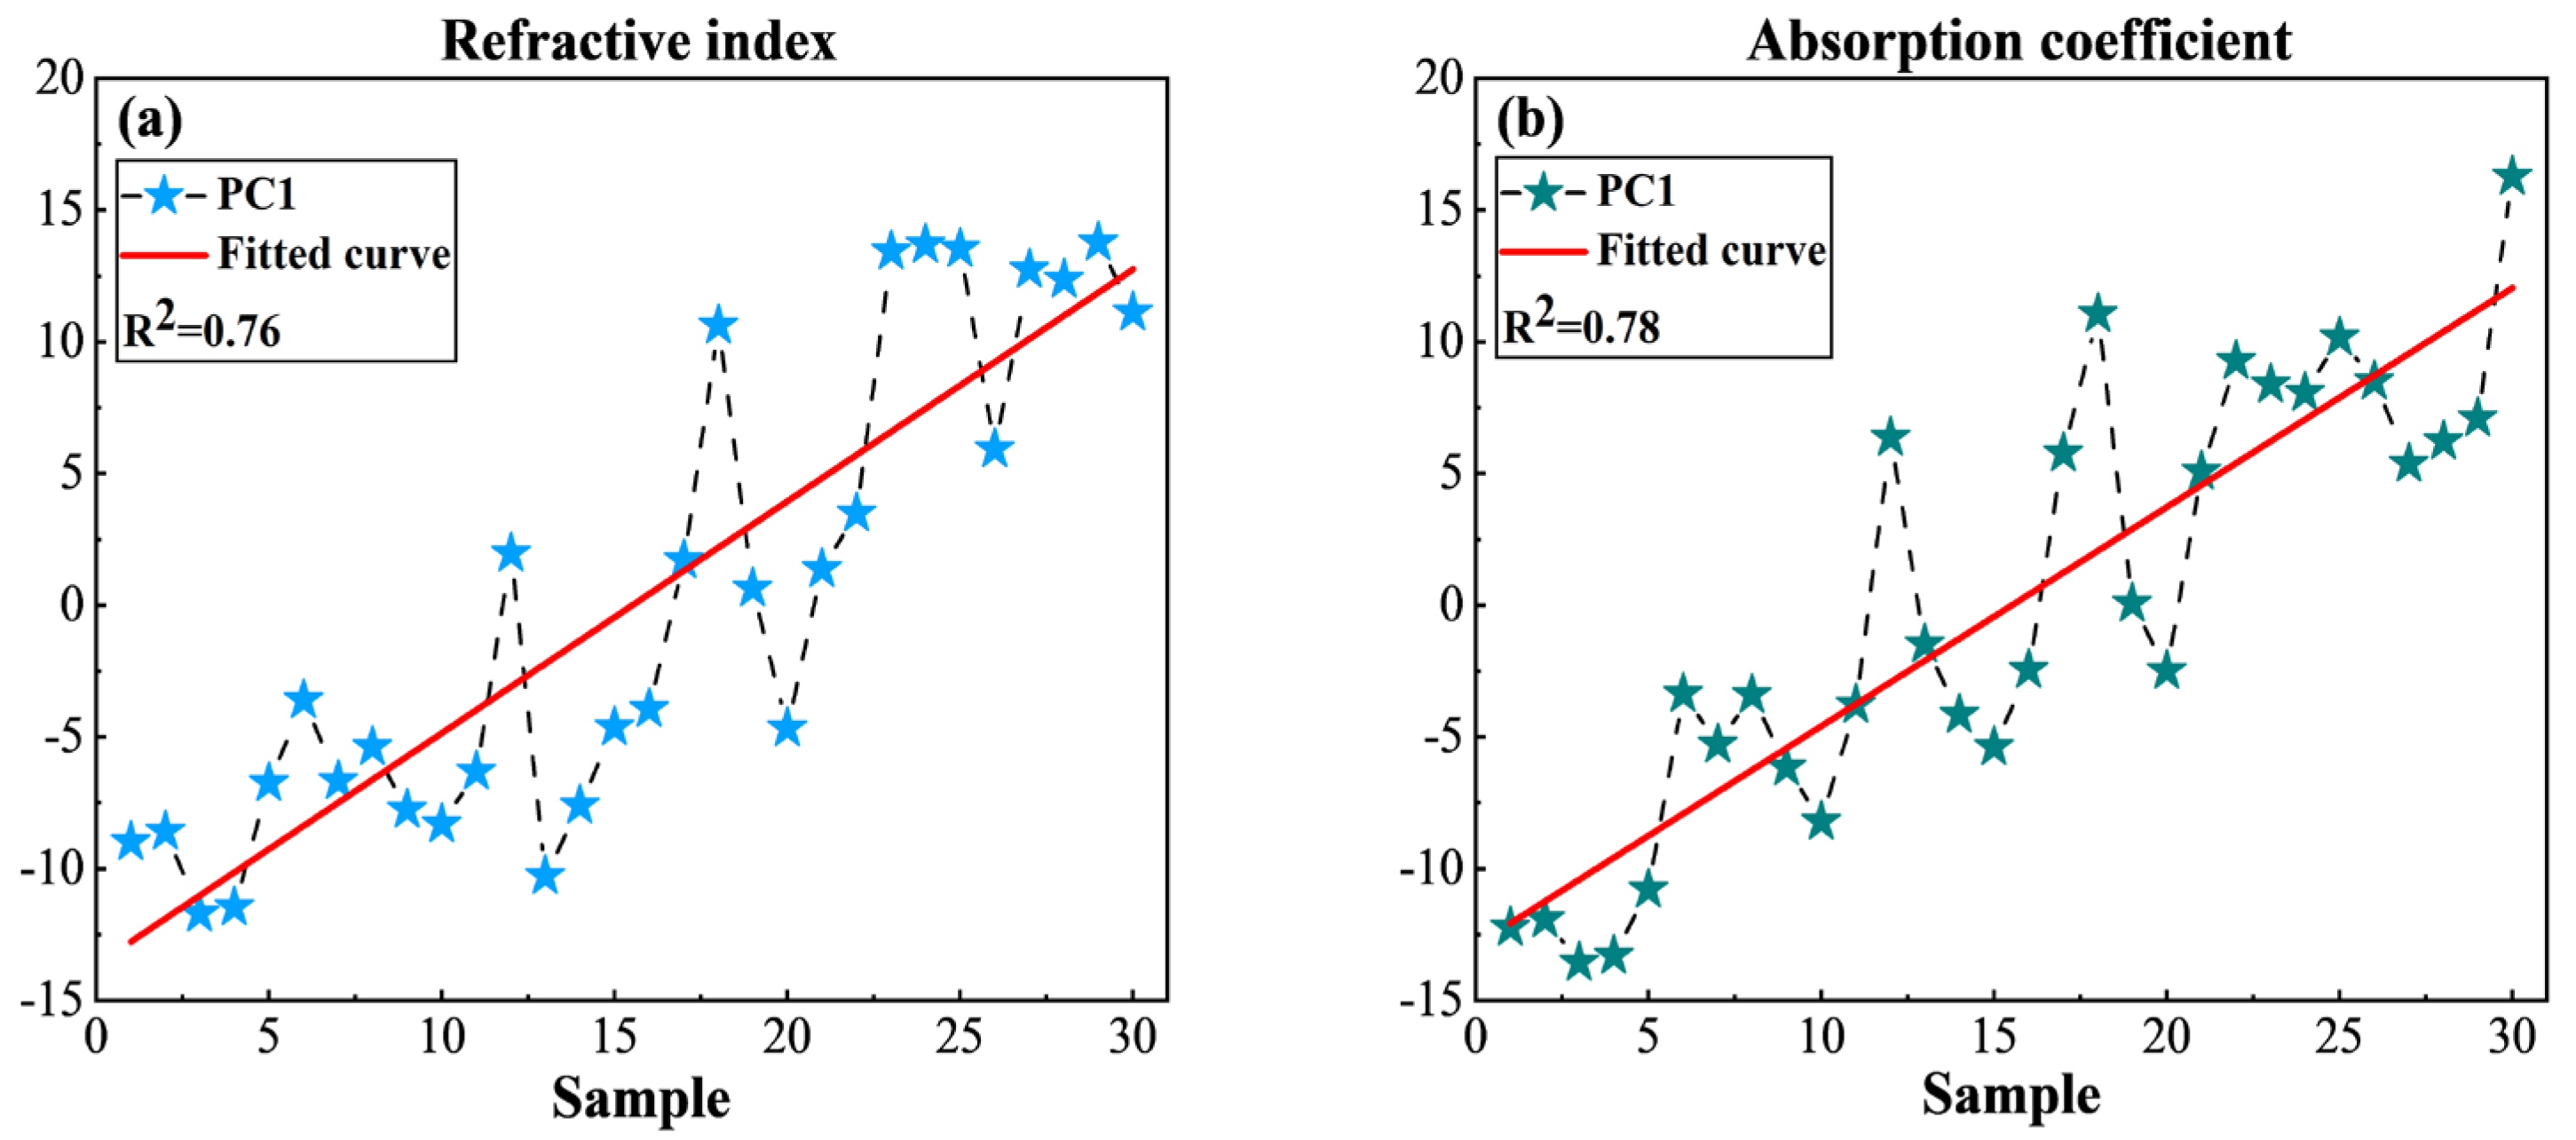
To conduct a more intuitive analysis, the PC1 scores of the refractive index spectra and absorption spectra of 30 coal–rock mixed samples were respectively fitted with the coal content to analyze whether there is a certain relationship between the two and the coal content. As shown in Figure 9, the refractive index and absorption coefficient have a significant positive correlation with coal content, and both increase with the increase in coal content. This indicates that the refractive index and absorption coefficient of the samples are sensitive to changes in coal content, and there is a certain proportional relationship between them. This preliminarily verifies the feasibility of coal–rock identification using coal–rock samples in the terahertz frequency band. The refractive index and absorption coefficient can be used as entry points to study the identification of coal–rock powder samples.
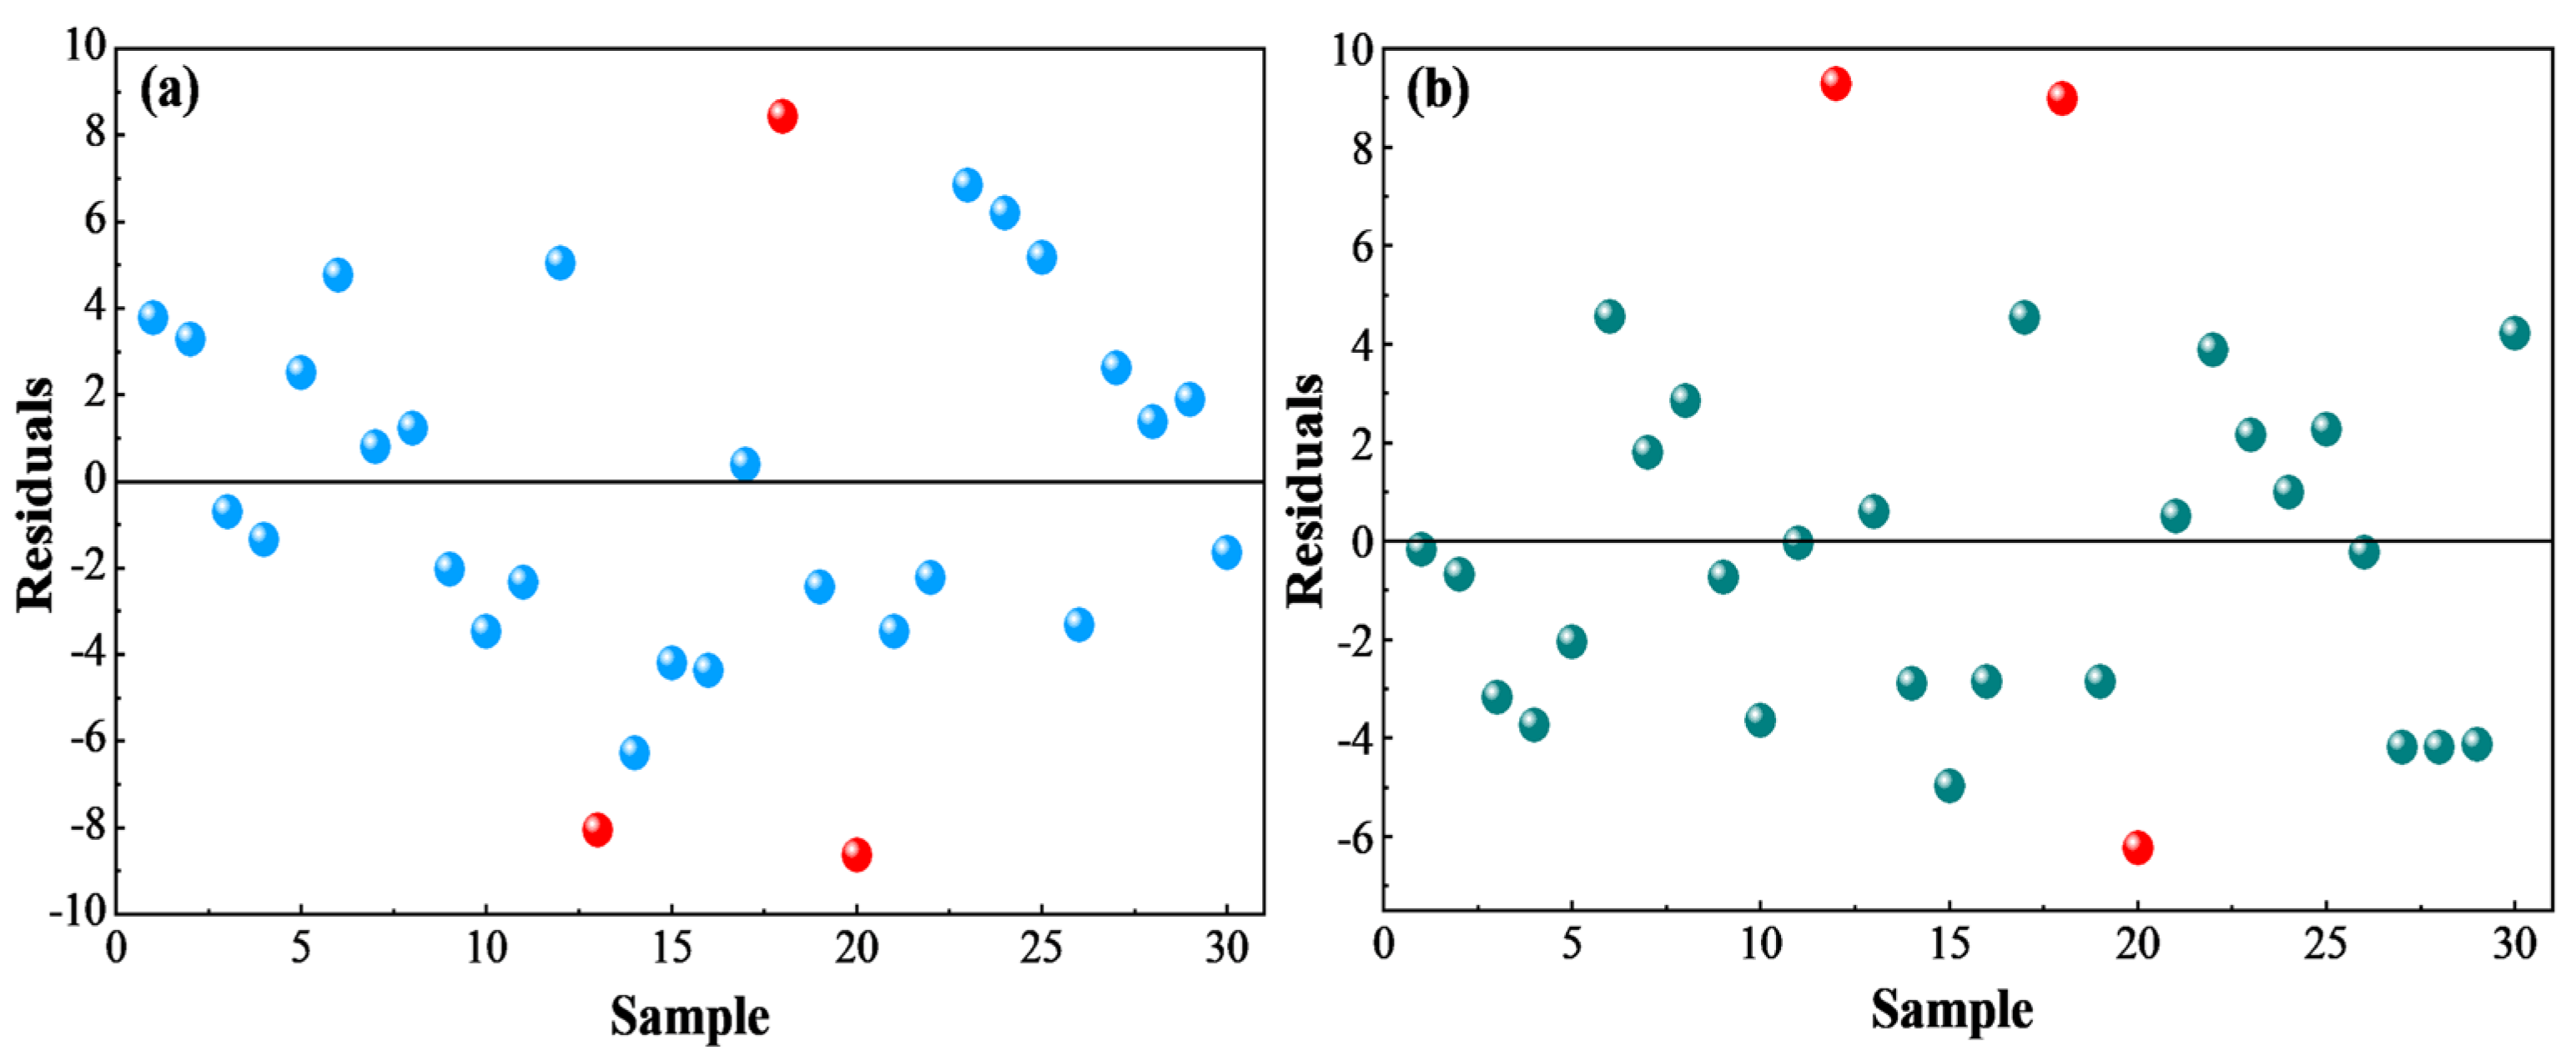
Furthermore, as shown in Figure 10, it can also be observed that although there is a certain correlation between the refractive index, absorption coefficient and coal content, the regression sums of squares R2 for both are 0.76 and 0.78, respectively, and the regression effect is not very satisfactory. The main reason for this result is that there are four data points that are significantly outside the normal range. Specifically, for the refractive index, the outlier data points are samples 12, 18 and 20, while for the absorption coefficient, the outlier data points are samples 13, 18 and 20. Further analysis of the outliers revealed that these samples exhibited slightly uneven surfaces or thickness variations (e.g., sample 12 thickness 1.10 mm, sample 18 thickness 1.14 mm), which may have caused additional scattering losses. These samples were not excluded from subsequent machine learning modeling to avoid artificially inflating performance; however, improving sample preparation uniformity is critical for future work.

3.2.2. Evaluation of Data Classification Effectiveness Based on Machine Learning Algorithms

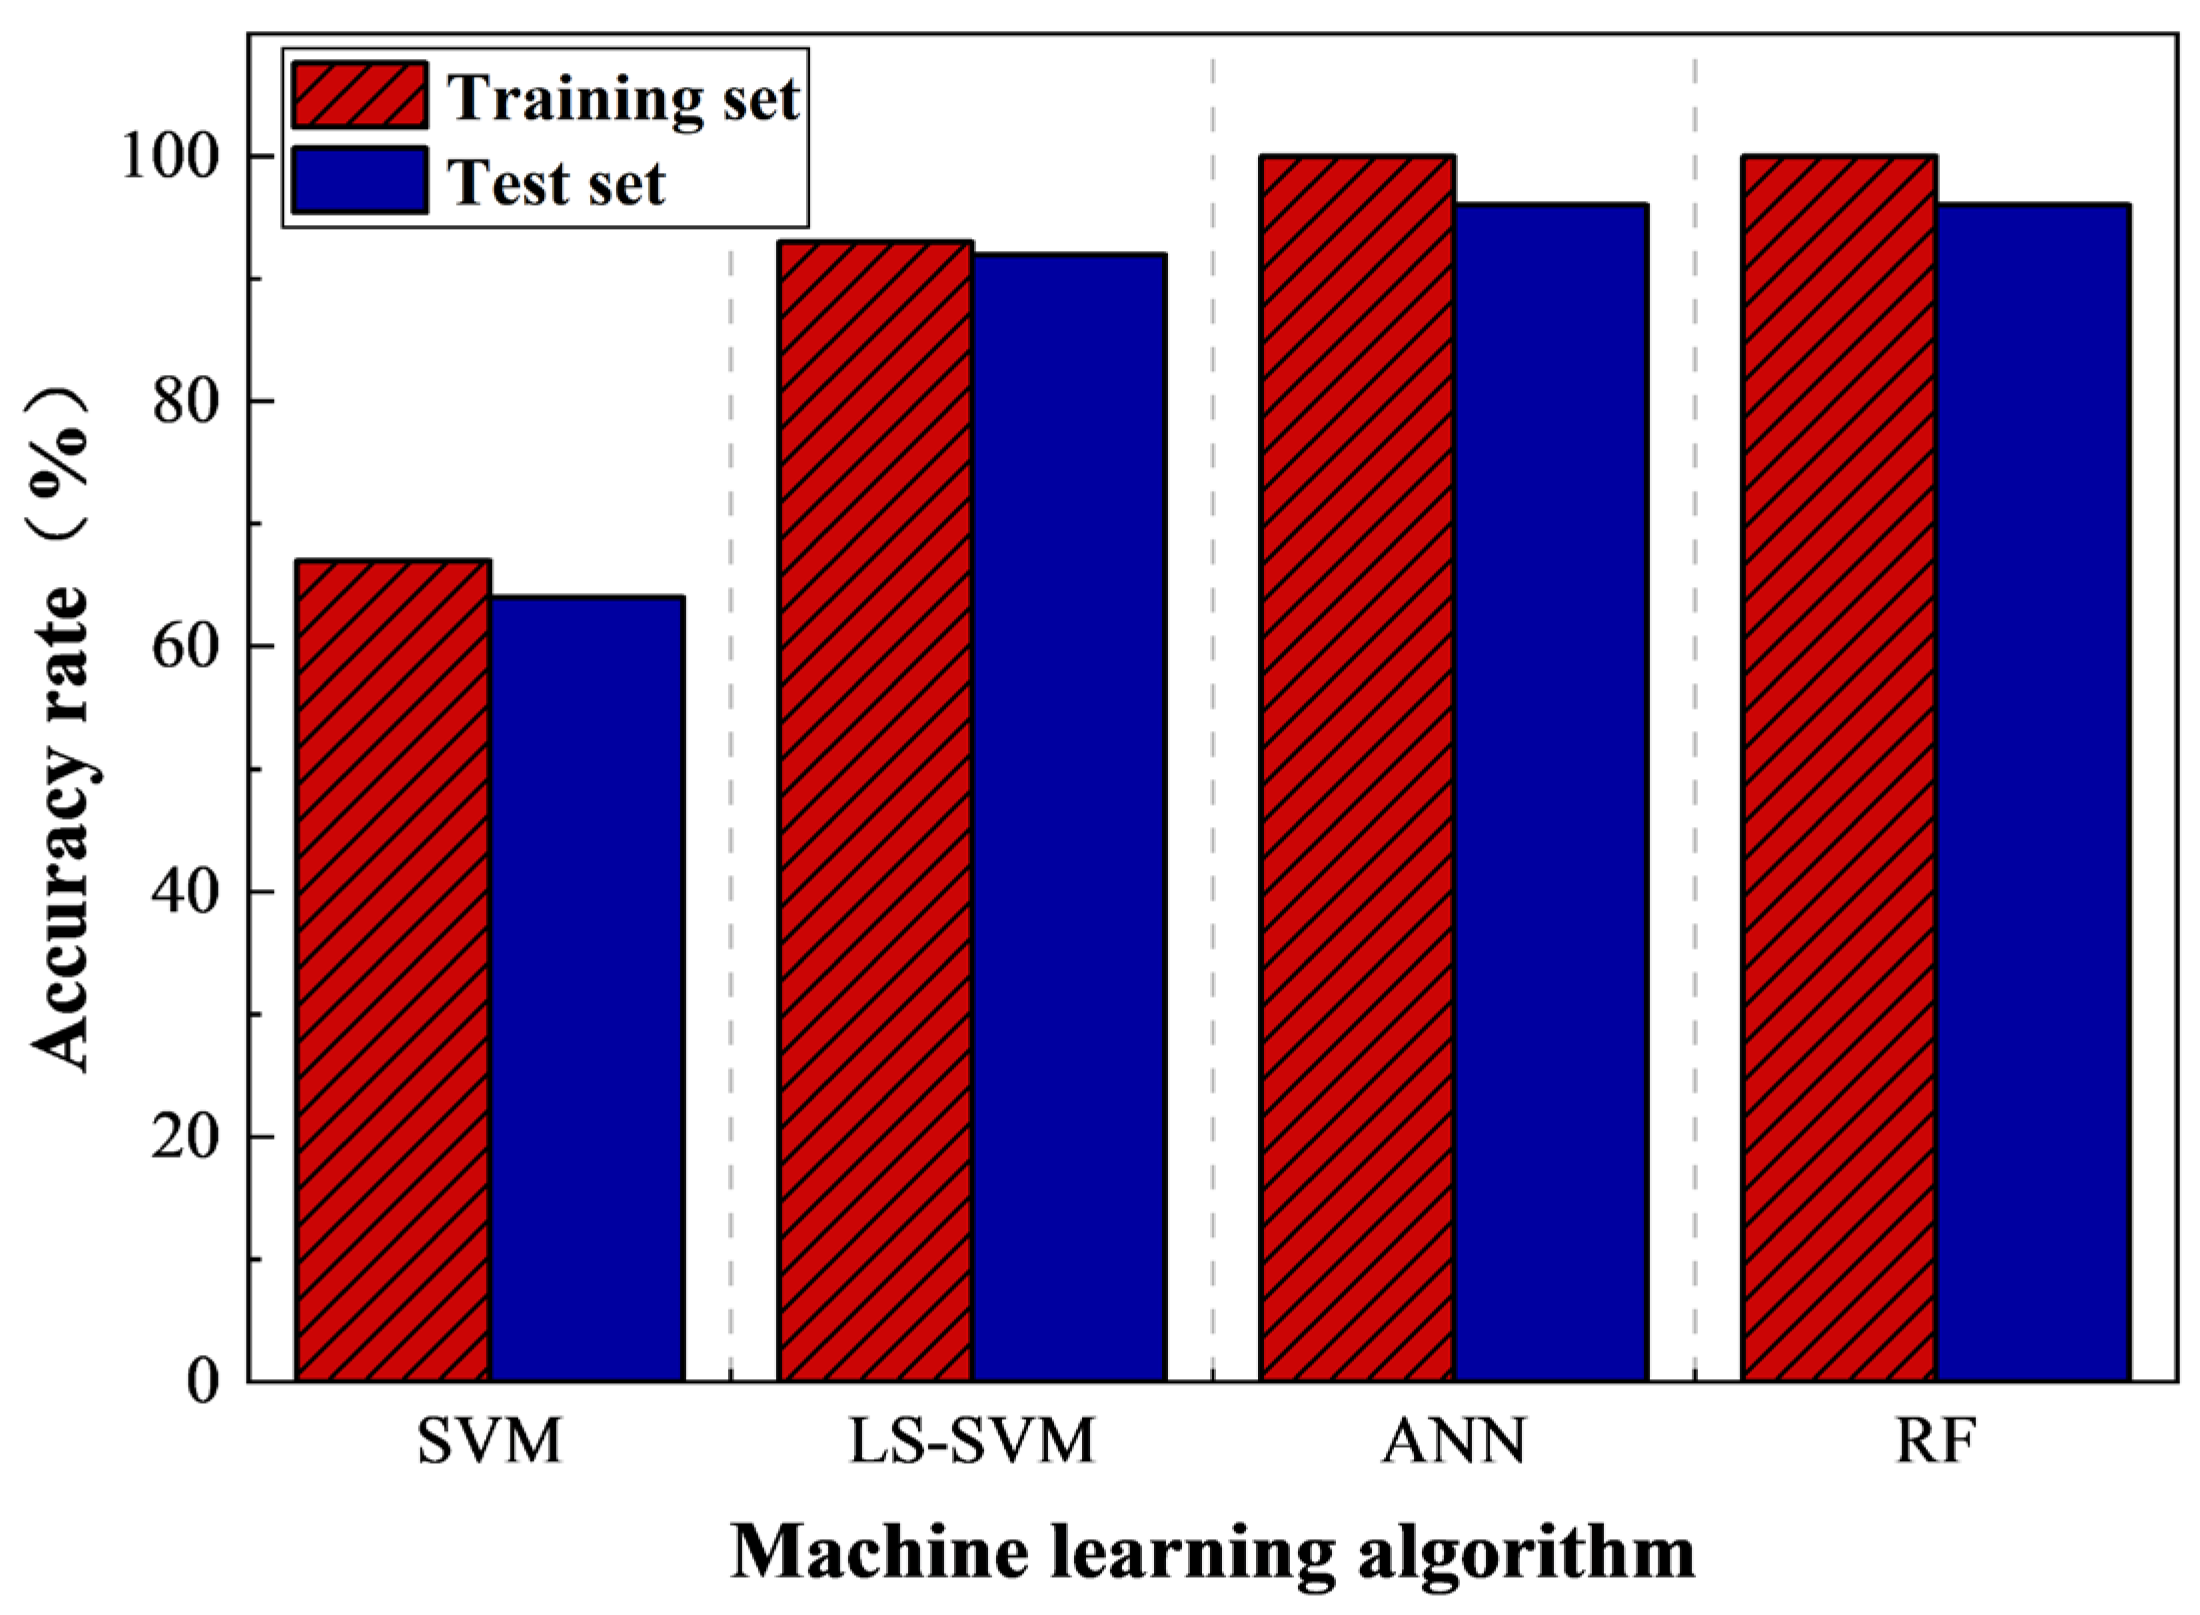
Figure 11 shows the classification performance of the four algorithms (SVM, LS-SVM, ANN, and RF) on a single 7:3 train–test split. In this single run, RF and ANN both achieved 100% accuracy on the training set and 96% on the test set, while LS-SVM obtained 93% training and 92% test accuracy, and SVM obtained 67% training and 64% test accuracy.
To assess statistical robustness, the random 7:3 split was repeated 10 times. Over the 10 repetitions, RF achieved a mean test accuracy of 95.2% with a standard deviation of 1.8% (95% confidence interval (CI): 93.9–96.5%); ANN gave 94.8 ± 2.1% (95% CI: 93.3–96.3%); LS-SVM gave 91.5 ± 2.5%; and SVM gave 63.8 ± 4.1%. A paired t-test between RF and ANN showed no statistically significant difference (p = 0.34), whereas RF significantly outperformed LS-SVM (p = 0.008) and SVM (p < 0.001).
The 10-fold cross-validation was further performed on the full dataset (150 samples). The mean cross-validation accuracies (over 10 folds) were 95.3 ± 1.9% for RF, 94.5 ± 2.1% for ANN, 91.8 ± 2.7% for LS-SVM, and 63.5 ± 4.2% for SVM. These results confirm that RF and ANN have comparable and stable performance, both significantly outperforming LS-SVM and SVM in this coal–rock classification task.

4. Discussion

4.1. Comparison with Existing Coal–Rock Identification Techniques

To benchmark the proposed method combining THz-TDS and machine learning against traditional techniques, accuracy, detection speed, contact requirement, and environmental robustness were compared based on literature and the experimental results of this study. The proposed method achieves competitive accuracy (96%) within its applicable range (0–30% coal content) and offers the advantages of non-contact operation and tolerance to coal dust. However, its current limitation is the inability to reliably detect high-coal-content zones (>30%) in transmission mode. By contrast, gamma-ray methods can measure coal seam thickness up to 400 mm but suffer from radiation safety concerns; machine vision is fast but easily obscured by dust; acoustic and vibration methods are contact-based and sensitive to mechanical conditions. Thus, the proposed method is best suited for rock-dominated interfaces or early mixing stages, and future integration with reflection-mode THz-TDS or complementary sensors could extend its full-range capability.

4.2. Limitations and Future Work

It should be noted that the “coal content” used to describe the coal–rock mixing ratio in this study is based on weight percentage, rather than the volume percentage typically required for analyzing terahertz physical properties. This is because the densities of the coal powder, quartz sand (rock) powder, and polyethylene powder were not measured separately during sample preparation, preventing an accurate conversion from weight ratio-to-volume ratio. However, the propagation and interaction of terahertz waves with matter fundamentally depend on the volume fraction of each component. Consequently, this discrepancy may cause deviations between the optical parameters (e.g., refractive index and absorption coefficient) reported in this paper and the values predicted by ideal effective medium theories based on volume fractions. Therefore, the quantitative analysis presented herein should be understood as an engineering approximation under the fixed pellet preparation procedure, rather than a strict physical quantification. Future work should measure the densities of each component in advance, use volume fractions for sample design and data interpretation, or introduce effective medium models (e.g., the Bruggeman model or Maxwell–Garnett model) to correct for porosity and volume effects.
This study also has several limitations. First, transmission mode THz-TDS fails when the coal content exceeds 30% due to severe signal attenuation, which restricts the practical deployment of this method to scenarios where the coal–rock interface is rock-dominated or coal content is low. Second, although the spectral features themselves are intrinsic, the sample preparation procedure is not directly transferable to in situ underground detection. Third, the dataset size is relatively small, and the observed mild overfitting (100% training accuracy vs. 96% test accuracy) indicates that collecting more data would improve generalization. Future work will focus on: (1) exploring reflection-mode or attenuated total reflection THz-TDS to extend the detectable coal content range; (2) developing fiber-coupled terahertz probes for field applications; (3) collecting a larger dataset with automated sample preparation; and (4) integrating multi-sensor data (e.g., terahertz and near-infrared spectroscopy) for robust full-range coal–rock identification.

5. Conclusions

This study addresses the key issue of low accuracy in coal–rock identification during coal mining. A research method based on THz-TDS and multiple ML algorithms is proposed. By systematically preparing mixed samples with different coal–rock ratios, collecting terahertz time-domain data, extracting key optical parameters, and using principal component analysis for dimensionality reduction, classification models including SVM, LS-SVM, ANN, and RF were constructed. The study verifies that terahertz waves have significant sensitivity to coal–rock media in the 0.7–1.3 THz frequency band for samples with 0–30% coal content, and that the optical parameters show a clear positive correlation with coal content. The specific conclusions are as follows:
(1)
Terahertz waves exhibit significant sensitivity to the physical and chemical properties of coal–rock mixed media within 0–30% coal content, presenting unique spectral characteristics. The amplitude decay of the time-domain spectrum, the effective frequency band (0.7–1.3 THz), and optical parameters such as the refractive index and absorption coefficient all show a clear correlation with coal content, verifying the feasibility of THz-TDS in coal–rock identification within this range.
(2)
After dimensionality reduction by PCA, the random forest algorithm achieved the best classification performance, with a test set accuracy of 96% and a 10-fold cross-validation accuracy of 95.3 ± 1.9%.
(3)
The proposed method is currently limited to coal content below 30% in transmission mode; however, it breaks through the accuracy bottleneck of traditional techniques within this range, providing a new solution for rock-dominated coal–rock interface detection. Future work will extend the detectable range using reflection-mode THz-TDS.

Author Contributions

Conceptualization, D.Y., L.H., Y.Y., Z.L., S.L., L.L. and C.L.; Methodology, D.Y., L.H., Y.Y., Z.L., S.L., J.L., L.L. and C.L.; Software, D.Y. and L.H.; Validation, D.Y. and L.H.; Formal analysis, L.H. and L.L.; Investigation, D.Y., L.H., J.L., L.L. and C.L.; Resources, D.Y., L.H., J.X., Y.Y., Z.L., S.L., L.L. and C.L.; Data curation, L.H., J.L. and C.L.; Writing—original draft, D.Y. and L.H.; Writing—review & editing, D.Y. and J.X.; Supervision, D.Y., J.X., Y.Y. and C.L.; Project administration, D.Y., J.X., Y.Y., L.L. and C.L.; Funding acquisition, D.Y., J.X. and Y.Y. All authors have read and agreed to the published version of the manuscript.

Funding

This research was funded by the Open Fund Project of State Key Laboratory of Intelligent Mining Equipment Technology (No. ZNCKKF20240108, D.Y.), the Excellent Young Talents Fund of Higher Education Institutions of Anhui Province (No. 2024AH030006, D.Y.), the Open Fund Project of State Key Laboratory of Digital Intelligent Technology for Unmanned Coal Mining (No. SKLMRDPC22KF22, D.Y.), the Higher Education Research Project of Anhui Polytechnic University (No. 2025gjzd004, D.Y.), the Teaching Quality Project of Wuhu University (No. WHKCJS-202506, J.X.), the Open Research Fund of Anhui Key Laboratory of Mine Intelligent Equipment and Technology (No. ZKSYS202201, D.Y.), and the Anhui Province High-End Talent Cultivation and Recruitment Action Project: Young Elite Talent and Young Scholar Program.

Data Availability Statement

The original contributions presented in this study are included in the article. Further inquiries can be directed to the corresponding authors.

Conflicts of Interest

Authors Yadong Yang, Zeping Liu and Sitong Li were employed by the company Shanxi TZCO Intelligent Mining Equipment Technology Co., Ltd. The remaining authors declare that the research was conducted in the absence of any commercial or financial relationships that could be construed as a potential conflict of interest.

References

  1. Yuan, L.; Zhang, T.; Wang, Y.H.; Wang, X.; Wang, Y.; Hao, X. Scientific problems and key technologies for safe and efficient mining of deep coal resources. J. China Coal Soc. 2025, 50, 1–12. [Google Scholar]
  2. Yuan, L. Strategic Conception of Carbon Neutralization in Coal Industry. J. Strateg. Study Chin. Acad. Eng. 2023, 25, 103–110. [Google Scholar] [CrossRef]
  3. Yuan, L. Challenges and countermeasures for high quality development of China’s coal industry. J. China Coal 2020, 46, 6–12. [Google Scholar]
  4. Liu, W.-B. Thoughts on the high-quality development path of coal enterprises under the goal of ‘double carbon’. J. China Coal Ind. 2022, 5, 12–14. [Google Scholar]
  5. Zhang, K. Thinking and practice of green development of coal enterprises under the goal of ‘double carbon’. J. China Coal Ind. 2024, 12, 67–69. [Google Scholar]
  6. Wang, G.-F.; Zhang, J.-H.; Ren, H.-W.; Du, Y.; Zhang, D.; Yan, R.; Yu, X. Research and application of digital intelligence technology and complete equipment for efficient coal mining. J. China Coal Soc. 2025, 50, 43–64. [Google Scholar]
  7. Wei, R.; Xu, L.-J.; Meng, X.-Y.; Wu, J.-F.; Zhang, K. Coal rock recognition method based on hyperspectral characteristic absorption peak. Spectrosc. Spectr. Anal. 2021, 41, 1942–1948. [Google Scholar]
  8. Ge, S.-R. Development history of shearer technology (6)-coal-rock interface detection. J. China Coal 2020, 46, 10–24. [Google Scholar]
  9. Wang, G.-F.; Pang, Y.-H.; Ren, H.-W. Intelligent mining mode and technical path of coal mine. J. Min. Strat. Control Eng. 2020, 2, 5–19. [Google Scholar]
  10. Feng, G.; Zhang, N.; Feng, X.-W.; Xie, Z.; Li, Y. Autonomous prediction of rock deformation in fault zones of coal roadways using supervised machine learning. Tunn. Undergr. Space Technol. 2024, 147, 105724. [Google Scholar] [CrossRef]
  11. Zhou, Y.; Qu, J.-B.; Bai, J.-W.; Feng, G.; Cui, B.; Ren, W.; Liu, D.; Zhang, L. Interpretable damage state identification in coal-backfilling structures using hybrid signal processing and machine learning approaches. Mater. Today Commun. 2025, 48, 113308. [Google Scholar] [CrossRef]
  12. Liu, Y.; Xu, Y.-P.; Chen, P.; Li, J.-Y.; Liu, D.; Chu, X.-L. Non-destructive spectroscopy assisted by machine learning for coal industrial analysis: Strategies, progress, and future prospects. Trends Anal. Chem. 2025, 192, 118322. [Google Scholar] [CrossRef]
  13. Lu, J.; Jiang, W.; Xie, H.-P.; Gao, H.; Zhang, D. Dynamic disaster mechanism and acoustic emission evolution of deep coal-rock under true triaxial disturbance stress. J. Rock Mech. Geotech. Eng. 2025, 17, 5829–5844. [Google Scholar] [CrossRef]
  14. Zhang, Y.; Tong, L.; Lai, X.-P.; Cao, S.; Yan, B.; Liu, Y.; Sun, H.; Yang, Y.; He, W. Perception and accurate recognition of coal-rock interface in tunneling space under coal dust environment based on machine vision. J. China Coal Soc. 2024, 49, 3276–3290. [Google Scholar]
  15. Liu, Y.; Lei, S.; Wang, Z.-B.; Wei, D.; Gu, J.; Li, X.; Dai, J. A time–frequency analysis method of electromagnetic signal for coal and rock properties recognition while drilling based on CWT and GAPSO-ROA. Measurement 2025, 253, 117447. [Google Scholar] [CrossRef]
  16. Wei, D.-B. Research of Seam Thickness Detection to Automatically Raise Shearer Arm Based on Natural γ-ray. J. Coal Mine Mach. 2015, 36, 3. [Google Scholar]
  17. Shi, C.-W.; Gao, Z.-B. Study on the influence of rough surface on ground penetrating radar identification results of coal-rock interface. J. Coal Eng. 2024, 56, 176–181. [Google Scholar]
  18. Jepsen, P.U.; Cooke, D.G.; Koch, M. Terahertz spectroscopy and imaging—Modern techniques and applications. Laser Photonics Rev. 2011, 5, 124–166. [Google Scholar] [CrossRef]
  19. Liu, X.-M.; Yu, J.-S.; Chen, X.-D. Millimeter wave and terahertz quasi-optical technology: Theory, application and development. J. Terahertz Sci. Electron. Inf. 2022, 20, 631–652. [Google Scholar]
  20. Qu, B.-L.; Zhu, H.-Q.; Tian, R.; Hu, L.; Wang, J.; Liao, Q.; Gao, R.; Wang, H. Investigation of the impact of pyrite content on the terahertz dielectric response of coals and rapid recognition with kernel-svm. Energy 2023, 285, 129546. [Google Scholar] [CrossRef]
  21. Zhang, T.; Zheng, Z.-Y.; Zhang, M.-R.; Li, S.; Zheng, X.; Huang, H.; Shen, J.; Zhang, Z.; Qiu, K. Quantitatively characterization of rare earth ore by terahertz time-domain spectroscopy. Infrared Phys. Technol. 2024, 142, 105587. [Google Scholar] [CrossRef]
  22. Moffa, C.; Curcio, A.; Merola, C.; Migliorati, M.; Palumbo, L.; Felici, A.C.; Petrarca, M. Discrimination of natural and synthetic forms of azurite: An innovative approach based on high-resolution terahertz continuous wave (THz-CW) spectroscopy for Cultural Heritage. Dyes Pigment. 2024, 229, 112287. [Google Scholar] [CrossRef]
  23. Zhu, H.-Q.; Wang, H.-R.; Liu, J.-L.; Wang, W.; Gao, R.; Zhang, Y. Application of terahertz dielectric constant spectroscopy for discrimination of oxidized coal and unoxidized coal by machine learning algorithms. Fuel 2021, 293, 120470. [Google Scholar] [CrossRef]
  24. Huang, S.T.; Deng, H.-X.; Wei, X.; Zhang, J. Progress in application of terahertz time-domain spectroscopy for pharmaceutical analyses. Front. Bioeng. Biotechnol. 2023, 11, 1219042. [Google Scholar] [CrossRef]
  25. Liang, B. Stretchable and wearable terahertz absorbing composites based on three-dimensional graphene. Technol. Wind 2020, 32, 180–181. [Google Scholar]
  26. Rytik, A.P.; Tuchin, V.V. Effect of terahertz radiation on cells and cellular structures. Front. Optoelectron. 2025, 18, 25–55. [Google Scholar] [CrossRef] [PubMed]
  27. Zhao, C.-X. Test and analysis of terahertz wave transmission characteristics of polymer materials. Sci. Technol. Inf. 2010, 22, 92. [Google Scholar]
  28. Hagenvik, H.O.; Skaar, J. Magnetic permeability in Fresnel’s equation. J. Opt. Soc. Am. B 2019, 36, 1386–1395. [Google Scholar] [CrossRef]
  29. Taneco-Hernandez, M.A.; Morales-Delgado, V.F.; Gómez-Aguilar, J.F. Fundamental solutions of the fractional Fresnel equation in the real half-line. Phys. A-Stat. Mech. Its Appl. 2019, 521, 807–827. [Google Scholar] [CrossRef]
  30. Duvillaret, L.; Garet, F.; Coutaz, J.L. Highly precise determination of optical constants and sample thickness in terahertz time-domain spectroscopy. Appl. Opt. 1999, 38, 409–415. [Google Scholar] [CrossRef]
  31. Dorney, T.D.; Baraniuk, R.G.; Mittleman, D.M. Material parameter estimation with terahertz time-domain spectroscopy. J. Opt. Soc. Am. A 2001, 18, 1562–1571. [Google Scholar] [CrossRef]
  32. Little, M.A.; Varoquaux, G.; Saeb, S.; Lonini, L.; Jayaraman, A.; Mohr, D.C.; Kording, K.P. Using and understanding cross-validation strategies. Perspectives on Saeb et al. GigaScience 2017, 6, 1–6. [Google Scholar]
  33. Zhang, Y.; Zhou, WH.; Ge, HY.; Jiang, Y.-Y.; Guo, C.-Y.; Wang, H.; Wen, Q.-Q.; Wang, Y.-X. Research on defect detection of GFRP composite materials based on terahertz imaging technology. Spectrosc. Spectr. Anal. 2025, 45, 1874–1881. [Google Scholar]
  34. Naftaly, M.; Tikhomirov, I.; Hou, P.; Markl, D. Measuring Open Porosity of Porous Materials Using THz-TDS and an Index-Matching Medium. Sensors 2020, 20, 3120. [Google Scholar] [CrossRef] [PubMed]
  35. Murphy, K.N.; Naftaly, M.; Nordon, A.; Markl, D. Polymer Pellet Fabrication for Accurate THz-TDS Measurements. Appl. Sci. 2022, 12, 3475. [Google Scholar] [CrossRef]
Figure 1. (a) TAS7500SP system diagram; (b) schematic diagram of transmission THz-TDS technology.
Photonics 13 00409 g001
Figure 2. Schematic diagram of terahertz wave transmission through samples.
Photonics 13 00409 g002
Figure 3. Principle diagram of cross-validation.
Photonics 13 00409 g003
Figure 4. (a) Time-domain spectrogram; (b) time-domain spectrogram after Gaussian smoothing; (c) spectra in the frequency-domain; (d) frequency-domain spectrogram (no reference signal).
Photonics 13 00409 g004
Figure 5. Refractive index spectrum (a) and absorption coefficient spectrum (b) of samples.
Photonics 13 00409 g005
Figure 6. Transmission spectrum of samples.
Photonics 13 00409 g006
Figure 9. (a) Fitting situation of refractive index and coal content; (b) fitting situation of absorption coefficient and coal content.
Photonics 13 00409 g009
Figure 10. Fitting residual diagram of refractive index (a) and absorption coefficient (b).The red dots highlighted in the figure represent abnormal data points, while the dots of other colors represent normal data points.
Photonics 13 00409 g010
Figure 11. Classification performance of the four algorithms (SVM, LS-SVM, ANN, and RF) on a single 7:3 train–test split.
Photonics 13 00409 g011
Table 1. Ratio parameters of 11 different coal–rock mixing ratios.
Serial NumberCoal Powder Content (%)Coal Powder Weight (mg)
100
2104.0
3208.0
43012.0
54016.0
65020.0
76024.0
87028.0
98032.0
109036.0
1110040.0
Table 2. Message of the samples.
Serial NumberCoal Powder Content (%)Thickness (mm)Serial NumberCoal Powder Content (%)Thickness (mm)Serial NumberCoal Powder Content (%)Thickness (mm)
0101.0120301.0039701.16
0201.0521401.2140701.11
0300.8922401.0041801.22
0400.8923401.0842801.07
0501.1324401.0843801.16
06101.2225400.9144801.03
07101.0926501.1245800.91
08101.1827501.2746900.98
09101.0128501.2547901.14
10101.0729501.1948900.98
11201.2030500.9749901.08
12201.1031601.2650901.17
13200.9132600.96511001.15
14201.0133601.13521001.05
15201.2234601.02531001.09
16301.0335601.10541001.00
17301.1436700.86551001.04
18301.1437701.20///
19301.2638701.10///
Disclaimer/Publisher’s Note: The statements, opinions and data contained in all publications are solely those of the individual author(s) and contributor(s) and not of MDPI and/or the editor(s). MDPI and/or the editor(s) disclaim responsibility for any injury to people or property resulting from any ideas, methods, instructions or products referred to in the content.