Abstract
Broadband optical amplifiers operating in the 2 μm spectral region are critical for advancing mid-infrared photonic systems, yet achieving high gain with low noise remains challenging. In this work, we demonstrate a high-performance tapered fiber amplifier incorporating PbS quantum dots (QDs) as the gain medium. By optimizing the tapering geometry and QD doping concentration, we achieve a broadband on-off gain of >15 dB across a 200 nm bandwidth (1900–2100 nm). The unique combination of PbS QDs’ size-tunable bandgap and the tapered fiber’s enhanced evanescent field interaction enables efficient pump-probe overlap, resulting in a broader gain bandwidth compared to conventional rare-earth-doped fiber amplifiers. This work establishes a promising platform for compact, high-bandwidth mid-infrared light sources and amplifiers.
1. Introduction
The 2 μm wavelength window has emerged as a critical region for applications in laser surgery, gas sensing, and free-space communication due to its eye-safe operation and strong molecular absorption features [1,2,3,4,5]. Recent advances in hollow-core photonic bandgap fibers (HC-PBGFs) provide the basis for low-loss transmission of optical signals at the 2 μm wavelength [6]. Consequently, research has focused on the 2 μm wavelength band, encompassing free-space optical communication systems [5], fiber lasers [7,8], and photodetectors [9,10]. Recently, there has been a growing interest in the 2 μm fiber amplifier, particularly rare-earth ion-doped fiber amplifiers, such as those doped with holmium ions [11] and thulium ions [12,13], as well as Raman fiber amplifiers [14]. However, their limited gain bandwidth (<100 nm) and complex pump requirements hinder their application, for example, in wavelength-division multiplexing systems [15]. Additionally, the gain achieved through Raman scattering is constrained by the necessity to match the pump wavelength with the signal wavelength, typically requiring high-power pump sources [16]. Therefore, efforts are still underway to explore gain media for achieving a 2 μm fiber amplifier.
At present, quantum dots (QDs) such as CdSe, PbS, PbSe, and PbTe, which offer a compelling alternative to gain media due to their size-dependent bandgap tunability, broad emission profiles, and compatibility with solution-based fiber functionalization, have demonstrated remarkable optoelectronic properties, making them suitable for applications in fiber amplifiers, bio-imaging, solar cells, and fiber lasers [17,18,19,20,21,22,23,24,25]. Previous studies have demonstrated the feasibility of employing QDs for optical amplification in the mid-infrared region. For instance, efficient amplification was achieved at wavelengths of 3 μm and 5 μm using InAs1₋xSbx/ZnS QDs of different sizes, with maximum switching gains of 14.3 dB and 12.9 dB, respectively [26]. In addition, doped TlBr QDs have been investigated, showing high gain at 800 nm and 3000 nm [27]. Furthermore, numerical simulations have reported that an InAs0.4Sb0.6/InP quantum dot semiconductor optical amplifier (QD-SOA) can achieve efficient amplification at 6 μm with a gain of approximately 8.9 dB [28]. Collectively, these findings confirm the excellent amplification capability of QDs in the mid-infrared spectral range. However, most of these studies have focused on quantum dot semiconductor optical amplifiers, whereas reports on quantum dot fiber amplifiers operating in the mid-infrared region remain relatively scarce. Notably, PbS QDs exhibit a large exciton Bohr radius (~18 nm), enabling them to maintain pronounced quantum confinement effects even at larger sizes. The optical bandgap of QDs can be precisely tuned by adjusting their size, making them adaptable for applications across a wide range of wavelengths. PbS QDs also display broad-spectrum absorption characteristics due to their relatively narrow bandgap (~0.41 eV) [29]. The quantum confinement effects, broad-spectrum absorption, and ease of fabrication position PbS QDs as an excellent candidate gain medium for a 2 μm broadband fiber amplifier.
Currently, several methods have been developed to integrate QDs into fiber amplifiers. One method involves mixing colloidally synthesized QDs with a gel medium, such as UV-curable gel, and subsequently filling the mixture into hollow-core fibers [21]. Another method utilizes high-temperature melt spinning to fabricate glass fibers, followed by annealing to induce QDs to crystallize within the fiber structure [30]. Additionally, atomic layer deposition (ALD), combined with modified chemical vapor deposition (MCVD), has been employed to incorporate PbS QDs into silicon fibers [31]. Our team has also developed a simple coating method in which a polymer film doped with QDs is applied to the surface of tapered optical fibers. This configuration facilitates signal amplification through the interaction between the QDs and the evanescent wave [32]. Guo et al. [33] conducted a theoretical analysis of such amplifiers, predicting a gain spectrum centered at 1530 nm with a bandwidth of 240 nm and a maximum gain of 10.5 dB under a pump power of 500 mW. To enhance the surface density of QDs coated on the tapered region, we have encapsulated PbS QDs into mesoporous silica nanoparticles, resulting in improved amplifier gain [34]. Additionally, we fabricated polymer-modified PbS/CdS core–shell QD fiber amplifiers and oleic acid-capped PbS QD fiber amplifiers, which exhibited enhanced thermal stability [35,36]. However, integrating QDs into fiber amplifiers while maintaining high pump efficiency remains unresolved, as conventional step-index fibers exhibit weak overlap between the QD gain medium and the propagating signal mode.
Here, we address the challenge through a tapered fiber geometry that enhances evanescent field interactions with PbS QDs. We synthesized PbS QDs that exhibit fluorescence peaks at 1997 nm using an improved organometallic method combined with a multiple injection technique. The PbS QDs were subsequently deposited onto the surface of tapered optical fibers via a photodeposition method. By systematically engineering the taper profile and the QDs’ deposition parameters, we demonstrate a 2 μm broadband amplifier with a record gain bandwidth. To characterize the amplifier, a broadband light source was utilized as the signal source, while a 976 nm laser diode (LD) served as the pump source. The signal and pump light were simultaneously injected into the tapered fiber using a 980/2000 nm wavelength division multiplexer (WDM). The PbS QDs on the surface of the taper were excited by the evanescent pump field, resulting in signal amplification within the 1900–2100 nm range, with a maximum on-off gain of 15.2 dB. This approach opens new pathways for the design of compact, wavelength-agile mid-infrared fiber devices.
2. Experiments
2.1. Synthesis and Characterization of PbS QDs
The organometallic method is extensively employed for the synthesis of PbS QDs. The nucleation process can be described as follows: when the sulfur precursor is rapidly injected into the heated lead precursor, a nucleation burst occurs, forming nanocrystal nuclei. The formation of these nuclei depletes the precursor concentration, reducing it below the nucleation threshold. At this point, no new nanocrystal nuclei are formed, and the existing nanocrystals transition into the growth phase, during which their size remains uniform. However, later, the nanocrystals grow through the Ostwald ripening process [37], which increases size dispersity, as shown in Figure 1a. To obtain QDs with uniform size, the reaction time was constrained to 100 min (the growth phase). Notably, using this method, PbS QDs with an absorption peak of approximately 1631 nm can be synthesized within 100 min, as shown in Figure 1b.
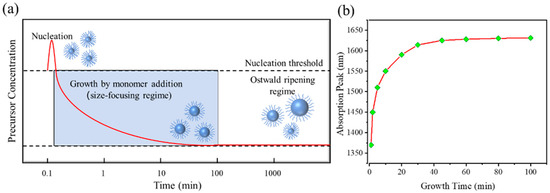
Figure 1.
(a) Stages of QD growth as a function of time and precursor concentration. (b) Changes in QD absorption peak with growth time.
Thus, a multiple-injection method [38,39] was employed to synthesize PbS QDs of the desired size by separating the nucleation and growth processes. The initial injection of the sulfur precursor regulates the number of nuclei, while the growth of the QDs is achieved through subsequent injections of the sulfur precursor. The detailed preparation process is as follows: sulfur and lead precursors were separately dissolved in oleylamine at a controlled temperature to form precursor solutions. A precise amount of sulfur precursor was rapidly injected into the lead precursor solution (lead-to-sulfur-precursor molar ratio of 24:1) under vigorous stirring at 120 °C in a nitrogen atmosphere. After a growth period of 30 min, the absorption peak of the PbS QDs was observed at 1617 nm. Subsequent injections of sulfur precursor at concentrations below the nucleation threshold were made every 10 min, facilitating further growth of the PbS QDs without inducing new nucleation sites. As shown in Figure 2a, the growth process demonstrated high reproducibility. This method exhibited excellent control over the size of the PbS QDs, with tunable absorption peaks ranging from 1617 to 1998 nm, as depicted in Figure 2b. The PbS QDs also exhibited good stability, which was further confirmed by the consistent performance of the fiber amplifier.
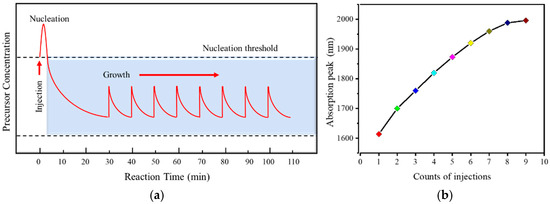
Figure 2.
(a) Illustration of the two-step synthesis process. The first step is the formation of initial seed crystals from the first injection of sulfur precursors. The second step is multiple injections of small-dose sulfur precursors that grow crystals from the seeds. (b) Plot of the absorption peak of PbS QDs versus the number of injections of sulfur precursors.
Ultimately, the required PbS QDs were synthesized by injecting the sulfur precursor seven times, with the characterization results illustrated in Figure 3a. The absorption peak and fluorescence peak of the PbS QDs were measured using a spectrophotometer (Hitachi U-4150, Hitachi Scientific Instruments (Beijing) Co., Ltd., Beijing, China) and a fluorescence spectrometer (Edinburgh FLS-980, Edinburgh Instruments Ltd., Livingston, Scotland, UK), yielding values approximately 1962 nm and 1997 nm, respectively. Furthermore, transmission electron microscopy (TEM, JEOL JEM-2010 F, Jioulu (Beijing) Technology & Trade Co., Ltd., Beijing, China) was employed to characterize the structure, diameter, and size distribution of the PbS QDs. The results (Figure 3b) indicate that the PbS QDs have high uniformity, with an average diameter of approximately 9.4 nm.
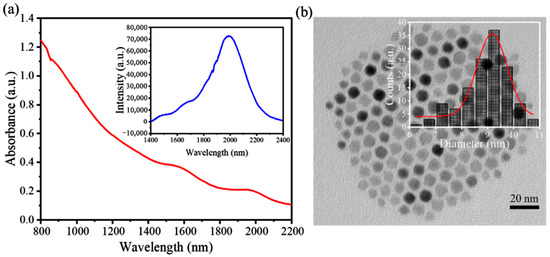
Figure 3.
Characteristics of PbS QDs: (a) Absorption spectrum of PbS QDs dispersed in tetrachlorethylene (inset: photoluminescence spectrum of PbS QDs). (b) TEM image of PbS QDs (inset: corresponding size histogram).
The absorption and fluorescence peaks undergo a redshift as the particle size increases. The size of the PbS QDs can be estimated from the position of the absorption peak with the following equations [40]:
where is the energy level of the first absorption peak, expressed in electron volt (eV); is the diameter in nanometers of the QDs; is the wavelength of the first absorption peak; is the Planck constant, eVs; and is the speed of light, m/s. Using Equations (1) and (2), the diameter of PbS QDs was calculated to be 9.3 nm, which closely matches that measured by the TEM image.
2.2. Fabrication and Characteristics of Optical Fiber Amplifier Based on PbS QDs
The standard flame-brushing technique was utilized to fabricate a tapered fiber supporting a guided mode with an evanescent field, which could strongly interact with the PbS QDs coated on the fiber. The polymer coating was meticulously removed; the central segment of the fiber was thoroughly cleansed through controlled heating with a hydrogen flame, and the standard single-mode optical fiber (SMF28) was drawn into a tapered optical fiber. Taper ratios (1:3 to 1:6) were controlled via motorized stages (50 μm/s) while monitoring transmission at 2000 nm with an insertion loss <0.2 dB. The diameter of the uniform central portion of the tapered fiber was measured to be 5.21 μm (Figure 4a), and the length of this region was approximately 2 cm. Subsequently, UV-cured glue was applied to fix the tapered optical fiber within a U-shaped groove.
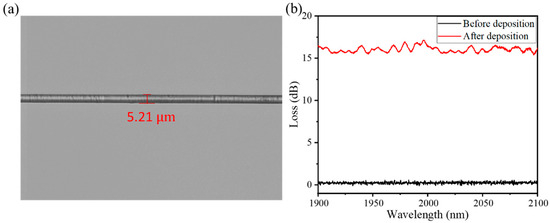
Figure 4.
(a) Microscope image of the uniform center portion of the tapered region of the fiber after deposition of PbS QDs. (b) Loss after and before deposition for 10 min.
The photoluminescence (PL) lifetimes of PbS QDs differ markedly between dispersed and aggregated states. Dispersed QDs exhibit a single-exponential decay with a lifetime of approximately 1.83 ms, whereas aggregated QDs show shorter lifetimes and deviate from single-exponential behavior. This difference is primarily attributed to Förster resonance energy transfer (FRET) between adjacent nanocrystals [41]. When the inter-dot spacing is small or the QDs are arranged in a disordered manner, FRET can transfer excitation energy from an emissive QD to a lower-energy or trap-rich QD and can reduce gain. FRET facilitates non-radiative processes that compete with stimulated emission. If the FRET rate is high, a greater proportion of excitations are lost through non-radiative pathways instead of contributing to stimulated emission. Therefore, improving the dispersion of PbS QDs on the tapered region via optical deposition effectively suppresses non-radiative energy transfer and enhances fluorescence yield.
During the photodeposition process, when the laser traverses the tapered region of the fiber, the QDs are propelled toward the taper by the evanescent wave optical field. Subsequently, under the influence of van der Waals forces, the PbS QDs adhere to the surface of the tapered fiber [42]. This process is initiated by immersing the tapered fiber in a sealed tube containing a tetrachloroethylene solution of PbS QDs (2 mg/mL). The front and back ends of the fiber are connected to a 976 nm LD and a power meter, respectively. The LD is activated to initiate the optical deposition process, during which the power of the LD determines the concentration of QDs adhering to the tapered region. The entire deposition process should not exceed 30 min, as prolonged exposure of the UV-curable adhesive to the tetrachloroethylene solution may cause the tapered fiber to detach from the U-groove.
The loss in the tapered region (Figure 4b) was measured at 0.2 dB prior to the commencement of photodeposition. After the deposition of QDs on the fiber (deposition power: 250 mW), the total system loss was approximately 16.3 dB. The elevated insertion loss observed after deposition in the tapered region is primarily attributed to the high refractive index of PbS QDs (3.4–4.3), which exceeds that of the fiber material (~1.46) [33]. This mismatch hinders effective confinement of the signal light within the taper, leading to partial optical leakage. In addition, the presence of small-sized QDs (~9.4 nm) on the taper surface introduces light scattering, further contributing to the overall loss. In the final step of the fabrication process, the PbS QD-coated fiber tapers were desiccated under vacuum conditions to evaporate any residual liquid on the surface.
To verify the successful deposition of PbS QDs on the tapered region, scanning electron microscopy (SEM, Hitachi Regulus 8100, Hitachi Scientific Instruments (Beijing) Co., Ltd., Beijing, China) and energy-dispersive spectroscopy (EDS, Bruker XFlash 6, Bruker Corporation, MA, USA) analyses were conducted. The SEM images (Figure 5a) demonstrate that the tapered region of the fiber is uniformly coated with a layer of PbS QDs. The presence of sulfur and lead elements, as shown in the EDS spectrum (Figure 5b), further confirms the successful deposition of PbS QDs.
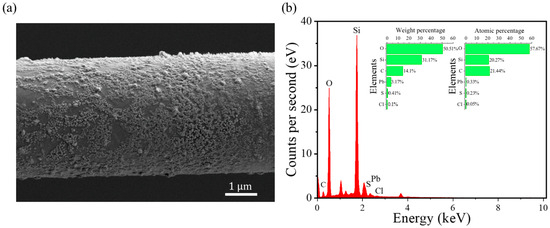
Figure 5.
(a) SEM micrograph of tapered fiber after deposition of PbS QDs. (b) EDS spectrum of the tapered area of the fiber (inset: the content of different elements).
3. Results and Discussion
The structure of the 2 μm fiber amplifier based on PbS QDs and the corresponding test setup are illustrated in Figure 6. The Broadband Source (BBS, NKT Photonics) served as the signal source, while a 976 nm LD acted as the pump source. Signal light and pump light were simultaneously injected into the tapered fiber through a 980/2000 nm WDM. The 976 nm pump source was utilized to excite the QDs coated on the tapered region of the fiber. The broadband signal interacts with the excited QDs to achieve signal amplification. The amplified signal was characterized using an optical spectrum analyzer (OSA, Yokogawa AQ-6375). A second WDM was employed to protect the OSA from the 976 nm pump source.
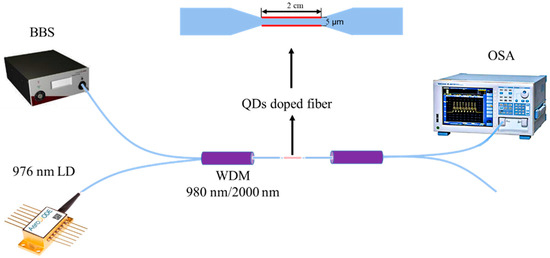
Figure 6.
Structural diagram of the fiber amplifier based on PbS QDs.
Figure 7 illustrates the output spectra of QD fiber amplifiers fabricated with LD deposition powers of 50–300 mW and amplifier pump powers of 0 to 500 mW. With a gradual rise in deposition power from 50 to 300 mW, there was a corresponding increase in the maximum on-off gain, which had values of 6.5 dB, 10.4 dB, 12.8 dB, 14.6 dB, 15.2 dB, and 15.2 dB at 50 mW, 100 mW, 150 mW, 200 mW, 250 mW, and 300 mW, respectively. For all cases, the deposition time was 10 min. The gain of the PbS QD fiber amplifier did not increase significantly for deposition powers higher than 250 mW because, at higher deposition power, the limited active region of the cone fiber will cause agglomeration of a large number of PbS QDs on the surface of the cone region, which is not conducive to signal light amplification. Note that, owing to the multi-wavelength effect [43] of the 976 nm pump light source, a peak appeared at 1952 nm, which does not affect the gain magnitude and bandwidth achieved and can thus be disregarded.
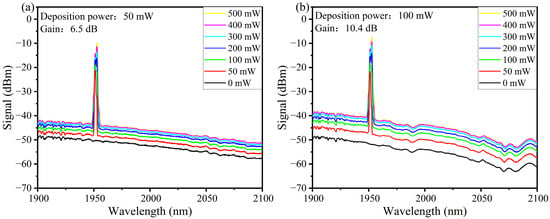
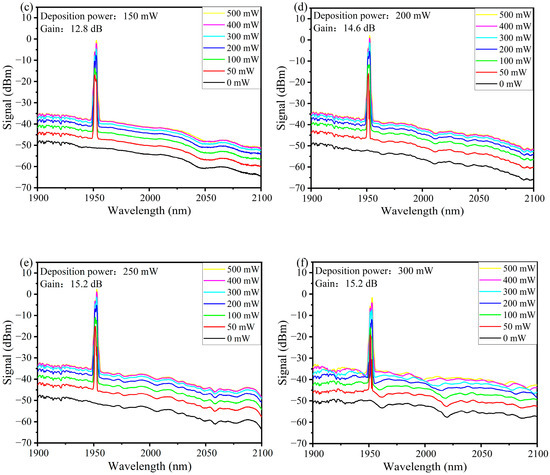
Figure 7.
Amplifier output spectra at different pump powers (inset) obtained for different deposition powers (10 min): (a) 50 mW; (b) 100 mW; (c) 150 mW; (d) 200 mW; (e) 250 mW; (f) 300 mW.
The gain spectrum (Figure 7) correlates strongly with PbS QDs’ absorption profile (Figure 3a), confirming that size distribution governs bandwidth.
The signal gain of a quantum dot fiber amplifier is primarily governed by the inversion of the carrier density distribution within the QDs. As the pump power increases, the interaction between the QDs and the evanescent field of the pump light leads to a significant rise in the population of the upper energy levels. Consequently, the ratio of the excited state to total carrier density approaches its maximum value of 1, indicating that, under strong pumping conditions, full population inversion is achieved. As a result, the amplifier gain reaches a steady-state level and saturates. This behavior can be described by Equations (3) and (4) [33]:
where represents the population densities of the ground state () and the upper energy level (). denotes the optical power at wavelength and position . is the normalized field intensity along the radial axis. and denote the emission and absorption cross sections, respectively. is the total population concentration mentioned. is the rate of nonradiative transitions from the upper energy level to the ground state.
To further illustrate the dependence of gain on pump power, the signal power was held constant, and the variation in maximum gain with a progressive increase in pump power was plotted (Figure 8) for various deposition powers. At a pump optical power of 500 mW, the gain was nearly fully saturated.
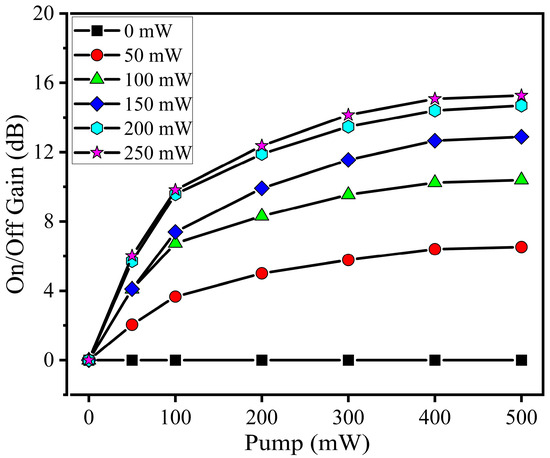
Figure 8.
Dependence of the on-off gain on pump and deposition (inset) powers.
To verify the batch-to-batch reproducibility of the quantum dot fiber amplifier, three groups of samples were fabricated under identical conditions, with the deposition power set to 250 mW and the pump power to 500 mW. A maximum on-off gain of 15.1 ± 0.1 dB was observed with only minor fluctuations, as illustrated in Figure 9.
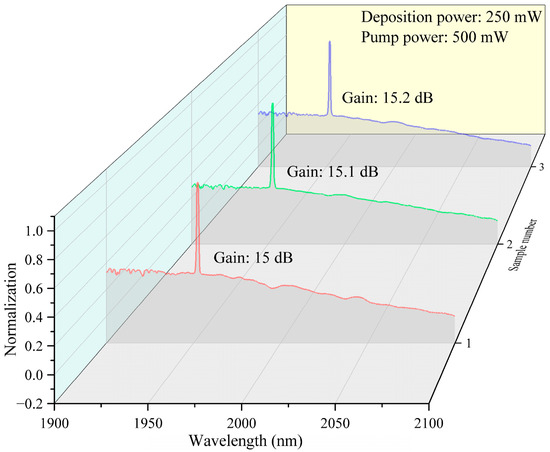
Figure 9.
Output spectra showing the batch-to-batch reproducibility of the quantum dot fiber amplifier.
PbS QDs are susceptible to photobleaching and oxidation during extended operation. To assess the stability of the quantum dot fiber amplifier, we measured its gain spectra over 1 h of continuous operation (Figure 10). The gain decreased by only ~0.8 dB, demonstrating good stability. Although the observed fluctuations were minimal, long-term stability could likely be further improved through doping and the fabrication of core–shell structures to suppress photobleaching and oxidation.
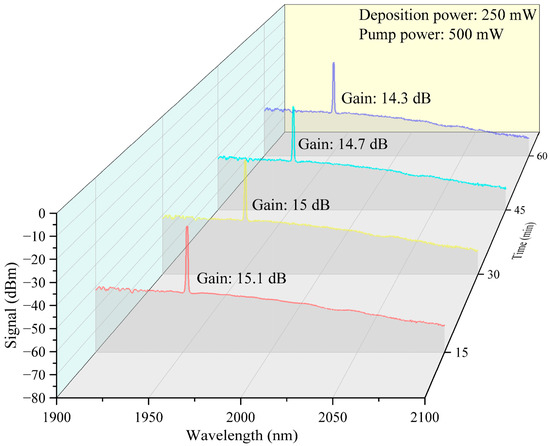
Figure 10.
Gain spectra of the quantum dot fiber amplifier over 1 h of continuous operation.
Finally, Table 1 summarizes the key results of this study in comparison with previous works in terms of operating wavelength, maximum on-off gain/gain, and gain bandwidth. Compared with references [18,19,20], to the best of our knowledge, this study demonstrates for the first time switching gain using PbS QDs in the 2 μm wavelength band. In addition, relative to references [11,13], the gain bandwidth is significantly broadened, which is beneficial for applications in wavelength-division multiplexing systems. Compared with the mid-infrared quantum dot semiconductor optical amplifiers reported in references [26,27,28], the present work demonstrates a mid-infrared quantum dot fiber amplifier, which can be directly integrated into fiber networks, facilitating long-distance mid-infrared signal transmission. Although significant progress has been made in our work, net gain has not yet been achieved. This is mainly attributed to several factors. First, the refractive index mismatch between the QDs and the tapered region hinders effective confinement of the signal light within the taper, leading to partial optical leakage and increased insertion loss. Second, the highly degenerate valence and conduction bands of the QDs make the multi-exciton processes involved in optical amplification susceptible to non-radiative Auger recombination, which occurs on a picosecond timescale [19]. Achieving population inversion thus requires excitation within a timeframe shorter than the Auger recombination lifetime, necessitating ultrafast laser pumping. However, our experiments were conducted under continuous-wave pumping conditions. To achieve net gain, high-power ultrafast pumping is required, yet such high-intensity ultrafast lasers may cause irreversible damage to the QDs. Therefore, modifying the QDs with polymers or constructing heterostructures to match the refractive index with the tapered region and to reduce surface defects represents a promising approach for realizing net gain.

Table 1.
Comparison with previous studies.
4. Conclusions
In summary, we have demonstrated a tapered fiber amplifier incorporating PbS QDs for broadband 2 μm operation. By employing the photodeposition method to load the QDs onto the tapered region, this method offers operational simplicity and reduces the uneven distribution of QDs on the tapered surface compared to polymer-modified QD coating methods. At a pump power of 500 mW, the 2 μm PbS QDs broadband fiber amplifier achieved a maximum on-off gain of 15.2 dB with a gain bandwidth of 200 nm. Future efforts will focus on polymer functionalization of QDs to achieve refractive index matching with the tapered region, along with the implementation of core–shell structures to minimize surface defects and suppress Auger recombination, enabling long-term stable optical gain in quantum dot fiber amplifiers. Although net gain has not yet been achieved with this method, the advantages of small size (active region of 2 cm), tunability of wavelength range, and a simple preparation process provide a blueprint for merging colloidal nanomaterials with specialty fibers, with immediate applications in on-chip mid-IR sensing and telecommunications.
Author Contributions
Conceptualization, data curation, formal analysis, funding acquisition, investigation, and writing—original draft, D.W. and X.S.; methodology and writing—review and editing, S.W. and C.W.; data curation, and writing—review and editing, Z.J.; writing—review and editing, A.R.K. and S.H. All authors have read and agreed to the published version of the manuscript.
Funding
This research was funded by the Science and Technology Commission of Shanghai Municipality (STCSM) (19530714000). This work is also part of the Academy of Finland Flagship Programme, Photonics Research and Innovation (PREIN), decision 320166.
Institutional Review Board Statement
Not applicable.
Informed Consent Statement
Not applicable.
Data Availability Statement
Data underlying the results presented in this paper are not publicly available at this time but may be obtained from the authors upon reasonable request.
Conflicts of Interest
The authors declare no conflicts of interest.
References
- Kilper, D.C.; Peyghambarian, N. Changing evolution of optical communication systems at the network edges. Appl. Opt. 2020, 59, G209–G218. [Google Scholar] [CrossRef] [PubMed]
- Soref, R.J.N.P. Enabling 2 μm communications. Nat. Photonics 2015, 9, 358–359. [Google Scholar] [CrossRef]
- Yao, C.Y.; Xiao, L.M.; Gao, S.F.; Wang, Y.Y.; Wang, P.; Kan, R.F.; Jin, W.; Ren, W. Sub-ppm CO detection in a sub-meter-long hollow-core negative curvature fiber using absorption spectroscopy at 2.3 μm. Sens. Actuator B-Chem. 2020, 303, 127238. [Google Scholar] [CrossRef]
- Wollin, T.A.; Denstedt, J.D. The holmium laser in urology. J. Clin. Laser Med. Sur. 1998, 16, 13–20. [Google Scholar] [CrossRef]
- Qin, Q.; Li, T.; Yan, F.P.; Feng, T.; Sun, W.W.; Han, W.G.; Yang, D.D.; Wang, X.D.; Yu, C.H.; Wang, P.F.; et al. Demonstration of the First Outdoor 2-μm-Band Real-Time Video Transmission Free-Space Optical Communication System Using a Self-Designed Single-Frequency Fiber Laser. J. Light. Technol. 2023, 41, 5275–5283. [Google Scholar] [CrossRef]
- Zhang, H.; Li, Z.; Kavanagh, N.; Zhao, J.; Ye, N.; Chen, Y.; Wheeler, N.V.; Wooler, J.P.; Hayes, J.R.; Sandoghchi, S.R.; et al. 81 Gb/s WDM Transmission at 2 μm over 1.15 km of Low-Loss Hollow Core Photonic Bandgap Fiber. In Proceedings of the European Conference on Optical Communication (ECOC), Cannes, France, 21–25 September 2014; IEEE: New York, NY, USA, 2014. [Google Scholar]
- Li, Z.Y.; Pei, W.X.; Li, H.; Huang, W.; Li, X.X.; Wang, Z.F.; Chen, J.B. D2-Filled Hollow-Core Fiber Gas Raman Laser at 2.15 μm. Photonics 2022, 9, 753. [Google Scholar] [CrossRef]
- Lim, T.; Xu, S.T.; Hooper, L.; Davey, M.; Sander, M.Y. Sub-200 fs Polarization-Maintaining All-Fiber Thulium-Doped Dissipative Soliton Fiber Laser System at 1920 nm. Photonics 2025, 12, 361. [Google Scholar] [CrossRef]
- Chen, Y.J.; Xie, Z.Y.; Huang, J.; Deng, Z.; Chen, B.L. High-speed uni-traveling carrier photodiode for 2 μm wavelength application. Optica 2019, 6, 884–889. [Google Scholar] [CrossRef]
- Gunning, F.C.G.; Kavanagh, N.; Russell, E.; Sheehan, R.; O'Callaghan, J.; Corbett, B. Key enabling technologies for optical communications at 2000 nm. Appl. Opt. 2018, 57, E64–E70. [Google Scholar] [CrossRef]
- Alharbi, A.G.; Kanwal, F.; Ghafoor, S.; Habib, N.; Kanwal, B.; Atieh, A.; Kousar, T.; Mirza, J. Performance Optimization of Holmium Doped Fiber Amplifiers for Optical Communication Applications in 2–2.15 μm Wavelength Range. Photonics 2022, 9, 245. [Google Scholar] [CrossRef]
- Li, Z.; Heidt, A.M.; Simakov, N.; Jung, Y.; Daniel, J.M.O.; Alam, S.U.; Richardson, D.J. Diode-pumped wideband thulium-doped fiber amplifiers for optical communications in the 1800–2050 nm window. Opt. Express 2013, 21, 26450–26455. [Google Scholar] [CrossRef]
- Sun, T.R.; Su, X.Y.; Zhang, Y.H.; Zhang, H.W.; Xu, T.J.; Zheng, Y. All-Fiber Wavelength-Tunable Narrow-Linewidth Polarization-Maintaining Tm-Doped Fiber MOPA System. Photonics 2022, 9, 778. [Google Scholar] [CrossRef]
- Huang, M.; Sun, S.Y.; Saini, T.S.; Fu, Q.; Xu, L.; Wu, D.; Ren, H.; Shen, L.; Hawkins Thomas, W.; Ballato, J.; et al. Raman amplification at 2.2 μm in silicon core fibers with prospects for extended mid-infrared source generation. Light Sci. Appl. 2023, 12, 209. [Google Scholar] [CrossRef] [PubMed]
- Wang, W.; Chen, Q.P.; Zhao, Y.F.; Le, Y.K.; Ye, S.D.; Wan, M.; Huang, X.J.; Dong, G.P. PbS quantum dots and BaF2: Tm3+ nanocrystals co-doped glass for ultra-broadband near-infrared emission. Chin. Opt. Lett. 2022, 20, 021603. [Google Scholar] [CrossRef]
- Gui, L. Enhanced slow and fast light in strong dispersion region of the Raman assisted narrow band fiber optical parametric amplifier. Opt. Commun. 2020, 473, 125594. [Google Scholar] [CrossRef]
- Peng, X.F.; Wu, Z.J.; Ding, Y. Research on CdSe/ZnS Quantum Dots-Doped Polymer Fibers and Their Gain Characteristics. Nanomaterials 2024, 14, 1463. [Google Scholar] [CrossRef]
- Liu, J.J.; Li, K.; Zhao, Z.P.; Chen, H.; Wei, J.H.; Zhang, W.C.; Cao, S.Y.; Chang, Z.W.; Xiao, X.H.; Deng, Z.; et al. Net Optical Gain from PbS Quantum Dot-Doped Glasses under Continuous-Wave Pumping. Laser Photon. Rev. 2024, 18, 2400305. [Google Scholar] [CrossRef]
- Chen, D.; Cui, J.; Xu, B.; Man, T.; Zhang, D.; Tu, Y.; Liu, X.; Qiu, J. PbS Quantum Dot Doped Polymer Broadband Optical Fiber Amplifier. Chin. J. Lumin. 2023, 44, 1824–1832. [Google Scholar] [CrossRef]
- Cui, J.J.; Chen, D.Y.; Fang, Z.J.; Liu, X.F.; Chen, Z.; Qiu, J.R.; Xu, B.B. Optical amplification across the whole communication windows in PbS quantum-dot-doped fiber. Opt. Fiber Technol. 2024, 88, 103822. [Google Scholar] [CrossRef]
- Cheng, C.; Hu, N.S.; Cheng, X. Experimental realization of a PbSe quantum dot doped fiber amplifier with ultra-bandwidth characteristic. Opt. Commun. 2017, 382, 470–476. [Google Scholar] [CrossRef]
- Shi, X.L.; Chen, S.; Luo, M.Y.; Huang, B.; Zhang, G.Z.; Cui, R.; Zhang, M.X. Zn-doping enhances the photoluminescence and stability of PbS quantum dots for in vivo high-resolution imaging in the NIR-II window. Nano Res. 2020, 13, 2239–2245. [Google Scholar] [CrossRef]
- Wilton, S.R.; Fetterman, M.R.; Low, J.J.; You, G.J.; Jiang, Z.Y.; Xu, J. Monte Carlo study of PbSe quantum dots as the fluorescent material in luminescent solar concentrators. Opt. Express 2014, 22, A35–A43. [Google Scholar] [CrossRef] [PubMed]
- Pérez, L.M.; El Aouami, A.; Feddi, K.; Tasco, V.; Ben Abdellah, A.; Dujardin, F.; Courel, M.; Riquelme, J.A.; Laroze, D.; Feddi, E.L.M. Parameters Optimization of Intermediate Band Solar Cells: Cases of PbTe/CdTe, PbSe/ZnTe and InN/GaN Quantum Dots. Crystals 2022, 12, 1002. [Google Scholar] [CrossRef]
- Liu, L.Y.; Sun, X.L.; Zhao, W.; Zhou, B.; Huang, Q.Q.; Zou, C.H.; Mou, C. Passively Q-switched pulses generation from Erbium-doped fiber laser based on microfiber coated PbS quantum dots. Opt. Fiber Technol. 2018, 46, 162–166. [Google Scholar] [CrossRef]
- Eyvazi, M.; Yadipour, R.; Rostami, A.; Rostami, P.; Mirtagioglu, H. Theoretical analysis and design of a dual-wavelength and selectable all-optical broadband QDs semiconductor optical amplifier (QDs-SOA) with inhomogeneous broadening. Opt. Quant. Electron. 2025, 57, 122. [Google Scholar] [CrossRef]
- Al-Nashy, B.O.; Al-Mosawi, B.T.S.; Oleiwi, M.O.; Al-Khursan, A.H. Gain of TlBr/BrCl Quantum Dot Semiconductor Optical Amplifier. J. Electr. Comput. Eng. 2023, 2023, 1941232. [Google Scholar] [CrossRef]
- Eyvazi, M.; Yadipour, R.; Rostami, A. All-Optical Broadband QDs Semiconductor Optical Amplifier (QDs-SOA): Inhomogeneous Broadening. IEEE Access 2024, 12, 47993–48003. [Google Scholar] [CrossRef]
- Bakueva, L.; Gorelikov, I.; Musikhin, S.; Zhao, X.S.; Sargent, E.H.; Kumacheva, E. PbS quantum dots with stable efficient luminescence in the near-IR spectral range. Adv. Mater. 2004, 16, 926–929. [Google Scholar] [CrossRef]
- Cheng, C.; Wang, F.J.; Cheng, X.Y. PbSe quantum-dot-doped broadband fiber amplifier based on sodium-aluminum-borosilicate-silicate glass. Opt. Laser Technol. 2020, 122, 105812. [Google Scholar] [CrossRef]
- Dong, Y.H.; Zhang, M.; Zhang, H.Y.; Fang, G.; Wen, J.X.; Huang, Y.; Zhang, X.B.; Shang, Y.N.; Wei, H.M.; Wang, T.Y. Enhanced fluorescence and gain characteristics of PbS doped silica fiber with PbSe nano-semiconductor co-doping. Opt. Fiber Technol. 2023, 80, 103370. [Google Scholar] [CrossRef]
- Pang, F.F.; Sun, X.L.; Guo, H.R.; Yan, J.W.; Wang, J.; Zeng, X.L.; Chen, Z.Y.; Wang, T.Y. A PbS quantum dots fiber amplifier excited by evanescent wave. Opt. Express 2010, 18, 14024–14030. [Google Scholar] [CrossRef]
- Guo, H.R.; Pang, F.F.; Zeng, X.L.; Wang, T.Y. PbS quantum dot fiber amplifier based on a tapered SMF fiber. Opt. Commun. 2012, 285, 3222–3227. [Google Scholar] [CrossRef]
- Fan, M.D.; Yan, Y.Y.; Zhou, S.; Sun, X.L.; Honkanen, S. Mesoporous silica enriched PbS quantum dots for optical fiber amplifiers. Opt. Commun. 2021, 499, 127310. [Google Scholar] [CrossRef]
- Sun, X.L.; Xie, L.B.; Zhou, W.; Pang, F.F.; Wang, T.Y.; Kost, A.R.; An, Z.S. Optical fiber amplifiers based on PbS/CdS QDs modified by polymers. Opt. Express 2013, 21, 8214–8219. [Google Scholar] [CrossRef]
- Sun, X.L.; Dai, R.; Chen, J.J.; Zhou, W.; Wang, T.Y.; Kost, A.R.; Tsung, C.K.; An, Z.S. Enhanced thermal stability of oleic-acid-capped PbS quantum dot optical fiber amplifier. Opt. Express 2014, 22, 519–524. [Google Scholar] [CrossRef]
- Weidman, M.C. Controlling Nanomaterial Self-Assembly for Next Generation Optoelectronic Applications; Massachusetts Institute of Technology: Cambridge, MA, USA, 2017. [Google Scholar]
- Yin, S.C.; Ho, C.H.Y.; Ding, S.; Fu, X.Y.; Zhu, L.P.; Gullett, J.; Dong, C.; So, F. Enhanced Surface Passivation of Lead Sulfide Quantum Dots for Short-Wavelength Photodetectors. Chem. Mat. 2022, 34, 5433–5442. [Google Scholar] [CrossRef]
- Lee, J.W.; Kim, D.Y.; Baek, S.; Yu, H.; So, F. Inorganic UV-Visible-SWIR Broadband Photodetector Based on Monodisperse PbS Nanocrystals. Small 2016, 12, 1328–1333. [Google Scholar] [CrossRef]
- Dong, Y.H.; Sun, W.T.; Huang, C.H.; Huang, S.J.; Yan, C.; Wen, J.X.; Zhang, X.B.; Huang, Y.; Shang, Y.N.; Wang, T.Y. Influence of particle size on the magneto-refractive effect in PbS quantum dots-doped liquid core fiber. Opt. Mater. Express 2022, 12, 1838–1849. [Google Scholar] [CrossRef]
- Rogach, A.L.; Eychmüller, A.; Hickey, S.G.; Kershaw, S.V. Infrared-emitting colloidal nanocrystals: Synthesis, assembly, spectroscopy, and applications. Small 2007, 3, 536–557. [Google Scholar] [CrossRef]
- Wang, Y.R.; Hou, S.D.; Yu, Y.; Liu, W.J.; Yan, P.G.; Yang, J.B. Photonic device combined optical microfiber coupler with saturable-absorption materials and its application in mode-locked fiber laser. Opt. Express 2021, 29, 20526–20534. [Google Scholar] [CrossRef]
- Xie, P.; Ni, Z.J.; Zhang, D.W.; Huang, Y.S. Investigation of multi-wavelength effect during the measurement of fluorescence spectrum. Opt. Instrum. 2008, 30, 16–20. (In Chinese) [Google Scholar]
Disclaimer/Publisher’s Note: The statements, opinions and data contained in all publications are solely those of the individual author(s) and contributor(s) and not of MDPI and/or the editor(s). MDPI and/or the editor(s) disclaim responsibility for any injury to people or property resulting from any ideas, methods, instructions or products referred to in the content. |
© 2025 by the authors. Licensee MDPI, Basel, Switzerland. This article is an open access article distributed under the terms and conditions of the Creative Commons Attribution (CC BY) license (https://creativecommons.org/licenses/by/4.0/).