Article

Laser-Induced Forward Transfer in Organ-on-Chip Devices

by
Maria Anna Chliara
,
Antonios Hatziapostolou
and
Ioanna Zergioti
*
School of Applied Mathematical and Physical Sciences, National Technical University of Athens, Iroon Polytechniou 9, 15780 Athens, Greece
*
Author to whom correspondence should be addressed.
Photonics 2025, 12(9), 877; https://doi.org/10.3390/photonics12090877 (registering DOI)
Submission received: 30 June 2025 / Revised: 25 August 2025 / Accepted: 26 August 2025 / Published: 30 August 2025

Abstract

Laser-induced forward transfer (LIFT) bioprinting enables precise deposition of biological materials for advanced biomedical applications. This study presents a parametric analysis of the donor–receiver distances (1.0, 1.5, 2.0, 2.5, and 3.0 mm) in LIFT bioprinting, investigated through high-speed video and image analysis of 4 × 4 spot arrays. Droplet velocity was quantified and jet trajectory characterized, revealing that increased distances reduced spatial resolution, with significant shape deterioration observed beyond 2.0 mm. Thus, a maximum 2.0 mm donor–receiver gap was determined as optimal for acceptable printing resolution. As an application, a microfluidic device was fabricated using LCD 3D printing with a biocompatible resin and glass-bottomed configuration. The chamber height was matched to the validated 2.0 mm distance, ensuring compatibility with LIFT printing. Computational fluid dynamics simulations were conducted to model fluid flow conditions within the device. Subsequently, LLC cells were successfully printed inside the microfluidic chamber, cultured under continuous flow for 24 h, and demonstrated normal proliferation. This work highlights LIFT bioprinting’s viability and precision for integrating cells within microfluidic platforms, presenting promising potential for organ-on-chip applications and future biomedical advancements.

1. Introduction

Bioprinting has emerged as a transformative approach in tissue engineering and organ-on-chip (OoC) development, offering high spatial precision and control over the placement of cells and biomaterials [1]. Among various bioprinting methods, Laser-induced forward transfer (LIFT) has attracted particular attention due to its nozzle-free, non-contact nature, making it well-suited for delicate or viscous and cell-laden bioinks [2]. It offers high-precision deposition and depth control in various substrates, including extracellular matrices [3], while preserving a high level of cell viability following the printing process, showing no evidence of DNA damage [4,5]. Unlike extrusion or inkjet-based techniques, LIFT operates by focusing a laser pulse onto an absorbing layer, which propels a droplet of bioink toward a receiver substrate allowing high-resolution patterning with minimal shear stress on biological material, thus preserving cell viability [6,7].
Despite its advantages, the practical deployment of LIFT in microfluidic or organ-on-chip devices remains limited by unresolved technical parameters. In particular, the optimal distance between donor and receiver substrates has been reported in the millimeter scale [8]; however, a detailed technical explanation for this observation has so far been lacking and will be provided later in this study. This parameter directly affects droplet formation, trajectory, and impact, influencing print integrity and, hence, the biological outcomes. While previous studies have reported successful LIFT printing at varying distances [9], a systematic high-speed evaluation of the spatial limits for precise and reproducible patterning has not been thoroughly addressed, especially in relation to downstream integration with microfluidic devices.
This challenge becomes especially relevant in the context of OoC platforms, where device dimensions must align precisely with bioprinting capabilities. The compatibility between printing parameters and chip geometry is critical for successful integration. Possible mismatches can result in poor resolution, pattern degradation, or failed cell seeding. Moreover, as LIFT is considered for more automated or scalable applications, identifying robust working windows for key parameters like donor–receiver distance is essential.
In this work, we perform a parametric study of LIFT printing across a range of donor–receiver distances, aiming to define the upper threshold for maintaining acceptable spatial resolution. High-speed imaging and pattern analysis are employed to quantify droplet behavior and printed array quality. To demonstrate real-world relevance, we integrate the validated printing parameters into a custom-designed microfluidic device, fabricated using LCD 3D printing with biocompatible resin and a glass bottom. The chamber height is matched to the optimal LIFT distance, enabling direct cell deposition. This study offers both fundamental insights into LIFT bioprinting physics and practical guidelines for its integration into microfluidic systems, advancing the pathway towards more reliable and scalable OoC applications with high-throughput results.

2. Materials and Methods

2.1. Cell Culture

Lewis lung carcinoma (LLC) cells (Biomedical Research Foundation of the Academy of Athens, Greece) were selected for their robust growth characteristics and their representative size (15–20 µm in suspension). Cells were cultured in standard conditions using high-glucose Dulbecco’s Modified Eagle Medium (DMEM; SH30243.01, Cytiva, Marlborough, MA, USA), enriched with 10% fetal bovine serum (FBS; FBS-12A, Capricorn Scientific, Ebsdorfergrund, Germany) and 1% penicillin/streptomycin (15140–122, Gibco, Thermo Fisher Scientific, Waltham, MA, USA). Cultures were maintained in a humidified incubator at 37 °C with 5% CO2.

2.2. Bioink Preparation

Upon reaching approximately 90% confluency, the cell monolayers were rinsed with phosphate-buffered saline (PBS) to remove residual medium and were subsequently detached using trypsin (T4049, Sigma-Aldrich, St. Louis, MO, USA) for 1–2 min at 37 °C. The enzymatic reaction was halted by the addition of DMEM supplemented with 10% fetal bovine serum (FBS), followed by centrifugation at 250× g for 5 min. The resulting cell pellet was resuspended in fresh culture medium to obtain a final concentration of 75,000 cells/μL. Cell density was determined using a Neubauer hemocytometer, with the cellular volume taken into consideration for precise concentration adjustment. The prepared bio-ink was aliquoted into 2 mL microcentrifuge tubes for immediate use in the bioprinting procedure.

2.3. LIFT Bioprinting

LIFT printing was conducted using a six-nanosecond Nd:YAG laser system operating at 532 nm with a 1 kHz repetition rate and Gaussian beam profile. Beam shaping was achieved through a telescope assembly consisting of a −50 mm diverging lens and a +100 mm converging lens, resulting in a 60 μm focal spot. Beam steering was performed via a galvanometric scanner capable of 5 m/s translational speed (Figure 1). The laser was focused onto a titanium-coated glass donor slide onto which the bio-ink had been deposited by pipetting. Titanium thin film was selected as the sacrificial absorption layer due to its absorption characteristics at the laser wavelength used [10]. Initial laser beam alignment and focus, on specific donor position, was achieved using a FLIR camera, in combination with a motorized x–y translation stage (Standa), enabling high-precision positioning of the donor slide, loaded with bioink. Upon pulse absorption by the sacrificial Ti layer, rapid local evaporation generated a cavitation bubble that produced a high-pressure jet, propelling cell-laden droplets across the gap to the receiver substrate. This setup was used to validate printing quality in reference to various distances between the donor and the receiver substrate (1.0, 1.5, 2.0, 2.5, and 3.0 mm). A 4 × 4 array pattern was employed as a reference framework in order to assess the printing success rate for each experimental condition. In the final phase of this study, LLC cells were bioprinted within the chamber of a microfluidic chip to demonstrate the applicability of the LIFT technique in OoC devices.

2.4. High-Speed Imaging

The droplet ejection dynamics were recorded using a high-speed camera (Mini AX-100, Photron, San Diego, CA, USA), capable of capturing up to 540,000 frames per second. A standard LED backlight (LEDD1B, Thorlabs, Newton, NJ, USA) was positioned opposite the camera to ensure sufficient illumination during the imaging of the droplet trajectory (Figure 1). To ensure optimal temporal resolution during droplet ejection and transfer, different frame rates were employed for each donor–receiver distance, with the aim of capturing the complete dynamics of the LIFT process while maximizing the number of recorded frames. Specifically, a frame rate of 170,000 fps was used for the 1.0 mm distance. For distances of 1.5 mm, 2.0 mm, 2.5 mm, and 3.0 mm, a standard frame rate of 127,500 fps was used for quantitative analysis, including droplet velocity measurements. Additionally, for improved qualitative visualization of droplet dynamics, supplemental recordings were acquired at 122,400 fps for the 2.0 mm and 2.5 mm distances, and at 102,000 fps for the 3.0 mm distance.

2.5. Microfluidic Device Design

A dual-chamber microfluidic chip was designed using CAD software (Autodesk Inventor Professional 2024) to allow controlled fluid communication between chambers. The device featured one inlet and one outlet, supporting unidirectional flow. Fluid dynamics were evaluated through computational fluid dynamics (CFD) simulations using ANSYS (2021 R1 & 2023 R2) Fluent to ensure appropriate flow distribution within the cell culture chamber.

2.6. Microfluidic Device Fabrication

The device was fabricated using a Sonic Mini 8K LCD 3D printer (Phrozen, Hsinchu, Taiwan) and a biocompatible resin (BioMed Clear, Thorlabs). Post-printing, the parts were cleaned for 20 min in 99% isopropanol while still attached to the print bed, then dried with pressurized nitrogen. Before removal from the bed, a glass slide was affixed to the printed structure by applying a thin layer of resin in predesigned bonding grooves. The assembly was cured under 405 nm light for 20 min, followed by thermal curing at 70 °C overnight to ensure mechanical stability, biocompatibility, and sterilization. Support structures were removed after curing to prevent structural deformation. The chip was designed as a resealable platform in order to be compatible with bioprinting procedures. For the chamber sealing, a biocompatible adhesive tape was utilized (ARcare® 90445Q). The finalized device was then ready for cell culture and LIFT printing.

2.7. Cell Culture Under Flow Conditions in the Microfluidic Device

To evaluate the performance of the microfluidic device, LLC cells were cultured inside the microfluidic device under continuous flow for a total duration of 48 h. A silent, oil-lubricated air compressor (JUN-AIR, Darwin Microfluidics) operating at a pressure of 8 bar was employed as the primary source of pressurized air. The compressed air was regulated via a precision microfluidic pressure controller (OB1 MK4, ELVEFLOW), which was interfaced with a thermal microfluidic flow sensor (MFS2+, ELVEFLOW) to enable closed-loop feedback control and maintain a stable flow rate. The culture medium was stored in a 15 mL conical tube, fitted with a dedicated microfluidic adapter (small size, ELVEFLOW), which facilitated air pressurization of the reservoir. Pressurized air entered the medium reservoir through silicone tubing, thereby driving the flow toward the microfluidic system (Figure 2). Teflon tubing was used to connect the reservoir to both the flow sensor and the inlet port of the microfluidic device via standard Luer lock fittings. A constant flow rate of 2.4 μL/min was maintained throughout the entire culture period. Effluent media were collected at the outlet of the device using additional Teflon tubing, connected via a Luer fitting to a waste reservoir. This configuration ensured a sterile, stable, and reproducible flow environment suitable for cell proliferation studies.

2.8. Flow Visualization—Particle Shadow Velocimetry

To assess the flow dynamics within the fabricated microfluidic device, flow visualization experiments were conducted using a dilute suspension of polystyrene microparticles (density: 0.96–1.05 g/cm3), 4.64 μm in diameter, at a concentration of 102 particles/mL. The low concentration was selected to minimize particle aggregation and facilitate accurate tracking of individual particle trajectories. The same pressure-driven microfluidic setup described previously was employed for flow generation, consisting of the silent, oil-lubricated air compressor operating at 8 bars, coupled with the microfluidic pressure controller and the thermal flow sensor for real-time feedback. The particle suspension was stored in a 15 mL conical reservoir coupled with the microfluidic adapter. The suspension was directed into the microfluidic device through Teflon tubing and Luer lock connectors, ensuring a sealed and contamination-free flow path. A steady flow rate of 2.4 μL/min was maintained during the experiment. The microfluidic chip was positioned on the stage of a conventional inverted microscope for optical observation. Images were captured using a Basler acA1920-40uc USB 3.0 camera mounted on the microscope, acquiring frames at a rate of one image every 10 s to monitor particle trajectories over time.

3. Results and Discussion

3.1. Resolution and Printing Quality of LIFT-Printed Arrays

LIFT bioprinting was conducted at 11.3 μJ (RMS stability 0.34%), corresponding to the threshold energy fluence of 400 mJ/cm2 for 60 μm focal spot, which ensures minimal energy input while still enabling stable jet formation and material transfer as well as immobilization. Laser power was measured with a laser energy detector (QE8SP-B-MT-D0, Gentec-EO) in combination with a laser power monitor (11MAESTRO, Standa). Although droplet deposition was achievable at donor–receiver distances of up to 3 mm, the spatial resolution and integrity of printed patterns were found to be highly dependent on the separation distance. In this study, 4 × 4 spot arrays were printed at distances ranging from 1 mm to 3 mm in order to evaluate the influence of propagation length on printing accuracy (Figure 3).
To assess the quality and accuracy of the printed arrays, image analysis was performed using Fiji (ImageJ 1.54p). Each droplet was approximated as a perfect circle, and its geometric center was calculated based on pixel coordinates, annotated as a red dot (Figure 3). The overall centroid of each 4 × 4 array was then determined using the mean x and y positions of the 16 droplets according to the following equation:
x c , y c = 1 16 i = 1 16 x i , 1 16 i = 1 16 y i
Based on this reference centroid, the average center-to-center distances between adjacent droplets in both rows and columns were computed, with the expected nominal spacing being 1 mm. Subsequently a reference grid with 1 mm2 square cells was con-structed and centered on the array centroid. The center of each unit cell of the grid is demonstrated as a black dot and represents the intended position of each droplet (Figure 3). The grid was generated for the 1 mm donor–receiver distance and applied to the rest of the arrays. Since the intended spacing was 1000 µm, the relative percentage deviation for each droplet was computed as follows:
% D e v i a t i o n i = D e v i a t i o n i 1000   μ m × 100 %
where D e v i a t i o n i is the distance between each droplet’s actual position and its intended position in μm, measured in ImageJ.
Image acquisition was carried out using a Basler acA1920-40uc USB 3.0 camera mounted on a conventional upright microscope equipped with a 4× objective lens. Overlapping images were captured and later combined into a single high-resolution composite using the GNU Image Manipulation Program (GIMP).
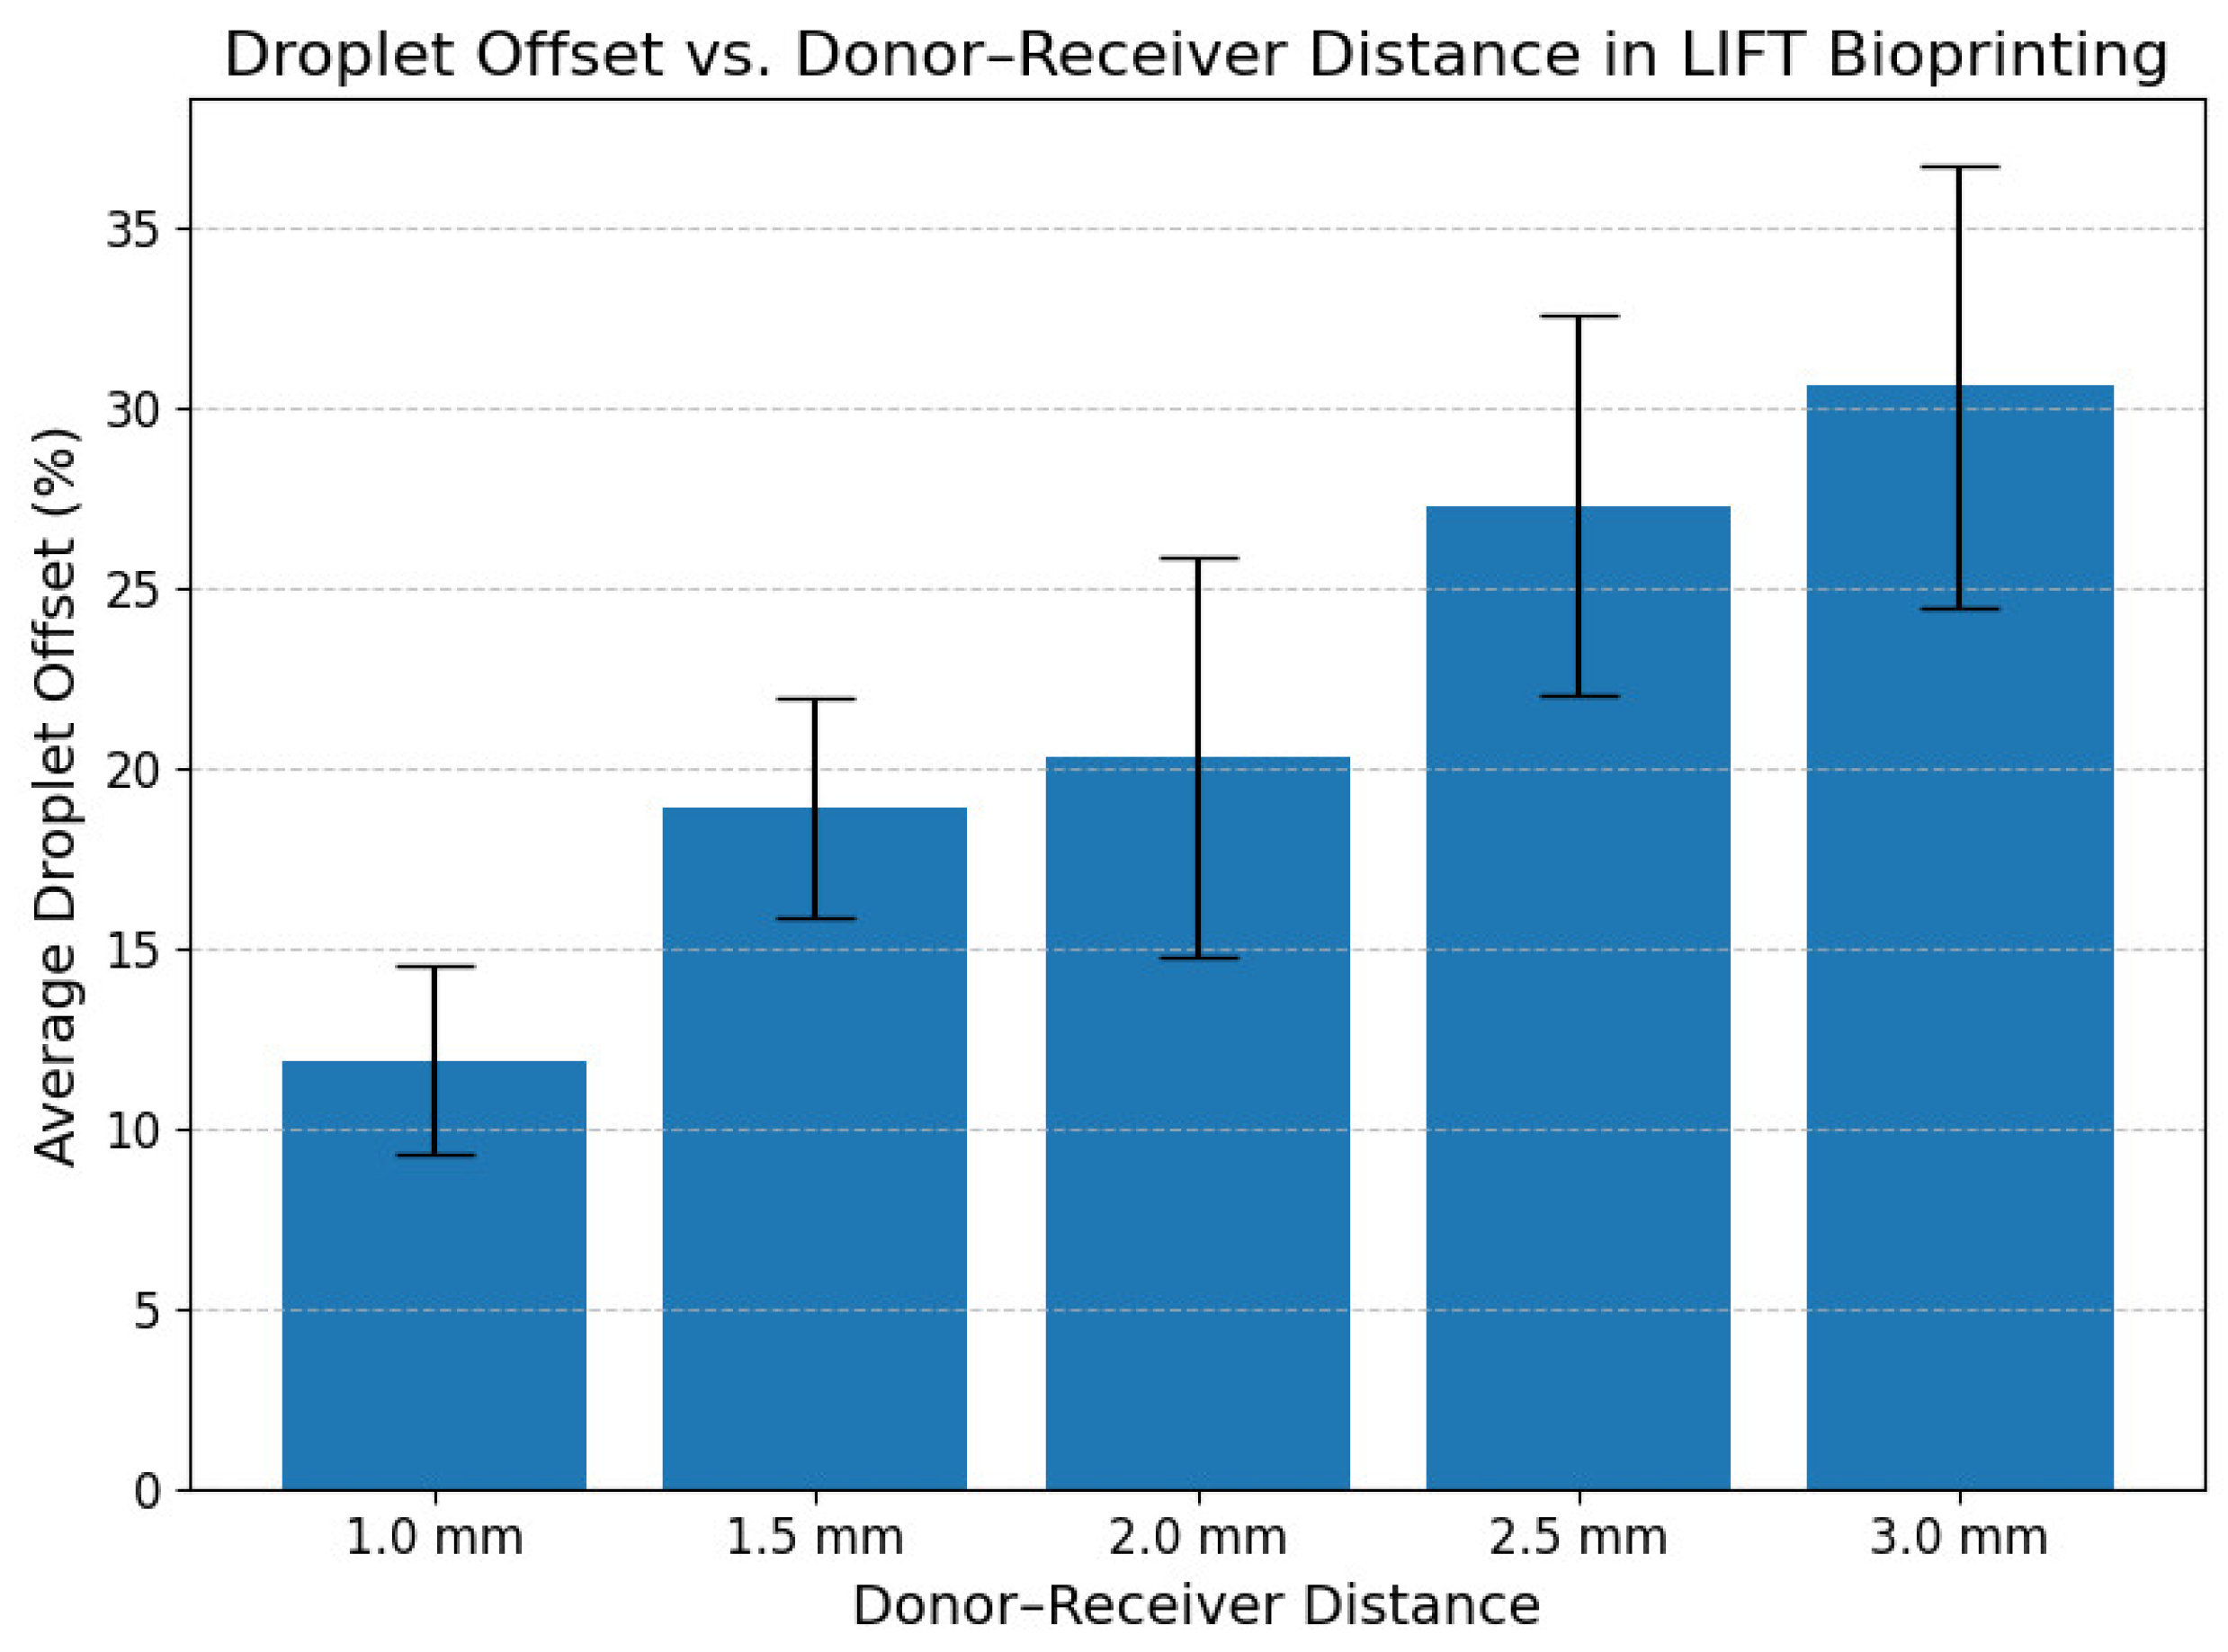
Quantitative analysis demonstrated a progressive loss of resolution as the donor–receiver distance increased. The average deviation of the droplets from the intended array geometry was measured as follows: 11.9 ± 5.2% at 1.0 mm, 18.9 ± 6.1% at 1.5 mm, 20.3 ± 10.9% at 2.0 mm, 27.3 ± 10.6% at 2.5 mm, and 30.6 ± 12.3% at 3.0 mm (Figure 4). These deviations are primarily attributed to the complex fluid dynamic phenomena during the early phases of jet formation and droplet flight, which become more pronounced at longer travel distances.
In addition to geometrical inaccuracies, droplet–droplet interactions emerged as a secondary challenge. At distances beyond 2.0 mm, droplet trajectories exhibited increasing spatial instability, frequently resulting in droplet-to-droplet collisions during deposition. These interactions severely disrupted the spatial organization of the printed arrays, further degrading the overall print resolution. As such, a critical donor–receiver distance of 2.0 mm was identified as the upper limit for maintaining acceptable pattern fidelity under the applied energy fluence.

3.2. Jet Propagation Dynamics in LIFT Bioprinting

To quantitatively analyze the droplet propagation dynamics captured via high-speed imaging, two custom Python scripts were developed. These scripts enabled frame-by-frame inspection of the LIFT videos and enabled manual annotation of key jet features, such as the position of the primary and secondary jets at each time point. Pixel-to-micrometer calibration was performed using predefined reference scales. Additionally, data extraction includes droplet displacement for each frame, in structured formats (CSV files) for analysis.
Specifically, the first script allowed for the definition of reference distances and start/end points using user-interactive mouse input within the video frame, while automatically converting pixel displacement into micrometer-scale distances based on predefined calibration values. This enabled the extraction of displacement data for each jet with high temporal precision. The second script expanded on this functionality by introducing a user-guided cursor system and segment-specific data export features for finer measurements. In both cases, video frames were indexed based on the effective frame rate (ranging from 102,000 to 170,000 fps depending on the experiment), and time was automatically computed for each data point. Output data were exported directly to structured formats (e.g., clipboard or CSV) for further numerical analysis. This semi-automated approach provided consistent, high-resolution tracking of jet behavior across all donor–receiver distances, ensuring accurate characterization of the dynamics throughout the LIFT process.
Multiple studies have consistently reported the formation of two successive jets during the printing process [3,11,12,13]. Observations from the high-speed video recordings clearly indicate that the primary jet exhibits a narrow diameter and high velocity, while the secondary jet appears broader and propagates at a reduced speed (Figure 5).
Initially, the bioink undergoes a rapid acceleration phase, followed by stabilization to a constant propagation velocity. At the applied laser fluence, the secondary jet remained continuous and unfragmented at 1 mm, but beyond this distance, it consistently broke into discrete droplets, the front of which was measured with a diameter of 145 ± 12 μm. Further analysis of the stabilized propagation phase revealed that the primary jet exhibited an average propagation velocity of 9.14 ± 0.44 m/s, while the secondary jet followed at a lower average velocity of 1.76 ± 0.38 m/s (Figure 6A). All data were derived from four independent replicates in each distance to ensure experimental reproducibility and enhance the reliability of the results. In certain cases, particularly at distances beyond 1.5 mm, the fragmented droplets exhibited visible oscillatory motion. This oscillation induced a minor deceleration; however, this value was deemed negligible with respect to the overall droplet dynamics and was not found to influence the stability or trajectory of the jet under the tested conditions.
High-speed imaging of jet propagation dynamics confirmed that donor–receiver distances exceeding 2.0 mm introduced significant spatial instability in droplet trajectories. Angular deviations of fragmented droplets from the initial jet trajectory path were found to amplify spatial deviations in the printed pattern, with increased propagation distance. Specifically, an angular deviation greater than 7° along a single axis (Figure 6B) can produce a spatial offset of less than 150 μm at a 1.0 mm distance, while this offset increased to approximately 250 μm at 2.0 mm and reached nearly 400 μm at 3.0 mm. These findings highlight the critical impact of jet directionality on pattern fidelity and support the conclusion that distances above 2.0 mm are unsuitable for high-precision patterning using LIFT under the tested conditions.

3.3. CAD Design of Microfluidic Chip and Fabrication Parameters

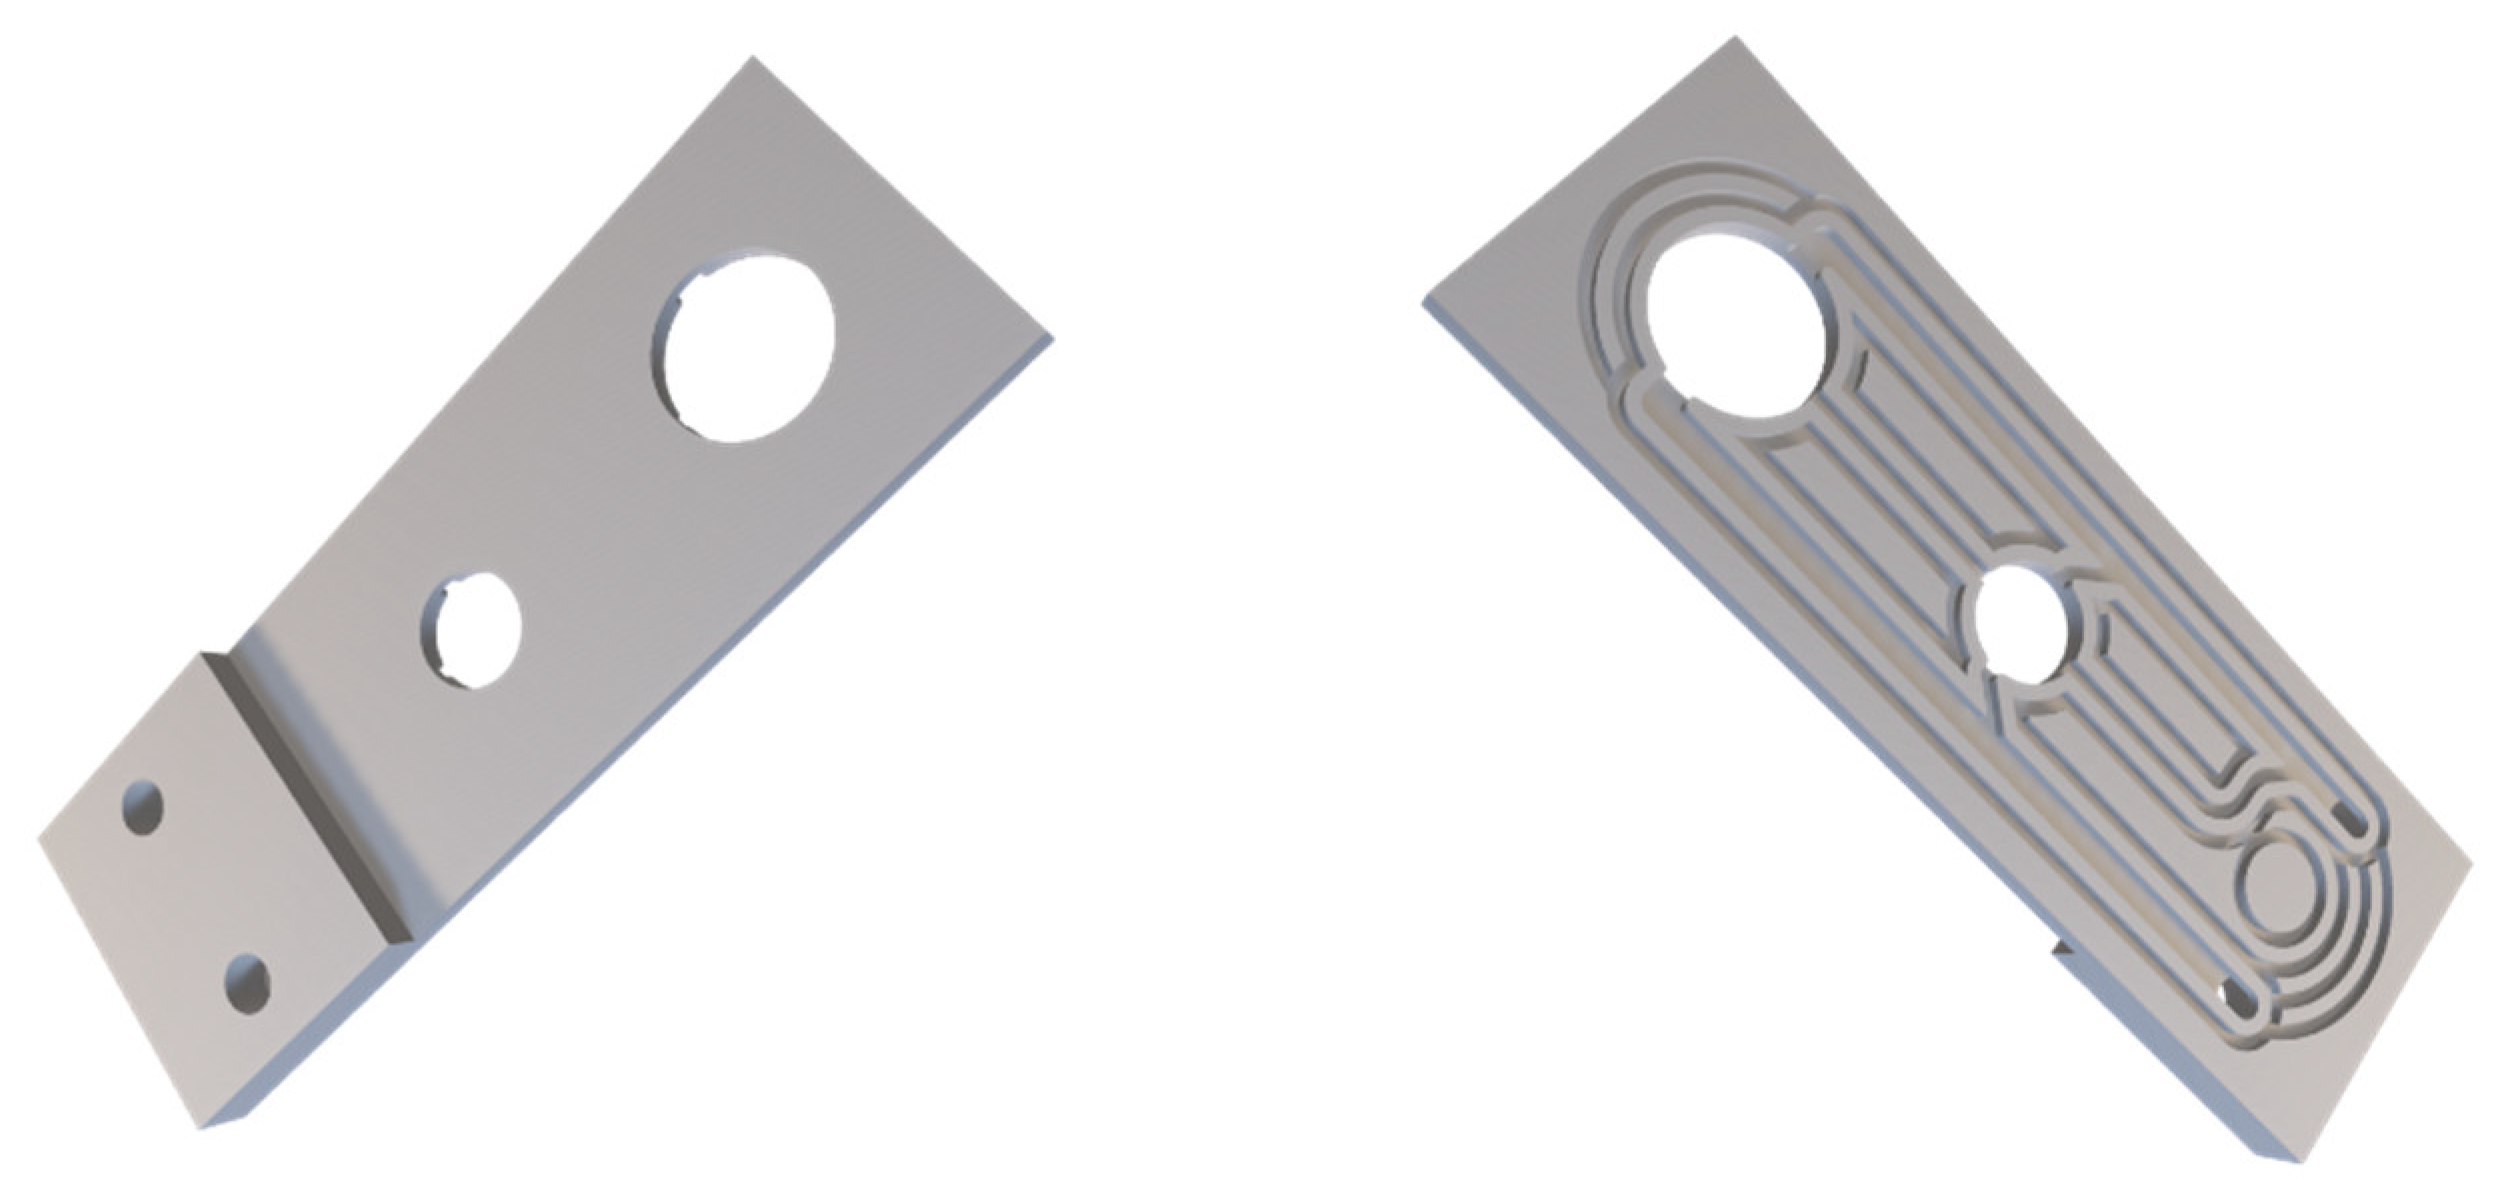
A microfluidic platform, suitable for OoC applications, was designed in order to replicate essential aspects of the tumor microenvironment, with a particular emphasis on the lymphatic interface. The chip design was guided by the general engineering approach for OoC platforms, which involves identifying and recreating key geometrical, mechanical, and biochemical features of the native tissue microenvironment. The CAD layout includes distinct compartments for tumor and lymphatic cell cultures, along with inlets and outlets for medium replenishment. The device incorporates features that mimic both blood and lymphatic vessels to enable realistic simulation of interstitial transport and cell migration dynamics. To ensure compatibility with the LIFT bioprinting system, the chamber height was set to 2 mm, corresponding to the validated maximum printing distance for high-resolution cell placement. A key design feature is the incorporation of peripheral cavities for precise attachment of a glass slide bottom, which enhances optical accessibility for imaging and supports the mechanical stability of the device under flow (Figure 7).

3.4. CFD Simulation in Designed Microfluidic Chip

Computational fluid dynamics (CFD) simulations are powerful tools widely employed to optimize microfluidic designs by accurately modeling fluid behavior within microchannels [14,15,16]. These simulations enable researchers to predict and refine flow dynamics and other critical parameters. This approach supports the development of improved OoC devices with well-characterized and reproducible performance.
To evaluate the fluid dynamics within microfluidic chip designed in this study, a CFD simulation was performed using physiologically relevant flow parameters. Capillary blood flow in human tissues typically ranges between 10−3 and 10−4 m/s [17]. Based on this, an inlet velocity of 2 × 10⁻⁴ m/s was selected, corresponding to a flow rate of approximately 2.4 μL/min within our system. This flow rate aligns well with estimated tissue blood flow (TBF) values for volumes comparable to our platform’s configuration—a monolayer of cells with a 6 mm radius and 20 μm height—where TBF is reported to be between 1.5 and 2.6 μL/min [18,19].
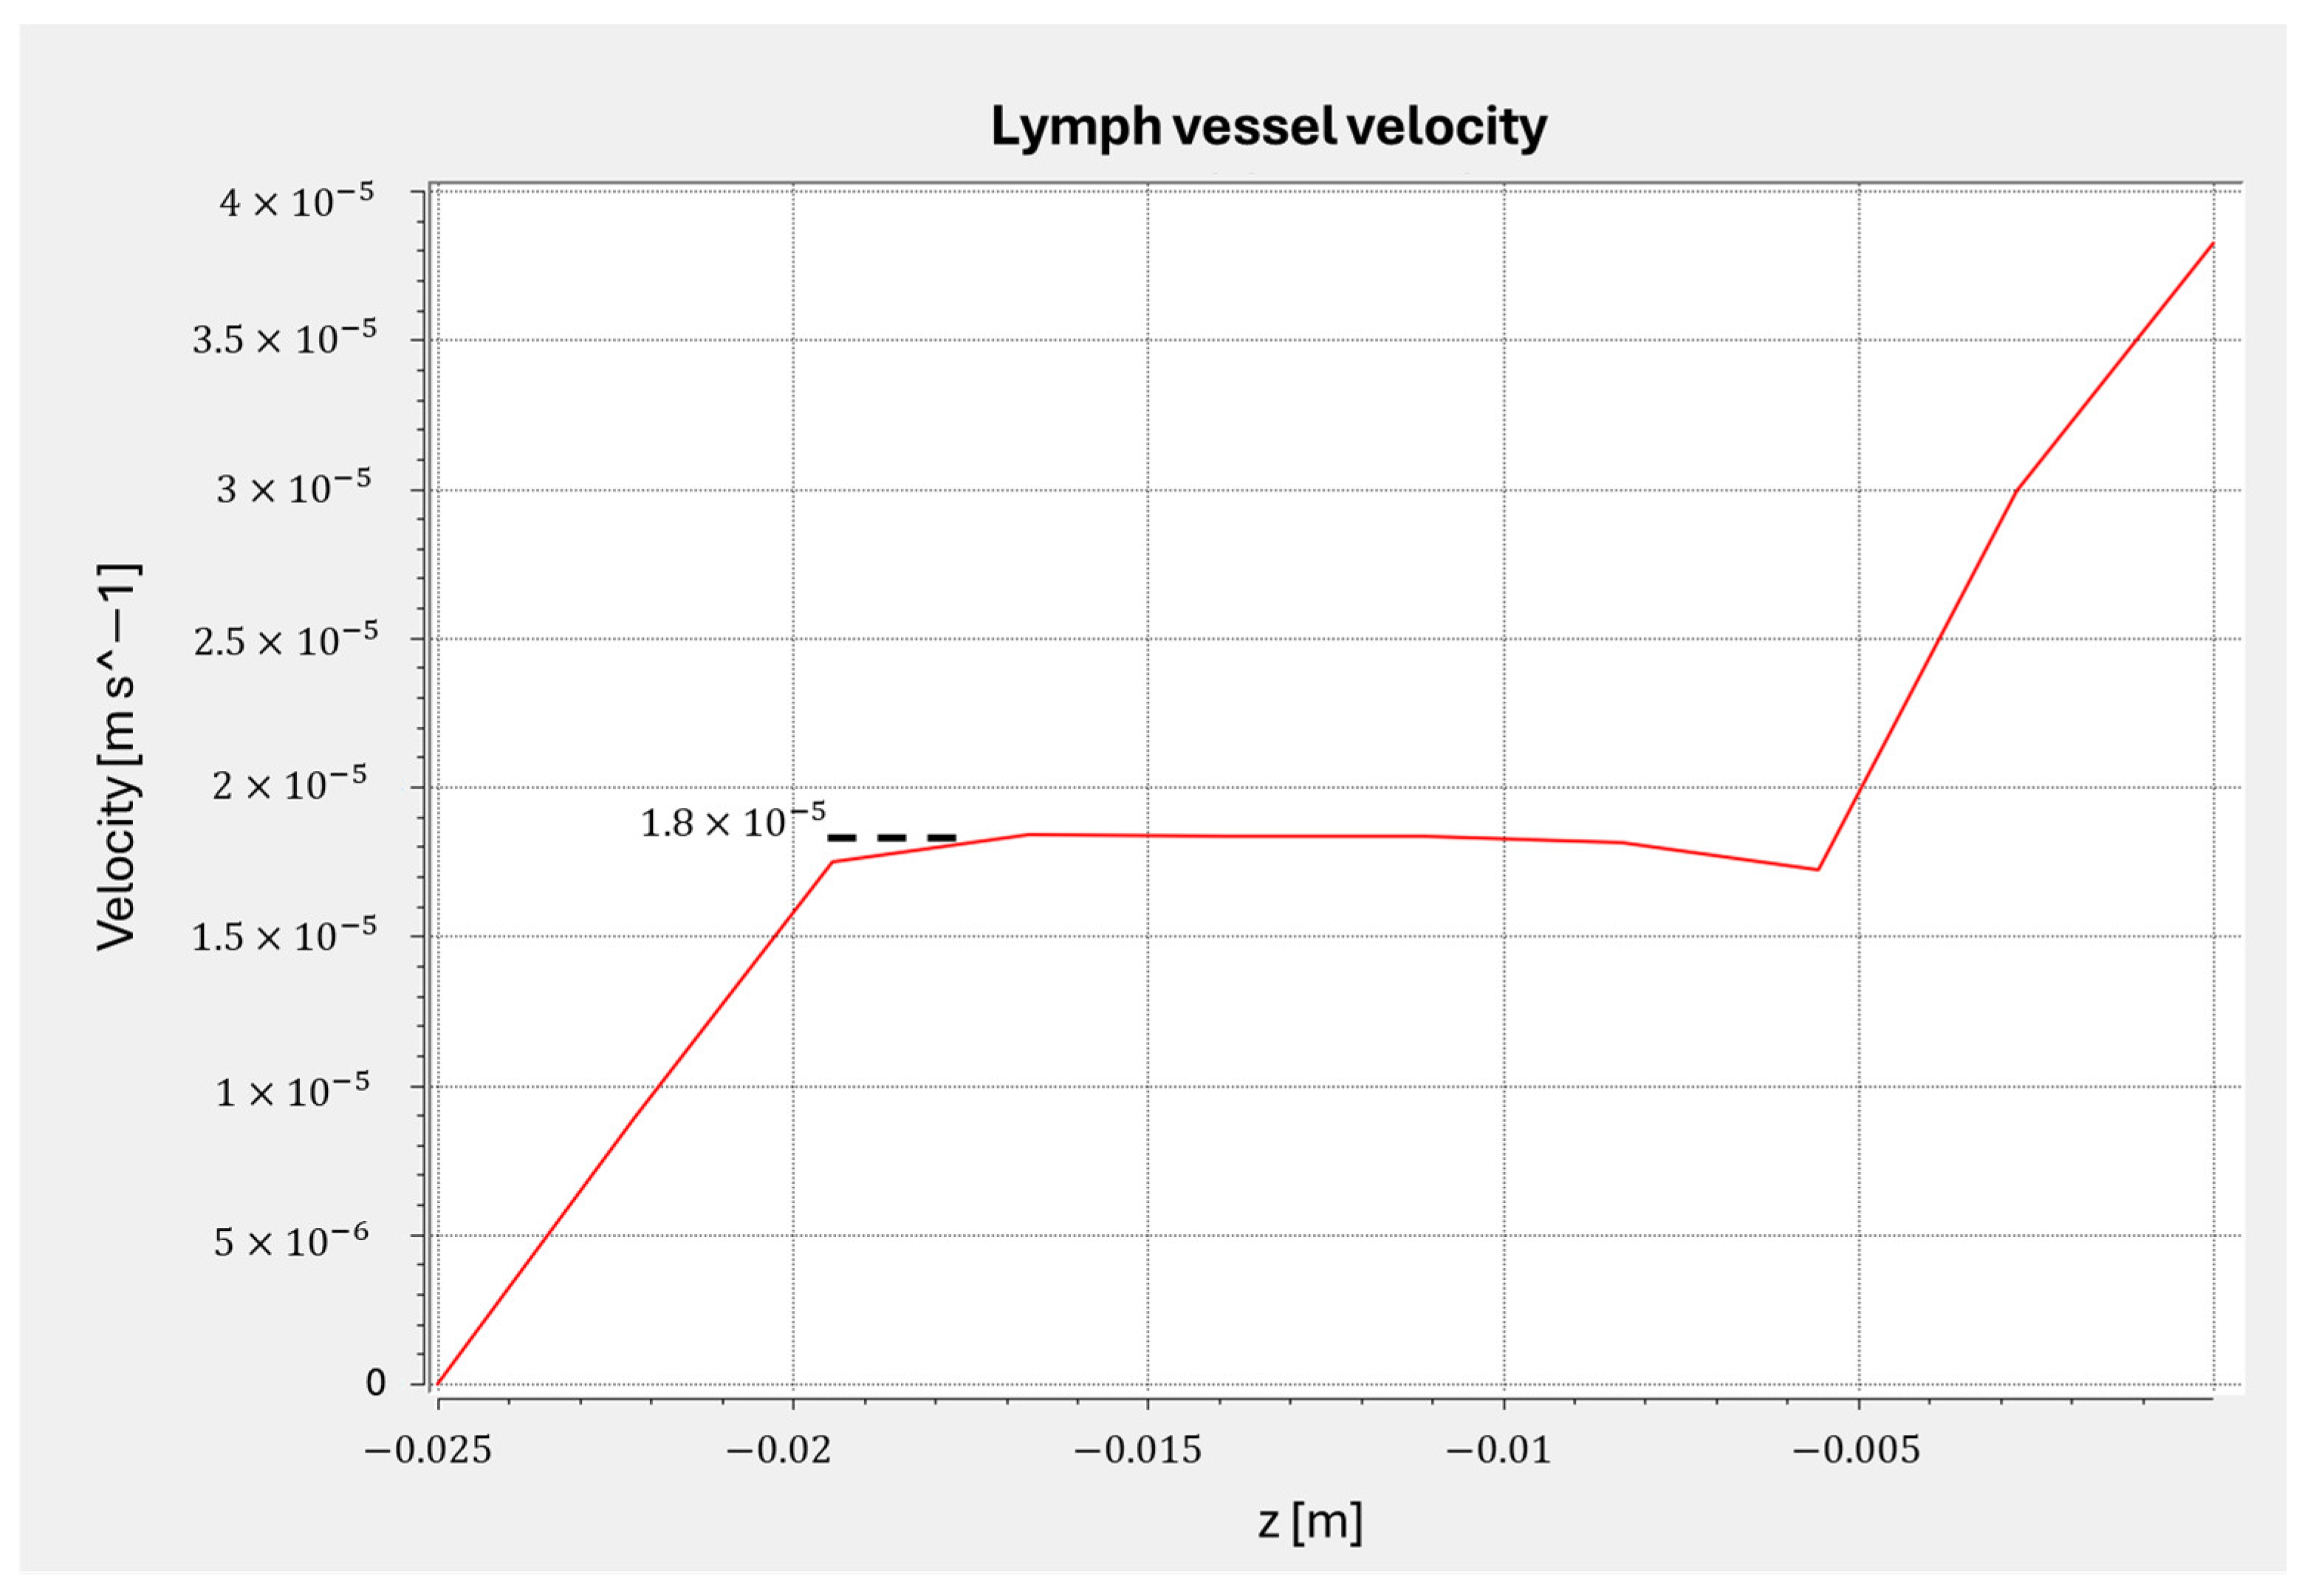
Simulation results confirmed uniform flow distribution within the tumor and lymph compartments (Figure 8) and revealed that the flow velocity in the interconnecting microchannel designed to mimic a lymphatic vessel was approximately 1.8 × 10⁻⁵ m/s (Figure A2). This value is consistent with physiological lymph flow velocities reported in the literature [20]. To assess molecular transport within this region, the Péclet number (Pe = VL/D) was calculated for typical cytokines (diffusion coefficient D ≈ 10−6 m2/s [21]), yielding Pe ≪ 1. This indicates that molecular transport in the channel is diffusion-dominated, supporting effective biochemical communication between the two compartments through passive protein exchange.

3.5. Fabrication Parameters of Microfluidic Chip

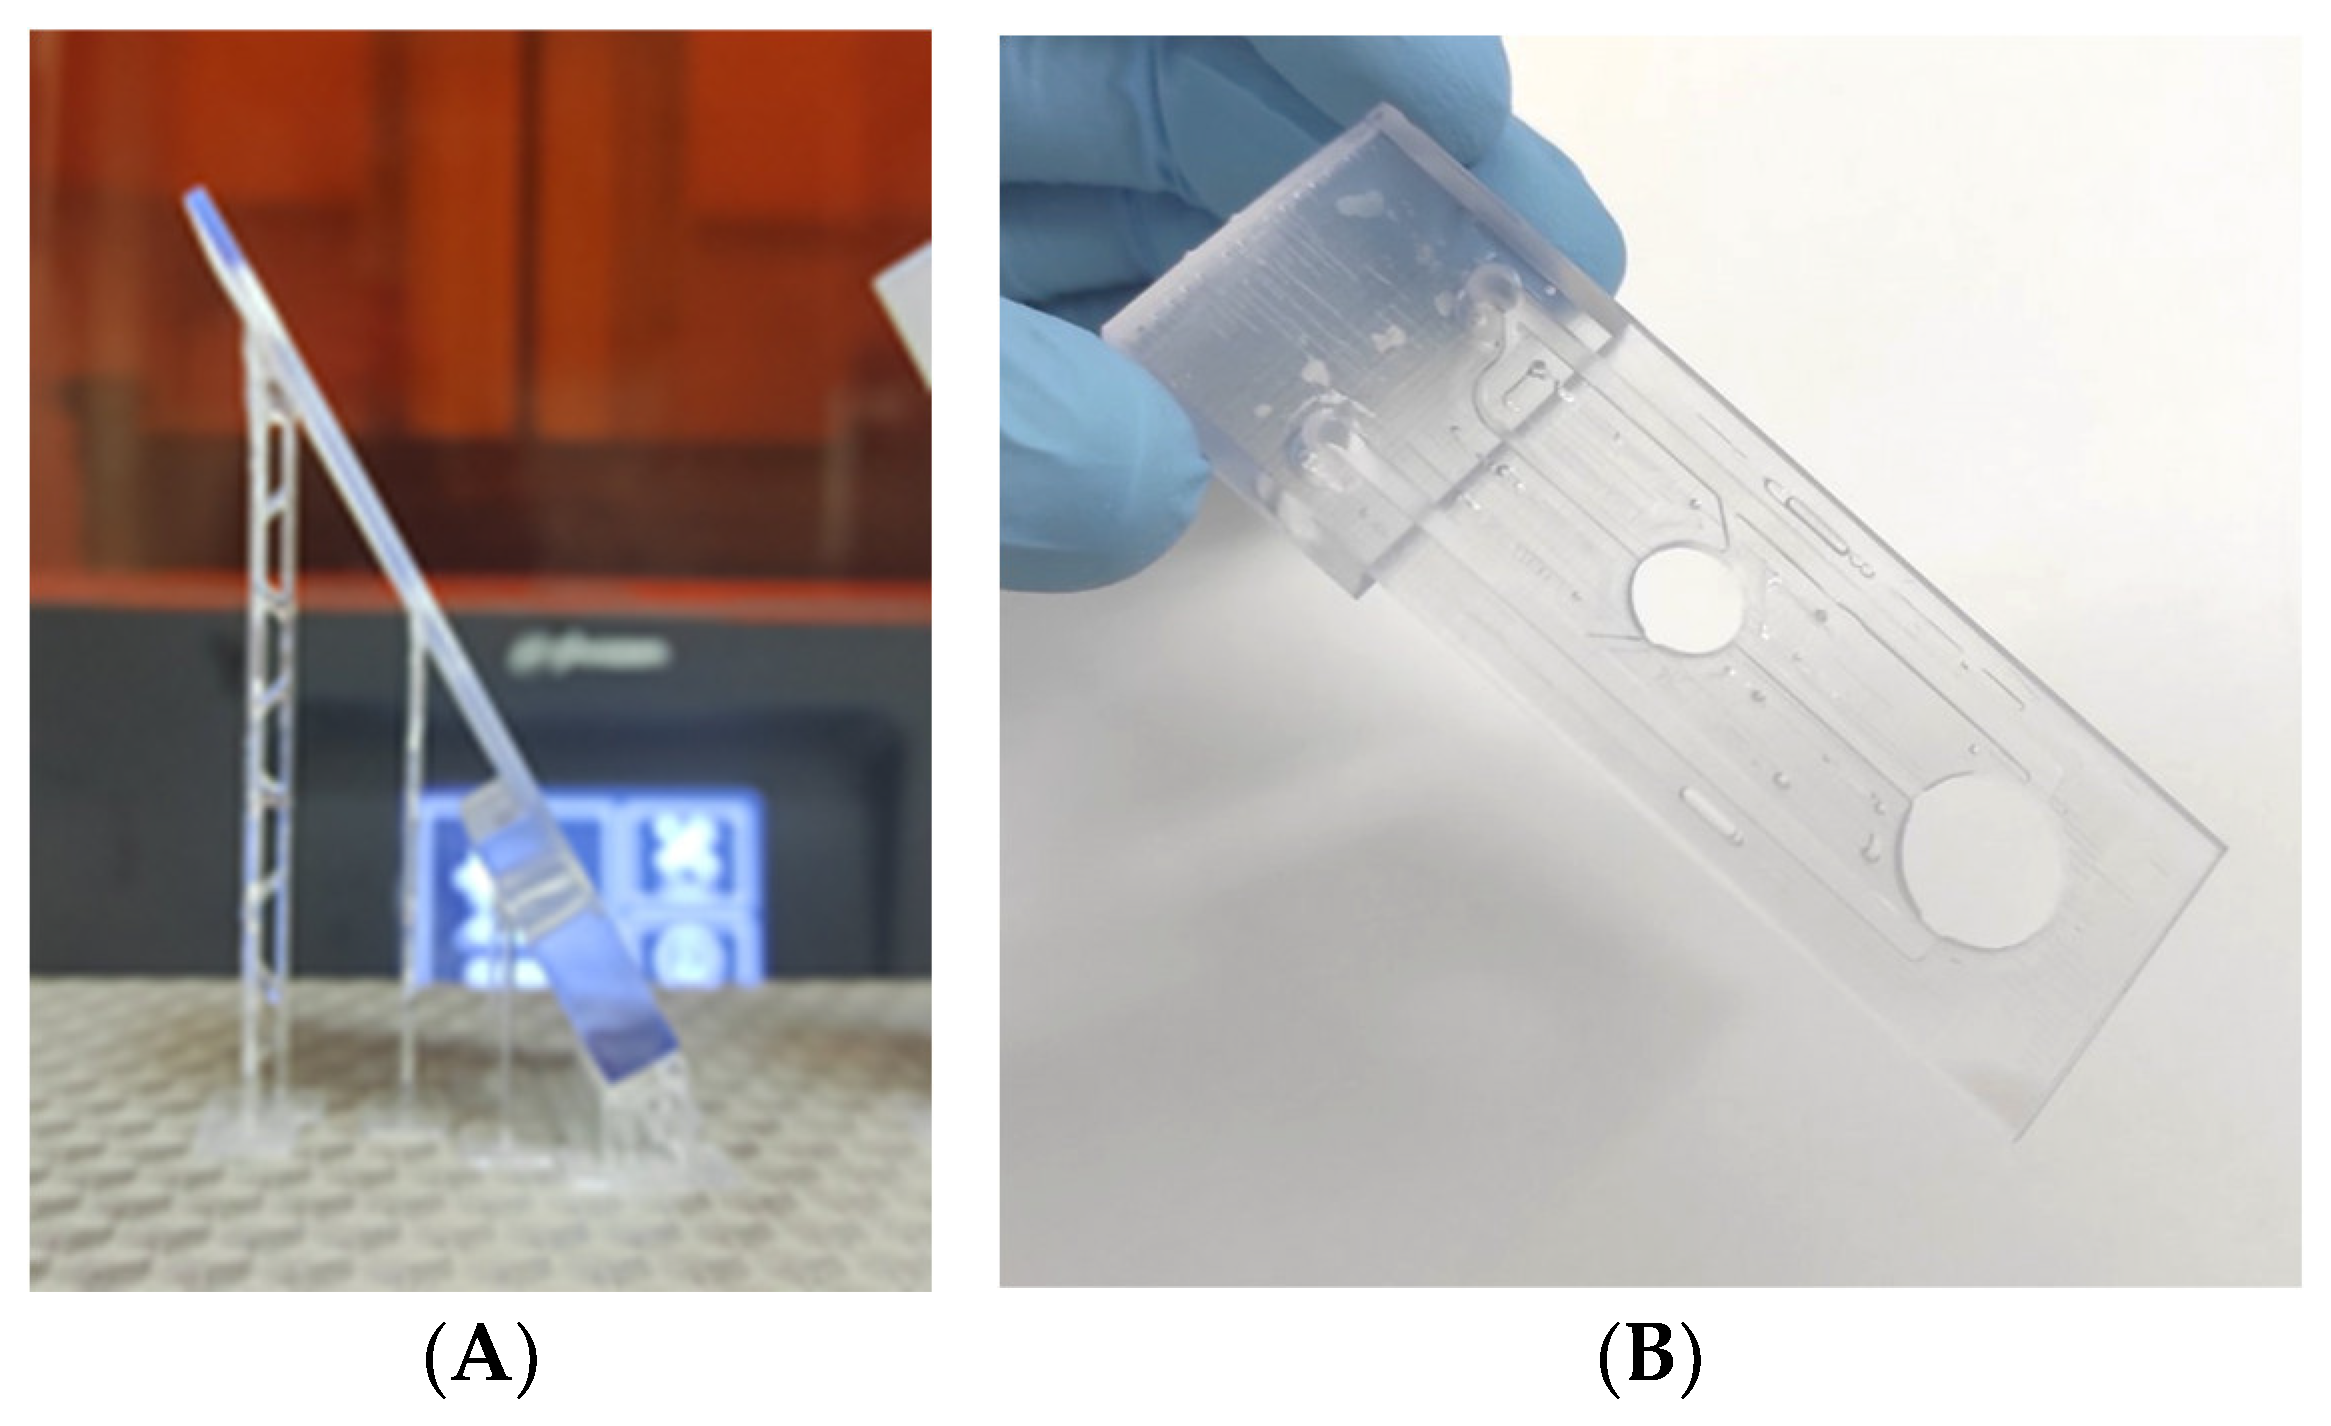
Following the completion of the CAD design and the simulation, the digital model of the microfluidic chip was imported into slicing software (Chitubox Basic v1.9.4) to generate the corresponding print layers. The sliced file was then transferred to the LCD 3D printer for fabrication. The biocompatible resin used for fabrication was selected based on its biocompatibility, transparency, and suitability for culturing adherent cells. Through iterative testing, it was determined that the optimal printing orientation was achieved by rotating the geometry 60° along the x-axis of the build platform (Figure A1). This angled configuration significantly improved printing accuracy and surface quality, particularly in regions requiring fine detail and structural integrity. The orientation also minimized the need for excessive support structures and reduced the likelihood of deformation during the printing and post-processing stages.

3.6. Flow Visualization—Particle Shadow Velocimetry

To experimentally validate the theoretical flow velocity values obtained from CFD simulations, flow visualization was performed using particle shadow velocimetry. Polystyrene microparticles are well-suited for water flow tracking in small channels [22], with a density appropriate for suspension in aqueous media such as water and cell culture media. The particles were employed at a low concentration of 102 particles/mL to avoid aggregation and enable individual particle tracking. The experiment was conducted using the fluidic setup described in the Materials and Methods section. The microfluidic chip was mounted onto an inverted microscope, with focus placed on the interconnecting channel designed to mimic a lymphatic vessel.
Time-lapse imaging captured the motion of particles within the central region of the channel. Post-processing and tracking were conducted using Fiji (ImageJ) (Figure A3). By tracking five representative particles, the experimentally measured average flow velocity was determined to be Vexp = 1.36 ± 0.02 × 10⁻⁵ m/s. This value was compared to the theoretical velocity predicted by the CFD simulation (Vtheo = 1.8 × 10⁻⁵ m/s), revealing a 24% deviation. This deviation is attributable to the 3D printing process, which, as a layer-by-layer additive manufacturing technique, inherently introduces dimensional imperfections in cross sections of the microchannels, as well as geometric irregularities at channel junctions and corners. Such geometrical deviations, from the initial microfluidic design imported in the CFD calculations, have a notable impact on the hydraulic resistances of microchannels, which, in turn, affect the pressure and flow rate distributions within the multichannel microfluidic chip. Despite this, the experimentally observed flow remained within a physiologically relevant range, supporting the chip’s functional validity.

3.7. Cell Bioprinting Inside the Microfluidic Chip Chamber

Utilizing the optimal bioprinting parameters established in the earlier stages of this study, LIFT was employed to deposit Lewis lung carcinoma (LLC) cells, in the form of a bioink, directly into the chamber of the microfluidic chip. For this procedure, the microfluidic device was positioned beneath the donor slide, with the glass-bottom chamber serving as the receiving substrate. The bioink, containing LLC cells at a high concentration as described in the Materials and Methods section, was printed with precise spatial control onto the glass surface within the chamber. This setup ensured accurate droplet placement and high cell viability while maintaining compatibility with the chip’s structural dimensions and flow functionality. The successful deposition of cells under these conditions demonstrated the system’s potential for high-resolution, contactless cell printing within confined microenvironments, critical for future organ-on-chip applications.

3.8. Cell Culture Under Flow Inside the Microfluidic Chip Chamber

In order to evaluate the ability of the microfluidic platform to support viable cell culture under continuous flow, two separate experiments were conducted using LLC cells by utilizing the fluidic setup described above (Figure 2). In the first experiment, cells were seeded into the chamber of the microfluidic chip at a concentration of 3 × 10⁴ cells/mL and subjected to continuous perfusion after a 4 h static incubation time. After 24 h under flow, cells were observed to have successfully adhered to the glass-bottom substrate and exhibited normal phenotypic characteristics, including elongated morphology typical of LLC cells under adherent conditions (Figure A4). Cells were subsequently harvested by PBS washing and trypsinization and assessed for viability using Trypan blue exclusion. The viability exceeded 95%, indicating that the culture conditions within the device were non-toxic and supportive of sustained cancer cell growth.
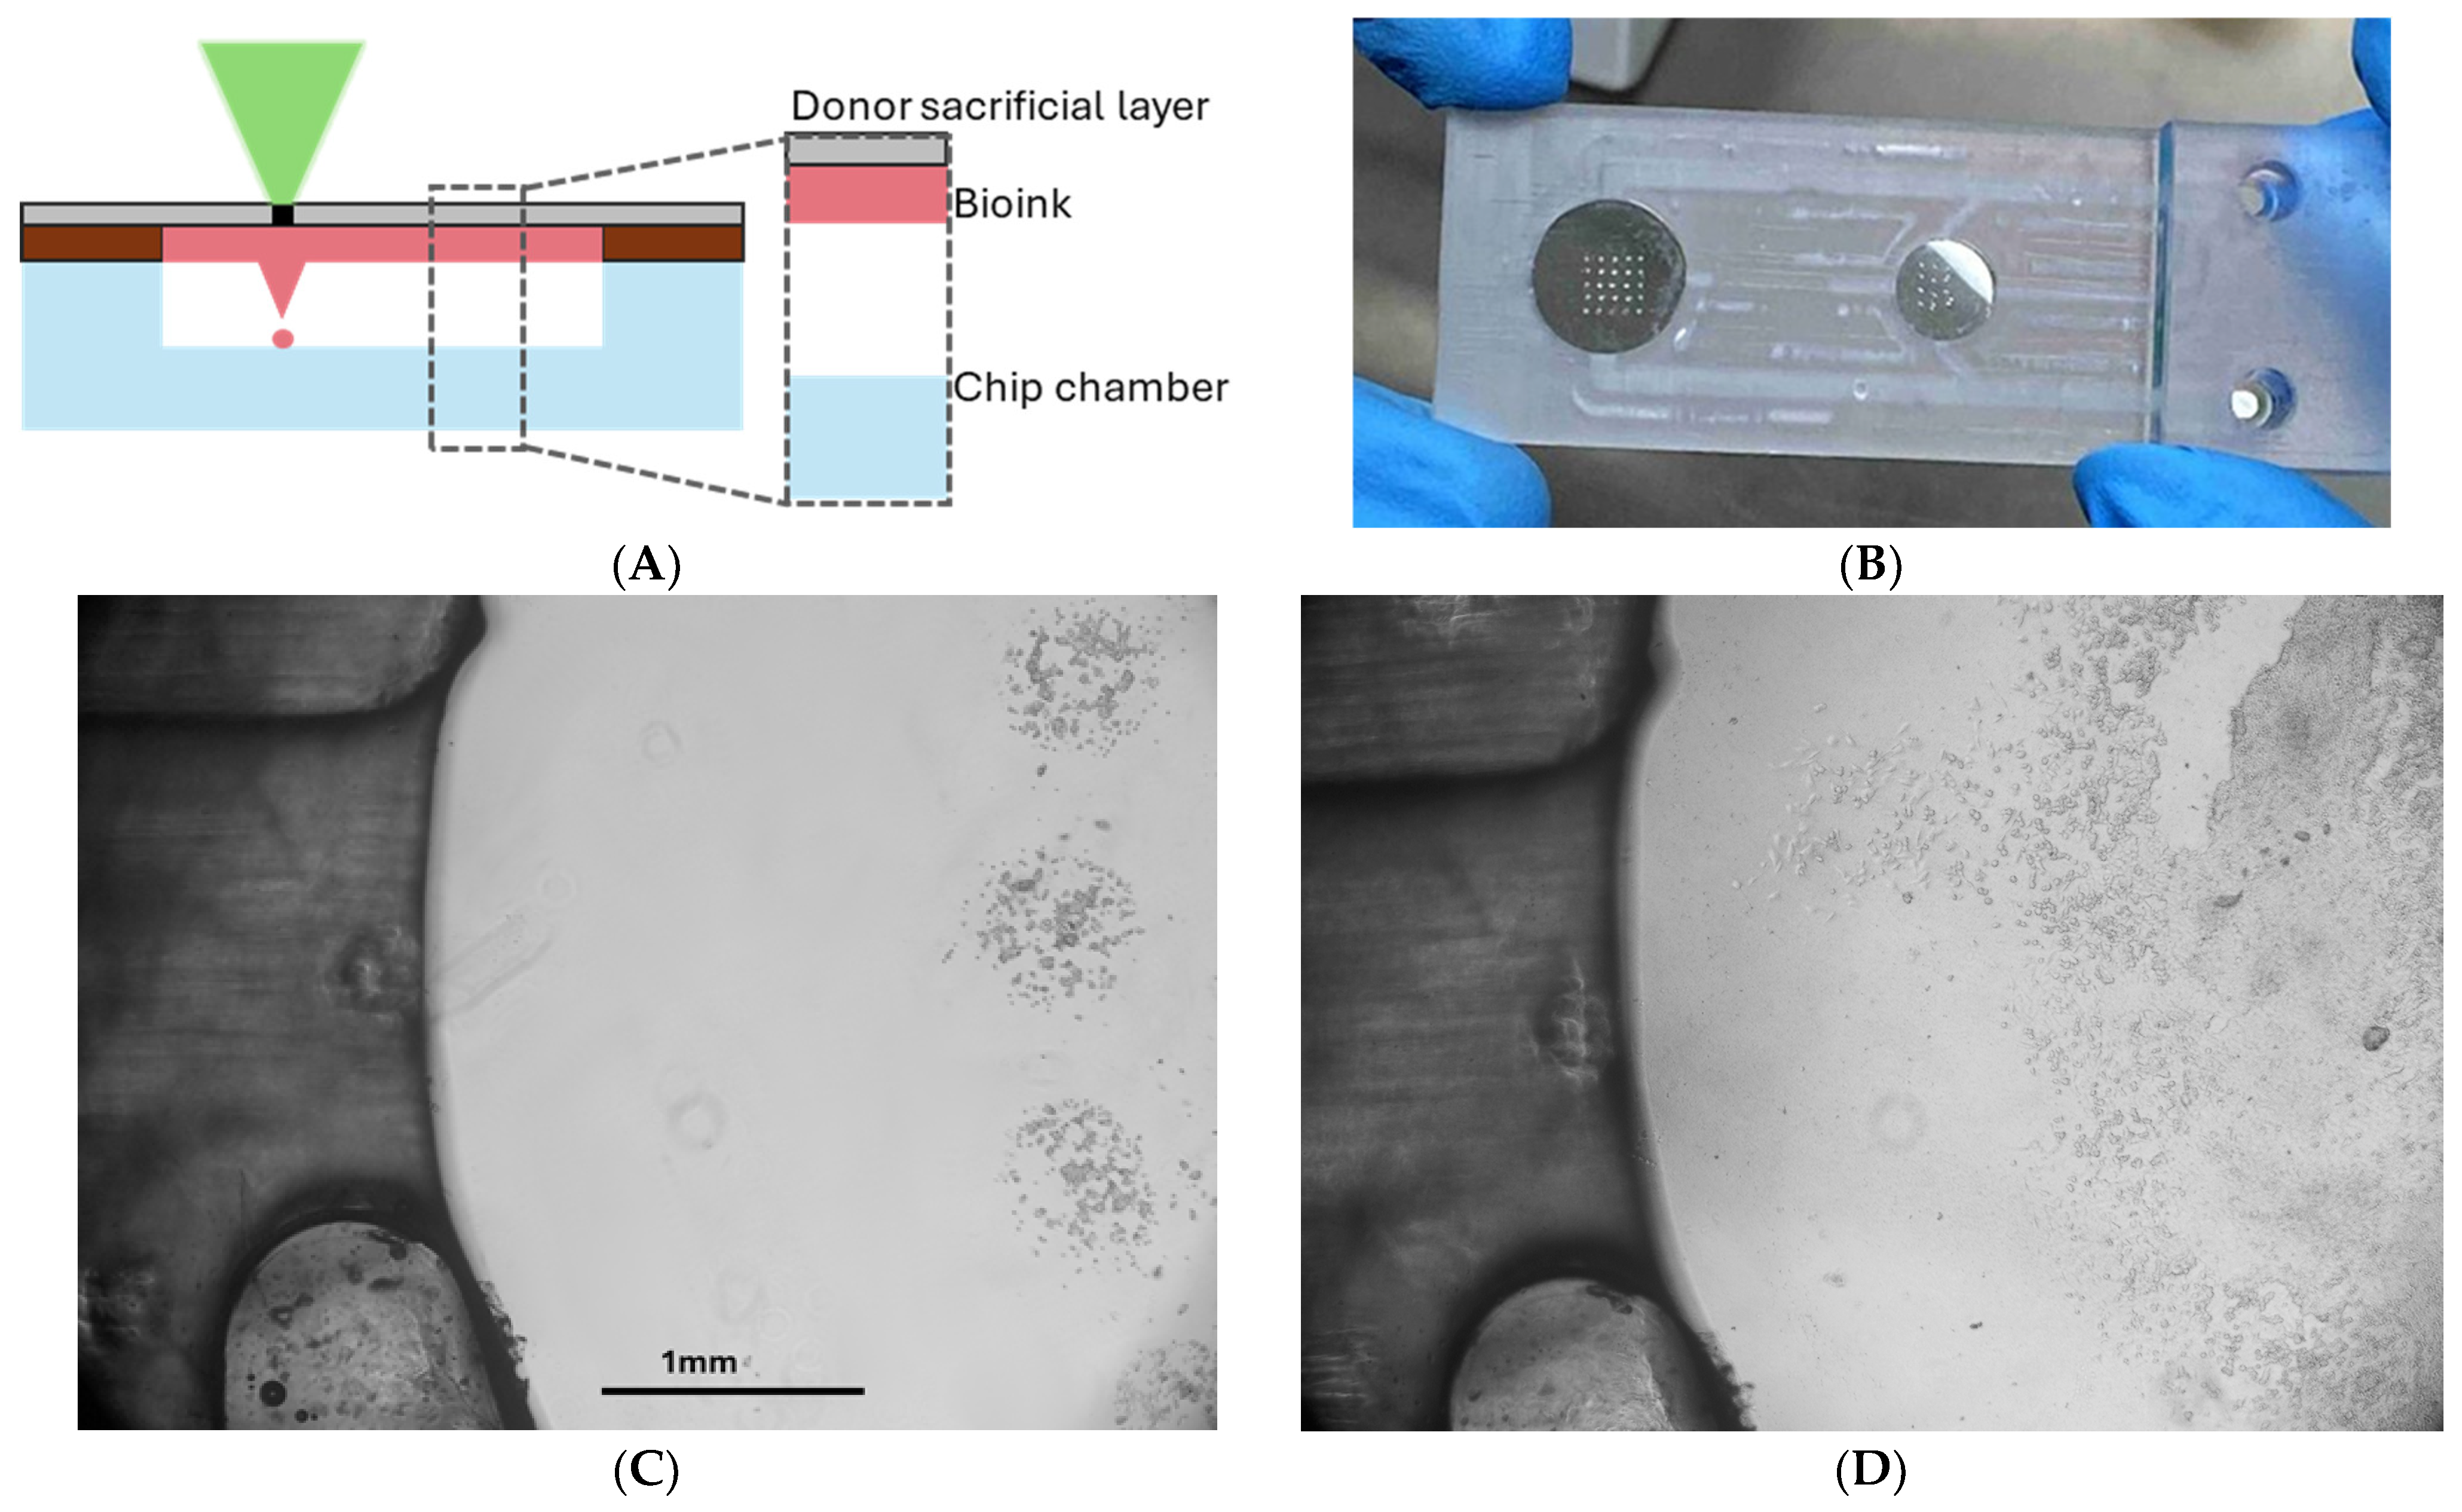
Building upon these results, a second experiment was performed using a microfluidic chip containing a bioprinted array of LLC cells. To accomplish this, the microfluidic chip chamber was brought into direct contact with the donor substrate containing the bioink, in order to ensure the 2 mm gap from the substrate (chamber bottom) (Figure 9A). In this approach, perfusion was initiated immediately after cell introduction (Figure 9C), as the LIFT process enables precise immobilization of cells at the printed positions. After 48 h of perfusion, a confluent monolayer formed around the printed spots, and signs of cell detachment were observed due to over-confluency (Figure 9D). High-resolution images captured using a 10× objective lens further revealed cell migration toward the central microchannel, where fresh medium entered the chamber. These findings confirm that the platform can support viable, dynamic cultures under physiological flow conditions and suggest its potential for studying cancer cell behavior, migration, and cell–cell signaling in microengineered environments.
To summarize, this study demonstrates the potential of LIFT bioprinting as a high-precision, non-contact technique for cell patterning within microfluidic devices, offering significant advantages for OoC research. Through a detailed parametric analysis, we established that a donor–receiver distance of up to 2.0 mm allows consistent jet propagation and acceptable print resolution. At distances beyond this threshold, spatial instability increases, leading to compromised printed arrays.
Previous studies have explored the basic principles of LIFT printing for cell-laden materials (Guillotin et al., Catros et al.), yet most focused on either open substrate systems or 2D patterning on static surfaces. Our findings expand upon these works by systematically quantifying the droplet propagation behavior and spatial accuracy across a range of donor–receiver distances (1.0–3.0 mm), using high-speed videography and custom image analysis tools. While Duocastella et al. and Patrascioiu et al. discussed jet formation and dynamics, the current study bridges this physical understanding with practical device integration, particularly within a microfluidic chip environment.
To our knowledge, this is one of the first studies to directly integrate LIFT bioprinting into a closed OoC device and validate compatibility under perfusion. The successful deposition and proliferation of LLC cells within the chamber demonstrates that LIFT can overcome one of the key challenges of bioprinting in microenvironments, which is precise delivery in confined spaces without damaging sensitive bioinks or disrupting printing geometries. Compared to inkjet or extrusion-based methods, which suffer from lower resolution and shear-induced cell stress (Koch et al.), LIFT offers a highly localized, low-shear alternative suited for advanced tissue models.
Furthermore, CFD simulation and particle velocimetry confirm that the fabricated chip provides physiologically relevant flow rates and diffusion-dominated transport in the inter-compartmental channel. This is critical for mimicking tumor–lymphatic interactions, which remain challenging to model in vitro. Similar approaches have been attempted (Carvalho et al.), but often without integration of bioprinting techniques or quantitative print resolution analysis.
Despite these advances, limitations remain. The printing resolution deteriorates rapidly beyond 2.0 mm, limiting the flexibility of chip architectures. Additionally, while short-term cell viability was confirmed, long-term behavior, differentiation potential, and inter-compartmental signaling were not evaluated in this study. Future work should focus on multi-cellular and multi-material printing and explore chronic perfusion conditions in tumor-on-chip platforms.
In summary, this work presents a robust framework for LIFT bioprinting integration with microfluidic systems, providing both a physical basis for operational limits and a functional demonstration in OoC applications. By aligning jet dynamics with chip geometry, we contribute a reproducible design rule for future OoC platforms seeking to incorporate non-contact, high-resolution bioprinting. Our study is among the first to experimentally demonstrate and validate high-resolution, non-contact bioprinting inside a closed microfluidic environment under flow. This not only corroborates the feasibility of LIFT for biofabrication but also establishes a critical design threshold (≤2.0 mm) for effective jet propagation, which has not been explicitly defined in prior literature. By introducing quantifiable guidelines and demonstrating functional cell integration, our work lays the foundation for developing advanced in vitro cancer models with improved physiological relevance and greater translational potential for drug screening and personalized medicine.
4. Conclusions

In this work, we demonstrated the successful integration of LIFT bioprinting with a custom-designed microfluidic organ-on-chip platform for cancer cell patterning and perfused culture. Through detailed analysis of jet dynamics, printing resolution, fluidic behavior, and cell viability, we established the operational limits and optimal parameters for high-precision bioprinting within confined microenvironment. Our results confirm that LIFT enables accurate and non-invasive cell deposition at donor–receiver distances up to 2.0 mm, while supporting cell viability and phenotypic integrity under physiological flow. Furthermore, the technique’s non-contact nature and compatibility with highly viscous bioinks make it especially promising for advanced tissue models and applications requiring printing directly onto fragile or complex biological surfaces. Beyond identifying a critical donor–receiver distance for LIFT bioprinting, our study uniquely quantifies the precise degradation of spatial resolution and jet dynamics at varying distances using high-speed imaging and custom analysis tools. This technical insight, combined with successful in-chip cell patterning and culture under physiological flow, demonstrates not only the feasibility but the practical utility of LIFT in microfluidic environments. The integration of bioprinting directly into a sealed organ-on-chip platform under perfusion has not been explicitly demonstrated before and offers a significant step toward scalable, automated, and physiologically relevant tissue models for translational research. Altogether, this study positions LIFT as a powerful and versatile tool for enhancing organ-on-chip technologies and paves the way for more complex in vitro models for cancer research, tissue engineering, and drug development.

Author Contributions

Methodology, M.A.C.; Investigation, M.A.C.; Writing—original draft, M.A.C.; Writing—review & editing, A.H. and I.Z.; Supervision, A.H. and I.Z. All authors have read and agreed to the published version of the manuscript.

Funding

MAC research work is supported by the Hellenic Foundation for Research and Innovation (HFRI) under the 4th Call for HFRI PhD Fellowships (Fellowship Number: 11421). This project has received funding from the European Union’s Horizon 2020 research and innovation programme under grant agreement No. 953234, project Tumor-LN-oC.

Data Availability Statement

Data are contained within the article.

Acknowledgments

We thank Apostolos Klinakis’ lab in BRFAA for providing the cells used in this study and ELVEFLOW for providing microfluidic equipment in the framework of Tumor-LN-oC project.

Conflicts of Interest

The authors declare no conflicts of interest. The funders had no role in the design of the study; in the collection, analyses, or interpretation of data; in the writing of the manuscript; or in the decision to publish the results.

Appendix A

The Appendix includes supplementary visual material to support and illustrate the experimental workflow and outcomes presented in the main text. An image of the 3D-printed microfluidic chip, as it was retrieved directly from the printer (Figure A1A), is provided to showcase the quality and detail of the printed structure. A subsequent image of the fully assembled and finalized chip, including the glass-bottom integration (Figure A1B), highlights the completed device ready for cell culture experiments. Figure A2 depicts a chart diagram of the velocity magnitude across the connecting channel of the two chambers of the microfluidic chip. Additionally, a representative frame from the particle shadow velocimetry experiment is included (Figure A3), demonstrating the tracking of microparticles within the central channel. A photograph of the complete microfluidic circuit inside the incubator is also presented (Figure A4A), depicting the device under active culture conditions, connected to the flow system. Finally, a microscopic image captured after 24 h of LLC cell culture under flow is shown (Figure A4B), confirming successful cell adhesion, proliferation, and morphology within the chip environment. These Supplementary figures provide further validation of the design, functionality, and biological relevance of the developed platform.
Figure A1. (A) Image of microfluidic chip on printing bed, before post-processing, right after the completion of the print. (B) Finalized microfluidic chip, after the post-processing procedure, with attached glass-bottom substrate.
Photonics 12 00877 g0a1
Figure A2. Connecting channel velocity chart on the central axis of the channel, connecting one chamber to the other.
Photonics 12 00877 g0a2
Figure A3. Photograph of the particles inside the microfluidic channel. The vertical lines in the photograph represent the layer lines created from the 3D printing procedure.
Photonics 12 00877 g0a3
Figure A4. (A) Photograph of the microfluidic circuit as cultured inside the incubator. The chip is placed on top of compact inverted microscope for brightfield imaging inside the incubator (Axion/CytoSMART -Lux2). (B) Microscopic image of the culture captured by the Lux2 microscope.
Photonics 12 00877 g0a4

References

  1. Chliara, M.A.; Elezoglou, S.; Zergioti, I. Bioprinting on organ-on-chip: Development and applications. Biosensors 2022, 12, 1135. [Google Scholar] [CrossRef]
  2. Zergioti, I.; Karaiskou, A.; Papazoglou, D.; Fotakis, C.; Kapsetaki, M.; Kafetzopoulos, D. Femtosecond laser microprinting of biomaterials. Appl. Phys. Lett. 2005, 86, 163902. [Google Scholar] [CrossRef]
  3. Elezoglou, S.; Hatziapostolou, A.; Giannakopoulos, K.; Zergioti, I. High-precision depth-controlled laser bioprinting of cells in extracellular matrix for three-dimensional structures. Int. J. Bioprint. 2025, 11, 292–306. [Google Scholar] [CrossRef]
  4. Koch, L.; Deiwick, A.; Franke, A.; Schwanke, K.; Haverich, A.; Zweigerdt, R.; Chichkov, B. Laser bioprinting of human induced pluripotent stem cells-the effect of printing and biomaterials on cell survival, pluripotency, and differentiation. Biofabrication 2018, 10, 035005. [Google Scholar] [CrossRef]
  5. Catros, S.; Fricain, J.C.; Guillotin, B.; Pippenger, B.; Bareille, R.; Remy, M.; Lebraud, E.; Desbat, B.; Amédée, J.; Guillemot, F. Laser-assisted bioprinting for creating on-demand patterns of human osteoprogenitor cells and nano-hydroxyapatite. Biofabrication 2011, 3, 025001. [Google Scholar] [CrossRef] [PubMed]
  6. Guillotin, B.; Souquet, A.; Catros, S.; Duocastella, M.; Pippenger, B.; Bellance, S.; Bareille, R.; Rémy, M.; Bordenave, L.; Amédée, J.; et al. Laser assisted bioprinting of engineered tissue with high cell density and microscale organization. Biomaterials 2010, 31, 7250–7256. [Google Scholar] [CrossRef]
  7. Karakaidos, P.; Kryou, C.; Simigdala, N.; Klinakis, A.; Zergioti, I. Laser Bioprinting of Cells Using UV and Visible Wavelengths: A Comparative DNA Damage Study. Bioengineering 2022, 9, 378. [Google Scholar] [CrossRef]
  8. Fernández-Pradas, J.M.; Serra, P. Laser-induced forward transfer: A method for printing functional inks. Crystals 2020, 10, 651. [Google Scholar] [CrossRef]
  9. Duocastella, M.; Colina, M.; Fernández-Pradas, J.M.; Serra, P.; Morenza, J.L. Study of the laser-induced forward transfer of liquids for laser bioprinting. Appl. Surf. Sci. 2007, 253, 7855–7859. [Google Scholar] [CrossRef]
  10. Alan, H.G.; Bradford, P. Anodically Produced Multiple Oxide Films for Increasing the Reflectance of Evaporated Aluminum*. J. Opt. Soc. Am. 1957, 47, 125–129. [Google Scholar] [CrossRef]
  11. Patrascioiu, A.; Fernández-Pradas, J.M.; Palla-Papavlu, A.; Morenza, J.L.; Serra, P. Laser-generated liquid microjets: Correlation between bubble dynamics and liquid ejection. Microfluid. Nanofluid. 2014, 16, 55–63. [Google Scholar] [CrossRef]
  12. Unger, C.; Gruene, M.; Koch, L.; Koch, J.; Chichkov, B.N. Time-resolved imaging of hydrogel printing via laser-induced forward transfer. Appl. Phys. A 2011, 103, 271–277. [Google Scholar] [CrossRef]
  13. Chen, R.C.C.; Yu, Y.T.; Su, K.W.; Chen, J.F.; Chen, Y.F. Exploration of water jet generated by Q-switched laser induced water breakdown with different depths beneath a flat free surface. Opt. Express 2013, 21, 445. [Google Scholar] [CrossRef] [PubMed]
  14. Carvalho, V.; Rodrigues, R.O.; Lima, R.A.; Teixeira, S. Computational simulations in advanced microfluidic devices: A review. Micromachines 2021, 12, 1149. [Google Scholar] [CrossRef] [PubMed]
  15. Carvalho, V.; Gonçalves, I.M.; Rodrigues, N.; Sousa, P.; Pinto, V.; Minas, G.; Kaji, H.; Shin, S.R.; Rodrigues, R.O.; Teixeira, S.F.C.F.; et al. Numerical evaluation and experimental validation of fluid flow behavior within an organ-on-a-chip model. Comput. Methods Programs Biomed. 2024, 243, 107883. [Google Scholar] [CrossRef] [PubMed]
  16. Hutmacher, D.W.; Harmeet, S. Computational fluid dynamics for improved bioreactor design and 3D culture. Trends Biotechnol. 2008, 26, 166–172. [Google Scholar] [CrossRef] [PubMed]
  17. Ivanov, K.P.; Kalinina, M.K.; Levkovich, Y.I. Blood flow velocity in capillaries of brain and muscles and its physiological significance. Microvasc. Res. 1981, 22, 143–155. [Google Scholar] [CrossRef] [PubMed]
  18. Sotornik, R.; Ardilouze, J.L. Measurement and Manipulation of Human Adipose Tissue Blood Flow Using Xenon Washout Technique and Adipose Tissue Microinfusion; Methods in Enzymology; Academic Press: Cambridge, MA, USA, 2014; Volume 537, pp. 227–242. [Google Scholar] [CrossRef]
  19. Maruyama, Y. Performance of various X-ray film/screen systems in demonstrating small simulated low-density lung nodules. Nippon. ACTA Radiol. 1998, 58, 509–515. [Google Scholar] [CrossRef] [PubMed]
  20. Swartz, M.A.; Berk, D.A.; Jain, R.K. Transport in lymphatic capillaries. I. Macroscopic measurements using residence time distribution theory. Am. J. Physiol.-Heart Circ. Physiol. 1996, 270, H324–H329. [Google Scholar] [CrossRef] [PubMed]
  21. Ross, A.E.; Pompano, R.R. Diffusion of cytokines in live lymph node tissue using microfluidic integrated optical imaging. Anal. Chim. Acta 2018, 1000, 205–213. [Google Scholar] [CrossRef] [PubMed]
  22. Pecora, C. Particle Tracking Velocimetry: A Review. Master’s Thesis, University of Washington, Seattle, WA, USA, 2018. [Google Scholar]
Figure 1. Schematic representation of the LIFT configuration used in this study featuring the integrated high-speed camera system.
Photonics 12 00877 g001
Figure 2. Schematic representation of the microfluidic flow circuit.
Photonics 12 00877 g002
Figure 3. (AE) represent microscopic images from the printed arrays with applied donor–receiver distances from 1 mm to 1.5 mm, 2 mm, 2.5 mm, and 3 mm, respectively. One unit cell of the grid corresponds to 1 mm2 square. The red dots correspond to the droplet centers, while the black dots correspond to the grid cell center.
Photonics 12 00877 g003
Figure 4. Bar diagram showing the average percentage of droplet offset at each donor–receiver distance, generated with Python script (PyCharm 2023.2).
Photonics 12 00877 g004
Figure 5. Representative frames from the high-speed imaging analysis corresponding to each distinct donor-to-receiver substrate distance. At distances of 1500 μm, 2000 μm, and 3000 μm, visible droplet oscillations are shown after 500 μs.
Photonics 12 00877 g005
Figure 6. (A) Bar diagram showing the average velocity and standard deviation of the primary and secondary jet mechanisms during LIFT bioprinting. (B) Overlapped frames from high-speed analysis showing that instabilities in droplet trajectories become more profound in higher donor–receiver distances. (B) Left frame (a): An angle deviation higher than 7° in one axis, results in less than 150 μm spatial deviation in 1 mm distance and around 250 μm and 400 μm for distances 2 mm and 3 mm, respectively. Right frame (b): Even minor angular deviations can result in larger spatial displacements at greater distances.
Photonics 12 00877 g006
Figure 7. Top (left) and bottom (right) view of the CAD design of the microfluidic chip.
Photonics 12 00877 g007
Figure 8. Contour velocity depiction on the midplane of the microfluidic chip in CFD simulation.
Photonics 12 00877 g008
Figure 9. (A) Schematic representation of the LIFT technique inside the chip chamber. Donor slide and chip are in contact to ensure the 2 mm distance between donor and receiving substrate. (B) Macroscopic photograph of the bioprinted cells inside the microfluidic chip. (C) Microscopic image of the bioprinted LLC cell pattern within the microfluidic chip immediately after printing and sealing, in preparation for perfusion. (D) Cell culture after continuous flow conditions, exhibiting a confluent cell layer after one day of incubation.
Photonics 12 00877 g009
Disclaimer/Publisher’s Note: The statements, opinions and data contained in all publications are solely those of the individual author(s) and contributor(s) and not of MDPI and/or the editor(s). MDPI and/or the editor(s) disclaim responsibility for any injury to people or property resulting from any ideas, methods, instructions or products referred to in the content.