Article

L-Band Erbium-Doped Fiber Optimization and Transmission Investigation †

by
Kaihua Hu
1,
Li Pei
1,
Jianshuai Wang
1,*,
Zhouyi Hu
1,
Wenxuan Xu
1,
Long Zhang
1,
Jing Li
1 and
Li Zhong
2
1
Key Laboratory of All Optical Network and Advanced Telecommunication Network of EMC, Institute of Lightwave Technology, Beijing Jiaotong University, Beijing 100044, China
2
State Key Laboratory of Optical Fiber and Cable Manufacture Technology, Yangtze Optical Fibre and Cable Joint Stock Limited Company (YOFC), Wuhan 430073, China
*
Author to whom correspondence should be addressed.
This paper is an extended version of our paper published in Wang, J.; Pei, L.; Hu, K.; Zheng, J.; Xu, W.; Li, J.; Ning, T.; Zhong, L. An Extended L-Band Gain Equalization with a Few Mode Erbium Doped Fiber. In Proceedings of the 2023 Asia Communications and Photonics Conference/2023 International Photonics and Optoelectronics Meetings (ACP/POEM), Wuhan, China, 4–7 November 2023; pp. 1–3.
Photonics 2025, 12(5), 480; https://doi.org/10.3390/photonics12050480
Submission received: 2 April 2025 / Revised: 2 May 2025 / Accepted: 9 May 2025 / Published: 13 May 2025
(This article belongs to the Special Issue Optical Fiber Amplifiers and Their Applications)

Abstract

:
The optical spectrum resource in the C-band has been used up due to dense wavelength division multiplexing (DWDM). Because of devices’ compatibility with both the C-band and the L-band, the L-band is a good choice for further capacity expansion. Meanwhile, the mode division multiplexing (MDM) method has been applied to increase the number of channels. However, the few-mode erbium-doped fiber amplifier must be redesigned to overcome the power differences among channels. In this work, a few-mode erbium-doped fiber (FM-EDF) is optimized and manufactured. Then, an in-line gain-equalized L-band FM-EDFA is constructed. The experimental results show that the FM-EDFA works well in the wavelength range between 1575 nm and 1610 nm. The minimum differential modal gain (DMG) is 0.54 dB, and the maximum modal gain is 22.22 dB. Due to the excellent performance of the L-band FM-EDFA, a DSP-free transmission scheme in the L-band is demonstrated. The bit error rates (BERs) of each channel are below 1 × 10⁻⁵ with a DSP-free receiver.

1. Introduction

The introduction of rare-earth-element-doped fiber amplifiers and wavelength division multiplexing (WDM) technology has significantly enhanced both the transmission distance and capacity of optical communication systems [1]. However, the widespread adoption of dense wavelength division multiplexing (DWDM) technology has led to the exhaustion of available optical spectrum resources in the C-band (1530–1565 nm) [2]. Consequently, new transmission bands are being explored for further capacity expansion. Due to the device compatibility and proximity in wavelength, the L-Band (1565–1625 nm) is a promising candidate for capacity expansion. Extensive research has been conducted to realize amplification in the L-band [3,4,5] or combined C+L band [6,7,8]. Additionally, the mode division multiplexing (MDM) method has been applied to increase the number of channels, thereby promoting the transmission capacity [9,10]. When the existing single-mode optical transmission systems are not able to meet the capacity demand, constructing new transmission networks based on few-mode fibers emerges as a good choice. However, the widely used single-mode EDFA cannot directly support effective amplification of the optical signal transmitted in few-mode fibers. This requires the use of mode-demultiplexing and mode-multiplexing devices, and doubles the number of single-mode EDFAs, significantly increasing the system complexity and cost. In contrast, a few-mode erbium-doped fiber amplifier (FM-EDFA) can supply power compensation for all the different mode channels, without requiring mode converters. Therefore, FM-EDFA is an essential component in few-mode optical transmission systems.
In an FM-EDFA, the distribution of different signal modes leads to a high power difference among various mode channels. This power imbalance severely impairs the overall transmission performance. Thus, there is an urgent demand for suitable L-band FM-EDFAs to meet the requirements of few-mode transmission systems, ensuring signal power equalization among all signal modes. This is essential for realizing high-bit-rate and long-distance transmission [11,12].
Significant efforts have been made to realize gain equalization in the L-band, including pump mode regulation and active fiber design. Pump mode regulation is an effective method to reduce the DMG among different modes. In 2015, Wada et al. implemented an EDFA with a DMG of less than 1 dB in the wavelength range of 1570 nm to 1600 nm, utilizing pump mode, wavelength regulation, and fiber design [13]. In 2021, an FM-EDFA was proposed only theoretically, supporting a DMG of 0.28 dB in the wavelength range of 1570–1616 nm through a mode-hybrid pumped method [14]. As the gain medium, both the refractive and doping profiles of the rare-earth-doped fiber significantly impact the gain equalization characteristics. Thus, optimizing the fiber structure is another promising way to realize gain equalization in the L-Band. In 2022, Qiu et al. proposed a gain-equalized FM-EDFA, obtained by optimizing a few-mode active fiber and pumped with two LP11 pump mode lasers [15]. However, the pump mode conversion induces more insertion loss and increases the system complexity. In 2021, a few-mode erbium–ytterbium co-doped fiber amplifier (FM-EYDYA) was proposed, capable of supporting a minimum modal gain of 20 dB in the whole L-band [16]. Nevertheless, the EYDFA has not yet been characterized in a transmission system.
In this paper, we present the optimization and fabrication of an L-band few-mode erbium-doped fiber (FM-EDF). Utilizing this homemade FM-EDF, we develop a gain-equalized FM-EDFA operating in the wavelength range of 1575 nm to 1610 nm. The experimental results demonstrate that the maximum modal gain achieved is 22.22 dB, with a minimum DMG of 0.54 dB. Additionally, the gain flatness over all modes and wavelengths is 4.54 dB. Furthermore, when applied in a few-mode transmission system, the L-band FM-EDFA supports each mode channel for 9.95 Gbps, NRZ signal transmission over the wavelength range of 1570 nm to 1610 nm, and has a bit error rate (BER) of below 1 × 10⁻⁵.
The rest of the paper is organized as follows: In Section 2, the fiber structure is optimized by the particle swarm optimization algorithm (PSO), and the gain characteristics are verified with experiments; in Section 3, the L-band FM-EDFA is applied in a transmission system to investigate the performance; in Section 4, we finally conclude this paper. The part regarding gain performance verification was published in a conference [17], while the remaining portions have been newly incorporated.

2. Fiber Optimization and Verification

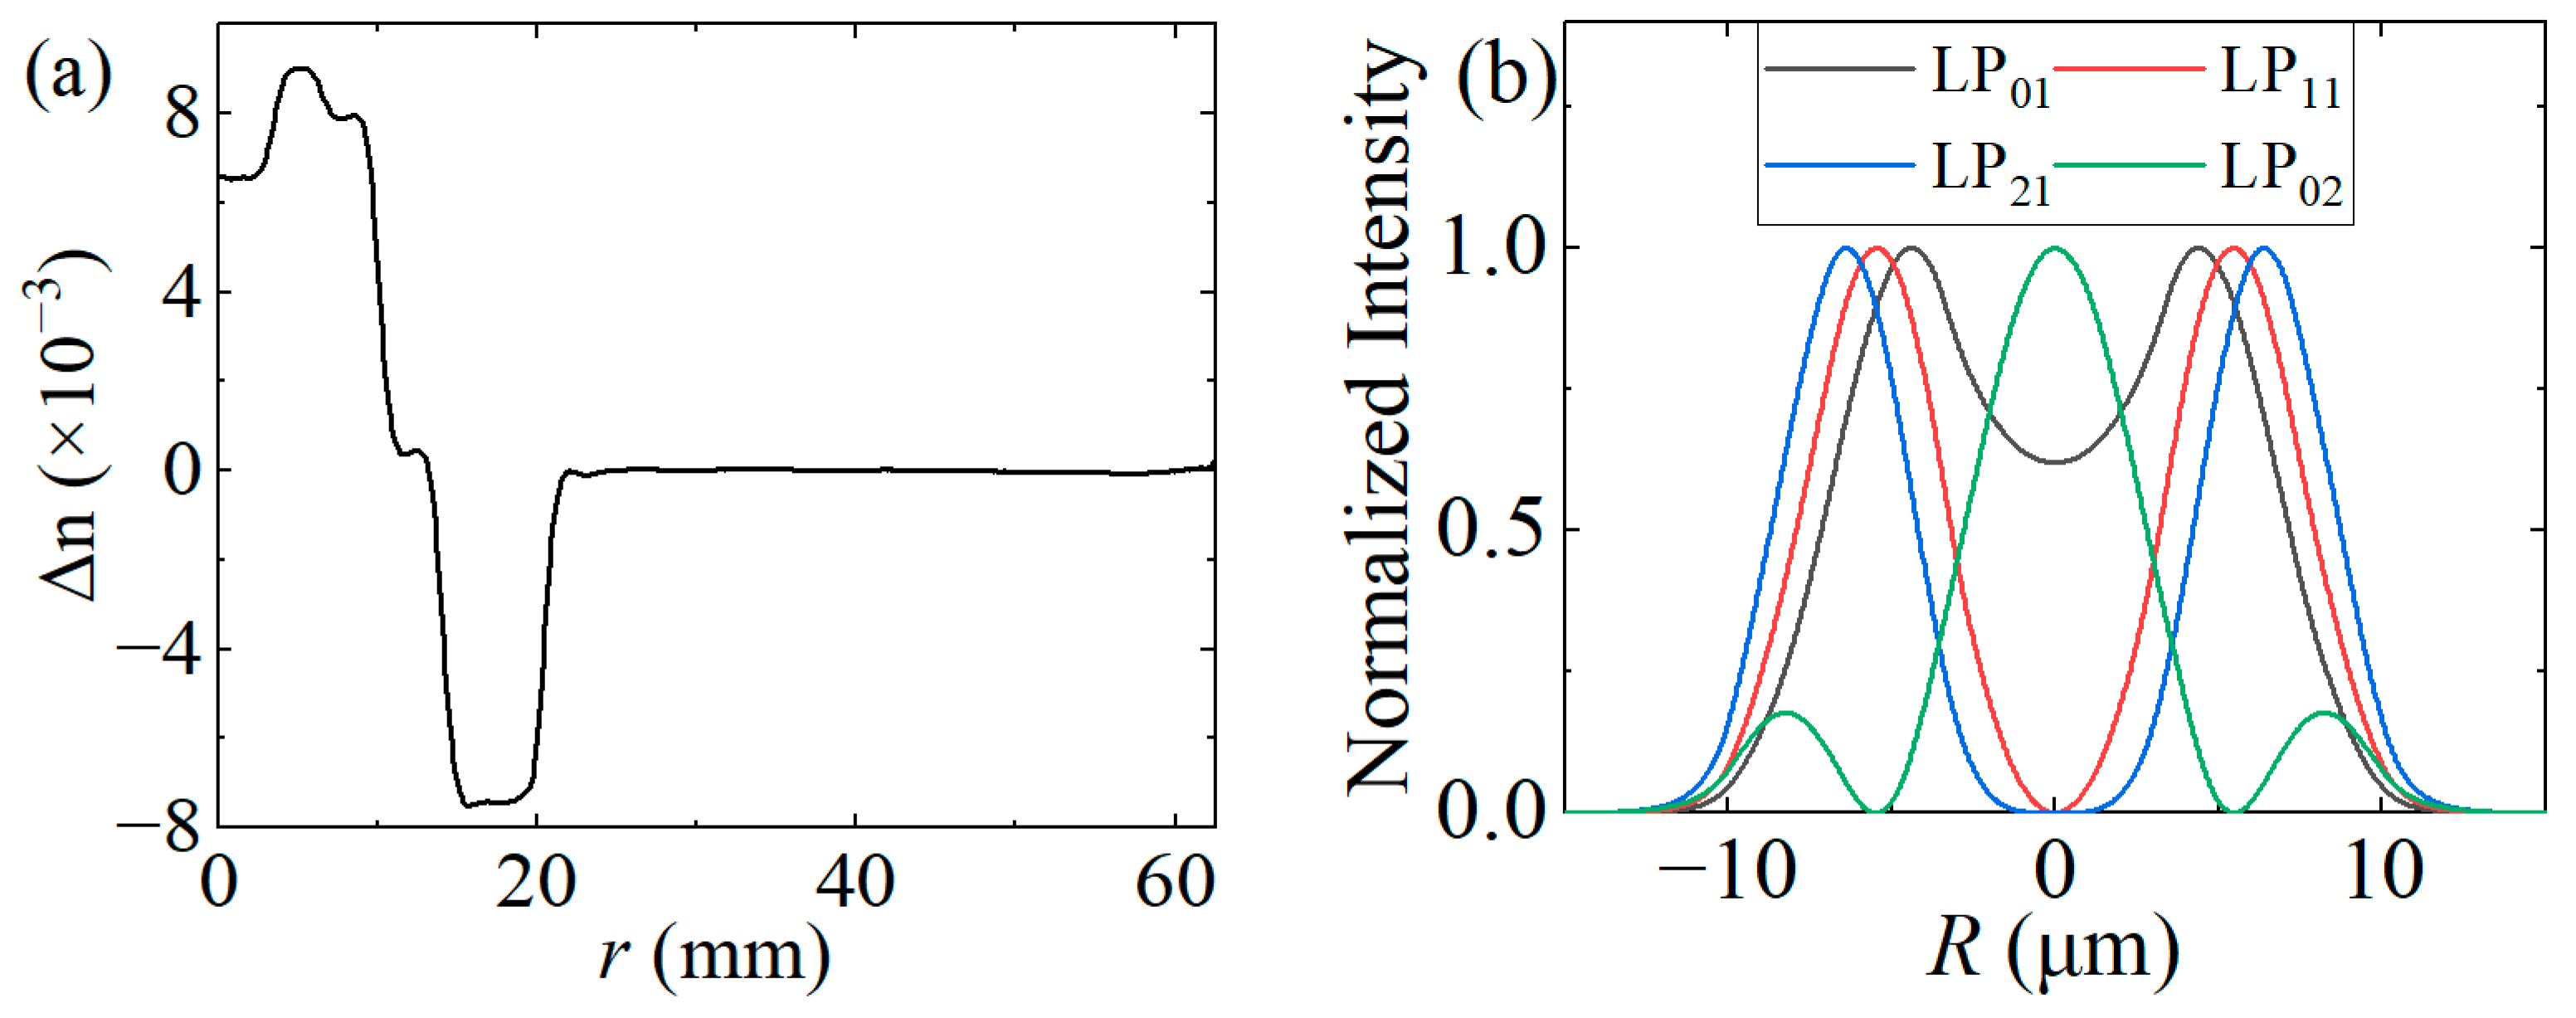
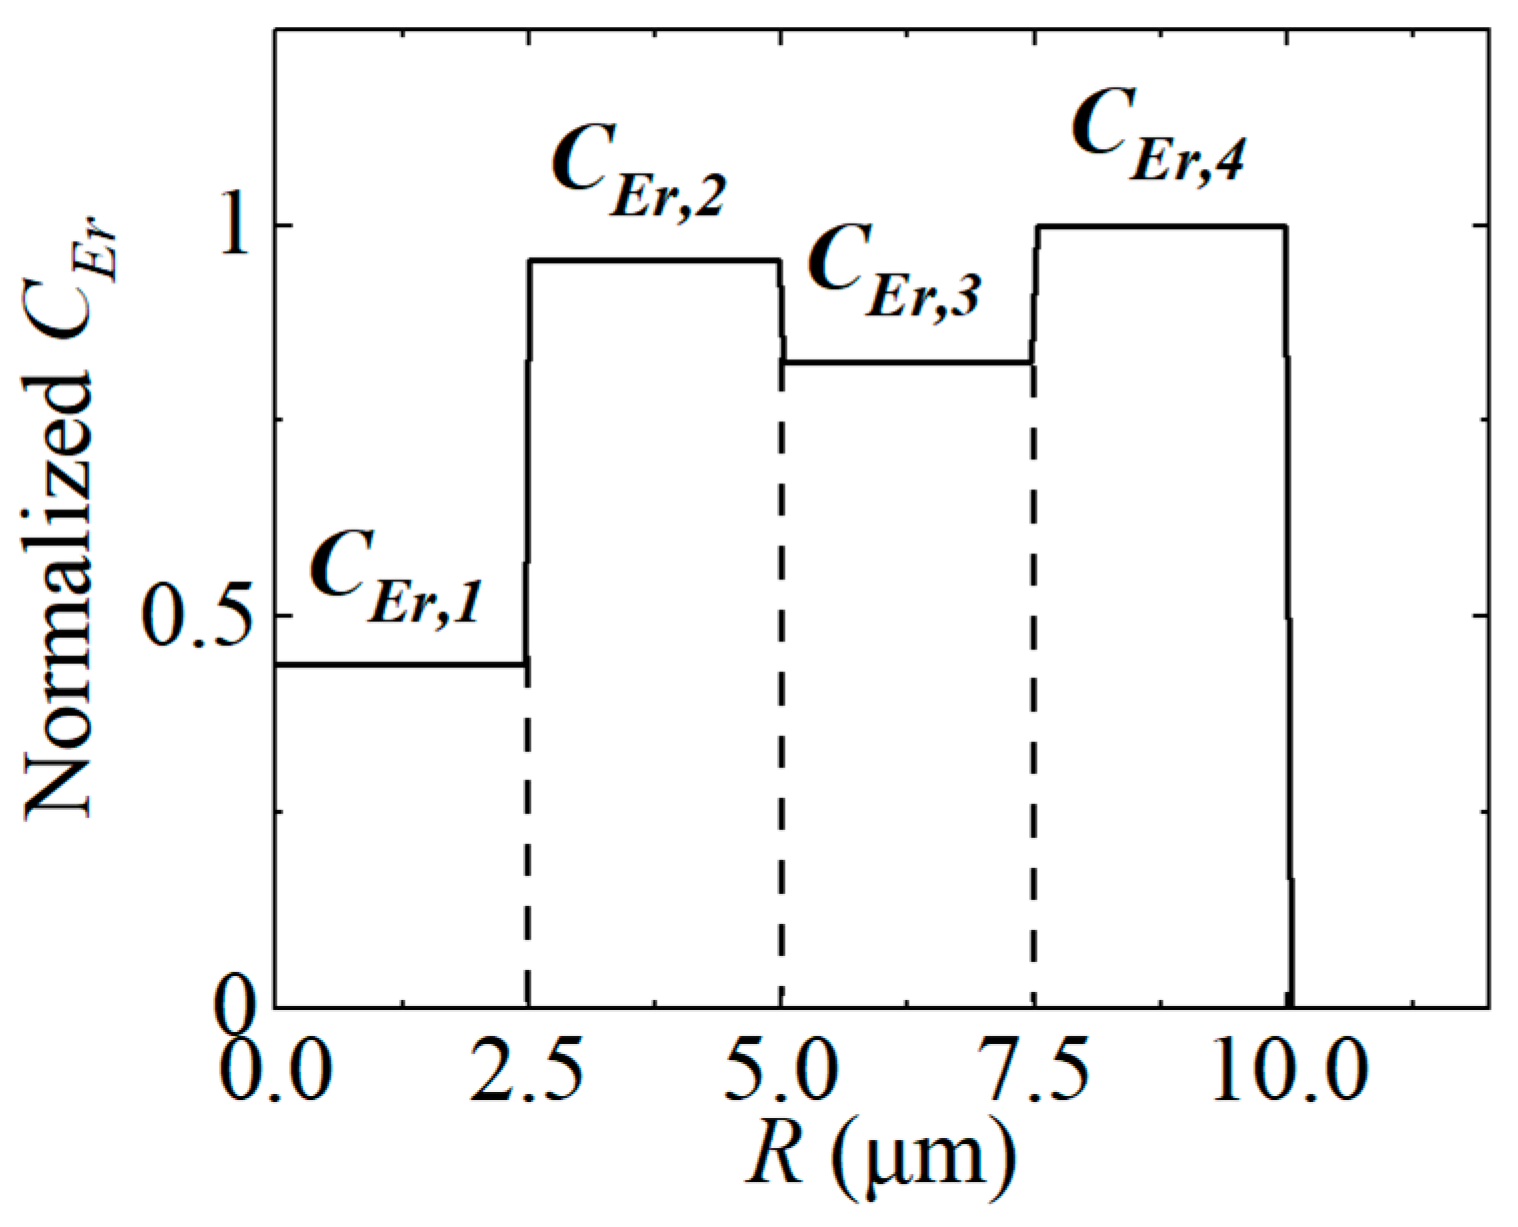
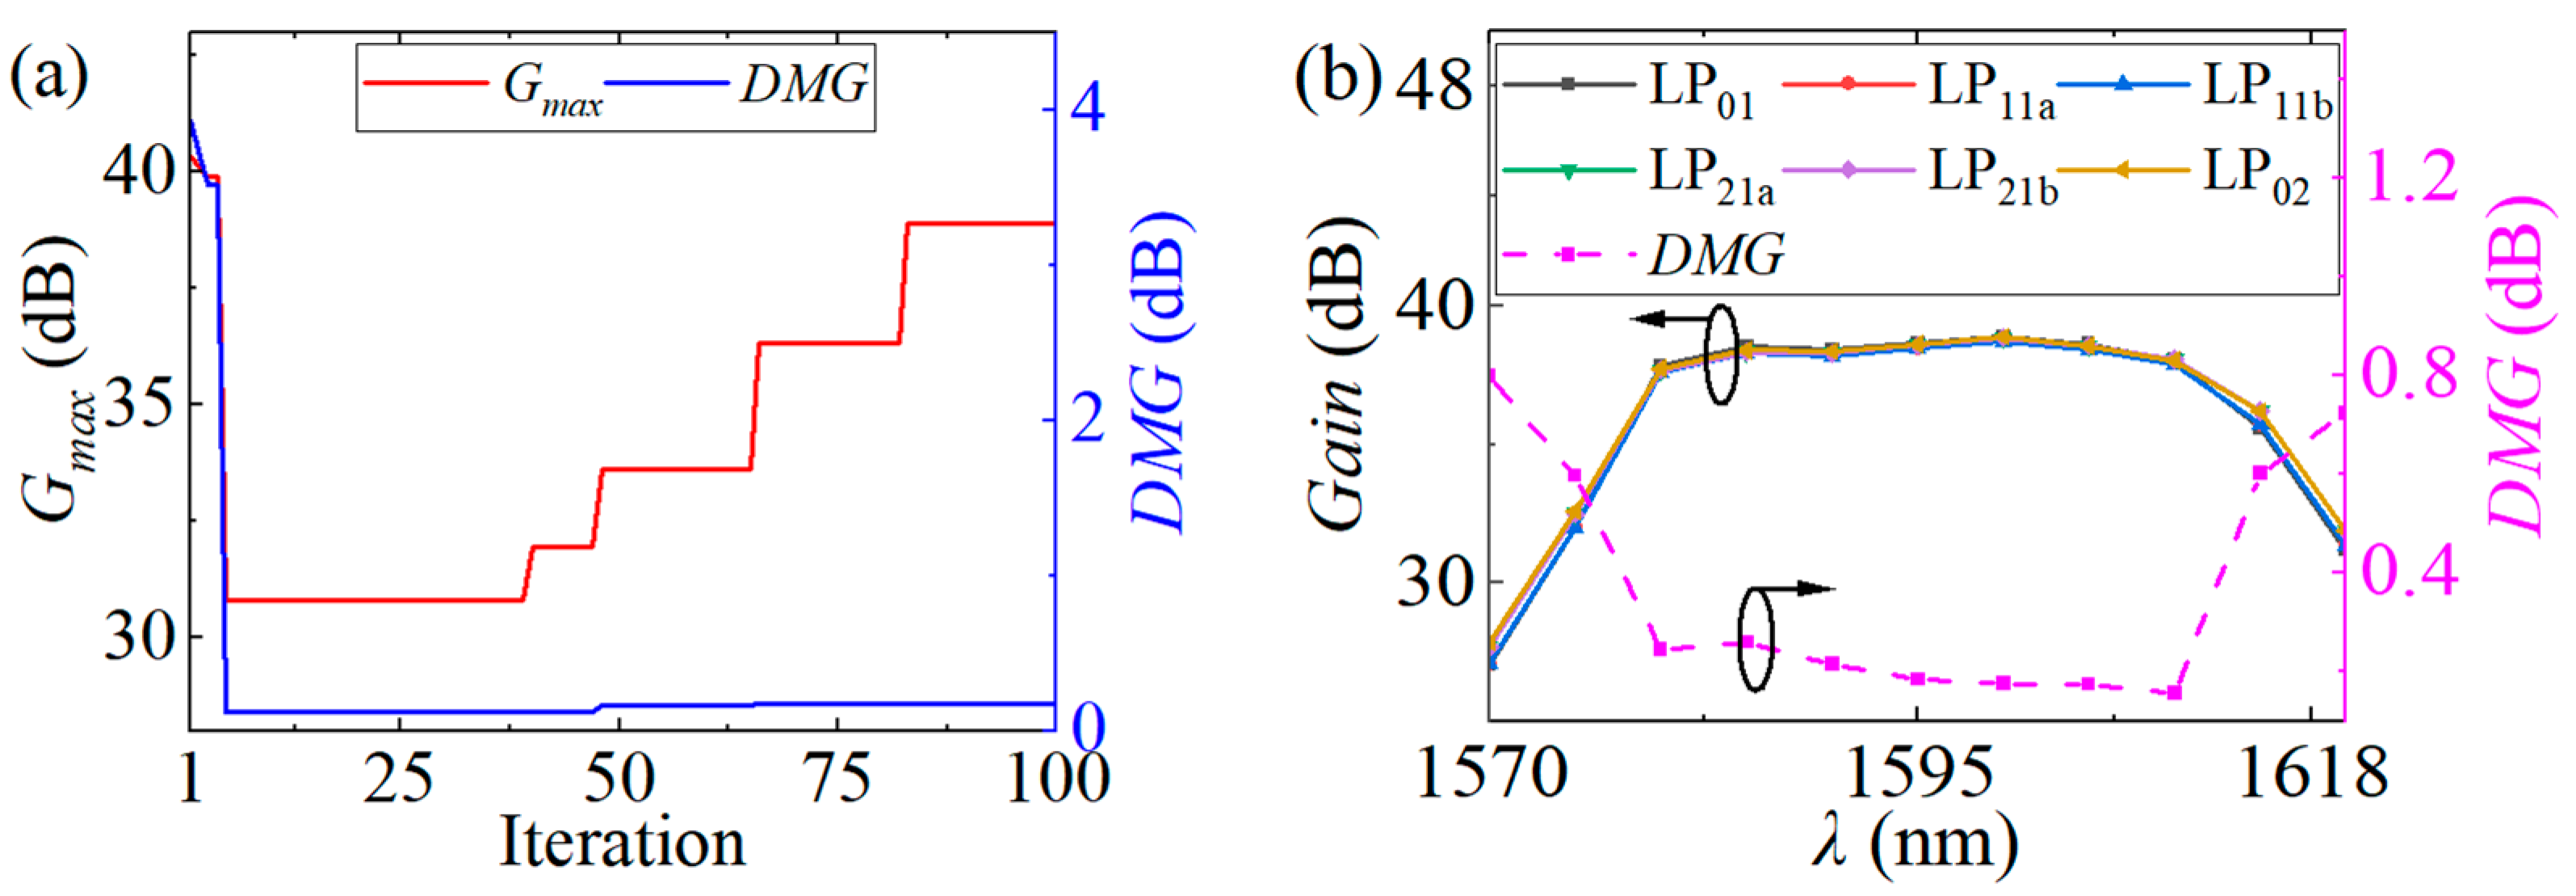
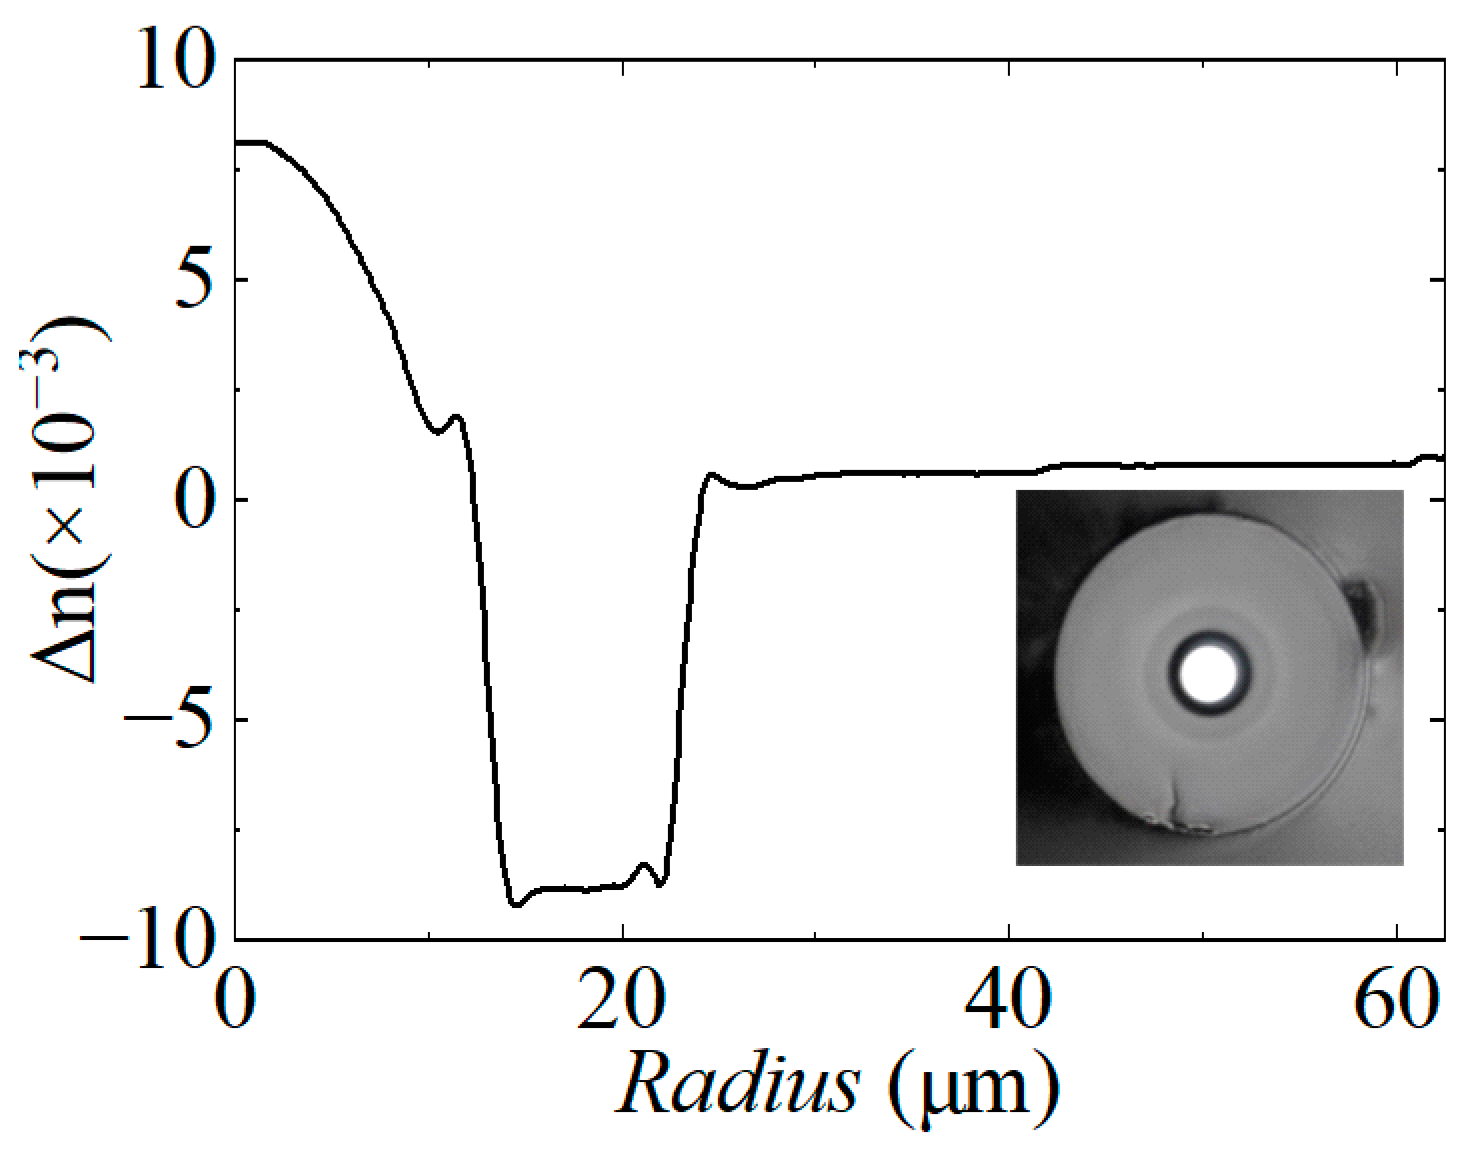
2.1. The Structure Optimization of the FM-EDF

The few-mode erbium-doped fiber (FM-EDF) serves as a crucial component of the few-mode erbium-doped fiber amplifier (FM-EDFA). Therefore, we initially optimized the active fiber structure. The optimization encompassed two aspects: the refractive index (RI) profile and the doping concentration distribution.
A triple-layered-core trench-assisted structure was selected, given its excellent loss and dispersion performance, as reported in our previous work [18]. The RI profile is illustrated in Figure 1a. This RI profile supports four mode groups in the L-Band; the distributions of the LP01, LP11, LP21, and LP02 mode groups are demonstrated in Figure 1b.
Following the RI profile illustrated in Figure 1a, the doping concentration of erbium ions was carefully optimized. As shown in Figure 1a, the core radius was 10 μm, and as shown in Figure 1b, the mode fields were mainly distributed within a radius of 10 μm. Consequently, the erbium ions were doped within this 10 μm radius region. Meanwhile, to simplify the fiber manufacturing, the doping area was divided into four distinct parts (Figure 2), with each region maintaining a constant doping concentration. The length of the EDF is another crucial parameter that influences the modal gain. Thus, the active fiber length (LEDF) was optimized with the doping profile.
In addition, to obtain a higher modal gain in the L-band, 1480 nm was selected to be the pump wavelength. A bi-directional pump scheme was selected, and the forward and backward pump powers were set to 400 mW and 450 mW, respectively. These values were determined based on the characteristics of the two pump lasers used in the actual system.
The optimization contained five parameters, which posed a challenge due to performance limitations of the PC. Searching the whole solution space was impractical. To address this challenge and reduce the optimization complexity, the particle swarm optimization (PSO) algorithm [19] was applied to optimize the fiber structure, including the length of the EDF and the four doping concentrations. The optimization platform is Matlab R2021a.
The PSO realizes optimization by maximizing or minimizing the fitness (F). To realize high modal gain and low different modal gain at the same time, the fitness is defined as follows (1):
F = G max 2 D M G ,
where Gmax and DMG are the maximum modal gain and differential modal gain (DMG) among all signal modes, respectively. By maximizing fitness, the modal gain and DMG can be optimized simultaneously. The iterative solution method for every single particle is shown in Equations (2) and (3):
x i + 1 , j = v i + 1 , j + x i , j ,
v i + 1 , j = v i , j 0.9 i 2 N I + c 1 r 1 x p , b e s t , j x i , j + c 2 r 2 x g , b e s t , j x i , j ,
where xi,j is the j-th component of the solution at generation i; vi,j is the j-th component of the particle velocity at generation i; NI is the total number of iterations; xp,best,j and xg,best,j represent the best solution of the single particle and the best solution among all the particles, respectively; constants c1 and c2 are set to 0.5; and r1 and r2 are two random numbers ranging from 0 to 1. For this optimization, the total number of iterations was set to 100, and the particle number was set to 20.
The iteration curves of Gmax and DMG are illustrated in Figure 3a; as the iteration progresses, the DMG rapidly decreases to a low level of 0.2 dB. Meanwhile, the modal gain reduces at first, and then gradually grows from 32 dB to 38 dB. Finally, the best solution is obtained: The ratio of the four doping concentrations CEr,1CEr,2CEr,3CEr,4 is 2.2:1:1.6:1.7, and the length of the active fiber is optimized to 10 m. In this case, Gmax reaches 38.9 dB, and the DMG is 0.17 dB at 1600 nm. Furthermore, the performance of the optimized FM-EDF is also evaluated across the L-band; the results are demonstrated in Figure 3b.
As shown in Figure 3b, in the wavelength range of 1570 nm to 1620 nm, the minimum modal gain is 27 dB, and the DMG remains below 0.8 dB. The results indicate the exceptional performance of the optimized FM-EDF. The optimized FM-EDF was subsequently manufactured by YOFC. Following the fabricated FM-EDF, the performance of the FM-EDF was experimentally verified to ensure its applicability and effectiveness.

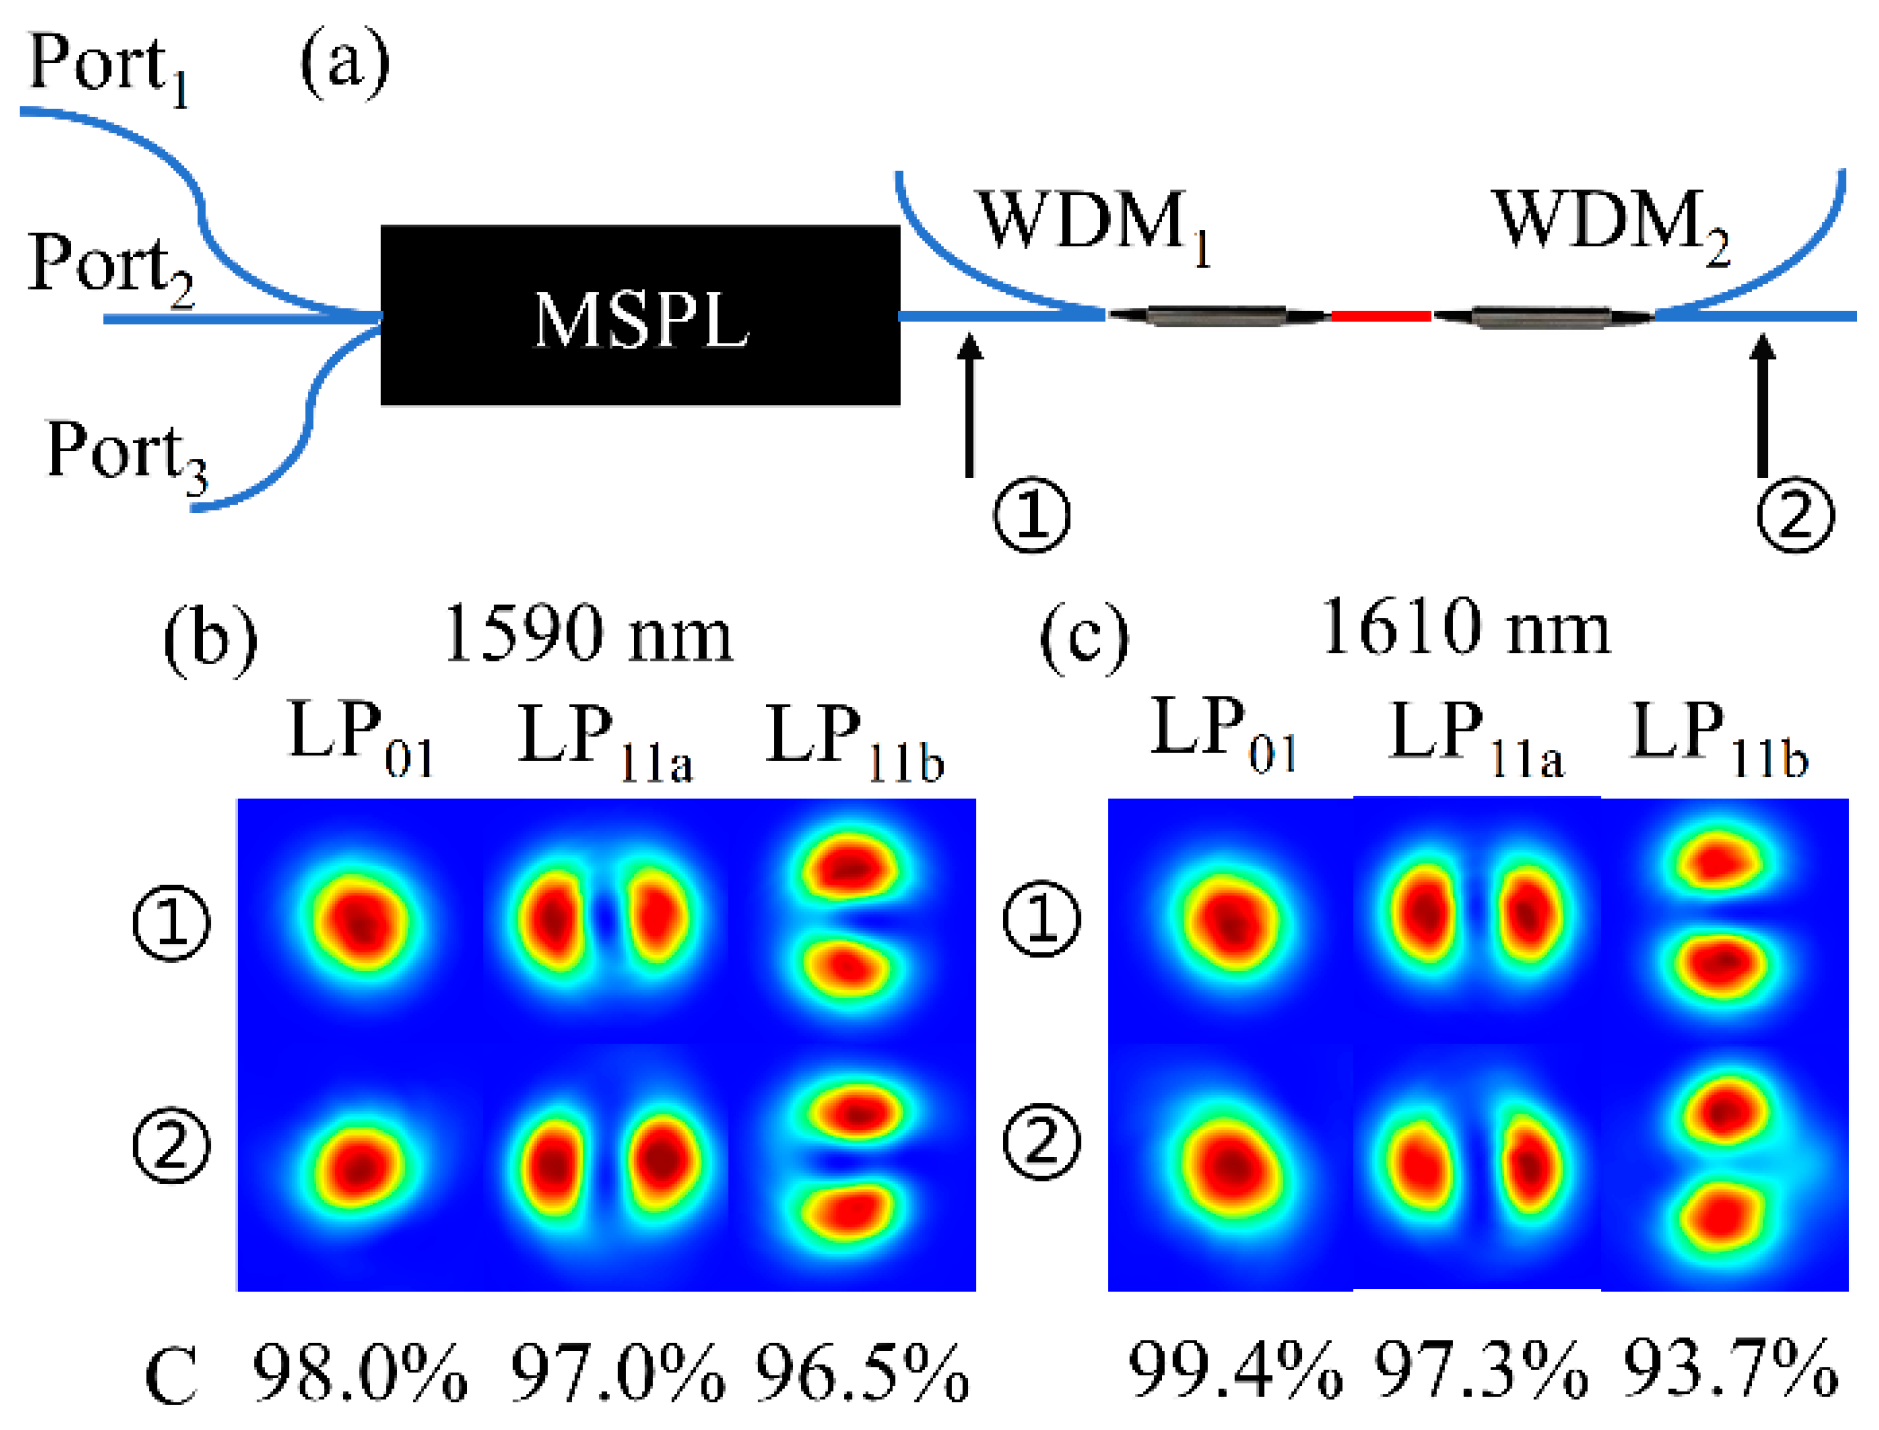
2.2. L-Band FM-EDFA Experimental Setup

An experiment was conducted to characterize the designed L-band FM-EDFA. Due to the limitation of the mode converters, only 3 signal modes (LP01, LP11a, LP11b) were tested. A schematic of the experiment is demonstrated in Figure 4. A tunable laser is used as the light source and connected with an optical switch to control the specific mode to be excited. After passing through a variable optical attenuator (VOA) for power adjustment and a polarization controller (PC) for polarization regulation, a mode-selective photonic lantern (MSPL) converts the fundamental mode to a specific mode with a low insertion loss of less than 1 dB. The signal power is −20 dBm at the output of the MSPL. Two 1480 nm semiconductor lasers are the pump sources. The first few-mode 1480/L-band wavelength division multiplexer (WDM) combines the signal and the pump, and injects them into a 10 m long FM-EDF; the second WDM splits the signal and the pump and injects the backward pump into the FM-EDF. Finally, an optical spectrum analyzer (OSA, Yokogawa AQ 6370D, Tokyo, Japan) is used to measure the optical power.
Before testing the modal gain, the ability to keep the quality of signal modes was verified: mode patterns at different positions were monitored by a charge-coupled device (CCD, Xenics, Bobcat 320 GigE). The specific test points are shown in Figure 5a, where point 1 and point 2 correspond to the common output port of the MSPL and the total output port of the designed FM-EDFA, respectively. Two typical wavelengths, 1590 nm and 1610 nm, were selected for this test. The mode patterns of these two wavelengths were captured to verify the ability to sustain the purity of the signal modes. To quantitatively measure the similarity between the input and output mode patterns, the cross-correlation factor (3) was employed, as defined in Equation (4) [20,21]:
C = I i n I i n ¯ I o u t I o u t ¯ d S I i n I i n ¯ 2 d S I o u t I o u t ¯ 2 d S ,
where C is the cross-correlation factor between input and output mode patterns, Iin is the mode intensity distribution of the input modes, I i n ¯ is the average of the mode intensity distribution, Iout is the mode intensity distribution of the output mode, and I o u t ¯ is the average of the mode intensity distribution of the output mode. The value of C ranges from 0 to 1, with values closer to 1 indicating a higher degree of similarity between two mode patterns. The C is calculated at 1590 nm and 1610 nm and the results are shown in Figure 5b and Figure 5c, respectively. This helps to assess the similarity between the input and output mode patterns at the specific wavelengths. As shown in Figure 5b,c, the cross-correlation factor C between the input and output mode patterns remains higher than 93.7%. This indicates that the designed FM-EDFA is capable of maintaining the mode purity of different mode groups.
After verifying the ability to keep the purity of signal modes, the gain characteristics were measured, including modal gain, DMG, and optical spectra. The input powers of the three signal modes were set to −20 dBm. The forward pump power was fixed at 400 mW, and the backward pump power was set to 450 mW. The transmission optical spectra of the three signal modes at the typical wavelength of 1600 nm are shown in Figure 6a–c. Additionally, the relationship between modal gain and backward pump power is shown in Figure 6d, with forward pump power held constant. The blue curves are the optical spectra of the input signal modes; the black curves are the optical spectra of the output signal modes without the pump laser; and the red curves are the optical spectra of the output signal modes with pump lasers injected. Under this pump configuration, the modal gains of the three signal modes are nearly identical: the modal gains of the LP01, LP11a, and LP11b modes are 22.10 dB, 21.56 dB, and 21.88 dB, respectively. The DMG is 0.54 dB.
As shown in Figure 6d, the backward pump power is incrementally increased from 50 mW to 450 mW in steps of 50 mW. As the backward pump power increases, the signal power is recorded, and the modal gain and the DMG are calculated accordingly. The gains of the three signal modes grow almost synchronously, demonstrating the effectiveness of the active fiber optimization. Moreover, when the backward pump power reaches 400 mW, the minimum modal gain is 20.70 dB, and the DMG is 0.36 dB.
The performance of the FM-EDFA is also evaluated at 1605 nm and 1610 nm under the same experimental conditions, except for the signal wavelength. The results are illustrated in Figure 7a and Figure 7b, respectively. Compared to 1600 nm (Figure 6d), the modal gains of the three signal modes are lower at these two wavelengths. When the backward pump power is set to 450 mW, the modal gains of LP01, LP11a, and LP11b are measured to be 20.76 dB, 20.75 dB, and 19.20 dB at the wavelength of 1605 nm, respectively. While at 1610 nm, the modal gains of LP01, LP11a, and LP11b are 17.8 dB, 18.82 dB, and 18.24 dB, with a DMG of 1.14 dB.
The modal gain and DMG were also measured in the wavelength range of 1575 nm to 1600 nm, with an interval of 5 nm. Combining these results and those presented in Figure 6 and Figure 7, the comprehensive findings are illustrated in Figure 8: in this wavelength range, the signal at lower wavelengths obtains a higher modal gain. However, the DMG tends to be relatively higher at these lower wavelengths. Specifically, the maximum modal gain reaches 22.22 dB, and the DMGs are below 2.28 dB. Meanwhile, the gain flatness factor is introduced to quantify the gain flatness performance in a wavelength range:
G f = max G a i n λ , M N min G a i n λ , M N
In Equation (5), λ represents the signal wavelength, MN represents the signal mode, and Gf is the gain flatness factor. The gain flatness factor in the wavelength range of 1575 nm to 1610 nm is 4.54 dB. This result demonstrates the good performance of the L-Band FM-EDFA. Consequently, the quality of a DSP-free transmission system applied with the designed FM-EDFA is verified in the following section.

3. Transmission Investigation and Discussion

3.1. L-Band Transmission Investigation Setup

An experimental investigation was conducted on the few-mode transmission system applied with the designed FM-EDFA. The scheme of the transmission system is shown in Figure 9. A tunable laser is selected as the source. The continuous wave (CW) laser output is first adjusted in power using a variable optical attenuator (VOA) and then regulated in polarization via a polarization controller (PC). Subsequently, the laser is modulated through a Mach–Zehnder modulator (MZM, Fujitsu, 12.5 GHz bandwidth, Kanagawa, Japan) driven by the output signal from a pulse pattern generator (PPG, Anritsu, MP1763, Atsugi, Japan). A pseudo-random bit sequence (PRBS) with a type of 2^7-1 and a bit rate of 9.953 Gbps is selected as the data stream. The first MSPL converts the fundamental mode to the specific mode with low insertion losses. The modulated signal then transmits through a 5 km long passive transmission fiber. The RI profile and the fiber profile under the microscope are shown in Figure 10. The transmission fiber has the same RI profile as the MSPL, ensuring minimal mode degradation at the connection between the MSPL and transmission fiber. The signal enters the designed FM-EDFA with an input power of −20 dBm. The output port of the FM-EDFA is connected to the second MSPL, which converts the signal mode to fundamental mode and directs the signal to the specific port. Then, the signal passes through an optical band-pass filter consisting of an optical circulator (OC) and a fiber grating to suppress the amplified spontaneous emission (ASE). The transmission distance is relatively short (5 km); thus, the dispersion effect is not pronounced. The optical signal is detected by a photodetector (PD, Thorlabs, 20 GHz bandwidth, Newton, NJ, USA). The resulting voltage signal is amplified by an electric amplifier (EA, Anritsu, 10 GHz bandwidth) and improved by a clock and data recovery (CDR, OC-192). Meanwhile, the CDR extracts a clock from the signal stream and provides it for the error detector (ED, Anritsu, MP1764C). Finally, the signal and the recovered clock are fed to the ED to calculate and display the bit error rate (BER).

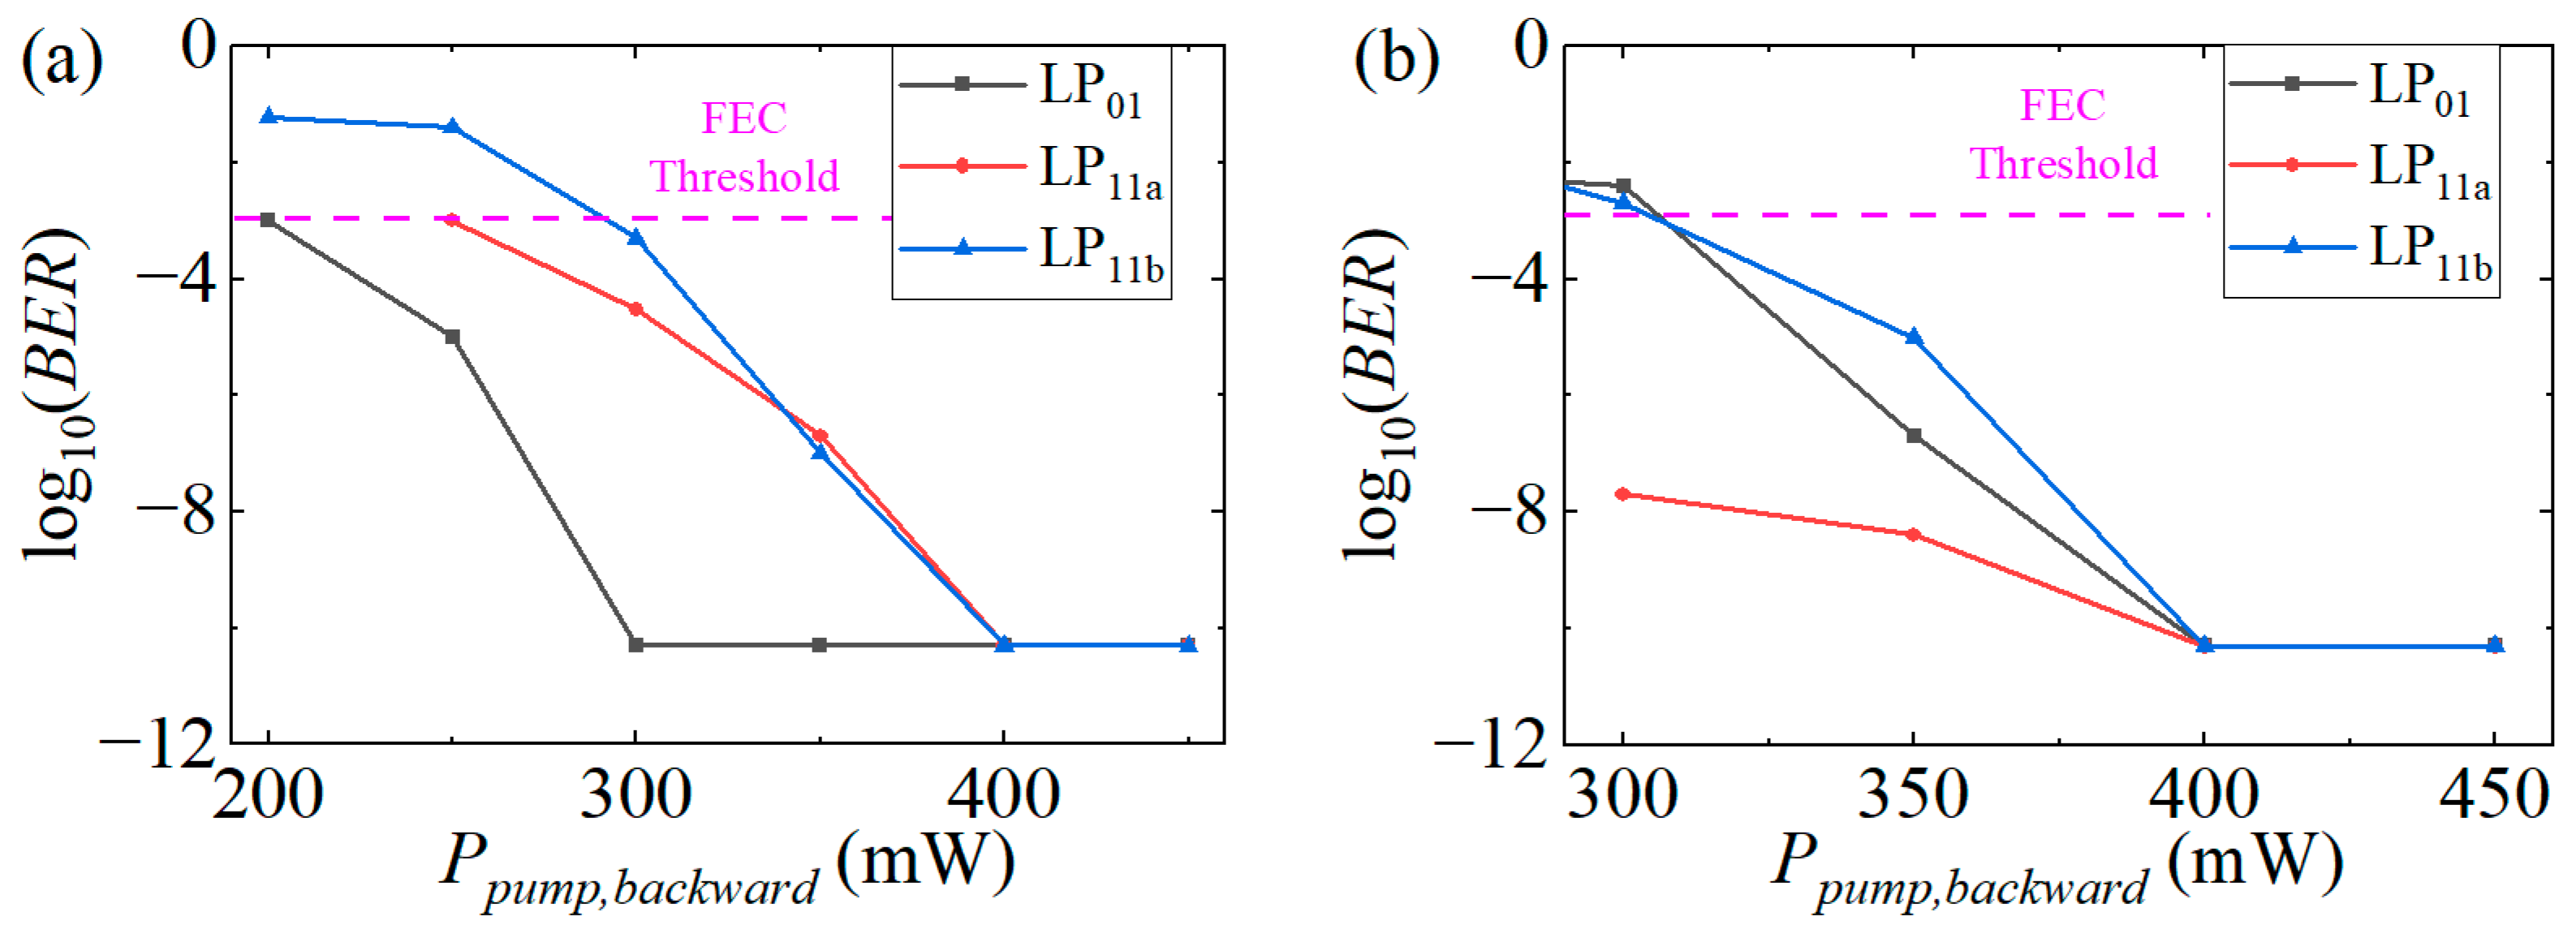
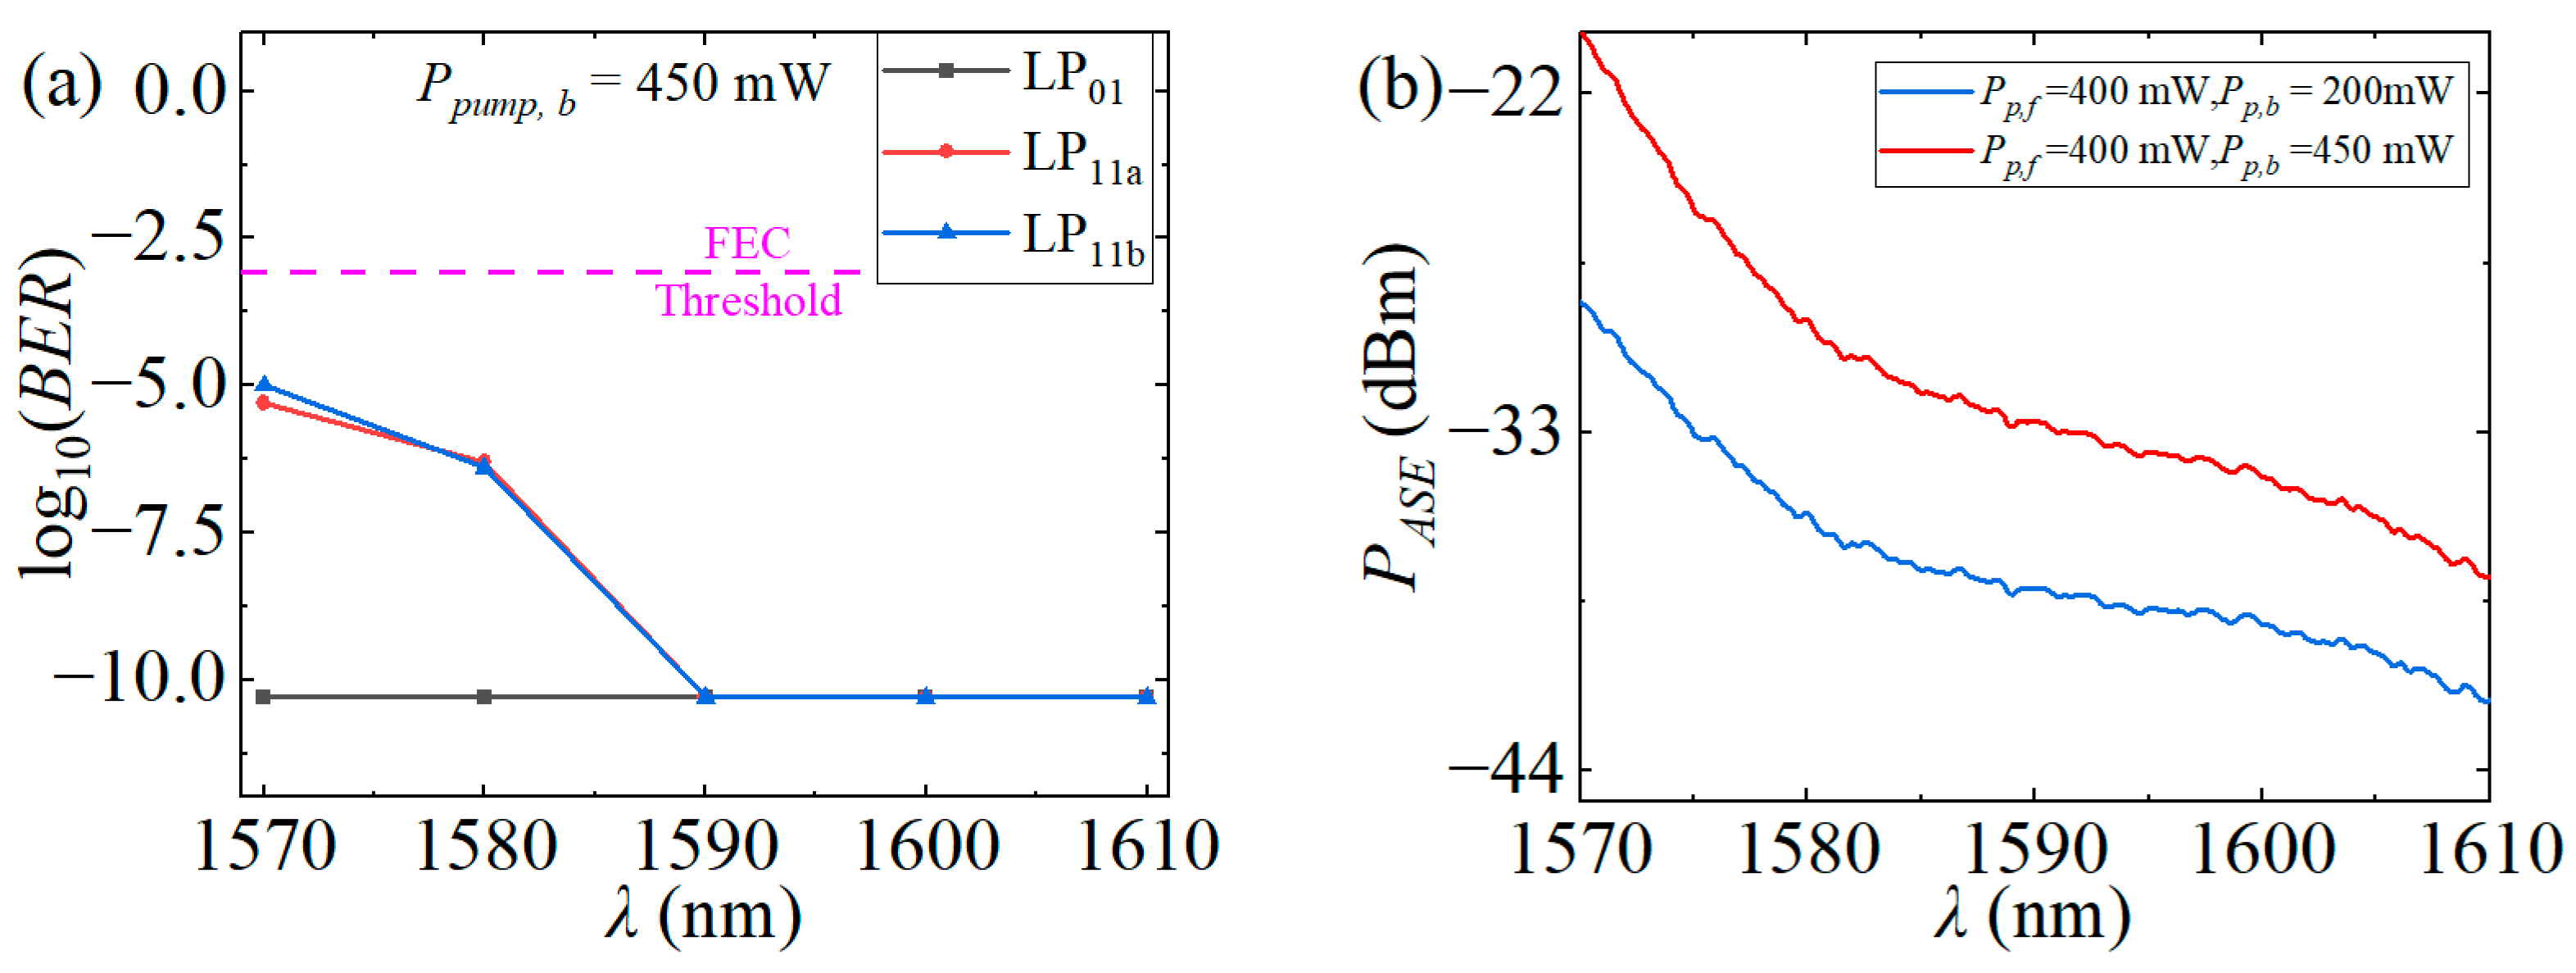
3.2. L-Band Transmission Results

Based on the demonstrated transmission system shown in Figure 9, the transmission performance was first evaluated at 1600 nm and 1610 nm. The input signal power was set to −20 dBm, while the forward pump power was fixed at 400 mW. The backward pump power increased from 200 mW to 450 mW with an interval of 50 mW. The relationship between the BER and backward pump power was measured with a digital signal processing (DSP) free receiver, as shown in Figure 9. The results are demonstrated in Figure 11.
As shown in Figure 11a, at the signal wavelength of 1600 nm, as backward pump power rises, the signal power of all mode channels grows synchronously, while the BER reduces correspondingly. At the backward pump power of 200 mW, only the BER of the LP01 mode channel falls below the FEC threshold [22,23]. As the backward pump power approaches 300 mW, the BERs of all three signal mode channels drop below the FEC threshold, with the BER of the LP01 mode channel even falling below 1 × 10⁻¹⁰. When the backward pump power reaches 400 mW, the BERs of all three mode channels are less than 1 × 10⁻¹⁰.
As shown in Figure 11b, at the signal wavelength of 1610 nm, the modal gain is relatively low compared to that at 1600 nm (see Figure 8). Consequently, when the backward pump power reaches 350 mW, the BERs of all three signal mode channels fall below the FEC threshold. Referring to Figure 7b, LP11a can obtain the highest modal gain at 1610 nm. Therefore, within the backward power range of 300 mW to 400 mW, the LP11 mode channel outperforms the other two mode channels. When the backward pump power reaches 400 mW, the BERs of three mode channels are below 1 × 10⁻¹⁰.
The BERs were also tested at 1570 nm, 1580 nm, and 1590 nm with the same measurement method. The forward pump and backward pump powers were set to 400 mW and 450 mW, respectively. The relationship between BERs and signal wavelength is illustrated in Figure 12a. Additionally, the ASE spectra within this wavelength range were measured and are shown in Figure 12b.
As shown in Figure 12a, the BERs of the LP01 signal channels among all the wavelengths are consistently below 1 × 10⁻¹⁰. In contrast, due to the similarity of LP11a and LP11b, the BERs of the LP11a and LP11b mode channels among different wavelengths exhibit a similar trend of variation: As the signal wavelength grows from 1570 nm to 1590 nm, the BERs of both the LP11a and LP11b mode channels continuously decrease; in the wavelength range of 1590 nm to 1610 nm, the BERs of these two mode channels remain below 1 × 10⁻¹⁰.
The DSP-free receiver indicates that the BERs directly reflect the performance of the FM-EDFA. The variation in the BER is analyzed as follows: The wavelength range of 1570 nm to 1610 nm is divided into two sub-ranges at 1590 nm. In the wavelength range of 1570 nm to 1590 nm, the modal gains of the three signal modes are relatively high. However, as the wavelength decreases, the DMG (see Figure 8) and the ASE power (see Figure 12b) increase, which leads to a degradation in the signal quality. Consequently, the BERs of the LP11 mode group rise as the wavelength decreases. Meanwhile, as the wavelength increases from 1590 nm to 1610 nm, although the modal gains reduce, the ASE power drops rapidly, and the DMGs remain well controlled. As a result, the BERs among all channels remain below 1 × 10⁻¹⁰. This indicates the good performance of the L-band EDFA.

4. Conclusions

The combination of mode division multiplexing technology and the L-band is a promising way to improve transmission capacity at a low cost. Due to the high output power difference among signal modes from the conventional L-band EDFA, it needs to be redesigned urgently. We optimized the FM-EDF with the particle swarm optimization algorithm and manufactured the optimized fiber. Then, the performance of the EDF was verified with experiments. The modal gain and DMG indicate good performance of the designed FM-EDFA: In the wavelength range between 1575 nm and 1610 nm (i) the maximum modal gain is 22.22 dB, and (ii) the maximum DMG is less than 2.28 dB. The FM-EDFA was also tested in a DSP-free transmission system. (iii) When the backward pump power reaches 450 mW, the BER among all mode channels in the wavelength range between 1570 nm and 1610 nm is below 1 × 10⁻⁵.

Author Contributions

Conceptualization, L.P.; methodology, K.H.; software, W.X.; validation, L.Z. (Long Zhang); resources, L.Z. (Li Zhong); writing—original draft preparation, K.H.; writing—review and editing, Z.H.; visualization, J.L.; funding acquisition, J.W. All authors have read and agreed to the published version of the manuscript.

Funding

This research was funded by the Fundamental Research Funds for the Central Universities, grant number 2024JBMC032.

Institutional Review Board Statement

Not applicable.

Informed Consent Statement

Not applicable.

Data Availability Statement

Research data presented in this study are available on request from the corresponding author.

Conflicts of Interest

Author Li Zhong was employed by the company Yangtze Optical Fibre and Cable Joint Stock Limited Company (YOFC). The remaining authors declare that the research was conducted in the absence of any commercial or financial relationships that could be construed as a potential conflict of interest.

References

  1. Richardson, D.J.; Fini, J.M.; Nelson, L.E. Space-division multiplexing in optical fibres. Nat. Photonics 2013, 7, 354–362. [Google Scholar] [CrossRef]
  2. Downie, J.D. Maximum capacities in submarine cables with fixed power constraints for C-band, C+ L-band, and multicore fiber systems. J. Light. Technol. 2018, 36, 4025–4032. [Google Scholar] [CrossRef]
  3. Jalilpiran, S.; Lefebvre, J.; Grégoire, N. Improving Extended L-Band Fiber Amplifiers Using Er3+: Y3+ Co-Doped Silicate with Optimized Alumino-Phospho-Silicate Glass Matrix. J. Light. Technol. 2024, 42, 3835–3843. [Google Scholar] [CrossRef]
  4. Lao, H.; Ruan, J.; Lin, M.; Zhong, L.; Wang, S.; Xu, P.; Dong, X. Dual-Stage Double-Pass Extended L-Band Erbium-Doped Fiber Amplifier with Improved Gain Performance. Photonics 2024, 10, 1266. [Google Scholar] [CrossRef]
  5. Sun, Y.; Wang, X.; Yang, Q.; Wang, Y.; Wang, F.; Hu, L.; Yu, C.; Liao, M.; Chen, S. Er-doped silicate fiber amplifiers in the L-band with flat gain. Opt. Lett. 2024, 49, 989–992. [Google Scholar] [CrossRef] [PubMed]
  6. Cai, J.-X.; Sun, Y.; Zhang, H.; Batshon, H.G.; Mazurczyk, M.V.; Sinkin, O.V.; Foursa, D.G.; Pilipetskii, A. 49.3 Tb/s transmission over 9100 km using C+ L EDFA and 54 Tb/s transmission over 9150 km using hybrid-Raman EDFA. J. Light. Technol. 2015, 33, 2724–2734. [Google Scholar] [CrossRef]
  7. Feng, L.; Zhang, A.; Feng, Z.; Ling, H.; Luo, Y.; Zhang, L.; Zhang, L.; Shen, L.; Luo, J.; Liu, Y.; et al. 0.62 Pb/s Real-Time Transmission Over 360 km 7-Core MCFs Using 800 Gb/s Transceivers with Widened C+ L Band EDFAs. In Proceedings of the 2023 Asia Communications and Photonics Conference/2023 International Photonics and Optoelectronics Meetings (ACP/POEM), Wuhan, China, 4–7 November 2023; pp. 1–3. [Google Scholar]
  8. Tang, Y.; Shi, Y.; Hu, Y.; Shen, S.; Tang, X.; Li, Z.; Lv, W.; Zhang, Z. A Field Trial of 400G C+ L Transmission System with Fast Automatic Power Management. In Proceedings of the 2023 Asia Communications and Photonics Conference/2023 International Photonics and Optoelectronics Meetings (ACP/POEM), Wuhan, China, 4–7 November 2023; pp. 1–4. [Google Scholar]
  9. Li, G.; Bai, N.; Zhao, N.; Xia, C. Space-division multiplexing: The next frontier in optical communication. Adv. Opt. Photonics 2014, 6, 413–487. [Google Scholar] [CrossRef]
  10. Richardson, D. New optical fibres for high-capacity optical communications. Philosophical Transactions of the Royal Society A: Mathematical. Phys. Eng. Sci. 2016, 374, 20140441. [Google Scholar]
  11. Wada, M.; Sakamoto, T.; Aozasa, S.; Yamamoto, T.; Nakajima, K. L-band randomly-coupled 12 core erbium doped fiber amplifier. In Proceedings of the Optical Fiber Communication Conference (OFC), San Diego, CA, USA, 3–7 March 2019; p. Th1B. 5. [Google Scholar]
  12. Wakayama, Y.; Soma, D.; Beppu, S.; Sumita, S.; Igarashi, K.; Tsuritani, T. 266.1-Tbit/s transmission over 90.4-km 6-mode fiber with inline dual C+ L-band 6-mode EDFA. J. Light. Technol. 2018, 37, 404–410. [Google Scholar] [CrossRef]
  13. Wada, M.; Sakamoto, T.; Aozasa, S.; Mori, T.; Yamamoto, T.; Hanzawa, N.; Yamamoto, F. L-band 2-LP mode EDFA with low modal dependent gain. In Proceedings of the Optical Fiber Communication Conference (OFC), Los Angeles, CA, USA, 22–26 March 2015; p. Tu3C. 3. [Google Scholar]
  14. Qiu, Q.; Gu, Z.M.; Shi, C.J.; Chen, Y.; Lou, Y.; He, L.; Peng, J.G.; Li, H.Q.; Xing, Y.B.; Chu, Y.G.; et al. Six-mode extended L-band EDFA with a low differential modal gain. OSA Contin. 2021, 4, 1676–1687. [Google Scholar] [CrossRef]
  15. Qiu, Q.; Gu, Z.; He, L.; Liu, S.; Zhao, X.; Yin, X.; Li, W.; Xing, Y.; Chu, Y.; Dai, N.; et al. Powerful trade-off between DMG and gain characteristics in the l-band high-numerical aperture few-mode erbium-doped fiber amplifier. Opt. Laser Technol. 2023, 158, 108856. [Google Scholar] [CrossRef]
  16. Qiu, Q.; He, L.; Gu, Z.; Chen, Y.; Lou, Y.; Zhao, X.; Peng, J.; Li, H.; Xing, Y.; Chu, Y.; et al. Extended L-band few-mode Er/Yb Co-doped fiber amplifier with a cladding-pumped pseudo-two-stage configuration. Opt. Lett. 2022, 47, 2963–2966. [Google Scholar] [CrossRef] [PubMed]
  17. Wang, J.; Pei, L.; Hu, K.; Zheng, J.; Xu, W.; Li, J.; Ning, T.; Zhong, L. An Extended L-Band Gain Equalization with a Few Mode Erbium Doped Fiber. In Proceedings of the 2023 Asia Communications and Photonics Conference/2023 International Photonics and Optoelectronics Meetings (ACP/POEM), Wuhan, China, 4–7 November 2023; pp. 1–3. [Google Scholar]
  18. Li, Z.; Pei, L.; Zheng, J.; Wang, J.; Xu, W.; Shen, L.; Zhong, L. Amplification and Transmission System with Matching Multi-Layer Ion-Doped FM-EDFA. J. Light. Technol. 2023, 41, 695–701. [Google Scholar] [CrossRef]
  19. Chang, J.H.; Corsi, A.; Rusch, L.A.; LaRochelle, S. Design Analysis of OAM Fibers Using Particle Swarm Optimization Algorithm. J. Light. Technol. 2020, 38, 846–856. [Google Scholar] [CrossRef]
  20. Tian, Z.; Pei, L.; Wang, J.; Hu, K.; Xu, W.; Zheng, J.; Li, J.; Ning, T. High-performance mode decomposition using physics- and data-driven deep learning. Opt. Express 2022, 30, 39932–39945. [Google Scholar] [CrossRef] [PubMed]
  21. Xu, L.; Pei, L.; Wang, J.; Bai, B.; Li, J.; Hu, K.; Gao, H. Synthetic photonic lantern characterization and power regulation with intensity superposition mode decomposition. Opt. Express 2024, 32, 22663–22674. [Google Scholar] [CrossRef] [PubMed]
  22. Wang, Y.; Tao, L.; Huang, X.; Shi, J.; Chi, N. 8-Gb/s RGBY LED-based WDM VLC system employing high-order CAP modulation and hybrid post equalizer. IEEE Photonics J. 2015, 7, 1–7. [Google Scholar]
  23. Yin, X.; Verbist, J.; De Keulenaer, T.; Moeneclaey, B.; Verbrugghe, J.; Qiu, X.-Z.; Bauwelinck, J. 25Gb/s 3-level burst-mode receiver for high serial rate TDM-PONs. In Proceedings of the Optical Fiber Communication Conference (OFC), Los Angeles, CA, USA, 22–26 March 2015; p. Th4H. 2. [Google Scholar]
Figure 1. (a) The refractive index (RI) profile. (b) The mode distributions of the four mode groups (1600 nm).
Photonics 12 00480 g001
Figure 2. Schematic of the different doping regions and doping concentrations.
Photonics 12 00480 g002
Figure 3. (a) The iteration curves of Gmax and DMG. (b) The EDF’s performance in the L-band.
Photonics 12 00480 g003
Figure 4. Schematic of the experimental setup of the designed L-Band FM-EDFA (VOA: variable optical attenuator, PC: polarization controller, MSPL: mode selective photonic lantern, FM-WDM: few-mode wavelength division multiplexer, OSA: optical spectrum analyzer).
Photonics 12 00480 g004
Figure 5. (a) Schematic of the mode pattern’s captured points. The mode patterns at different positions (① and ②) and cross-correlation factors (C) at (b) 1590 nm and (c) 1610 nm.
Photonics 12 00480 g005
Figure 6. The spectra of three signal modes in different conditions (1600 nm): (a) LP01, (b) LP11a, (c) LP11b. (d) Modal gain and DMG with the backward pump power.
Photonics 12 00480 g006aPhotonics 12 00480 g006b
Figure 7. Modal gain and DMG with the backward pump power at (a) 1605 nm and (b) 1610 nm.
Photonics 12 00480 g007
Figure 8. Modal gain and DMG with wavelength (experiment).
Photonics 12 00480 g008
Figure 9. Schematic of the transmission verification system. (VOA: variable optical attenuator, PC: polarization controller, MZM: Mach–Zehnder modulator, MSPL: mode selective photonic lantern, FM-WDM: few-mode wavelength division multiplexer, OC: optical circulator, PD: photodetector, EA: electric amplifier, CDR: clock and data recovery, BERT: bit error rate tester, PPG: pulse pattern generator, ED: error detector).
Photonics 12 00480 g009
Figure 10. The RI profile and the fiber profile of the transmission fiber under a microscope.
Photonics 12 00480 g010
Figure 11. The relationship between BER and the backward pump power: (a) 1600 nm; (b) 1610 nm.
Photonics 12 00480 g011
Figure 12. (a) The BER of three signal mode channels in the wavelength range of 1570 nm to 1610 nm; (b) ASE spectrum.
Photonics 12 00480 g012
Disclaimer/Publisher’s Note: The statements, opinions and data contained in all publications are solely those of the individual author(s) and contributor(s) and not of MDPI and/or the editor(s). MDPI and/or the editor(s) disclaim responsibility for any injury to people or property resulting from any ideas, methods, instructions or products referred to in the content.

