Article

Analysis and Optimization of Two-Dimensional Photonic Crystal Microcavity Structures for Gas Sensing

1
College of Physics Science, Qingdao University, Qingdao 266071, China
2
School of Instrumentation and Optoelectronic Engineering, Beihang University, Beijing 100191, China
3
School of Space and Environment, Beihang University, Beijing 100191, China
4
Beijing Advanced Innovation Center for Biomedical Engineering, Beihang University, Beijing 100191, China
*
Authors to whom correspondence should be addressed.
These authors contributed equally to this work.
Photonics 2025, 12(9), 875; https://doi.org/10.3390/photonics12090875
Submission received: 5 July 2025 / Revised: 7 August 2025 / Accepted: 26 August 2025 / Published: 29 August 2025
(This article belongs to the Special Issue Emerging Trends in Photonic Crystals)

Abstract

The monitoring of gases and vapors using portable instruments is critical in a variety of fields, such as industrial and household safety, environmental monitoring, process control, and national security, owing to gas pollution. In this study, we design a portable and simple two-dimensional photonic crystal microcavity sensor for detecting gases such as ammonia, methane, carbon monoxide, acetylene, ethylene, and ethane. The basic structure of the sensor consists of silicon rods arranged in a square lattice pattern in air. Waveguide input and output channels are realized by engineering line defects within the lattice structure. Moreover, the sensor’s performance is continuously optimized by adding point defects, introducing a ring cavity, and varying the radius of the dielectric rods in the microcavity. Using the transmission spectrum obtained from the output waveguide, the performance parameters of the gas sensor are calculated. Based on the simulation analysis, the optimized gas sensor exhibits excellent performance, achieving a sensitivity S of 932.43 nm/RIU and a quality factor Q of 2421.719.

1. Introduction

The issue of gas pollution has attracted significant attention in recent years, and the monitoring of gaseous chemical substances (e.g., gases and vapors) using portable instruments remains critical in various fields, such as industrial and household safety, environmental monitoring, process control, and national security [1,2,3]. To meet diverse detection needs, numerous complementary techniques have been developed, including gas chromatography, direct spectroscopy, ion mobility spectrometry, mass spectrometry, and chemical sensors. Among them, sensors developed by employing responsive sensing materials to appropriate physical transducers for monitoring “gases” (any gaseous chemical substance) [4] typically demonstrate several operational advantages compared to other portable instruments. These advantages include adjustable sensitivity, continuous real-time measurement of specific sample component concentrations, low power consumption, ease of operation, and compact size.
However, current existing sensors have many limitations, such as high cross-sensitivity and poor selectivity for multiple gases, inability to maintain detection accuracy in the presence of unknown interferences, and sensor drift—especially in outdoor applications and when detecting low-concentration analytes [5,6]. These drawbacks often offset the practical benefits of sensors. Consequently, gas sensors achieve the greatest success in field applications when poor selectivity is acceptable, the gas concentration is high enough to render drift negligible, or frequent recalibration is feasible.
Photonics devices are gaining increasing research attention. Photonic crystals (PhCs), as a novel class of optical microstructured materials, were first independently proposed by John [7] and Yablonovitch [8]. Owing to their capability to manipulate the propagation of photons, PhCs are widely applied in photonics devices [9,10,11]. The two major characteristics of PhCs are the photonic bandgap (PBG) [12] and photon localization [13]. The PBG restricts the propagation of light under certain conditions, altering its behavior. Photon localization occurs at defects within PhCs; when the periodic structure of a perfect photonic crystal (PhC) is disrupted, photons localize at defect sites, reducing the speed of light propagation and enhancing interactions between light and surrounding matter. Leveraging these two features, PhC sensors have rapidly evolved and found applications in various domains.
Common PhC sensors include PhC temperature sensors [14,15,16], pressure sensors [17,18,19], and biochemical sensors [20,21,22]. Among these various sensors, PhC waveguides [23,24,25], microcavities [26,27,28], and ring structures [19,29,30] are often employed as key sensing components. Among them, PhC microcavities have become the ideal choice for designing high-performance optical sensors due to their small size, ease of integration, flexible design, and strong localization.
Research on PhC microcavity sensors began as early as 1999 when Painter and coworkers [31] introduced point defects into PhCs, forming point-defect microcavities with strong photon localization. Akahane et al. [32] proposed the L3 microcavity design by removing three air holes in a two-dimensional (2-D) perfect PhC structure, achieving a high-quality factor of 45,000. The Dorfner group [33] introduced a refractive index sensor utilizing PhC microcavities, and the results showed that the highest sensitivity was 155 nm/RIU. Li and colleagues [34] developed a biochemical sensor featuring a ring cavity coupled with a line defect waveguide, achieving a quality factor Q of 107 and a sensitivity of 330 nm/RIU. Cai and coworkers [5,6] developed three-dimensional (3-D) PhC sensors for detecting volatile organic compounds with high sensitivity, such as xylene and alcohol.
In this study, a 2-D PhC microcavity sensor for gas detection was designed and optimized by introducing point defects, line defects, and a ring cavity. The transmission spectra obtained from the output waveguide can identify the target gas. The final optimized gas sensor not only exhibits excellent performance but is also cost-effective and easy to fabricate for practical applications.

2. Research Methods and Structural Design

2.1. Research Methods

Originally introduced by Yee [35] in 1966, the finite-difference time-domain (FDTD) method has become a widely adopted numerical approach for solving Maxwell’s equations [36,37]. Essentially, this method discretizes Maxwell’s equations in both time and space, transforming them into difference equations for numerical solutions using specialized software. The FDTD method [38,39] has broad applications because of its capability to effectively handle material dispersion and nonlinearity, and it is not constrained by optical effects such as propagation direction, refractive index contrast, or retroreflection. Furthermore, with the aid of Fourier transformation, the FDTD method enables broadband spectral analysis from a single simulation, facilitating the analysis of the optical transmission properties of PhC structures based on the simulation results.
In this study, the Fullwave module of the Rsoft software (Version 2018.12) was used for simulation and optimization. The optical characteristics of the PhC sensor structure were analyzed using the FDTD method, and its performance parameters were ultimately calculated.

2.2. Structural Design of PhC Sensors

The core structure of the PhC sensor consists of cylindrical silicon dielectric rods periodically arranged in air, forming a 2-D PhC with a square lattice. The substrate material is air (n0 = 1.00), while the dielectric material is silicon (n1 = 3.42). The basic structure is illustrated in Figure 1a. The parameters for the 2-D PhC structure are set as follows: 27 and 21 dielectric rods are placed along the X and Z directions, respectively; the lattice constant a = 0.46 μm, and the silicon rod radius r = 0.1 μm.

2.2.1. Simulation and Analysis of Photonic Crystal Bandgap Using Rsoft

The BandSOLVE module in the Rsoft software was used to simulate and analyze the bandgap of the perfect 2-D PhC structure, as shown in Figure 1a, under both transverse electric (TE) and transverse magnetic (TM) polarizations. The corresponding simulation results are depicted in Figure 1b. The results show that under the TE mode, two bandgaps exist. The wider bandgap ranges from 0.27223 to 0.39749, corresponding to a wavelength range of 1157.3~1689.7 nm, while the narrower bandgap ranges from 0.52744 to 0.54861, corresponding to a wavelength range of 838.48~872.14 nm. In contrast, no bandgap is observed under the TM mode. This difference arises from the distinct field confinement characteristics of the two modes: in the TE mode, the polarization displacement field is predominantly confined within the high-refractive-index regions, promoting strong photon localization. In the TM mode, however, the field extends significantly into the low-refractive-index air regions, weakening confinement and inhibiting bandgap formation. Consequently, cylindrical two-dimensional photonic crystals are more likely to support wide bandgaps in the TE mode.

2.2.2. Introduction of Line and Point Defects for Photonic Crystal Microcavity

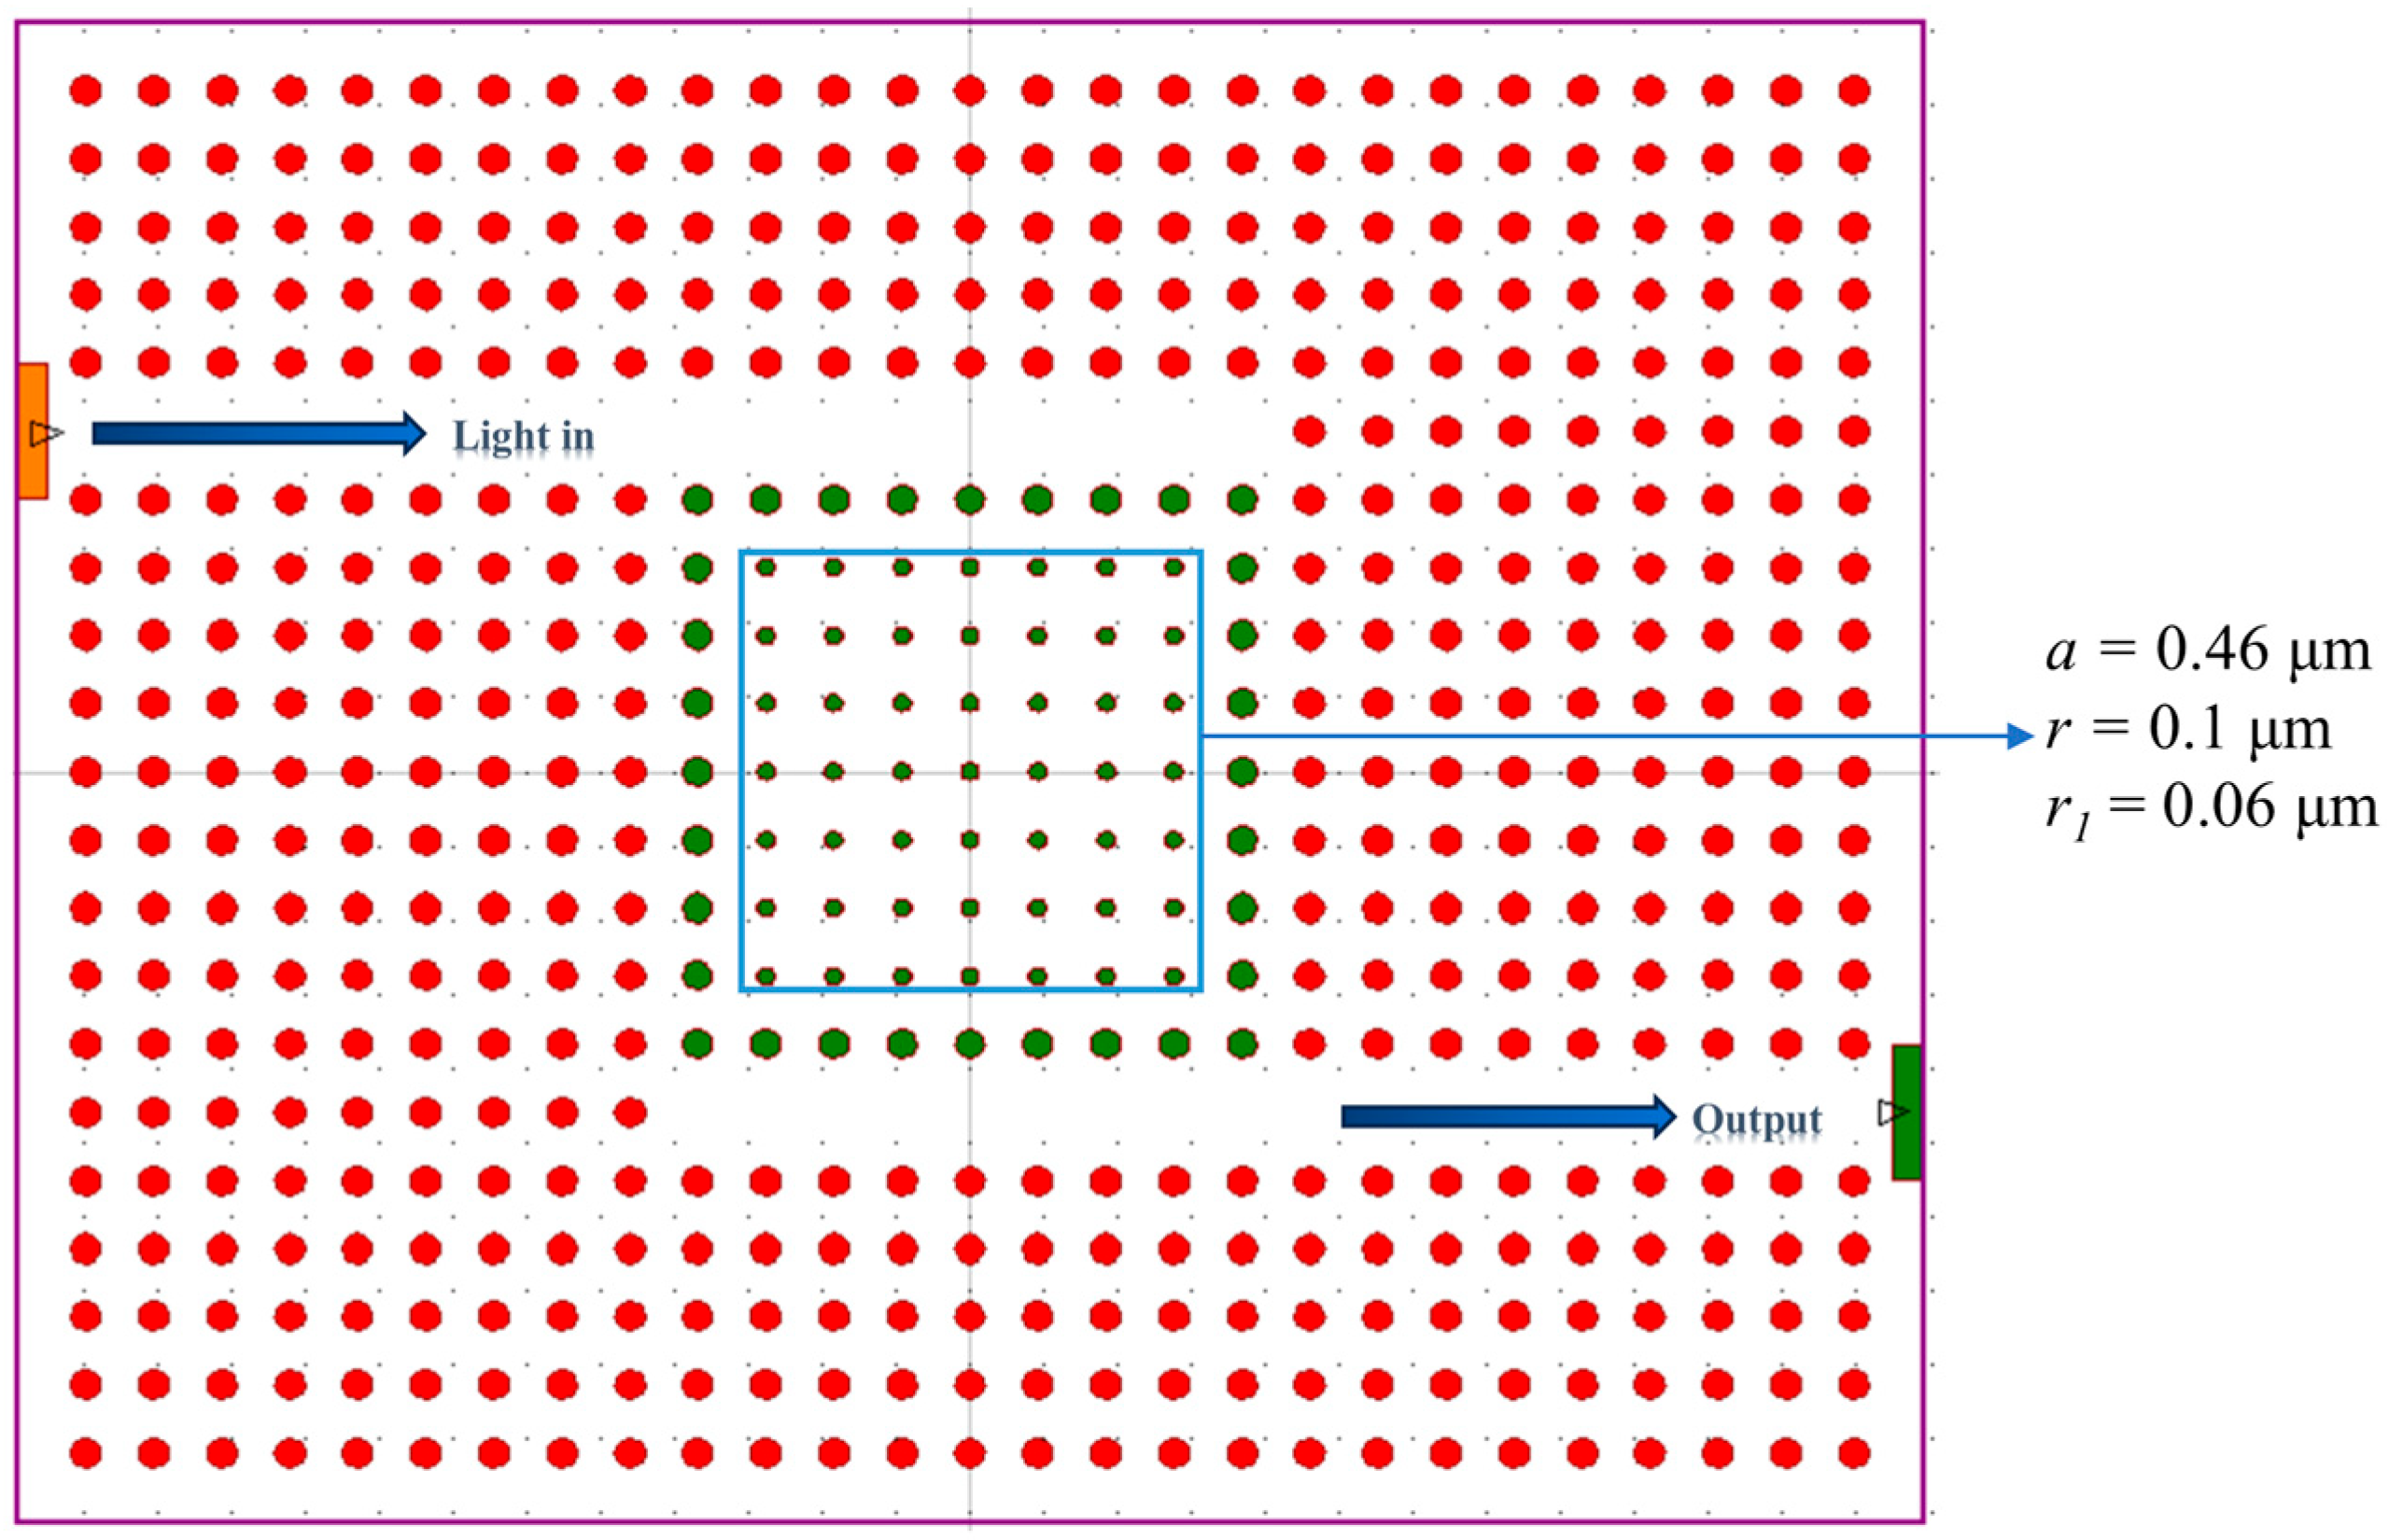
To create an optical waveguide, line defects were introduced into the perfect 2-D PhC structure shown in Figure 1 by removing silicon dielectric rods. This formed input and output waveguide structures through which electromagnetic waves propagate along the waveguide. Additionally, point defects were introduced by altering the radius of the silicon rods in the central region, setting the radius to r1 = 0.06 μm, thereby forming the PhC microcavity structure, as illustrated in Figure 2.
Light enters the sensor system from the input port, passes through the PhC microcavity, and exits at the output port, where the transmission spectrum is obtained. When gas is introduced as the background medium, it alters the overall refractive index of the surrounding environment. This change leads to a shift in the resonance peaks of the transmission spectrum, thereby enabling the sensor to detect variations in the analyte composition or concentration. By analyzing the transmission spectrum at the output, the performance parameters of the 2-D PhC microcavity gas sensor can be determined.

3. Results and Discussion

3.1. Properties of NH3, CH4, CO, C2H2, C2H4, and C2H6

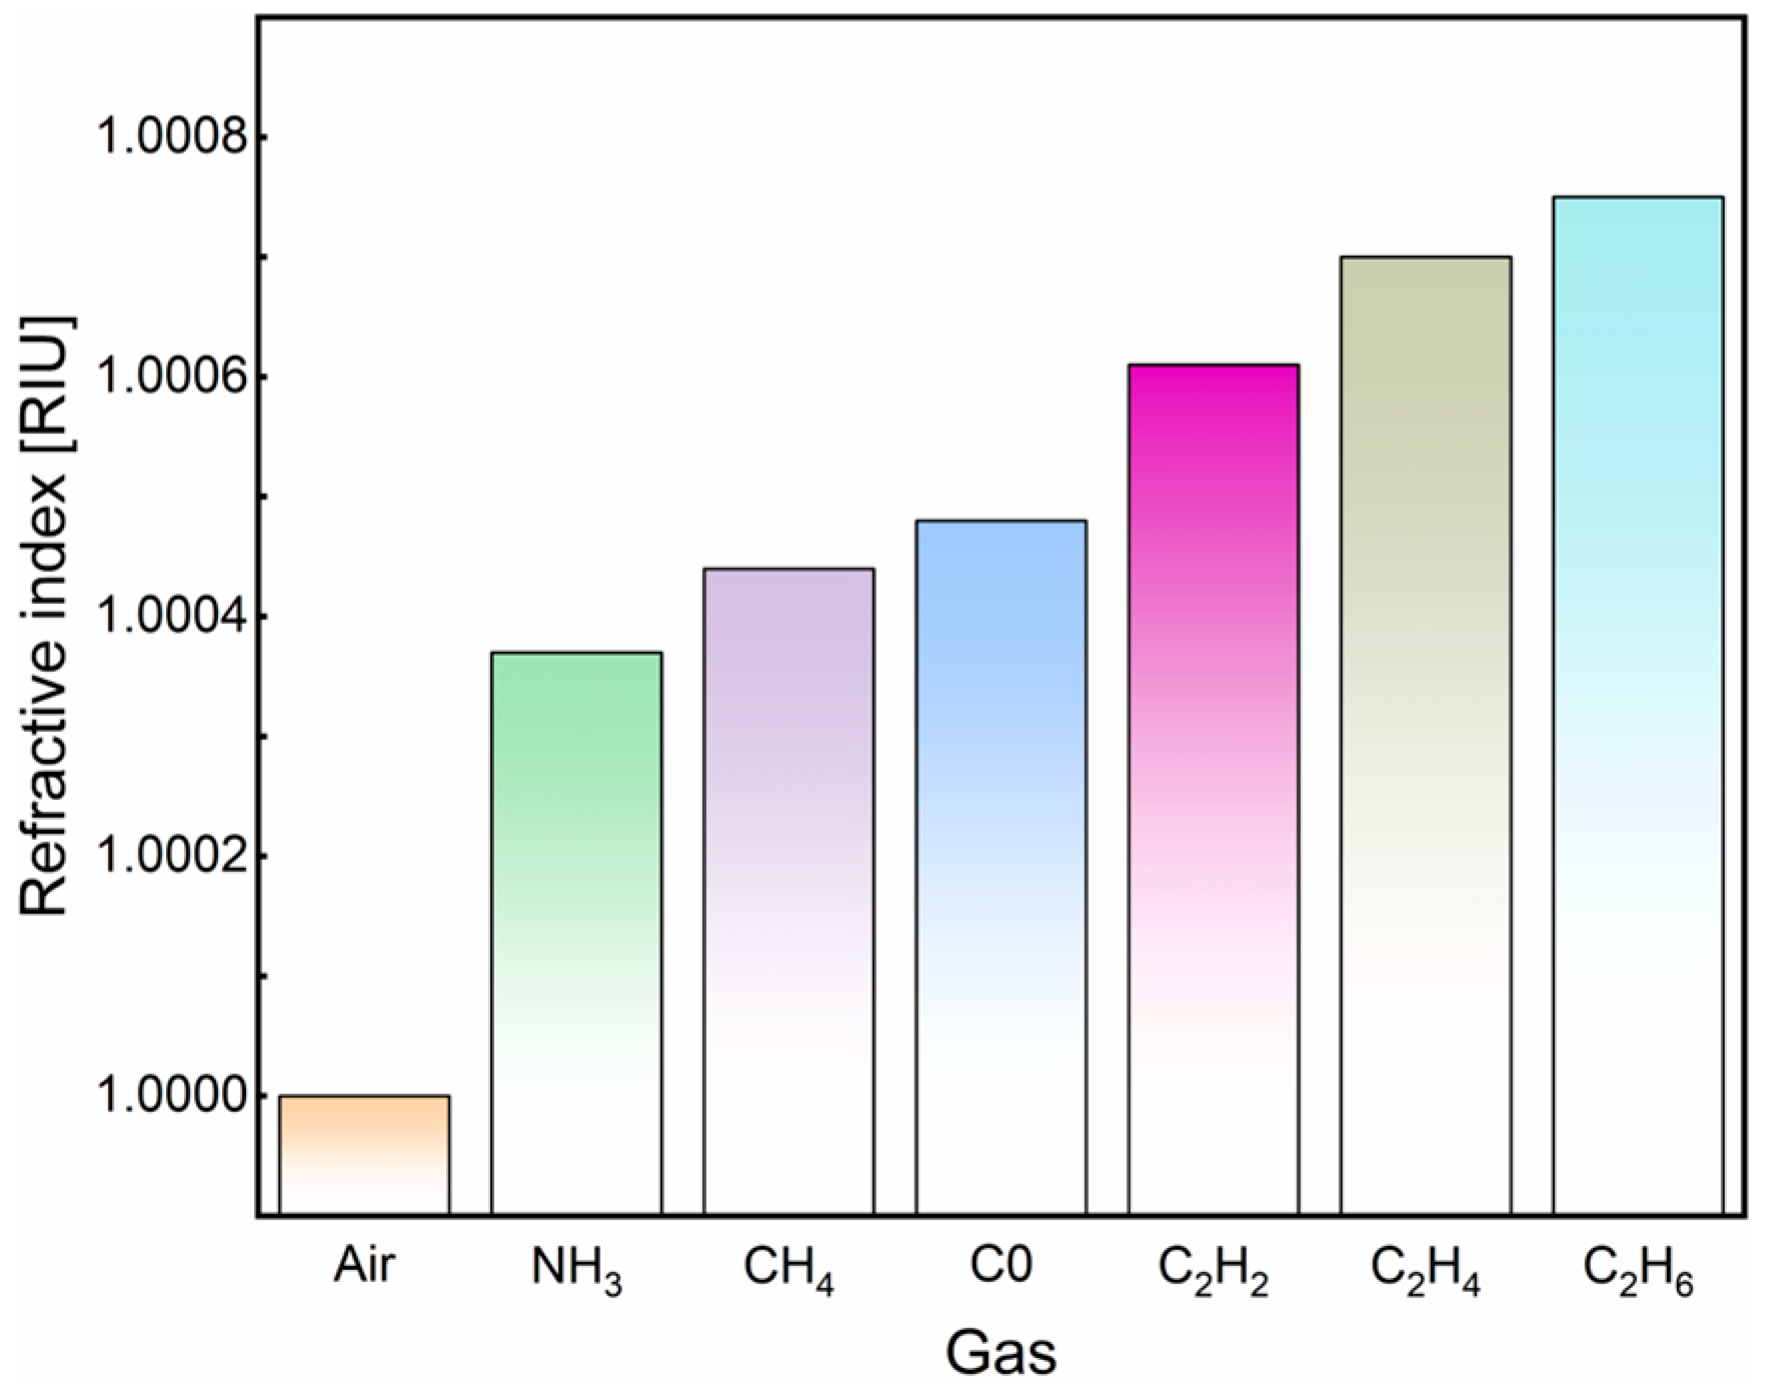
Ammonia (NH3) [40] is a colorless gaseous compound with a pungent odor. It is widely used but toxic and poses environmental risks by contributing to atmospheric pollution. Carbon monoxide (CO) [41] is a colorless, odorless gas that is a common air pollutant both indoors and outdoors. Due to its undetectable nature, it frequently causes CO poisoning incidents, posing significant dangers to human health. Methane (CH4), acetylene (C2H2), ethylene (C2H4), and ethane (C2H6) [42,43] are four common volatile organic compounds (VOCs) that exist in the air through evaporation under normal conditions. Their toxicity and irritant properties can cause acute harm to the human body. Given these properties, the detection of these six gases is critically important. Figure 3 shows the refractive indices of the six gases [44].

3.2. Gas Detection and Sensor Performance Analysis

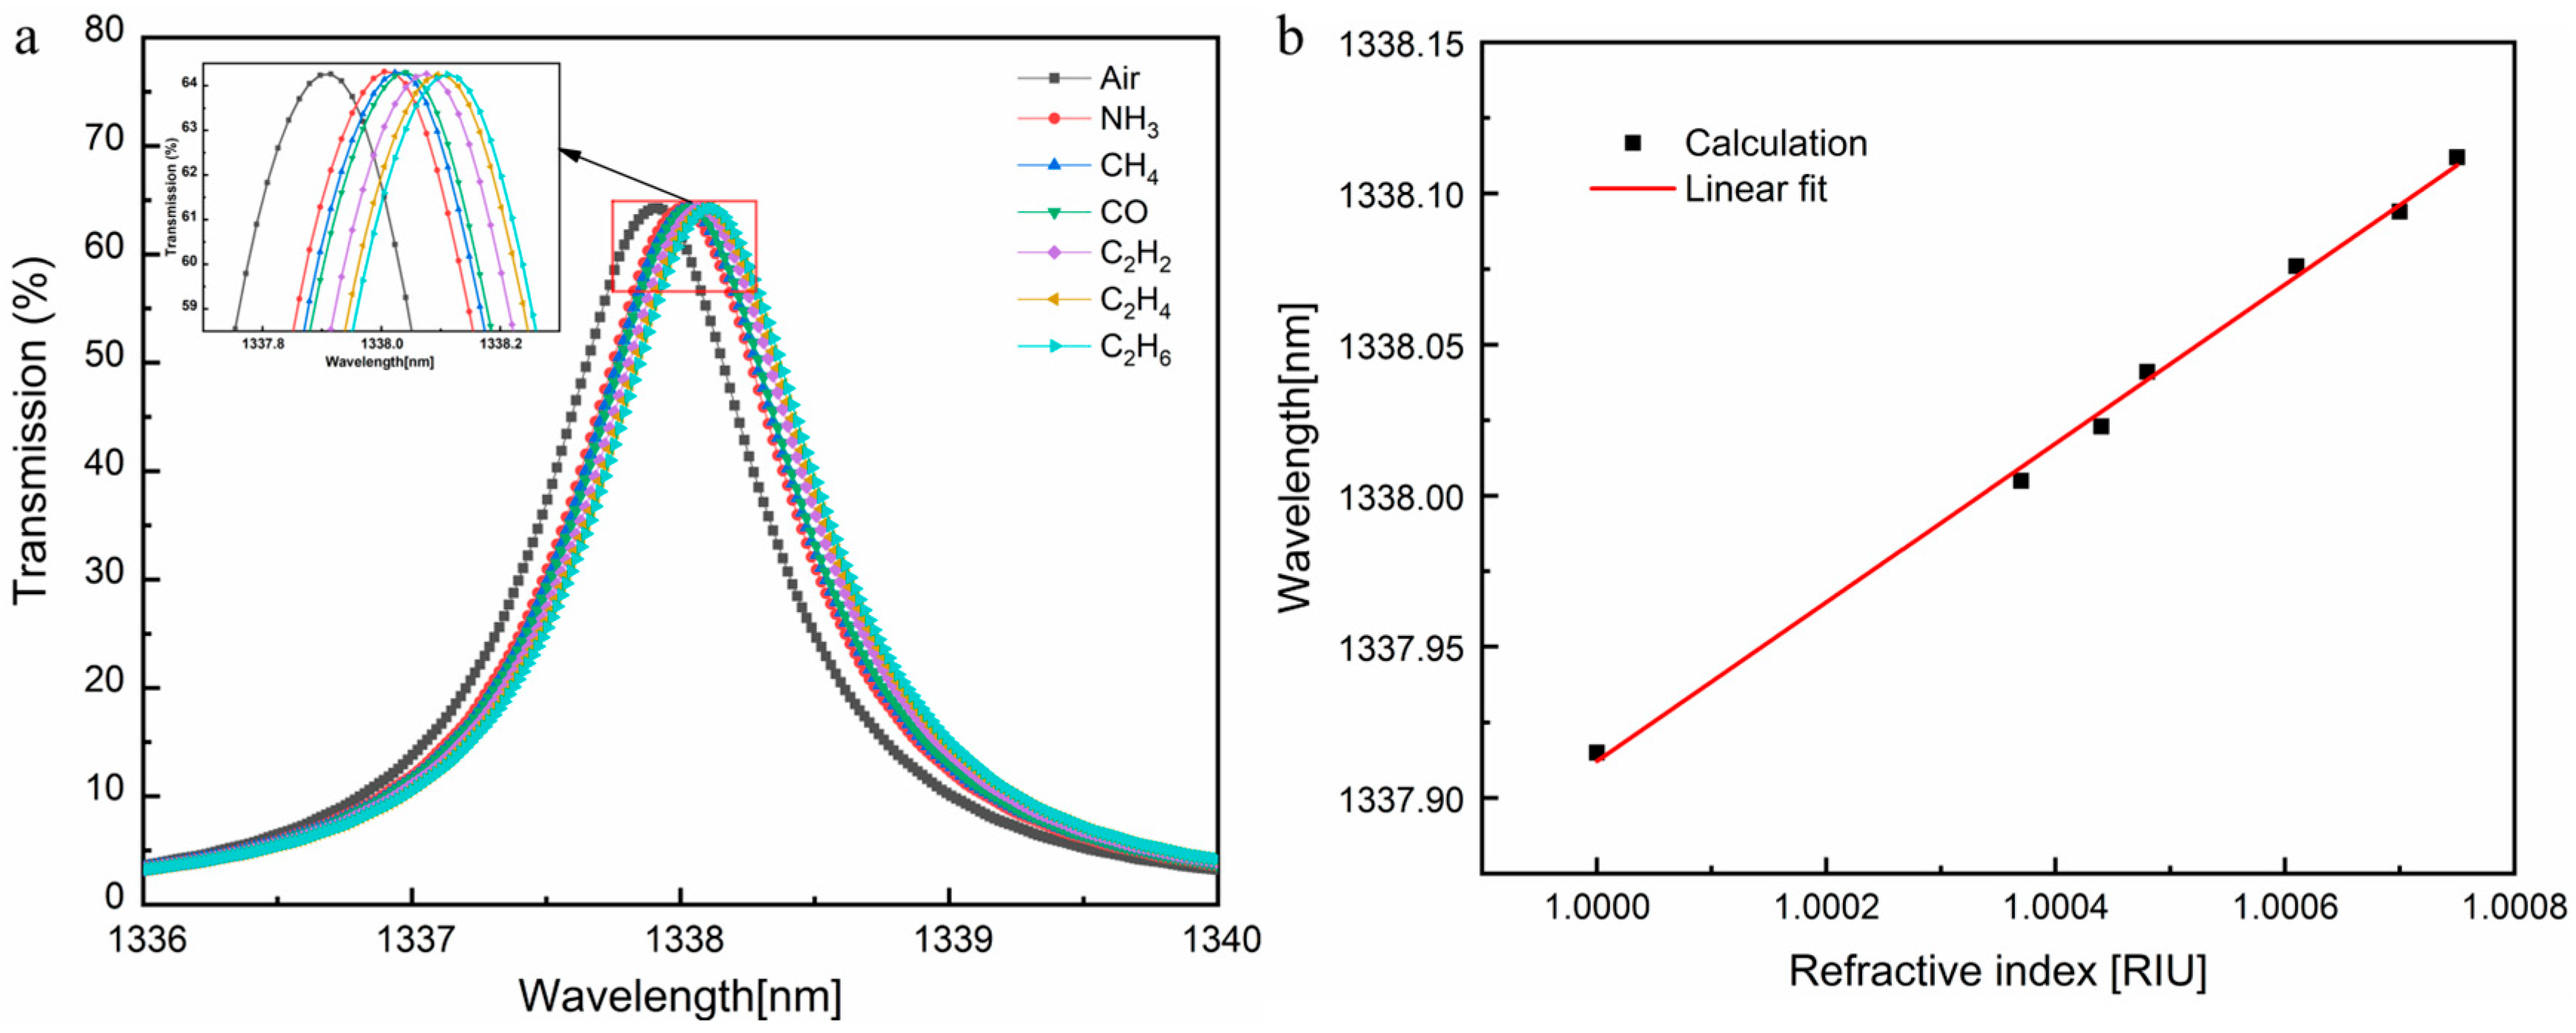
Using a 2-D PhC sensor structure with air as the background material as a reference, the detection of the six gases was conducted. Figure 4a shows the transmission spectra obtained at the output port, while Figure 4b presents the corresponding resonance wavelengths and the fitted curve for the seven gases (including air).
From Figure 4a, it can be observed that an increase in the gas refractive index results in a redshift in the resonance peak. As shown in Figure 4b, the resonance wavelength exhibits a linear dependence on the gas refractive index, with a strong linear fit characterized by a correlation coefficient of 0.99845. The fitting equation is: y = 1074.994 + 262.919 x , where x is the refractive index and y is the resonance wavelength.
The performance parameters of 2-D PhC microcavity sensors mainly include sensitivity (S), quality factor (Q), and limit of detection (LoD).
Refractive index sensitivity S is defined as the ratio of the shift in the resonant peak position in the transmission spectrum of the 2-D PhC microcavity sensor (Δλ) to the difference in refractive index between the gas and air (Δn). The equation is as follows [29,45]:
S = λ n
Sensitivity is one of the critical indicators reflecting the performance of 2-D PhC microcavity sensors. Variations in the gas refractive index induce changes in the microcavity’s resonance behavior, leading to a wavelength shift in the resonant peak within the transmission spectrum. From Equation (1), it can be concluded that a greater shift in the resonant peak wavelength indicates higher sensitivity of the sensor, making it more responsive to the target gas.
Another key parameter of 2-D PhC microcavity sensors is the quality factor Q, which is defined as the ratio of the resonant wavelength (λr) in the transmission spectrum to the full width at half maximum (FWHM) of the resonant peak (ΔλFWHM). The calculation is as follows [46,47]:
Q = λ r Δ λ FWHM
The quality factor Q reflects the residence time of light waves in the PhC microcavity, indicating the ability to confine photons. It is a measure of the ratio of energy loss to energy storage. According to Equation (2), a higher quality factor (Q) corresponds to a narrower FWHM, signifying reduced energy loss, prolonged light confinement, enhanced gas selectivity, and improved overall sensor performance. The final significant performance parameter of the 2-D PhC microcavity sensor is the limit of detection (LoD), which refers to the smallest detectable change in refractive index. The equation for LoD is as follows [46,48]:
LoD = λ r 10 S Q
where λr is the resonant wavelength of the microcavity, S is the sensitivity of the sensor, and Q is the quality factor. From Equation (3), it can be observed that LoD depends on the product of sensitivity and quality factor Q. To achieve a better LoD, both S and Q need to be optimized simultaneously.
Based on the above equations, the three performance parameters of the sensor were calculated, respectively, and the results are shown in Table 1. From Table 1, when detecting acetylene gas, the sensor achieves the highest sensitivity of 263.93 nm/RIU, a quality factor of 1385.172, and an LoD of 3.660 × 10⁻⁴ RIU. When detecting ammonia gas, although the sensitivity is the lowest, it is not less than 243 nm/RIU, with a quality factor Q of 1437.170 and an LoD of 3.827 × 10⁻⁴ RIU. Additionally, the results demonstrate that the quality factor Q of the sensor structure for gas detection consistently exceeds 1380.

3.3. Performance Analysis of the Sensor with Ring Cavities

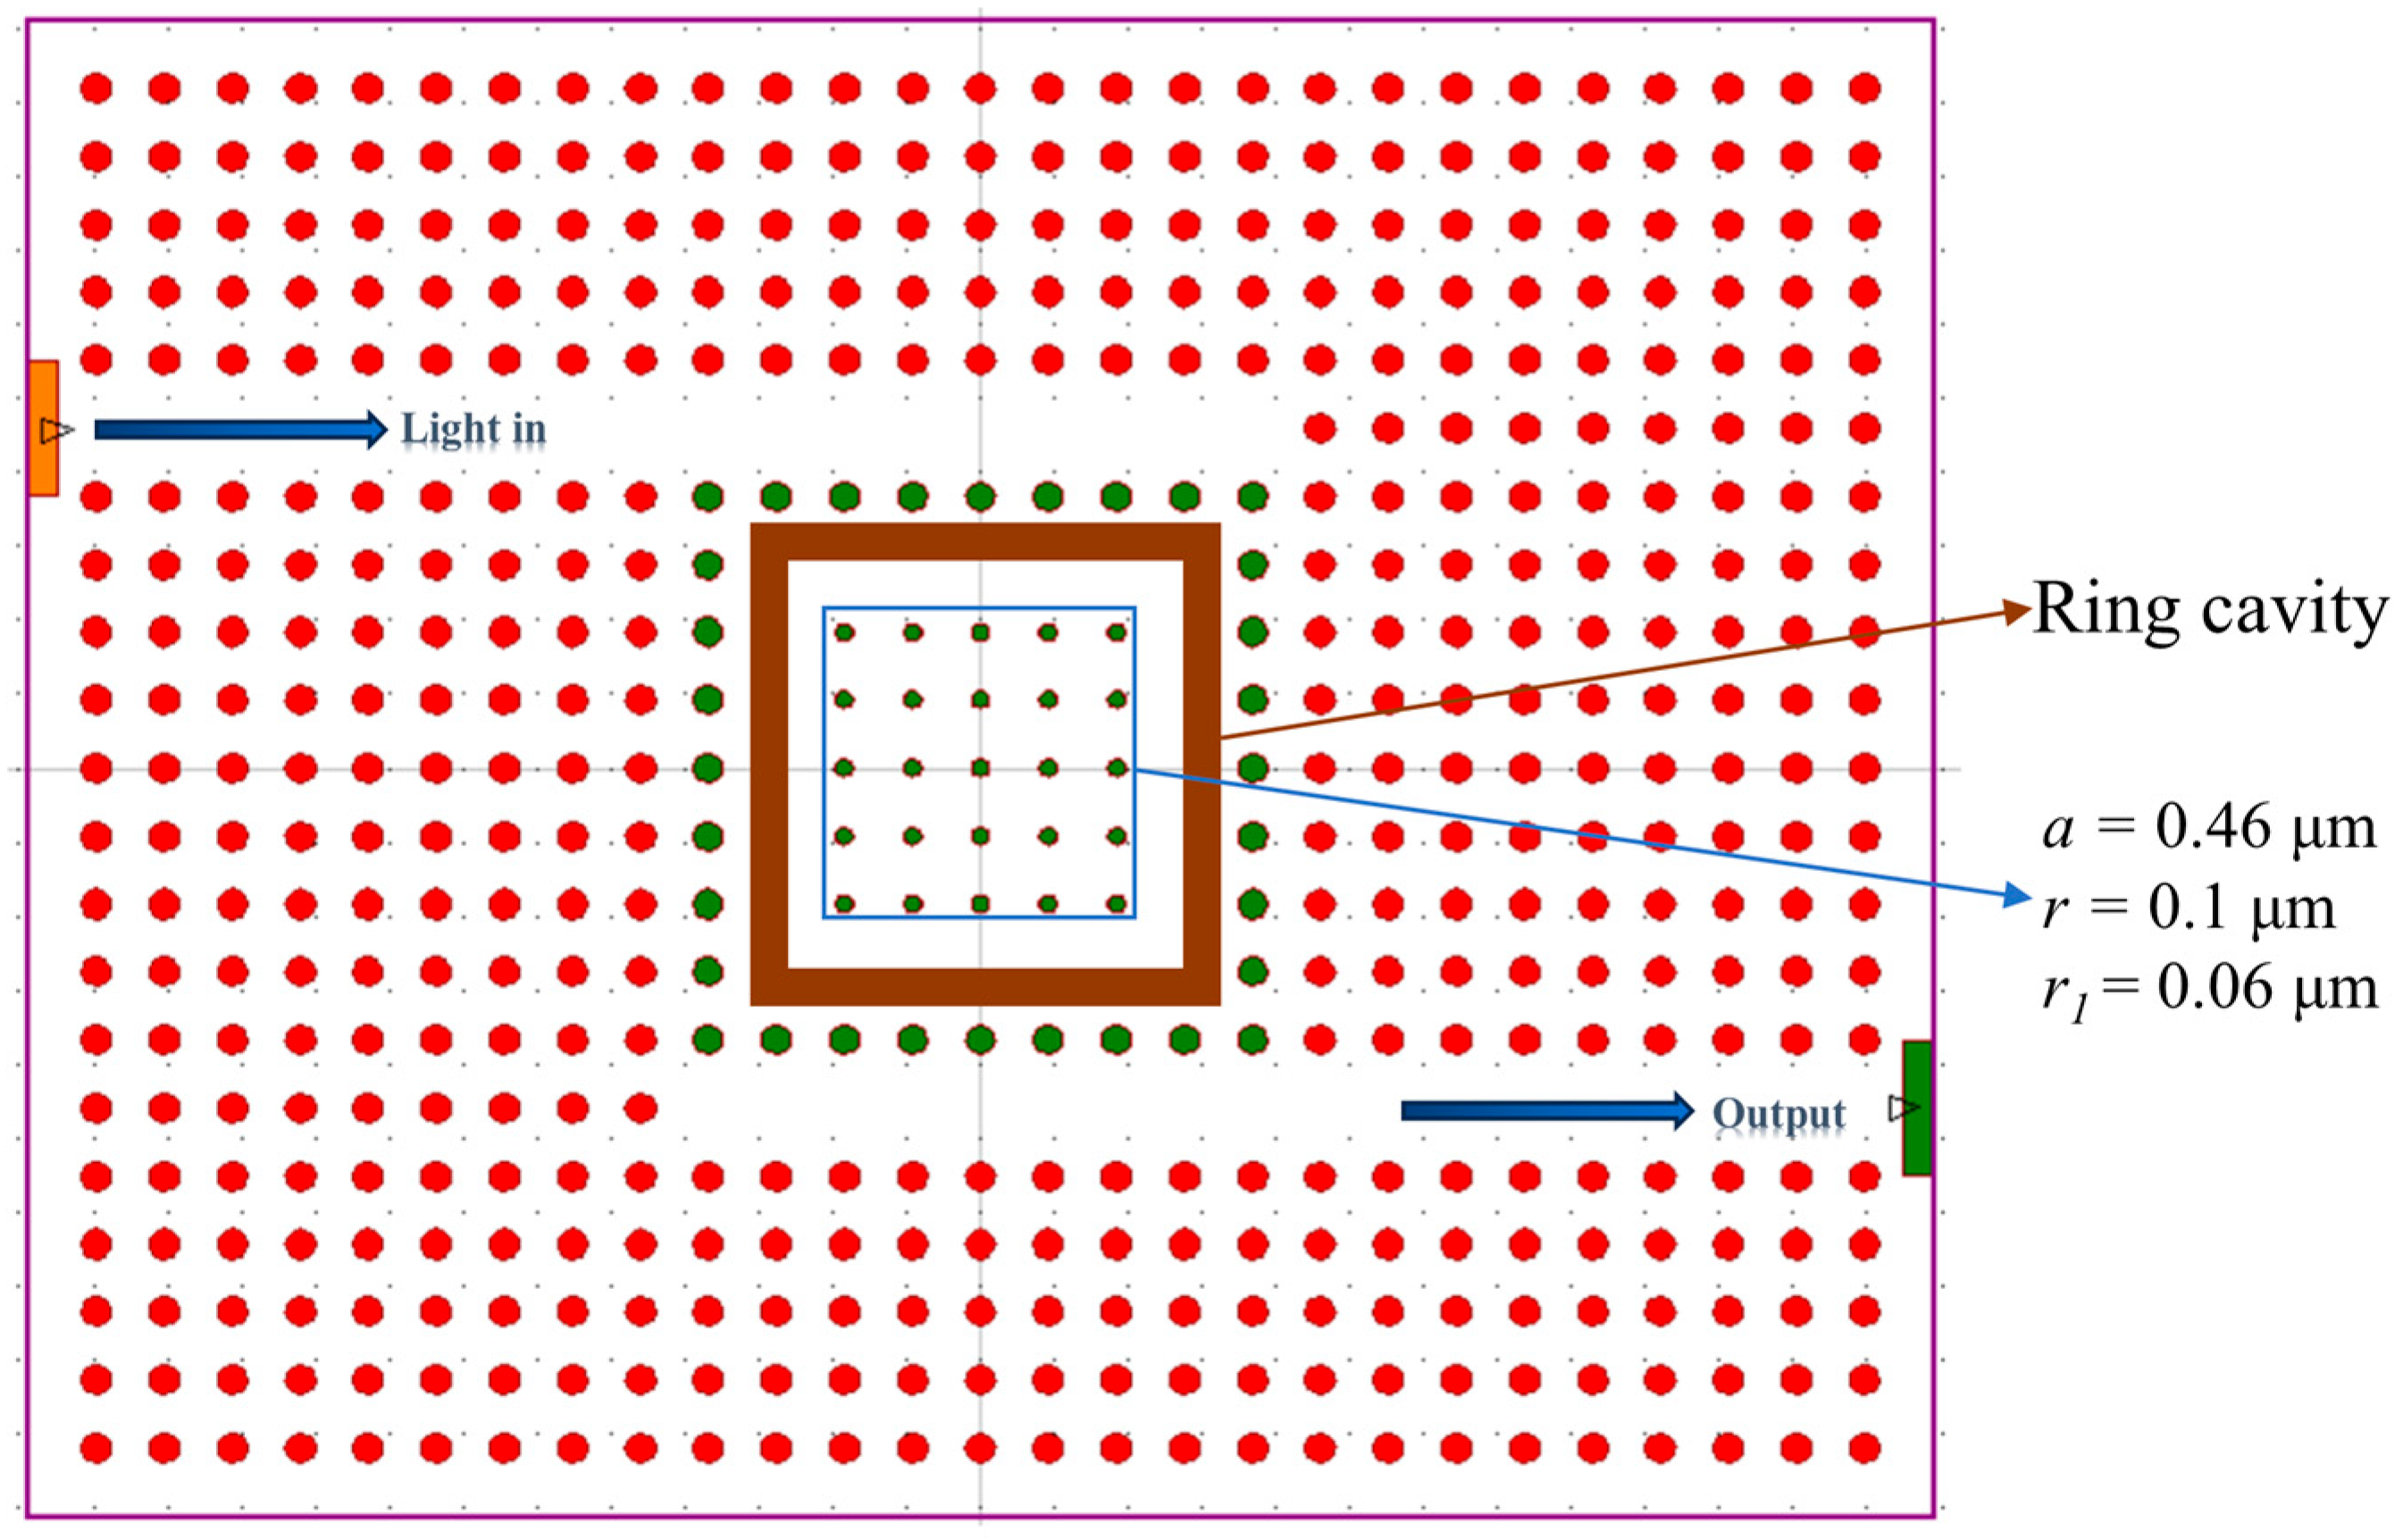
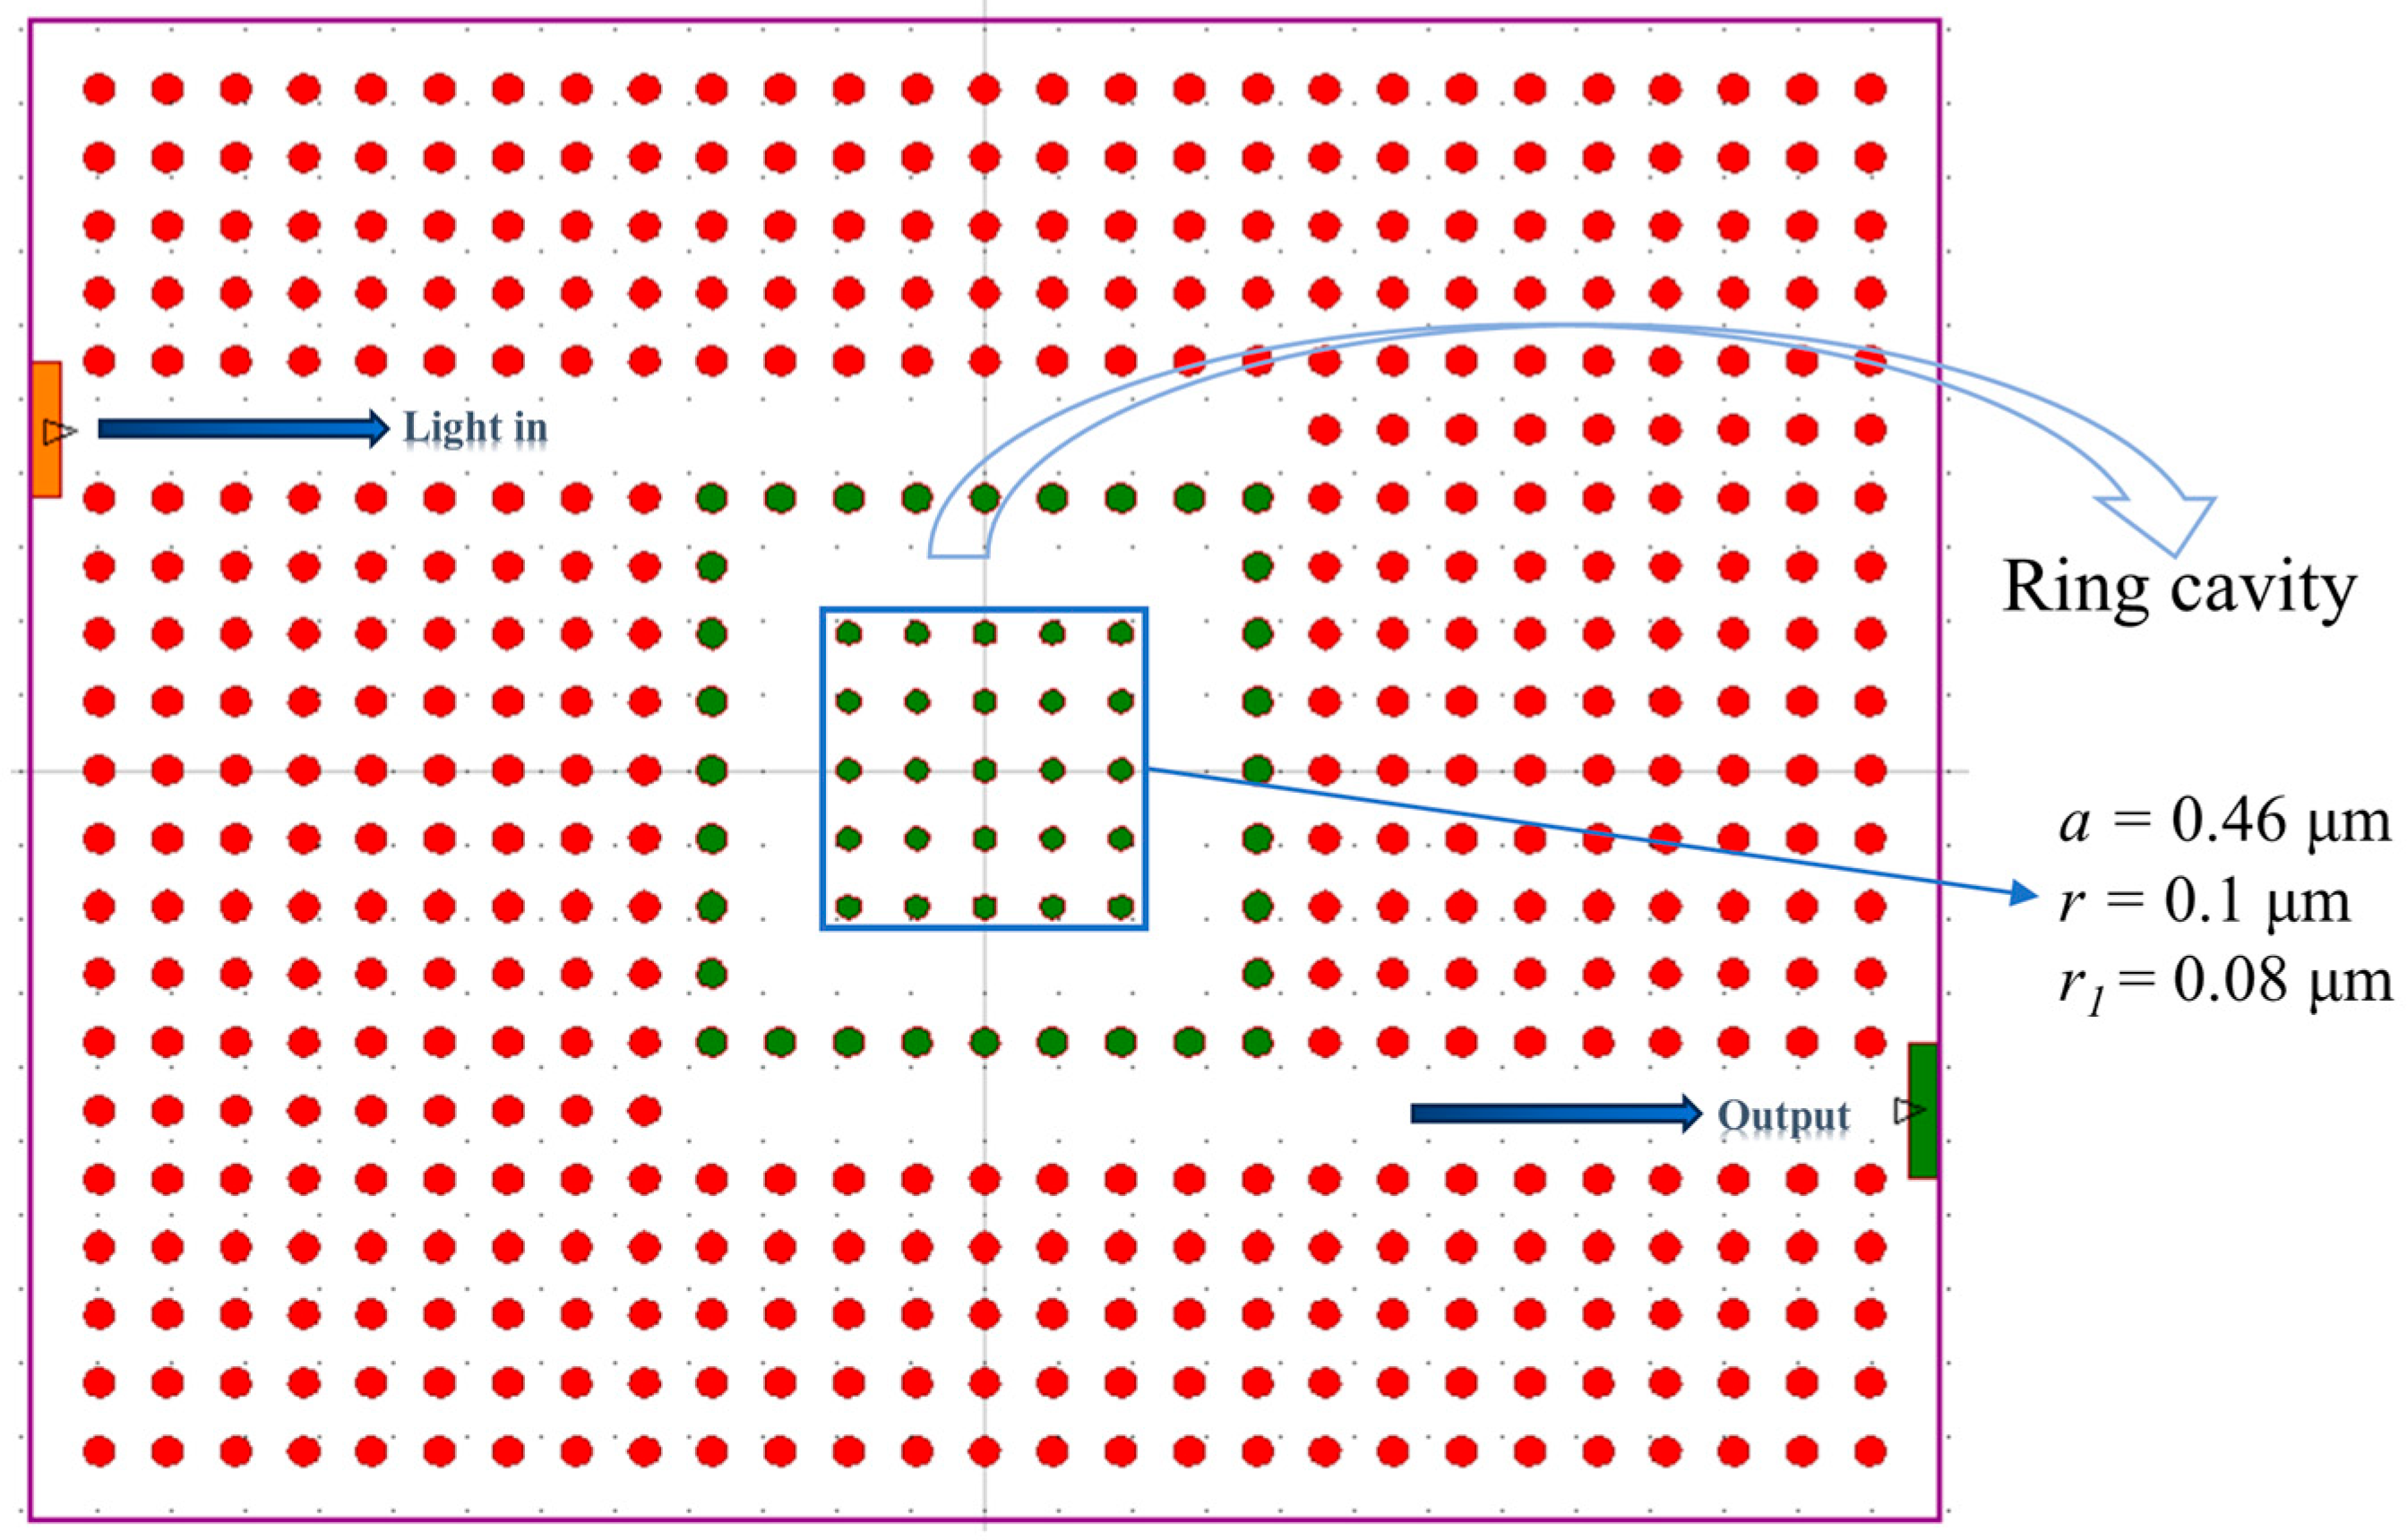
Based on the structure shown in Figure 2, a ring cavity was introduced, forming a new sensor structure, as shown in Figure 5. The structural parameters remain unchanged: a = 0.46 μm, r = 0.1 μm, and r1 = 0.06 μm.
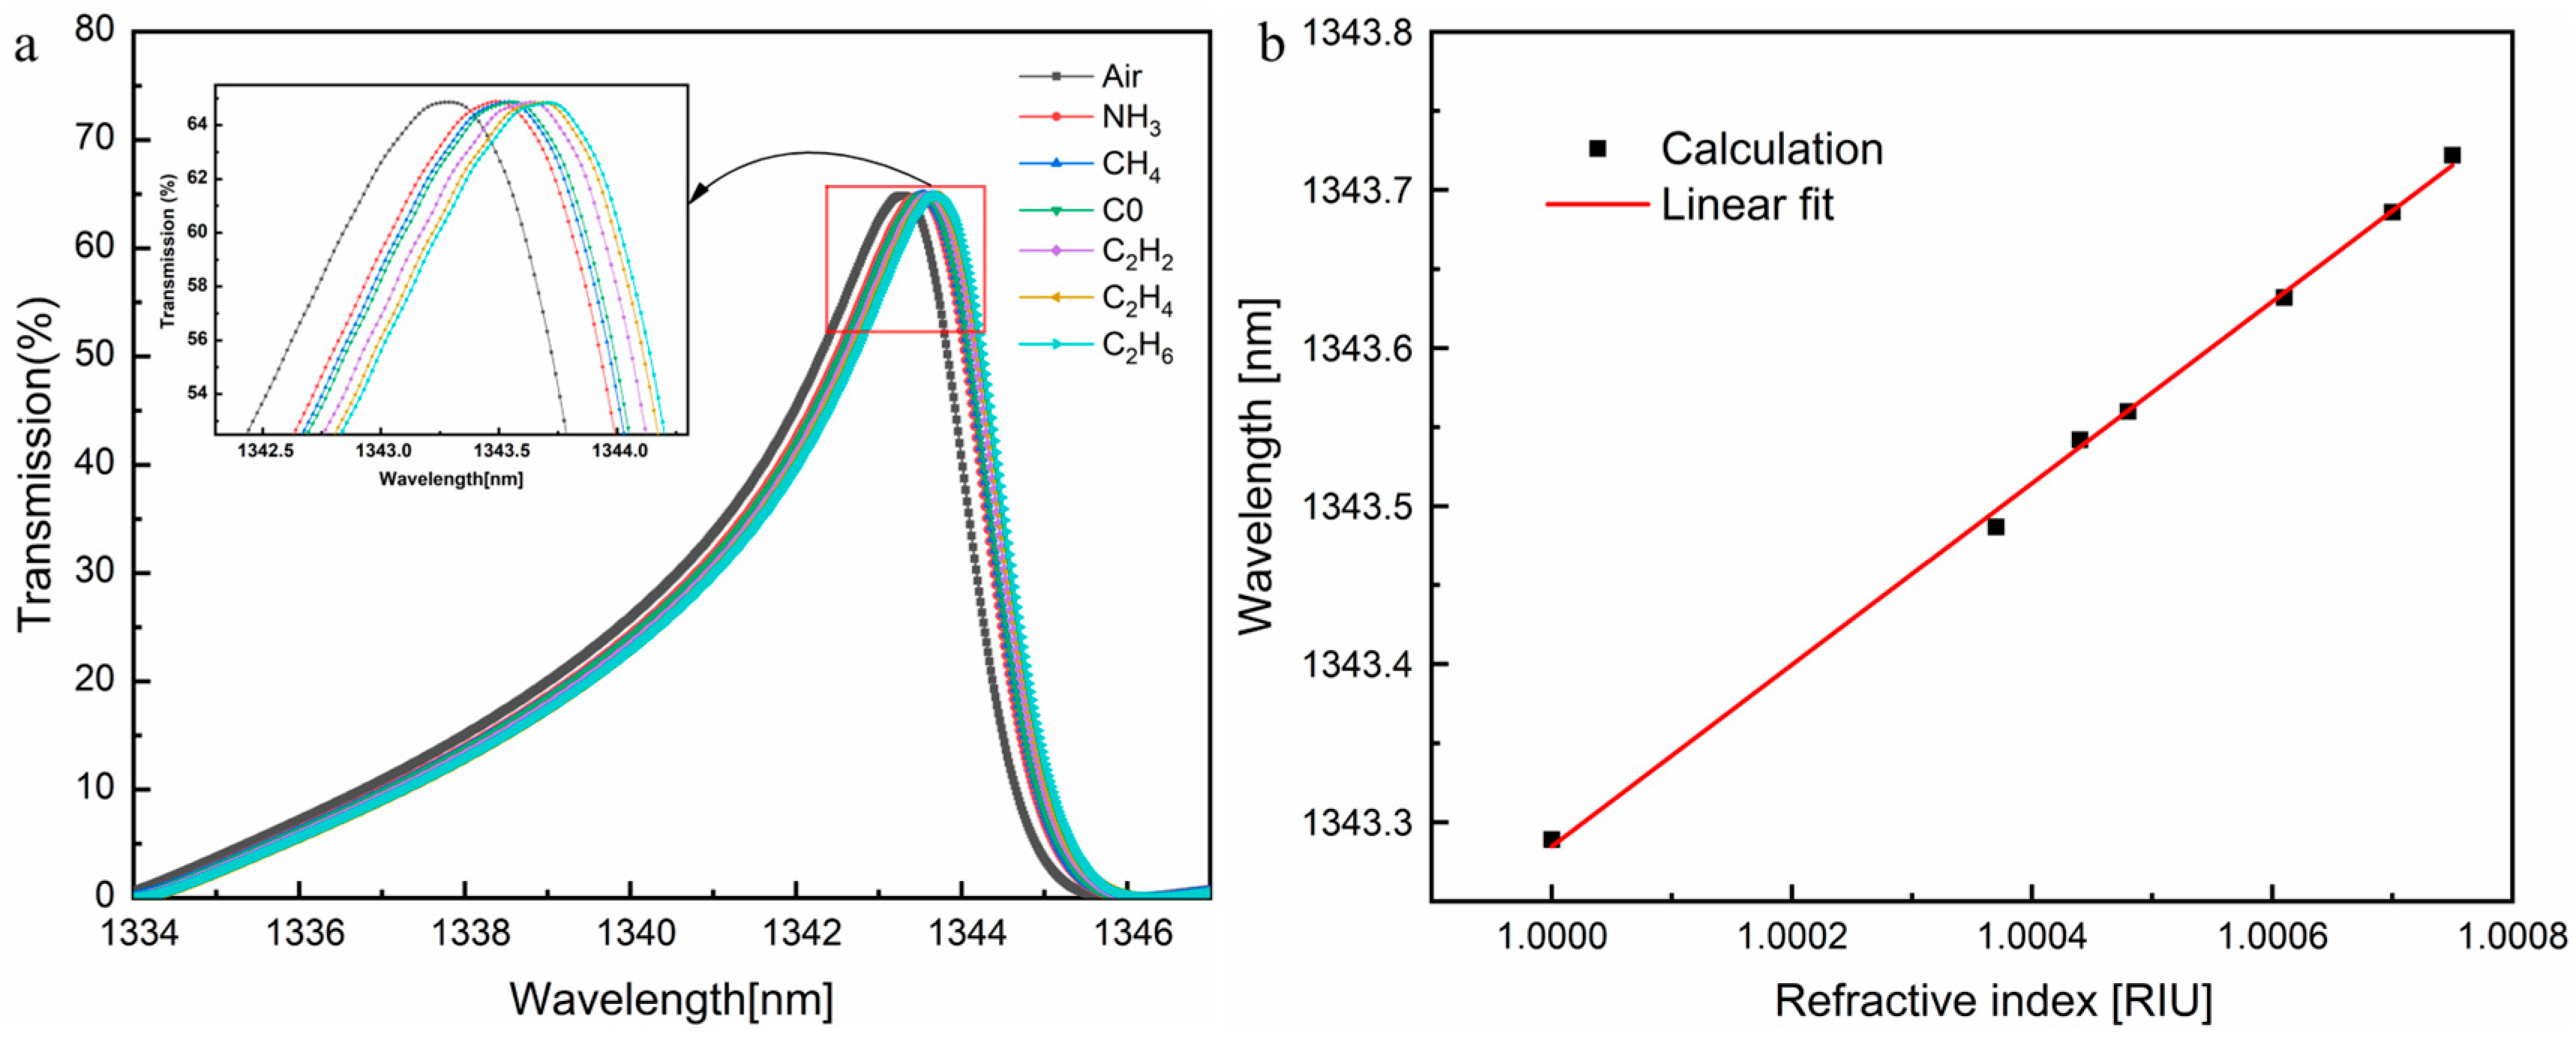
The transmission spectra of the seven gases (including air) obtained at the output waveguide are shown in Figure 6a, while Figure 6b illustrates the corresponding resonance wavelengths and their linear fitting curve. Figure 6a illustrates that an increase in the gas refractive index results in a rightward shift in the transmission spectrum, indicating a transition toward longer wavelengths. Figure 6b indicates a linear relationship between the refractive index of the gas and the resonance wavelength, with a linear equation y = 768.722 + 574.563 x , where x is the refractive index and y is the resonance wavelength. The linear fitting accuracy is as high as 0.99922.
Based on Equations (1)–(3), the performance parameters of the 2-D PhC gas sensor with the ring cavity were calculated, and the results are shown in Table 2.
It can be seen from Table 2 that the sensor achieves its highest sensitivity when detecting ethane, reaching 577.33 nm/RIU, with a quality factor Q of 433.179 and a LoD of 5.373 × 10⁻⁴ RIU. For NH3, the sensitivity is the lowest at 535.14 nm/RIU, with a quality factor Q of 421.156 and an LoD of 5.961 × 10⁻⁴ RIU. Additionally, all sensitivities after introducing the ring cavity are above 535 nm/RIU.

3.4. Performance Comparison of Two Sensor Designs

A comparison of the results in Table 1 and Table 2 reveals that for the 2-D PhC microcavity sensor formed with only point defects, its sensitivity ranges between 240 and 260 nm/RIU. However, after introducing the ring cavity, the sensitivity significantly increases to a range of 530~580 nm/RIU, more than doubling the original values. This improvement reflects a significant enhancement in the interaction between the incident light and the surrounding gaseous medium, thereby increasing the sensor’s sensitivity to refractive index changes.
However, the quality factor Q decreases significantly—from approximately 1385 in the structure with only point defects to around 410 when the ring cavity is introduced—indicating a reduction in photon localization within the microcavity. This observation reveals an inherent trade-off between sensitivity and quality factor. Enhancing sensitivity requires stronger light–matter interaction, which typically shortens the residence time of photons and weakens confinement, thereby reducing Q. In contrast, increasing the Q-factor by prolonging photon confinement diminishes the extent of light–gas interaction, ultimately compromising sensitivity. The LoD, as calculated from the equation, depends on the product of sensitivity and quality factor Q. A larger product value corresponds to a smaller LoD and better sensor performance. With only point defects, the LoD is approximately 3.7 × 10⁻⁴ RIU, sufficient for detecting the gases in this study. However, after introducing the ring cavity, the LoD increases to around 5.5 × 10⁻⁴ RIU, indicating that this sensor design is less suitable for accurately detecting NH3, CH4, or CO. By taking these factors into consideration, the 2-D PhC gas sensor with only point defects demonstrates superior overall performance.

3.5. Extended Optimization and Performance Analysis of the Sensor

To balance the trade-off between sensitivity and the quality factor Q, the radius r1 of the 2-D PhC microcavity was adjusted to 0.08 μm, as shown in Figure 7. With this new 2-D PhC sensor structure, the seven gases (including air) were tested, and the transmission spectra obtained at the output are shown in Figure 8a. Figure 8b illustrates a linear correlation between the resonance wavelength and the refractive index of the gas.
From Figure 8a, it is evident that the resonance wavelength shifts to the right as the refractive index increases, following the same trend observed in the previous two designs. As shown in Figure 8b, the resonance peak wavelength exhibits a linear dependence on the refractive index, with a linear fitting accuracy of 0.99955. The linear equation is y = 532.930 + 890.377 x , where x is the refractive index and y is the resonance wavelength.
Based on the simulation results in Figure 8a, the sensitivity S, quality factor Q, and LoD of this sensor structure were calculated, and the results are shown in Table 3.
From Table 3, one can observe that with r1 = 0.08 μm, the sensor achieves a sensitivity of approximately 900 nm/RIU and a quality factor Q of around 2300. When detecting NH3, the sensitivity reaches its maximum at 932.43 nm/RIU, and the quality factor Q is 2341.525. For CO detection, the sensitivity is at its lowest but still exceeds 880 nm/RIU, with a quality factor no less than 2260. Additionally, the LoD was calculated to be in the order of 10−5, indicating that this sensor structure is highly capable of detecting the target gases with high sensitivity.
By comparing the results in Table 1, Table 2 and Table 3, it can be concluded that the optimized 2-D PhC microcavity gas sensor achieves a significant improvement in sensitivity while maintaining a well-optimized quality factor Q, demonstrating excellent overall performance. As shown in Table 4, compared with previous studies [49,50,51], the optimized sensor proposed in this work demonstrates not only competitive sensing performance but also greater ease of fabrication, highlighting its broad application potential. In future work, we aim to validate the theoretical modeling through experimental implementation and prototype device fabrication [52,53,54].

4. Conclusions

In summary, in this study, a 2-D PhC microcavity gas sensor was designed using point defects to leverage microcavity resonance characteristics. Air was used as a reference medium to detect multiple gases, including NH3, CH4, CO, C2H2, C2H4, and C2H6. The initial 2-D PhC sensor, composed of silicon dielectric rods arranged in a square lattice, was simulated using Rsoft software, yielding a sensitivity of 263 nm/RIU, a quality factor Q of 1437, and a LoD of 3.660 × 10⁻⁴ RIU. To enhance performance, a ring cavity structure was introduced, improving sensitivity to 577 nm/RIU but reducing the quality factor Q to 433 and increasing the LoD to 5.373 × 10⁻⁴ RIU. Based on the analysis and comparison of the aforementioned sensor’s performance parameters, structural optimizations were implemented to attain a better trade-off between sensitivity and quality factor. Through structural optimization, this study has successfully achieved comprehensive performance enhancement of the 2-D PhC microcavity sensor: not only realizing the dual optimization objectives of high sensitivity (S = 932 nm/RIU) and high quality factor (Q = 2421), but also significantly improving the detection limit to 10−5 level, enabling it to meet more stringent detection requirements while substantially enhancing measurement accuracy and reliability. The optimized gas sensor not only demonstrates excellent theoretical performance and fabrication simplicity but also displays a strong linear correlation (R2 = 0.99955) between resonance wavelength and gas refractive index, indicating its potential for broader gas detection applications. The results obtained in this work provide theoretical guidance for the development of high-performance gas sensors, while also holding significant theoretical importance and practical value for advancing photonic crystal sensing technologies.

Author Contributions

Concept, J.Z., Z.C., and Y.W.; methodology, Y.S., J.Q., Z.C., and Y.W.; software, Y.S., J.Q., L.L., J.S., X.H., and Z.M.; validation, Y.S., L.L., and X.H.; formal analysis, J.Q., J.S., J.Z., Z.C., and Y.W.; investigation, Y.S., J.Q., and Z.M.; Funding acquisition, Y.W. and Z.C.; writing—original draft preparation, Y.S., J.Q., and Z.M.; writing—review and editing, L.L., J.S., X.H., Z.C., and Y.W.; supervision, J.Z., Z.C., and Y.W. All authors have read and agreed to the published version of the manuscript.

Funding

This work was supported by the National Natural Science Foundation of China under Grant No. 22076008 (Z.C.) and the Natural Science Foundation of Shandong Province under Grant No. ZR2020MA084 (Y.W.).

Conflicts of Interest

The authors declare no conflict of interest.

References

  1. Fitch, J.P.; Raber, E.; Imbro, D.R. Technology Challenges in Responding to Biological or Chemical Attacks in the Civilian Sector. Science 2003, 302, 1350–1354. [Google Scholar] [CrossRef] [PubMed]
  2. Lelieveld, J.; Lechtenböhmer, S.; Assonov, S.S.; Brenninkmeijer, C.A.M.; Dienst, C.; Fischedick, M.; Hanke, T. Low methane leakage from gas pipelines. Nature 2005, 434, 841–842. [Google Scholar] [CrossRef] [PubMed]
  3. Amann, A.; Miekisch, W.; Schubert, J.; Buszewski, B.; Ligor, T.; Jezierski, T.; Pleil, J.; Risby, T. Analysis of exhaled breath for disease detection. Annu. Rev. Anal. Chem. 2014, 7, 455–482. [Google Scholar] [CrossRef]
  4. Potyrailo, R.A.; Mirsky, V.M. Combinatorial and high-throughput development of sensing materials: The first 10 years. Chem. Rev. 2008, 108, 770–813. [Google Scholar] [CrossRef]
  5. Zhang, Y.; Sun, Y.; Liu, J.; Guo, P.; Cai, Z.; Wang, J.-J. Polymer-infiltrated SiO2 inverse opal photonic crystals for colorimetrically selective detection of xylene vapors. Sens. Actuators B-Chem. 2019, 291, 67–73. [Google Scholar] [CrossRef]
  6. Cai, Z.; Liu, Y.J.; Lu, X.; Teng, J. In Situ “Doping” Inverse Silica Opals with Size-Controllable Gold Nanoparticles for Refractive Index Sensing. J. Phys. Chem. C 2013, 117, 9440–9445. [Google Scholar] [CrossRef]
  7. John, S. Strong Localization of Photons in Certain Disordered Dielectric Superlattices. Phys. Rev. Lett. 1987, 58, 2486–2489. [Google Scholar] [CrossRef] [PubMed]
  8. Yablonovitch, E. Inhibited Spontaneous Emission in Solid-State Physics and Electronics. Phys. Rev. Lett. 1987, 58, 2059–2062. [Google Scholar] [CrossRef]
  9. Butt, M.A.; Khonina, S.N.; Kazanskiy, N.L. Recent advances in photonic crystal optical devices: A review. Opt. Laser Technol. 2021, 142, 107265. [Google Scholar] [CrossRef]
  10. Cai, Z.; Li, Z.; Ravaine, S.; He, M.; Song, Y.; Yin, Y.; Zheng, H.; Teng, J.; Zhang, A. From colloidal particles to photonic crystals: Advances in self-assembly and their emerging applications. Chem. Soc. Rev. 2021, 50, 5898–5951. [Google Scholar] [CrossRef]
  11. Quan, J.; Song, Y.; Li, H.; Zhao, F.; Zhou, L.; Cai, Z.; Wan, Y. Effects of Building Blocks and Defects on the Performance of Two-Dimensional Photonic Crystal Sensors for Black Liquor Detection. J. Anal. Test. 2025, 9, 50–60. [Google Scholar] [CrossRef]
  12. Meade, R.D.; Rappe, A.; Brommer, K.; Joannopoulos, J.; Alerhand, O. Accurate theoretical analysis of photonic band-gap materials. Phys. Rev. B 1993, 48, 8434. [Google Scholar] [CrossRef]
  13. Keller, O. On the theory of spatial localization of photons. Phys. Rep. 2005, 411, 1–232. [Google Scholar] [CrossRef]
  14. Fu, H.-w.; Zhao, H.; Qiao, X.-g.; Li, Y.; Zhao, D.-z.; Yong, Z. Study on a novel photonic crystal temperature sensor. Optoelectron. Lett. 2011, 7, 419–422. [Google Scholar] [CrossRef]
  15. Zegadi, R.; Ziet, L.; Zegadi, A. Design of High Sensitive Temperature Sensor Based on Two-Dimensional Photonic Crystal. Silicon 2020, 12, 2133–2139. [Google Scholar] [CrossRef]
  16. Aly, A.H.; Mohamed, B.A.; Al-Dossari, M.; Mohamed, D. A temperature sensor based on Si/PS/SiO2 photonic crystals. Sci. Rep. 2023, 13, 21560. [Google Scholar] [CrossRef]
  17. Yang, Y.; Yang, D.; Tian, H.; Ji, Y. Photonic crystal stress sensor with high sensitivity in double directions based on shoulder-coupled aslant nanocavity. Sens. Actuators A-Phys. 2013, 193, 149–154. [Google Scholar] [CrossRef]
  18. Vijaya Shanthi, K.; Robinson, S. Two-dimensional photonic crystal based sensor for pressure sensing. Photonics Sens. 2014, 4, 248–253. [Google Scholar] [CrossRef]
  19. Arunkumar, R.; Suganya, T.; Robinson, S. Design and analysis of photonic crystal elliptical ring resonator based pressure sensor. Int. J. Photonics Opt. Technol. 2017, 3, 30–33. [Google Scholar]
  20. Kwon, S.-H.; Sünner, T.; Kamp, M.; Forchel, A. Optimization of photonic crystal cavity for chemical sensing. Opt. Express 2008, 16, 11709–11717. [Google Scholar] [CrossRef] [PubMed]
  21. Baker, J.E.; Sriram, R.; Miller, B.L. Two-dimensional photonic crystals for sensitive microscale chemical and biochemical sensing. Lab Chip 2015, 15, 971–990. [Google Scholar] [CrossRef]
  22. Cai, Z.; Smith, N.L.; Zhang, J.-T.; Asher, S.A. Two-Dimensional Photonic Crystal Chemical and Biomolecular Sensors. Anal. Chem. 2015, 87, 5013–5025. [Google Scholar] [CrossRef]
  23. Johnson, S.G.; Villeneuve, P.R.; Fan, S.; Joannopoulos, J.D. Linear waveguides in photonic-crystal slabs. Phys. Rev. B 2000, 62, 8212. [Google Scholar] [CrossRef]
  24. Jamois, C.; Wehrspohn, R.; Andreani, L.; Hermann, C.; Hess, O.; Gösele, U. Silicon-based two-dimensional photonic crystal waveguides. Photonic Nanostruct. 2003, 1, 1–13. [Google Scholar] [CrossRef]
  25. Zouache, T.; Hocini, A. A 2D photonic crystal indium arsenide based with dual micro-cavities coupled to a waveguide as a platform for a high sensitivity pressure sensor. Opt. Quantum Electron. 2023, 55, 238. [Google Scholar] [CrossRef]
  26. Sünner, T.; Stichel, T.; Kwon, S.-H.; Schlereth, T.W.; Höfling, S.; Kamp, M.; Forchel, A. Photonic crystal cavity based gas sensor. Appl. Phys. Lett. 2008, 92, 26112. [Google Scholar] [CrossRef]
  27. Zhang, Y.; Han, S.; Zhang, S.; Liu, P.; Shi, Y. High-Q and High-Sensitivity Photonic Crystal Cavity Sensor. IEEE Photonics J. 2015, 7, 1–6. [Google Scholar] [CrossRef]
  28. Fallahi, V.; Kordrostami, Z.; Hosseini, M. Sensitivity and quality factor improvement of photonic crystal sensors by geometrical optimization of waveguides and micro-ring resonators combination. Sci. Rep. 2024, 14, 2001. [Google Scholar] [CrossRef]
  29. Nair, R.V.; Vijaya, R. Photonic crystal sensors: An overview. Prog. Quantum Electron. 2010, 34, 89–134. [Google Scholar] [CrossRef]
  30. Sharma, P.; Medhekar, S. Ring resonator-based highly sensitive chemical/biochemical sensor created on holes in silicon slab 2D photonic crystal. J. Opt. 2023, 52, 2315–2322. [Google Scholar] [CrossRef]
  31. Painter, O.; Lee, R.K.; Scherer, A.; Yariv, A.; O’Brien, J.D.; Dapkus, P.D.; Kim, I. Two-Dimensional Photonic Band-Gap Defect Mode Laser. Science 1999, 284, 1819–1821. [Google Scholar] [CrossRef]
  32. Akahane, Y.; Asano, T.; Song, B.-S.; Noda, S. High-Q photonic nanocavity in a two-dimensional photonic crystal. Nature 2003, 425, 944–947. [Google Scholar] [CrossRef]
  33. Dorfner, D.F.; Hürlimann, T.; Zabel, T.; Frandsen, L.H.; Abstreiter, G.; Finley, J.J. Silicon photonic crystal nanostructures for refractive index sensing. Appl. Phys. Lett. 2008, 93, 181103. [Google Scholar] [CrossRef]
  34. Huang, L.; Tian, H.; Yang, D.; Zhou, J.; Liu, Q.; Zhang, P.; Ji, Y. Optimization of figure of merit in label-free biochemical sensors by designing a ring defect coupled resonator. Opt. Commun. 2014, 332, 42–49. [Google Scholar] [CrossRef]
  35. Kane, Y. Numerical solution of initial boundary value problems involving maxwell’s equations in isotropic media. IEEE Trans. Antennas Propag. 1966, 14, 302–307. [Google Scholar] [CrossRef]
  36. Ward, A.; Pendry, J.B. Refraction and geometry in Maxwell’s equations. J. Mod. Opt. 1996, 43, 773–793. [Google Scholar] [CrossRef]
  37. Bao, G.; Li, P. Maxwell’s Equations in Periodic Structures; Springer: Singapore, 2022. [Google Scholar]
  38. Zivanovic, S.S.; Yee, K.S.; Mei, K.K. A subgridding method for the time-domain finite-difference method to solve Maxwell’s equations. IEEE Trans. Microw. Theory Tech. 1991, 39, 471–479. [Google Scholar] [CrossRef]
  39. Teixeira, F.; Sarris, C.; Zhang, Y.; Na, D.-Y.; Berenger, J.-P.; Su, Y.; Okoniewski, M.; Chew, W.; Backman, V.; Simpson, J.J. Finite-difference time-domain methods. Nat. Rev. Methods Primers 2023, 3, 75. [Google Scholar] [CrossRef]
  40. Haar, L. Thermodynamic properties of ammonia as an ideal gas. Journal of Research of the National Bureau of Standards. Sect. A Phys. Chem. 1968, 72, 207. [Google Scholar]
  41. Guerra, C.; Schulman, J.H. The adsorption of CO gas by metals supported on silica. Surf. Sci. 1967, 7, 229–249. [Google Scholar] [CrossRef]
  42. Huang, H.; Haghighat, F.; Blondeau, P. Volatile organic compound (VOC) adsorption on material: Influence of gas phase concentration, relative humidity and VOC type. Indoor Air 2006, 16, 236–247. [Google Scholar] [CrossRef]
  43. Zhang, Y.-n.; Zhao, Y.; Wang, Q. Measurement of methane concentration with cryptophane E infiltrated photonic crystal microcavity. Sens. Actuators B-Chem. 2015, 209, 431–437. [Google Scholar] [CrossRef]
  44. Du, Z.; Mo, J.; Zhang, Y.; Li, X.; Xu, Q. Evaluation of a new passive sampler using hydrophobic zeolites as adsorbents for exposure measurement of indoor BTX. Anal. Methods 2013, 5, 3463–3472. [Google Scholar] [CrossRef]
  45. Pennec, Y.; Jin, Y.; Djafari-Rouhani, B. Phononic and photonic crystals for sensing applications. Adv. Appl. Mech. 2019, 52, 105–145. [Google Scholar]
  46. Zhang, Y.-n.; Zhao, Y.; Lv, R.-q. A review for optical sensors based on photonic crystal cavities. Sens. Actuators A-Phys. 2015, 233, 374–389. [Google Scholar] [CrossRef]
  47. Goyal, A.K.; Dutta, H.S.; Pal, S. Recent advances and progress in photonic crystal-based gas sensors. J. Phys. D Appl. Phys. 2017, 50, 203001. [Google Scholar] [CrossRef]
  48. Parandin, F.; Heidari, F.; Rahimi, Z.; Olyaee, S. Two-Dimensional photonic crystal Biosensors: A review. Opt. Laser Technol. 2021, 144, 107397. [Google Scholar] [CrossRef]
  49. Gao, Y.; Dong, P.; Shi, Y. Suspended slotted photonic crystal cavities for high-sensitivity refractive index sensing. Opt. Express 2020, 28, 12272–12278. [Google Scholar] [CrossRef]
  50. Fallahi, V.; Kordrostami, Z.; Hosseini, M. A Solution for Detection of Ethanol and Methanol With Overlapping Refractive Indexes Based on Photonic Crystal Ring Resonator Optical Sensors. IEEE Sens. J. 2023, 23, 6791–6798. [Google Scholar] [CrossRef]
  51. Jannesari, R.; Pühringer, G.; Stocker, G.; Grille, T.; Jakoby, B. Design of a High Q-Factor Label-Free Optical Biosensor Based on a Photonic Crystal Coupled Cavity Waveguide. Sensors 2024, 24, 193. [Google Scholar] [CrossRef]
  52. Liu, Y.; Wang, S.; Biswas, P.; Palit, P.; Zhou, W.; Sun, Y. Optofluidic vapor sensing with free-space coupled 2D photonic crystal slabs. Sci. Rep. 2019, 9, 4209. [Google Scholar] [CrossRef] [PubMed]
  53. Wang, S.; Liu, Y.; Zhao, D.; Yang, H.; Zhou, W.; Sun, Y. Optofluidic Fano resonance photonic crystal refractometric sensors. Appl. Phys. Lett. 2017, 110, 091105. [Google Scholar] [CrossRef]
  54. Biswas, P.; Zhang, C.; Chen, Y.; Liu, Z.; Vaziri, S.; Zhou, W.; Sun, Y. A Portable Micro-Gas Chromatography with Integrated Photonic Crystal Slab Sensors on Chip. Biosensors 2021, 11, 326. [Google Scholar] [CrossRef] [PubMed]
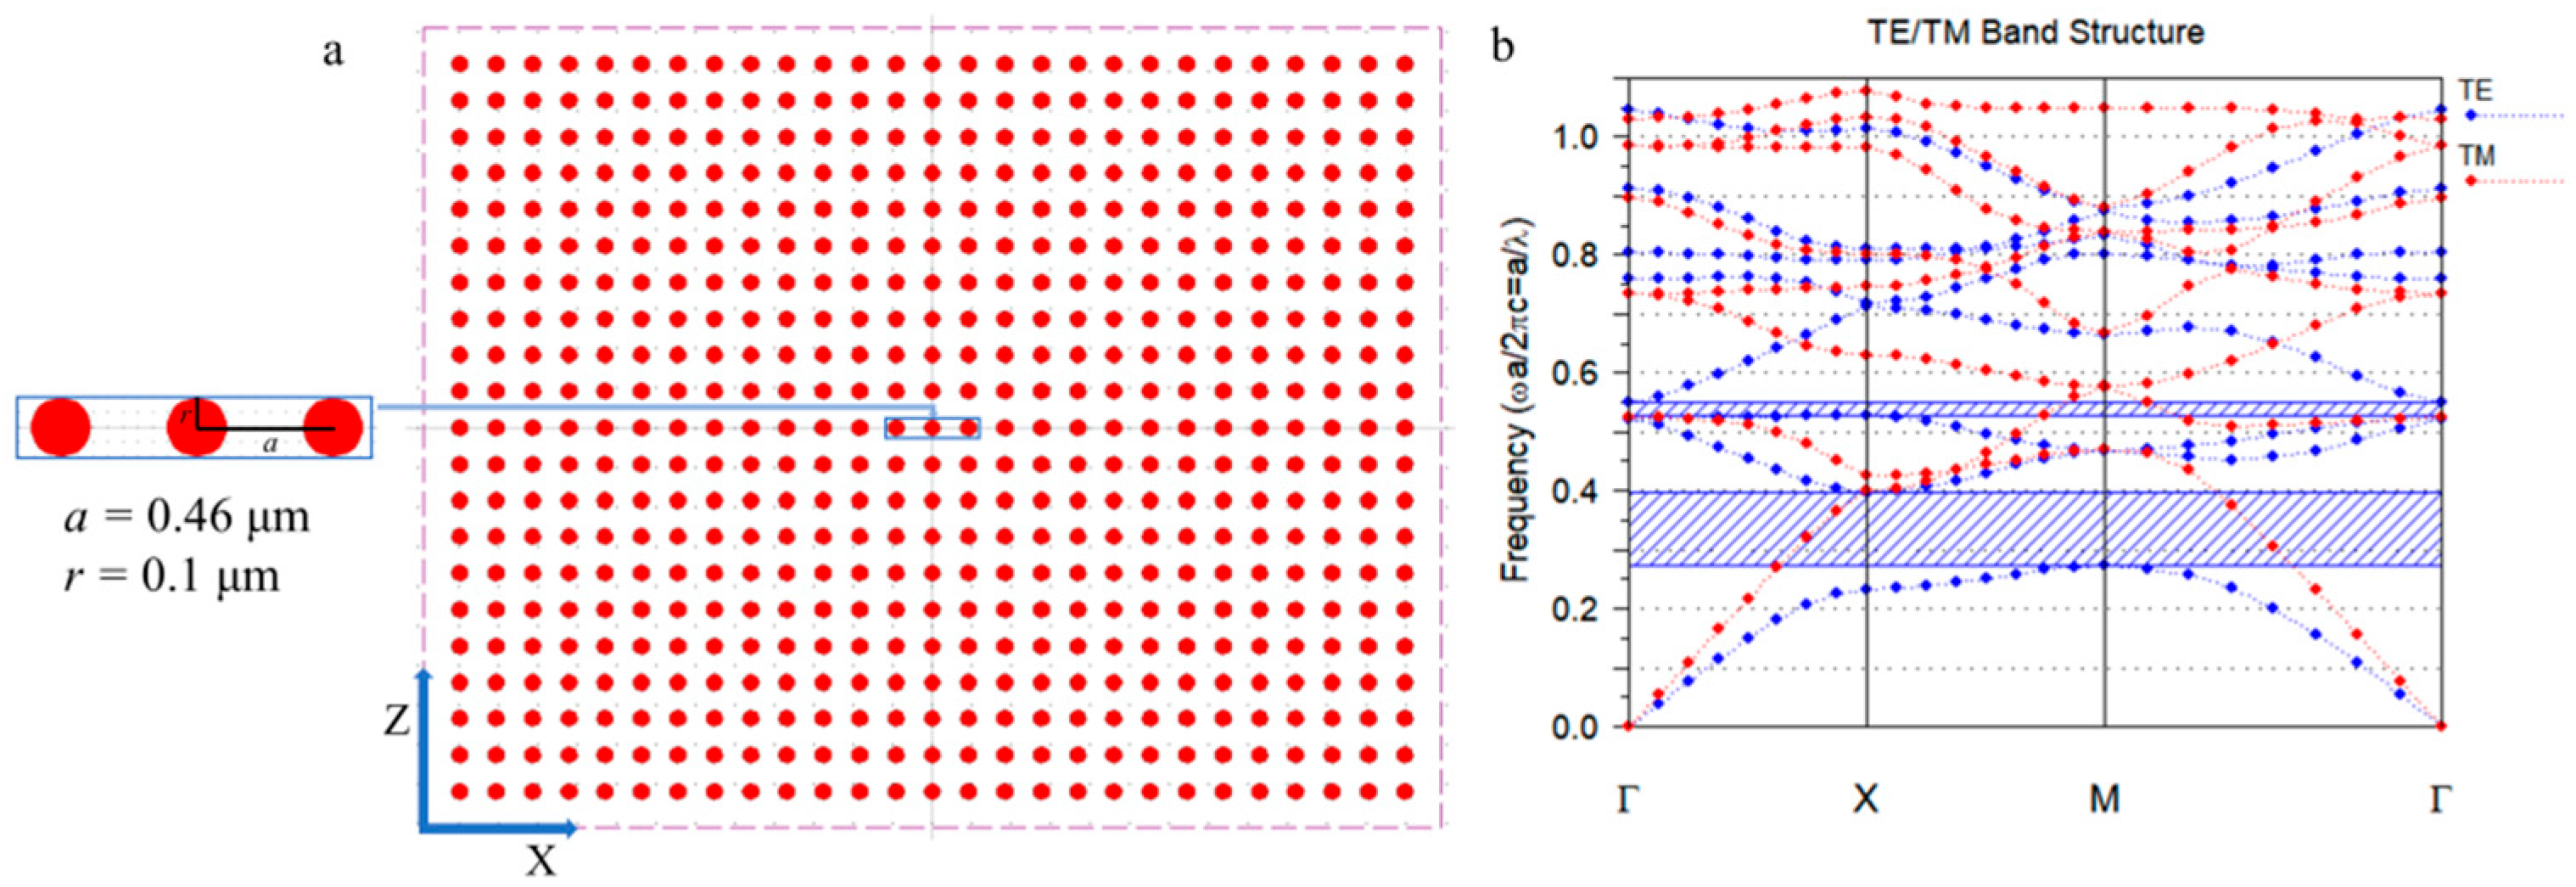
Figure 1. (a) Basic structure of a 2-D PhC formed by silicon dielectric rods periodically arranged in a square lattice in air (b) Bandgap diagram of the 2-D perfect PhC structure.
Photonics 12 00875 g001
Figure 2. Structural design diagram of the 2-D PhC microcavity gas sensor.
Photonics 12 00875 g002
Figure 3. Refractive indices of seven gases (including air).
Photonics 12 00875 g003
Figure 4. (a) Transmission spectra obtained at the waveguide output of the 2-D PhC microcavity sensor (b) wavelength values at the resonant peaks of the transmission spectra for seven gases (including air) and the linear fitting curve corresponding to the refractive index of the gases.
Photonics 12 00875 g004
Figure 5. Basic structure of the 2-D PhC microcavity gas sensor after introducing the ring cavity.
Photonics 12 00875 g005
Figure 6. (a) Transmission spectrum at the sensor output after introducing the ring cavity (b) resonant wavelengths of the transmission spectra for seven gases and their linear fitting curve corresponding to refractive indices.
Photonics 12 00875 g006
Figure 7. Basic structural diagram of the further optimized 2-D PhC microcavity gas sensor (r1 = 0.08 μm).
Photonics 12 00875 g007
Figure 8. (a) Transmission spectrum at the output of the optimized gas sensor (b) resonant wavelength values of the transmission spectra for seven gases and their linear fitting curve corresponding to refractive indices.
Photonics 12 00875 g008
Table 1. Performance parameters of the sensor.
GasRefractive Indexλr (nm)TR (%)S (nm/RIU)QLoD (RIU)
Air1.000001337.91564.267Ref1408.332Ref
NH31.000371338.00564.319243.241437.1703.827 × 10−4
CH41.000441338.02364.303245.451437.1893.793 × 10−4
CO1.000481338.04164.306262.501383.7033.684 × 10−4
C2H21.000611338.07664.271263.931385.1723.660 × 10−4
C2H41.000701338.09464.256255.711385.1903.778 × 10−4
C2H61.000751338.11264.260262.671385.2093.678 × 10−4
Table 2. Performance parameters of the sensor after introducing the ring cavity.
GasRefractive Indexλr (nm)TR (%)S (nm/RIU)QLoD (RIU)
Air1.000001343.28964.858Ref420.435Ref
NH31.000371343.48764.882535.14421.1565.961 × 10−4
CH41.000441343.54264.874575.00423.4305.518 × 10−4
CO1.000481343.56064.871564.58430.6285.526 × 10−4
C2H21.000611343.63264.860562.30430.6515.555 × 10−4
C2H41.000701343.68664.853567.14425.7565.565 × 10−4
C2H61.000751343.72264.830577.33433.1795.373 × 10−4
Table 3. r1 = 0.08 μm, the performance parameters of the sensor.
GasRefractive Indexλr (nm)TR (%)S (nm/RIU)QLoD (RIU)
Air1.000001423.30272.049Ref2266.404Ref
NH31.000371423.64772.063932.432341.5256.521 × 10−5
CH41.000441423.70872.045922.732341.6256.589 × 10−5
CO1.000481423.72872.002887.502267.0837.076 × 10−5
C2H21.000611423.85072.110898.362421.5146.545 × 10−5
C2H41.000701423.93172.087898.572421.6516.544 × 10−5
C2H61.000751423.97172.055892.002421.7196.592 × 10−5
Table 4. Comparison of sensing parameters between the proposed sensor and other literature.
Sensing ParametersS (nm/RIU)Q
Suspended slotted photonic crystal cavities for high-sensitivity refractive index sensing [49]656--
A solution for detection of ethanol and methanol with overlapping refractive indexes based on photonic crystal ring resonator optical sensors [50]7561092
Design of a high Q-Factor label-free optical biosensor based on a photonic crystal coupled cavity waveguide [51]20313,360
This work9322421
Disclaimer/Publisher’s Note: The statements, opinions and data contained in all publications are solely those of the individual author(s) and contributor(s) and not of MDPI and/or the editor(s). MDPI and/or the editor(s) disclaim responsibility for any injury to people or property resulting from any ideas, methods, instructions or products referred to in the content.