1. Introduction
Sunlight exposure is a major environmental factor contributing to accelerated skin aging, ocular diseases, and increased risk of skin cancers. While traditional research emphasized UV radiation-induced direct damage, high-energy blue light (400–500 nm) within the visible spectrum has garnered significant attention due to its pronounced biological effects. Although blue light possesses lower single-photon energy than UV, its high abundance in daylight [
1] and the organizational penetration capacity bring substantial cumulative effects. Numerous studies confirm that blue light induces cellular damage via photosensitization, a mechanism driven by activation of endogenous chromophores such as riboflavin and its derivatives—flavin mononucleotide (FMN) and flavin adenine dinucleotide (FAD) [
2]. These photosensitive molecules are notably enriched in mitochondria, the cellular energy hubs. Once activated by light of a specific wavelength, these chromophores catalyze excessive reactive oxygen species (ROS) [
3,
4,
5]. As potent oxidants, ROS trigger intracellular oxidative stress, damaging critical biomolecules—particularly mitochondrial DNA—leading to irreversible harm [
6,
7,
8]. Notably, even daylight-intensity blue light elicits measurable physiological effects in human skin. Although the photochemical effects of blue light are used in photodynamic therapy [
9,
10], prolonged high-energy blue light exposure exacerbates DNA damage, promotes cellular apoptosis [
11], impairs skin barrier integrity, accelerates photoaging, and threatens ocular health [
12]. Specifically, it heightens risks of age-related macular degeneration (AMD), characterized by photoreceptor and retinal cell degeneration [
13,
14], and may elevate carcinogenic susceptibility [
15]. These risks underscore the critical need for daily blue light protection strategies and standard blue light experimental source evaluation criteria [
16].
The broad-spectrum sunscreen products currently available on the market focus on UVA and UVB protection [
17,
18], with a coverage of roughly 280–400 nm, but often provide insufficient protection against blue light. In order to provide more comprehensive photoprotection, future sunscreen products need to extend their protection to the blue light portion of visible light [
19,
20]. Jo et al. gathered 20 volunteers and selected their back skin for the experiment [
21]. Four products with different dosing regimens were used simultaneously to differentiate between protected and unprotected skin areas, irradiated with different doses of (central wavelength of 456 nm, bandwidth of 20 nm) blue light LED devices. The dose that caused the lowest visible and persistent pigmentation—visually assessed Minimum Persistent Tanning Dose (MPPD)—was determined by the changes in the skin area after 2–4 h of irradiation. The PB value is an indicator to define the blue light blocking ability of the product, and the formula is as follows:
where
MPPDp and
MPPDu denote the
MPPD values for protected and unprotected skin, respectively. The experiment evaluated the blocking efficacy of TiO
2 against 456 nm blue light, by comparing pigmentation changes at different time points over 72 h of irradiation across four formulations: those containing TiO
2, organic sunscreens, both, or neither. The results confirmed that 456 nm blue light induces skin pigmentation and demonstrated TiO
2’s significant protective effect against this wavelength.
The self-developed blue light irradiation system represents a critical component of this clinical study. Any deviation of the emitted 456 nm blue light from experimental quality standards could impact subsequent results. According to China’s 2025 regulatory standard [
22], light sources for evaluating blue light protection efficacy must meet the following standards: non-laser emission, stable output of continuous or discontinuous light within 400–500 nm, and ≤1.00% irradiance outside this range (λ < 400 nm or λ > 500 nm). To address these requirements, we developed a spectral simulation model based on empirical data. The proposed model structure is partly motivated by known broadening and dispersion mechanisms observed in real LED spectra; the model integrates EMG function and APV function to reconstruct full emission spectra using two key input parameters—the central wavelength and the bandwidth. By simulating energy distribution within the 400–500 nm range under varying bandwidth conditions, the model predicts a range of central wavelengths that satisfy the ≤1% irradiance threshold. This predictive capability enables pre-experimental screening or customization of light sources, thereby enhancing the precision and efficiency of blue light-related studies.
A variety of empirical models have been developed to approximate the emission spectra of LEDs. These models range in complexity, finding a balance between computational simplicity and descriptive accuracy. Simpler methods, such as the single Gaussian function, are computationally efficient but often fail to capture the inherent asymmetry of typical LED spectral profiles [
23]. To address this limitation, more sophisticated models have been proposed. These include split-Gaussian and multiple Gaussian functions, which offer greater flexibility to fit asymmetric shapes at the cost of an increased number of fitting parameters, with a risk of overfitting [
24,
25]. For more precise curve fitting, functions like the Pearson VII and its variants have been employed. The Pearson VII function is particularly versatile, capable of representing a range of peak profiles from Lorentzian to Gaussian, thus accommodating various spectral tailing behaviors [
26]. Furthermore, the Voigt and pseudo-Voigt functions are well-recognized in spectroscopy for their solid physical basis. The Voigt profile, a convolution of Gaussian and Lorentzian functions, effectively models the spectral line broadening mechanisms arising from both inhomogeneous and lifetime (homogeneous) broadening. The pseudo-Voigt function serves as a computationally less expensive approximation of the Voigt profile [
27,
28,
29]. Advanced models are trending toward hybrid and more complex solutions, yet they often suffer from an inherent parameter redundancy. This large number of parameters increases computational costs and blurs the physical properties of the model. Therefore, developing a model that can accurately represent spectra while maintaining a concise and physically meaningful structure remains a pressing challenge in the field.
To address these challenges, this study proposes a compact and phenomenologically informed model that combines an EMG function with an APV function. The EMG component captures the long-wavelength tail behavior typically seen in LED spectra, while the APV component adjusts local asymmetry near the peak. The model requires only two user inputs—peak wavelength and bandwidth—and can accurately reconstruct LED spectral profiles using a minimal set of interpretable parameters.
This paper presents the structure and parameterization of the EMG+APV model, validates its performance across multiple LED types, and compares its ability to match key spectral characteristics, particularly the blue light energy distribution in the 400–500 nm band. The results demonstrate that the proposed model is suitable for rapid spectral simulation and pre-evaluation of LED sources in photobiological safety and optical metrology applications.
2. Principle and Data Collection
Blue light, encompassing visible wavelengths from 400 to 500 nm, is primarily generated by LEDs. The spectral characteristics are predominantly governed by two parameters—central wavelength and bandwidth—which together define the energy distribution [
30]. The central wavelength acts as the spectral “anchor,” pinpointing the wavelength of peak energy concentration. In visible light, it determines perceived color. In the electromagnetic spectrum (e.g., UVC, UVB, UVA, visible, near-infrared), it distinguishes radiation categories. Shifting the central wavelength redistributes spectral energy, significantly altering optical properties. Bandwidth quantifies the energy spread around the central wavelength, reflecting the spectral distribution range. Narrow bandwidths (<0.1 nm in lasers) concentrate energy near a single wavelength, whereas broader bandwidths reduce peak intensity and increase off-central wavelength contributions under constant total power. Thus, central wavelength and bandwidth collectively delineate spectral energy distribution. Accurate determination of central wavelengths in blue LEDs is achievable through spectroscopic measurements, whereas bandwidth assessment remains susceptible due to instrumental broadening effects. Discrepancies in spectrometer resolution may lead to inconsistent bandwidth values for the same light source, thus affecting the judgment of the specification criteria for the light source. To reduce such instrument-induced variability, computational simulations offer a robust alternative program for pre-evaluation of spectral compliance [
31].
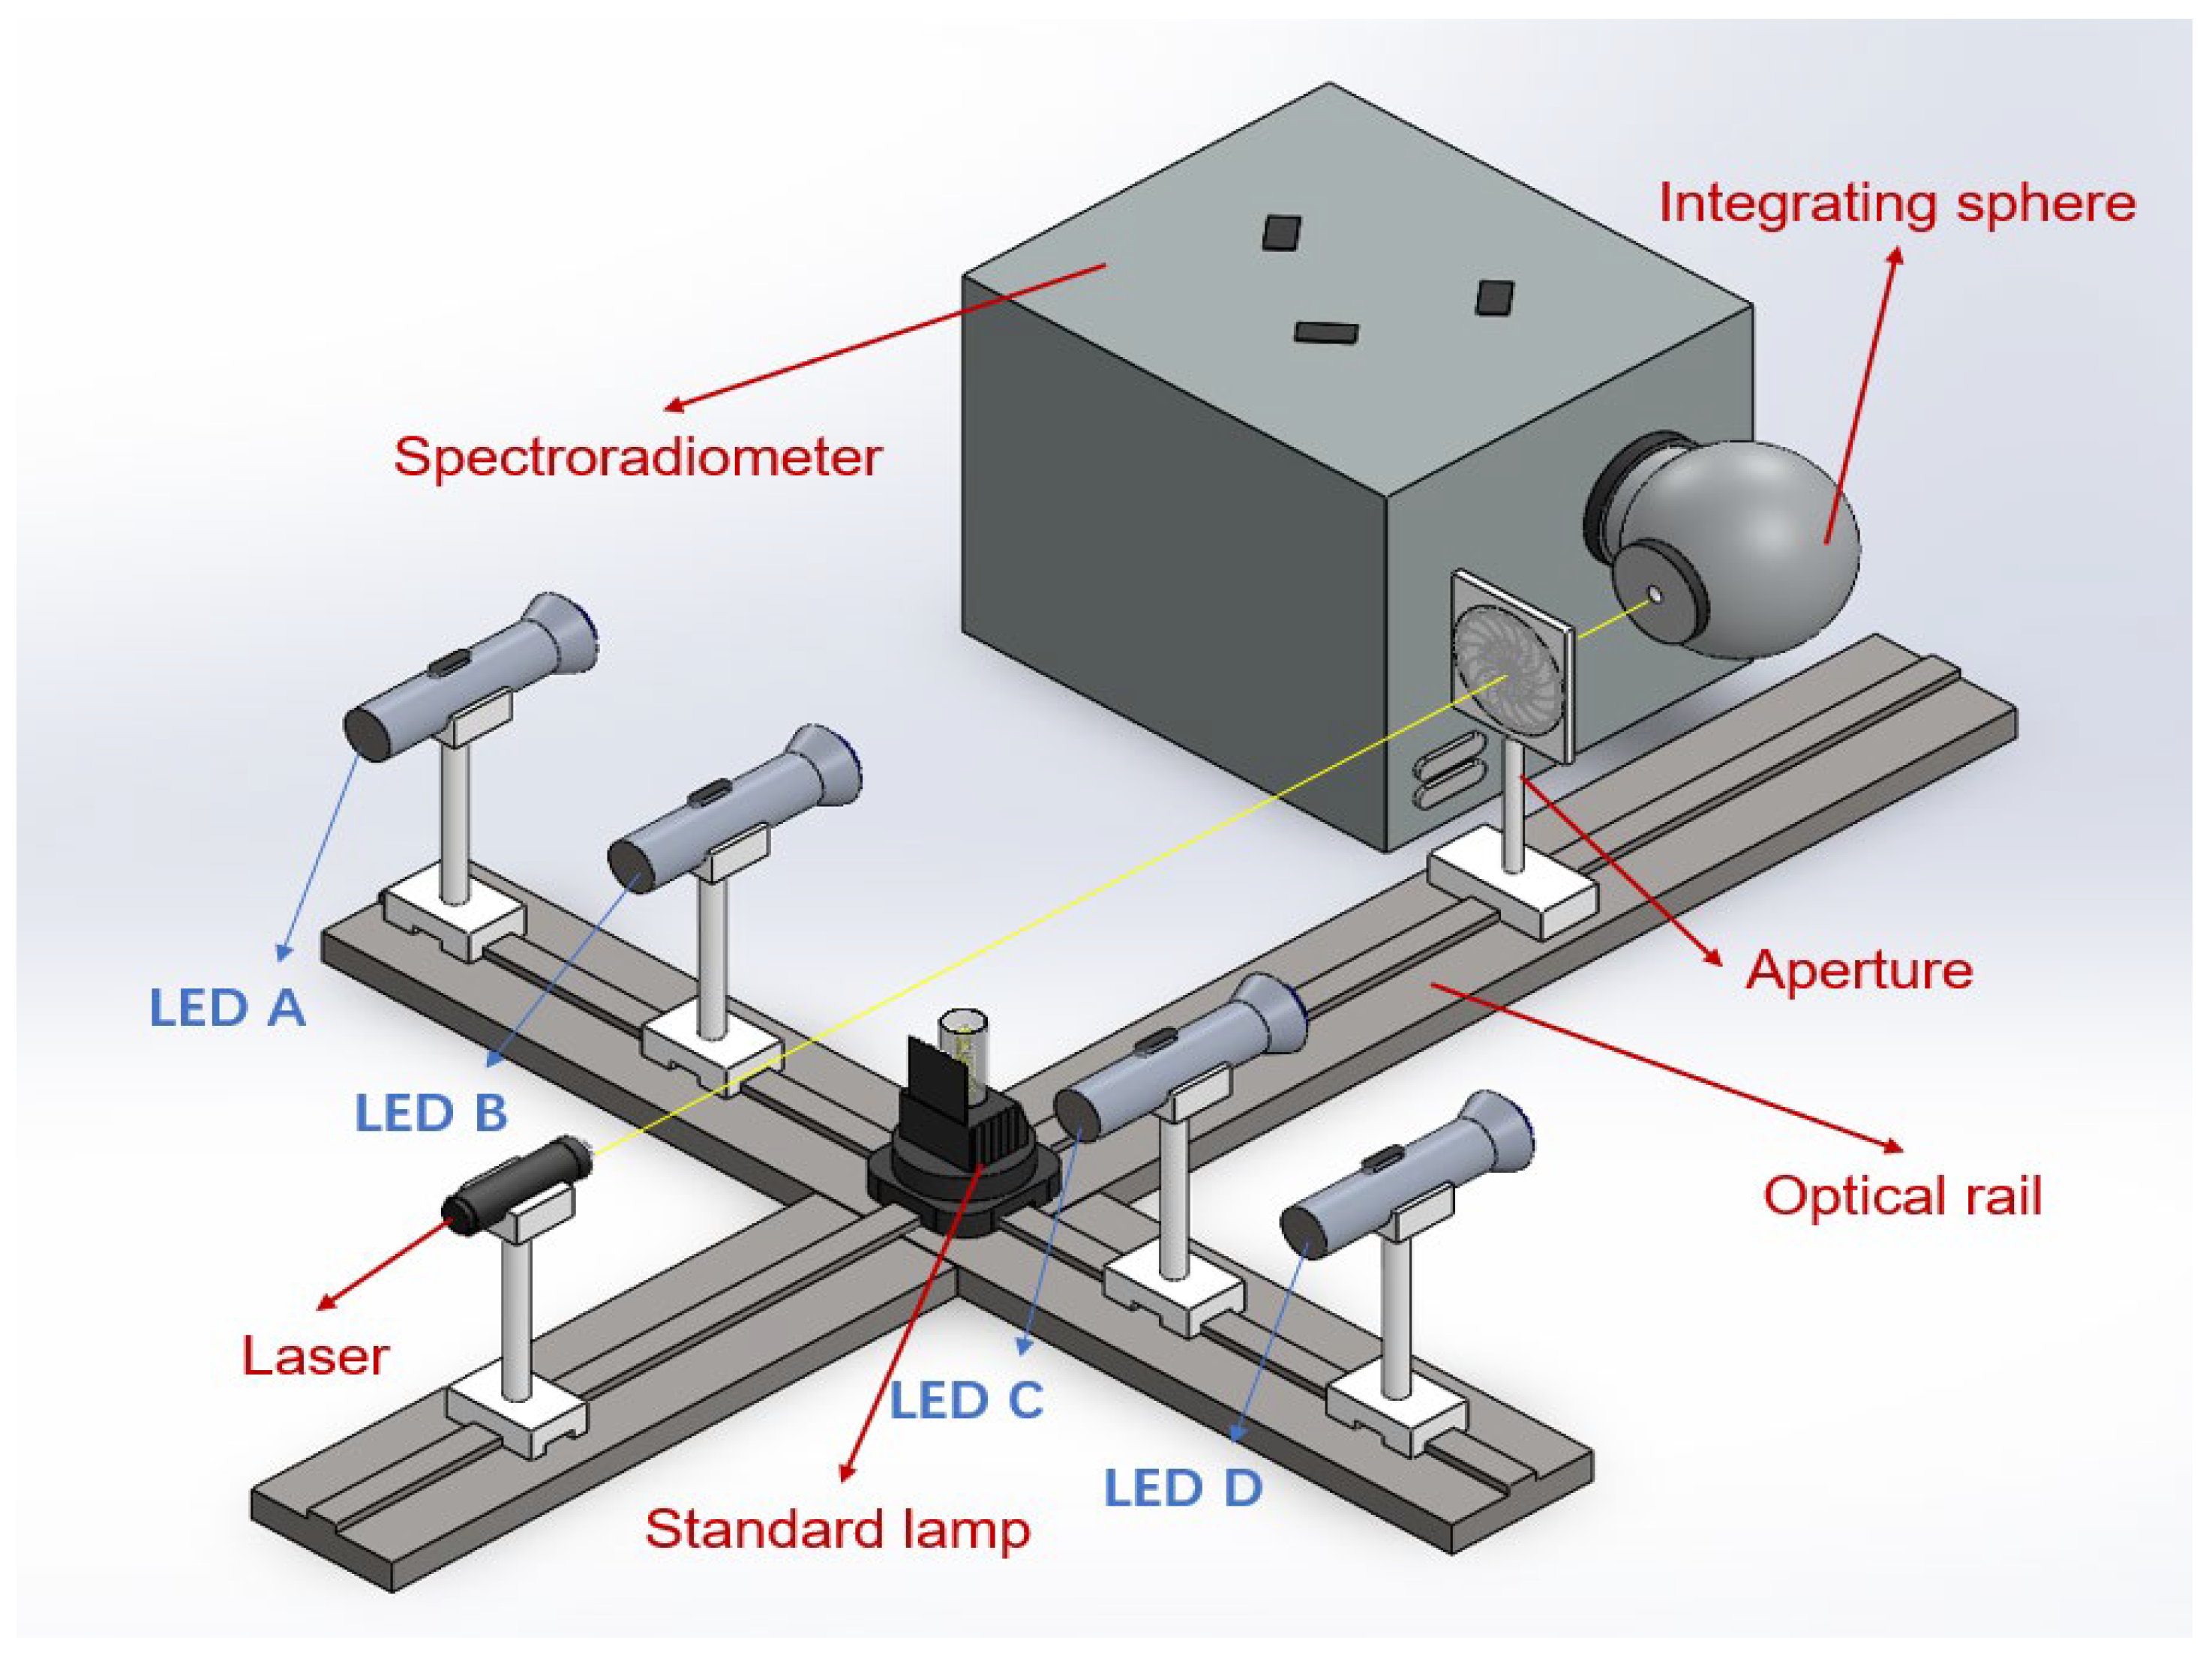
The peak wavelength corresponds to the wavelength of maximum spectral intensity. For relatively symmetric spectra, the central wavelength approximates the peak wavelength. In this study, the blue light spectrum exhibits relative symmetry, enabling the central wavelength to represent peak wavelength in subsequent analyses. Spectral data were acquired from four distinct blue LEDs (labeled LED A–D) using a measurement system comprising a blue LED light source, an integrating sphere, a calibrated spectroradiometer and data acquisition software. The experimental setup is shown in
Figure 1.
Prior to the blue LED experiments, the spectrometer was calibrated using a standard lamp [
32,
33,
34]. The calibration procedure commenced by mounting the standard lamp and aperture on the same optical rail, followed by optical collimation of the standard lamp, aperture, and integrating sphere using a collimating laser. After preheating the standard lamp to thermal stability, the spectrometer’s spectral responsivity was calibrated. Subsequently, four blue LEDs (labeled A–D) were sequentially positioned at the standard lamp location. For each LED, the optical rail (LED → aperture → integrating sphere) was realigned prior to data acquisition measurements. All experiments were conducted in a darkroom maintained at 23 °C (±2 °C) to eliminate ambient stray light interference.
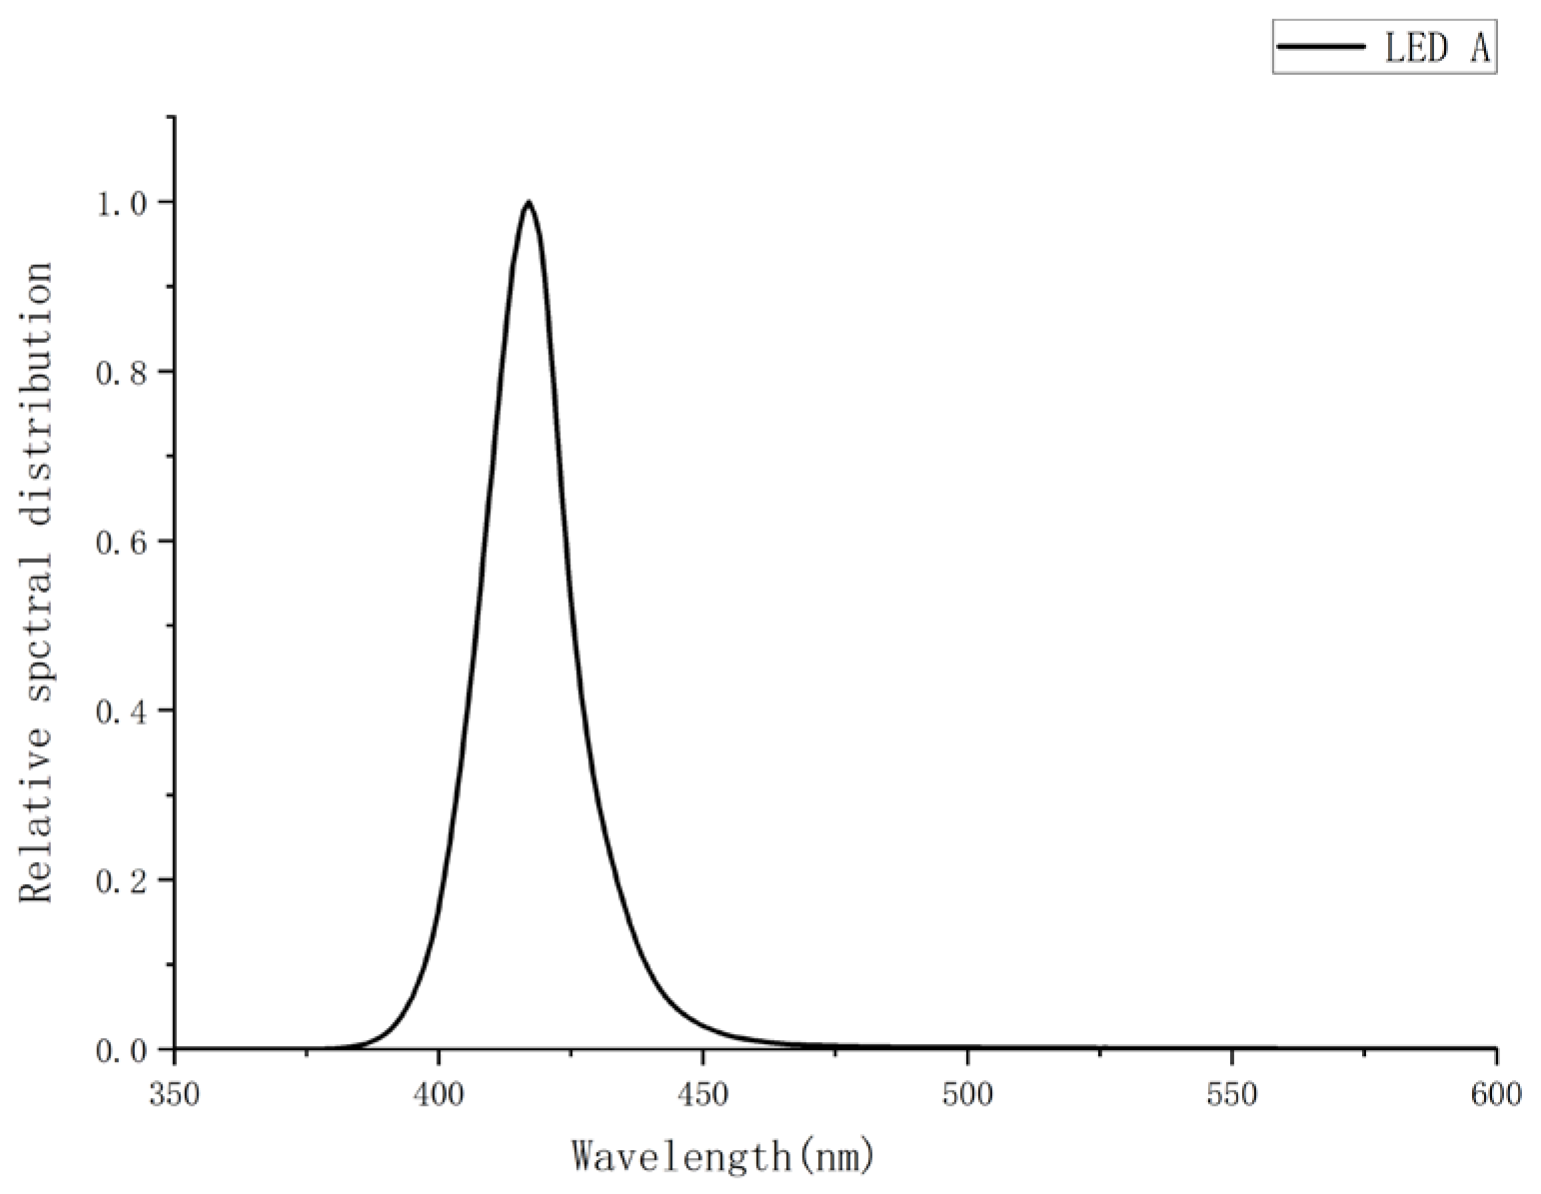
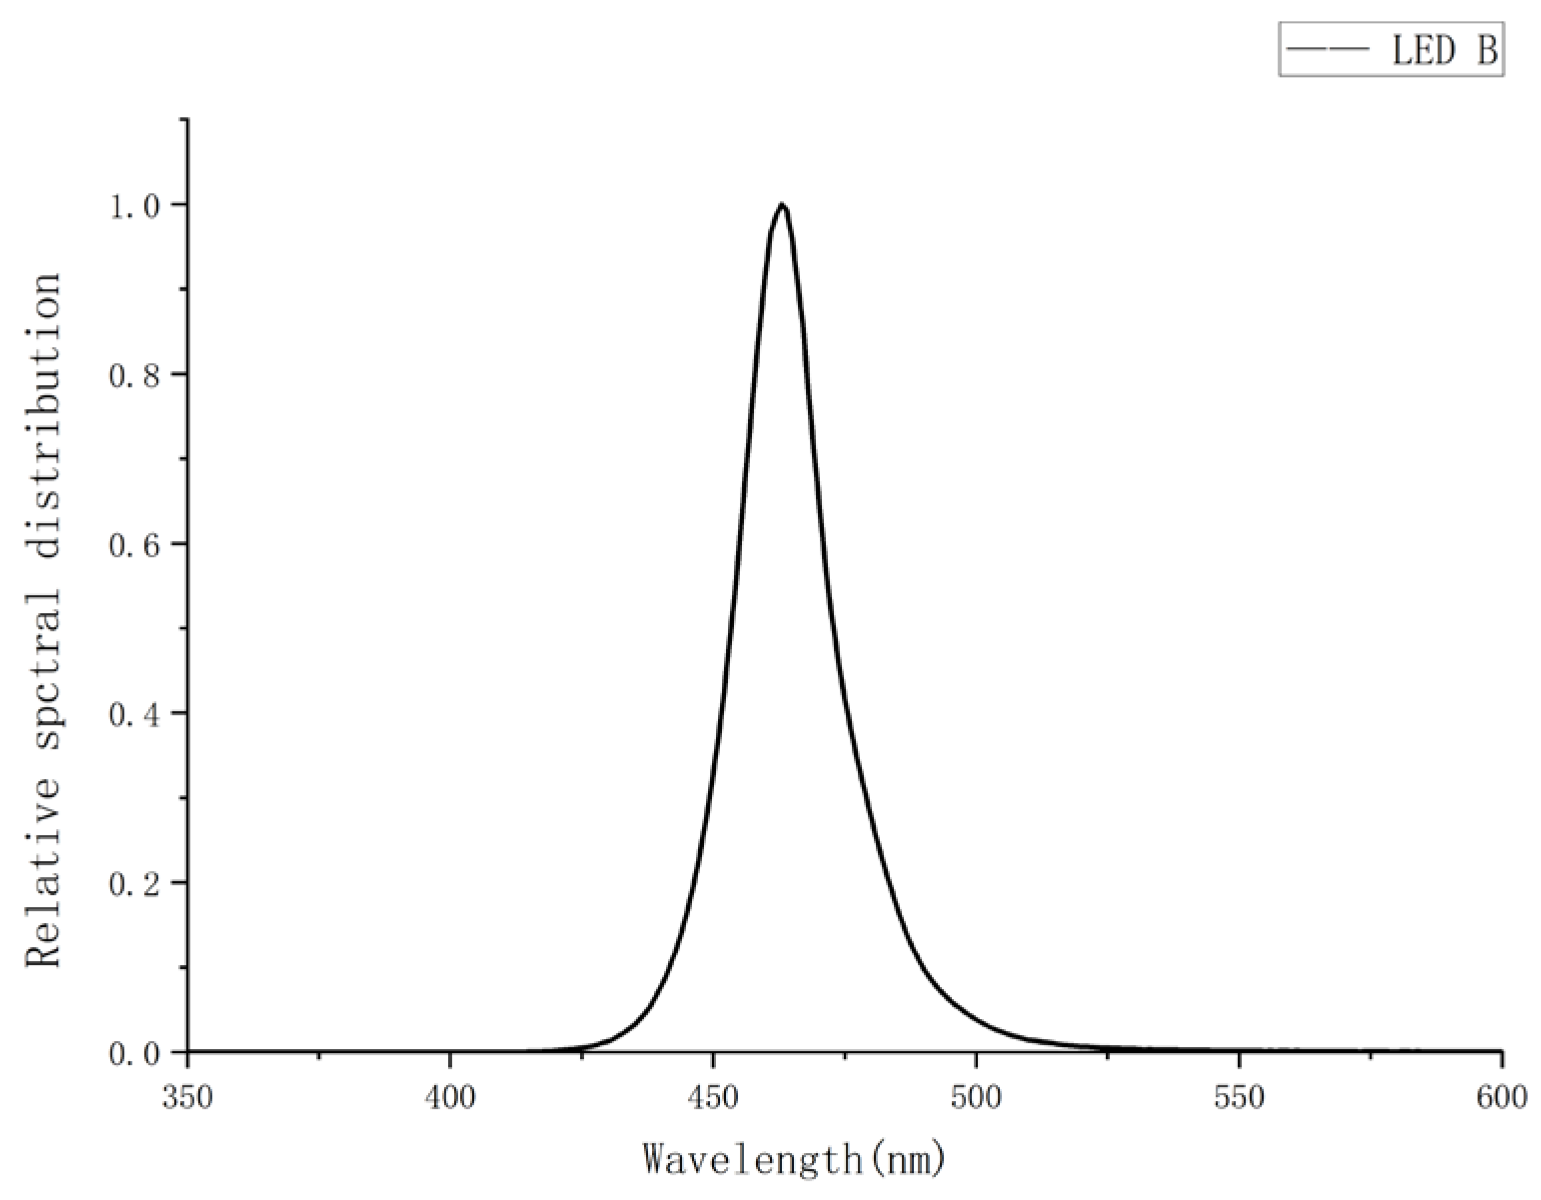
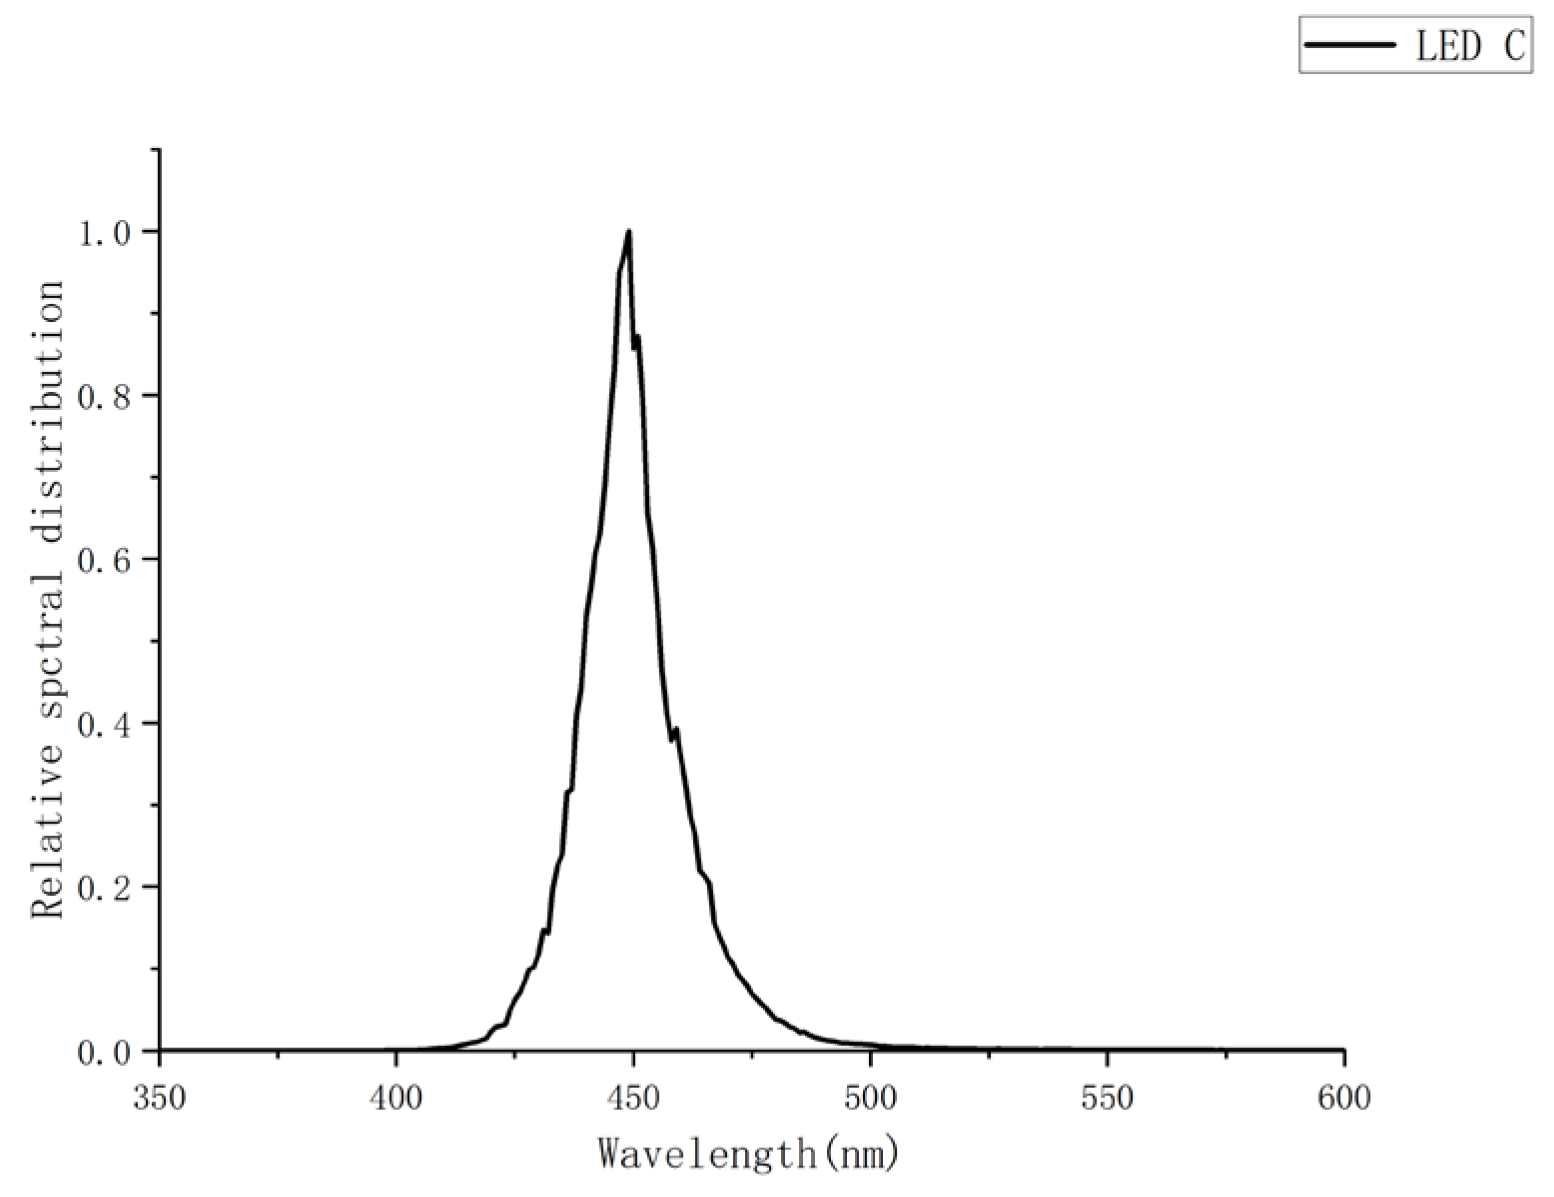
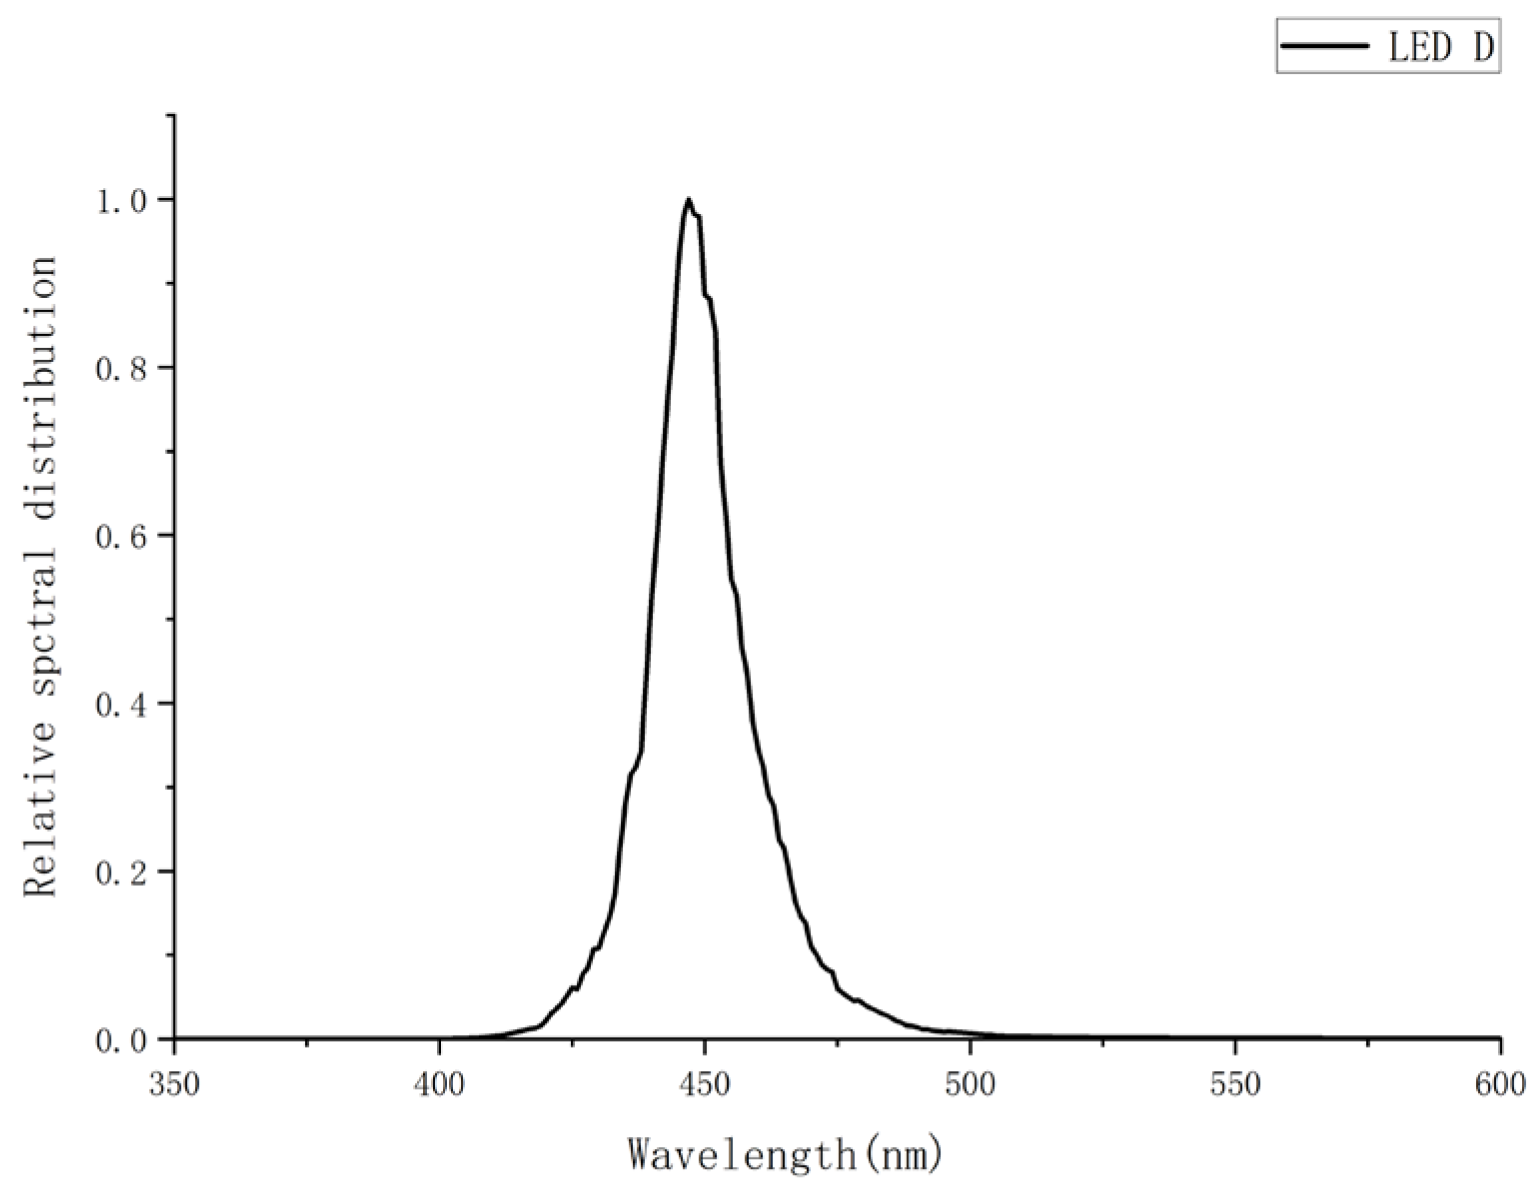
Raw spectral data were acquired from steady-state emission spectra measurements of LEDs A–D using the aforementioned experimental setup. Three independent spectral measurements were conducted per LED to evaluate spectral repeatability. Initial measurements identified central wavelengths at 417 nm (LED A), 463 nm (LED B), 446 nm (LED C), and 447 nm (LED D). To fully capture emission peaks and adjacent baselines, spectral data were recorded across 250–800 nm. All spectra underwent peak normalization by dividing each dataset by its respective maximum intensity, making the peak intensity of all spectra 1. This process facilitates comparison of different measurements or spectral shapes of different LEDs and alleviates absolute intensity variations. Baseline integrity in non-emissive regions (λ < 400 nm and λ > 500 nm) was verified. For spectra exhibiting significant non-zero baselines or low-frequency drift, a third-order polynomial was fitted to non-emitting spectral regions (λ < 400 nm and λ > 500 nm), and the fitted baseline was subtracted from the full spectrum to correct for baseline drift [
28].
3. Establish and Optimize Models
3.1. Physical Motivation for Model Structure
Blue LED emission spectra often exhibit asymmetric shapes, with a steeper rising edge on the shorter-wavelength side and a smoother falling decay on the longer-wavelength side. These characteristics arise from a combination of physical phenomena such as carrier recombination lifetimes, material dispersion, reabsorption effects, and temperature-induced shifts within the LED package. For example, the recombination process contributes to lifetime broadening, typically producing exponential tails in the emission spectrum. Similarly, the interaction of light with phosphor materials and encapsulants can introduce spectral skewness and peak broadening, particularly on the long-wavelength side.
To approximate these observed features, we adopt a phenomenological model using the EMG and APV functions. The EMG component effectively captures the exponential tail behavior associated with recombination dynamics, while the APV component introduces controlled asymmetry through independently tunable left and right widths and a mixing factor between Gaussian and Lorentzian profiles. This combination allows the model to flexibly reproduce measured LED spectra with minimal input parameters, while remaining consistent with known emission behavior.
3.2. Pre-Processed Datasets and Normalization
The pre-processed datasets were employed for spectral simulation modeling, with the average value of each dataset selected as the representative spectral data for the respective LED type. The spectral distributions of the four blue LEDs are shown in
Figure 2,
Figure 3,
Figure 4 and
Figure 5.
The percentage of spectral intensity within the 400–500 nm range is calculated as
where Xi represents the discrete wavelength points uniformly sampled from 250 nm to 800 nm with an interval of approximately 0.275 nm, and I(Xi) is the normalized spectral intensity at each point. The summation is effectively approximated using trapezoidal numerical integration to compute the cumulative intensity over both the entire range and the 400–500 nm band.
The intensity percentages within the 400–500 nm range for the four datasets were measured as follows: LED A = 95.85%, LED B = 97.81%, LED C = 99.20%, and LED D = 99.30%. Among these, LED C and D met the specification requirement of an intensity percentage exceeding 99.00%.
The qualified spectra of LED C and D exhibited a single-peak structure centered at approximately 450 nm. Further analysis revealed asymmetry in the spectral profile—the rising edge near 400 nm was steeper, while the falling edge near 500 nm was more smoother.
3.3. Results of Gaussian and Voigt Fitting
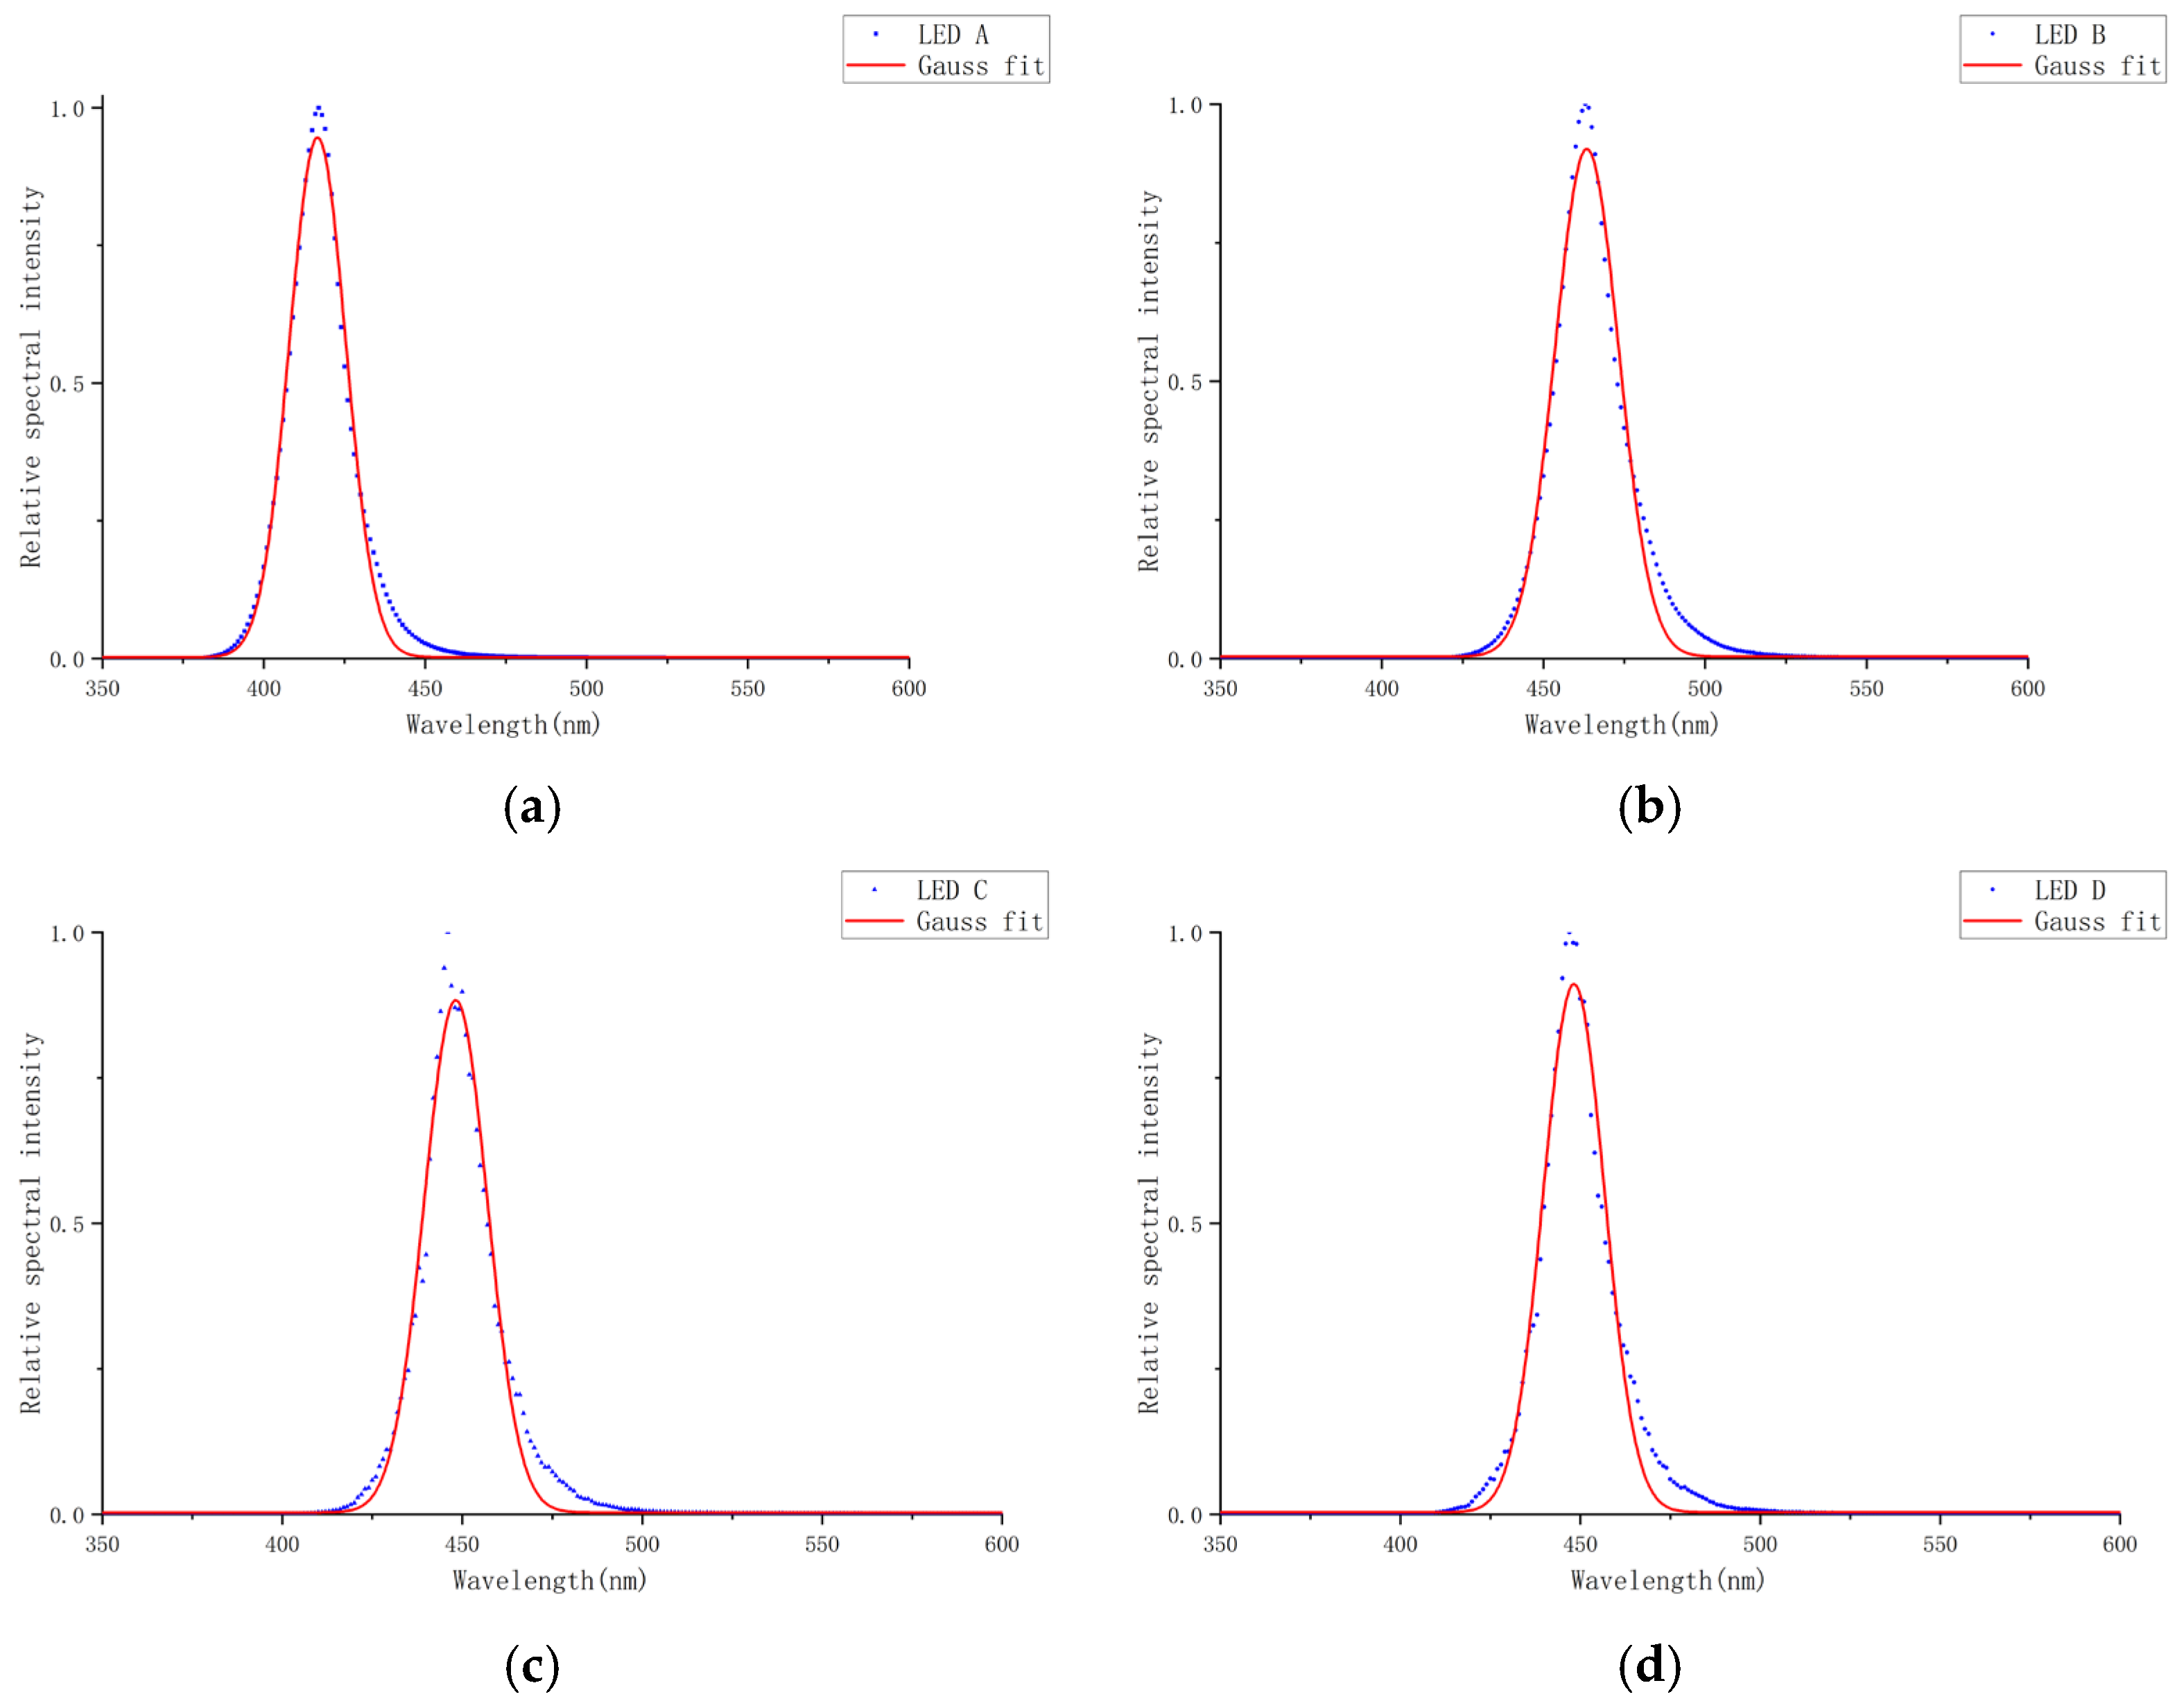
Based on the spectral characteristics, the experimental data were fitted using a standard Gaussian function, as shown in
Figure 6.
The standard Gaussian function is widely used to model ideal symmetric broadening [
35]. While it approximates peak positions and widths (
Figure 6), significant discrepancies exist between simulated and experimental spectra, particularly in peak shapes and falling edges, due to its inability to replicate observed asymmetry.
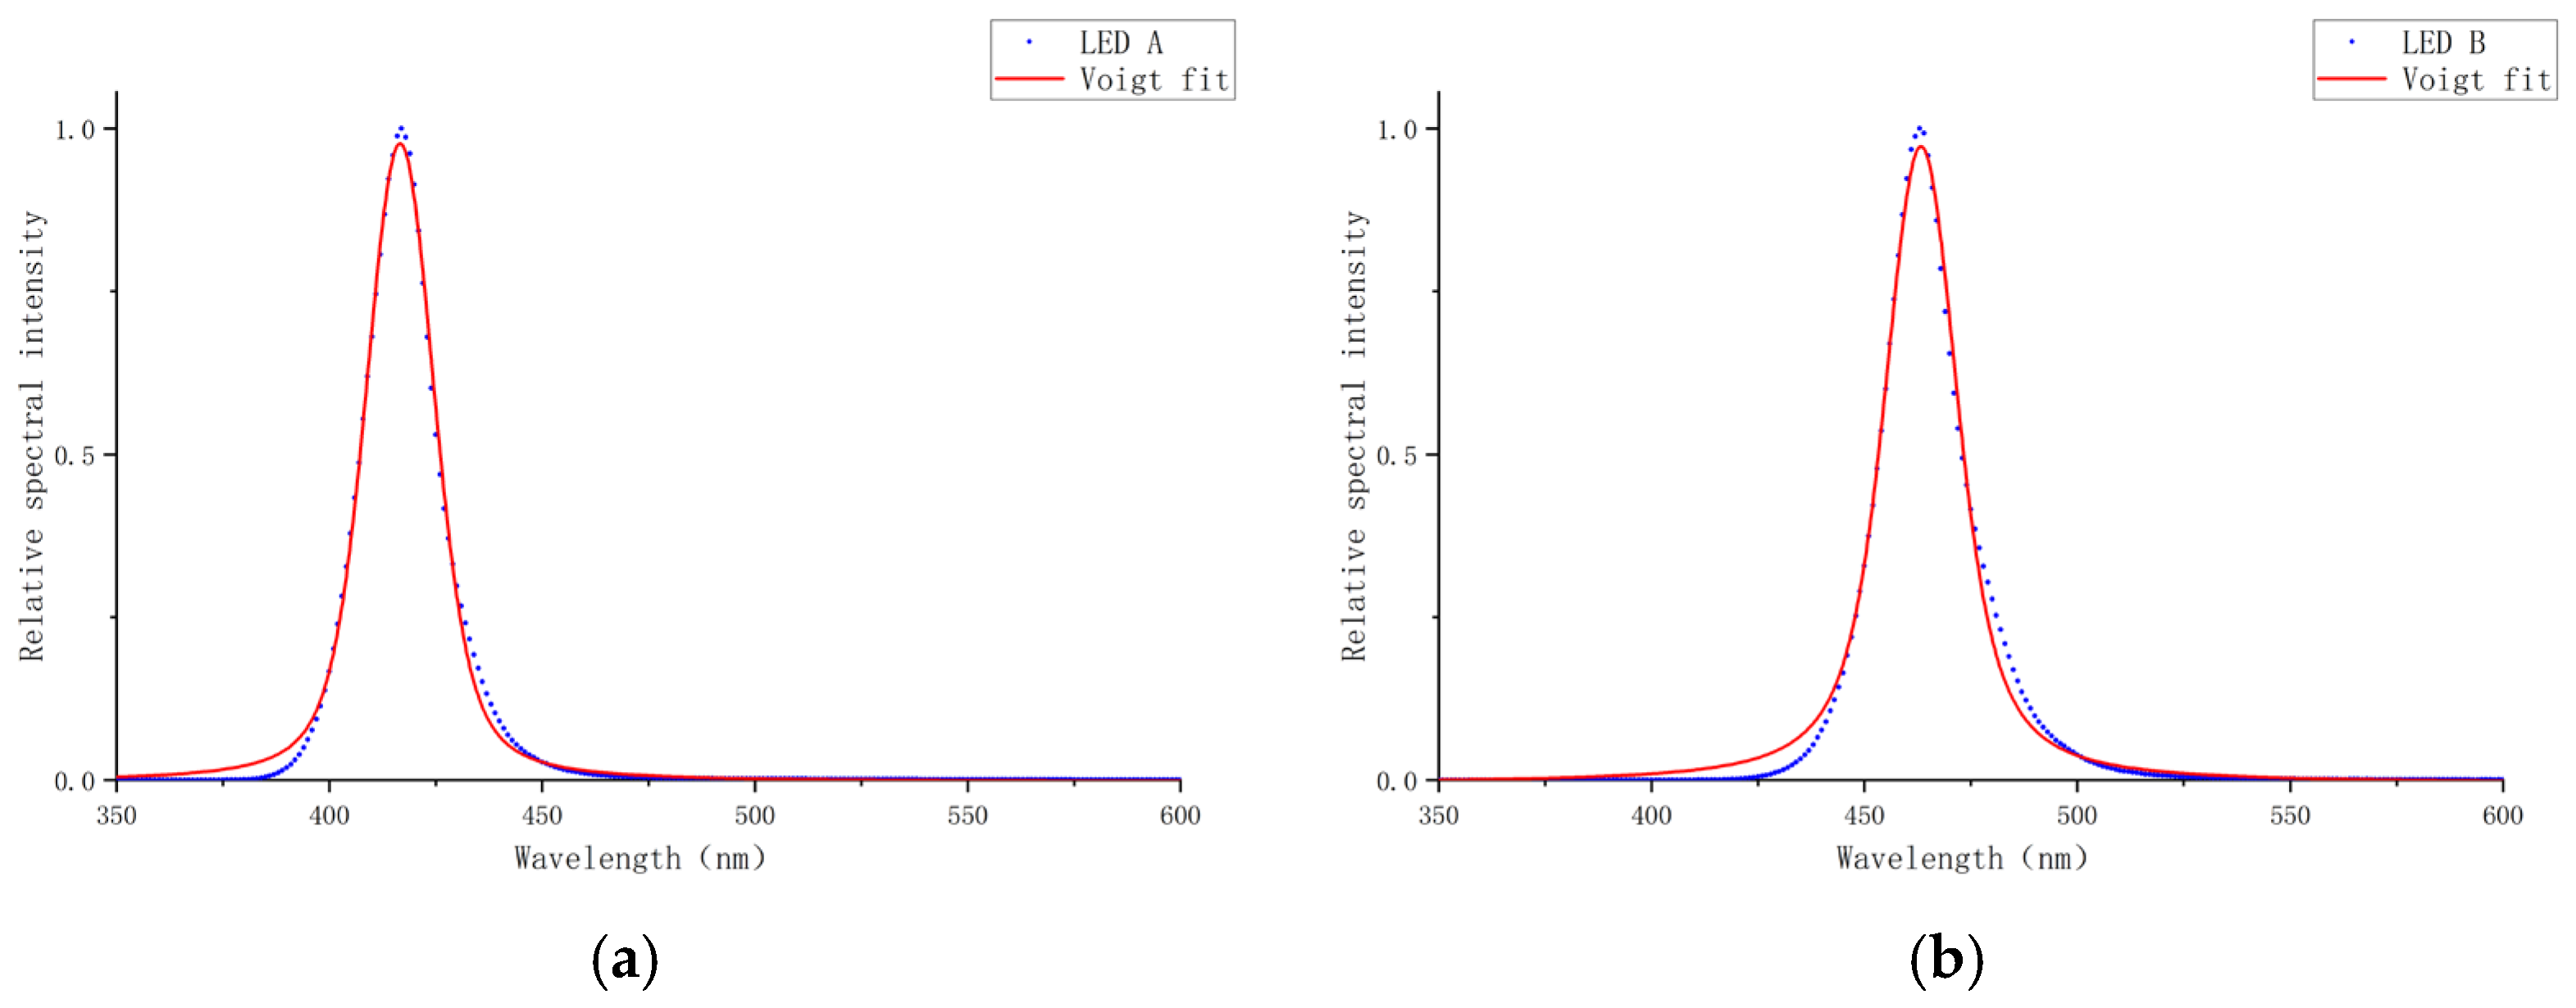
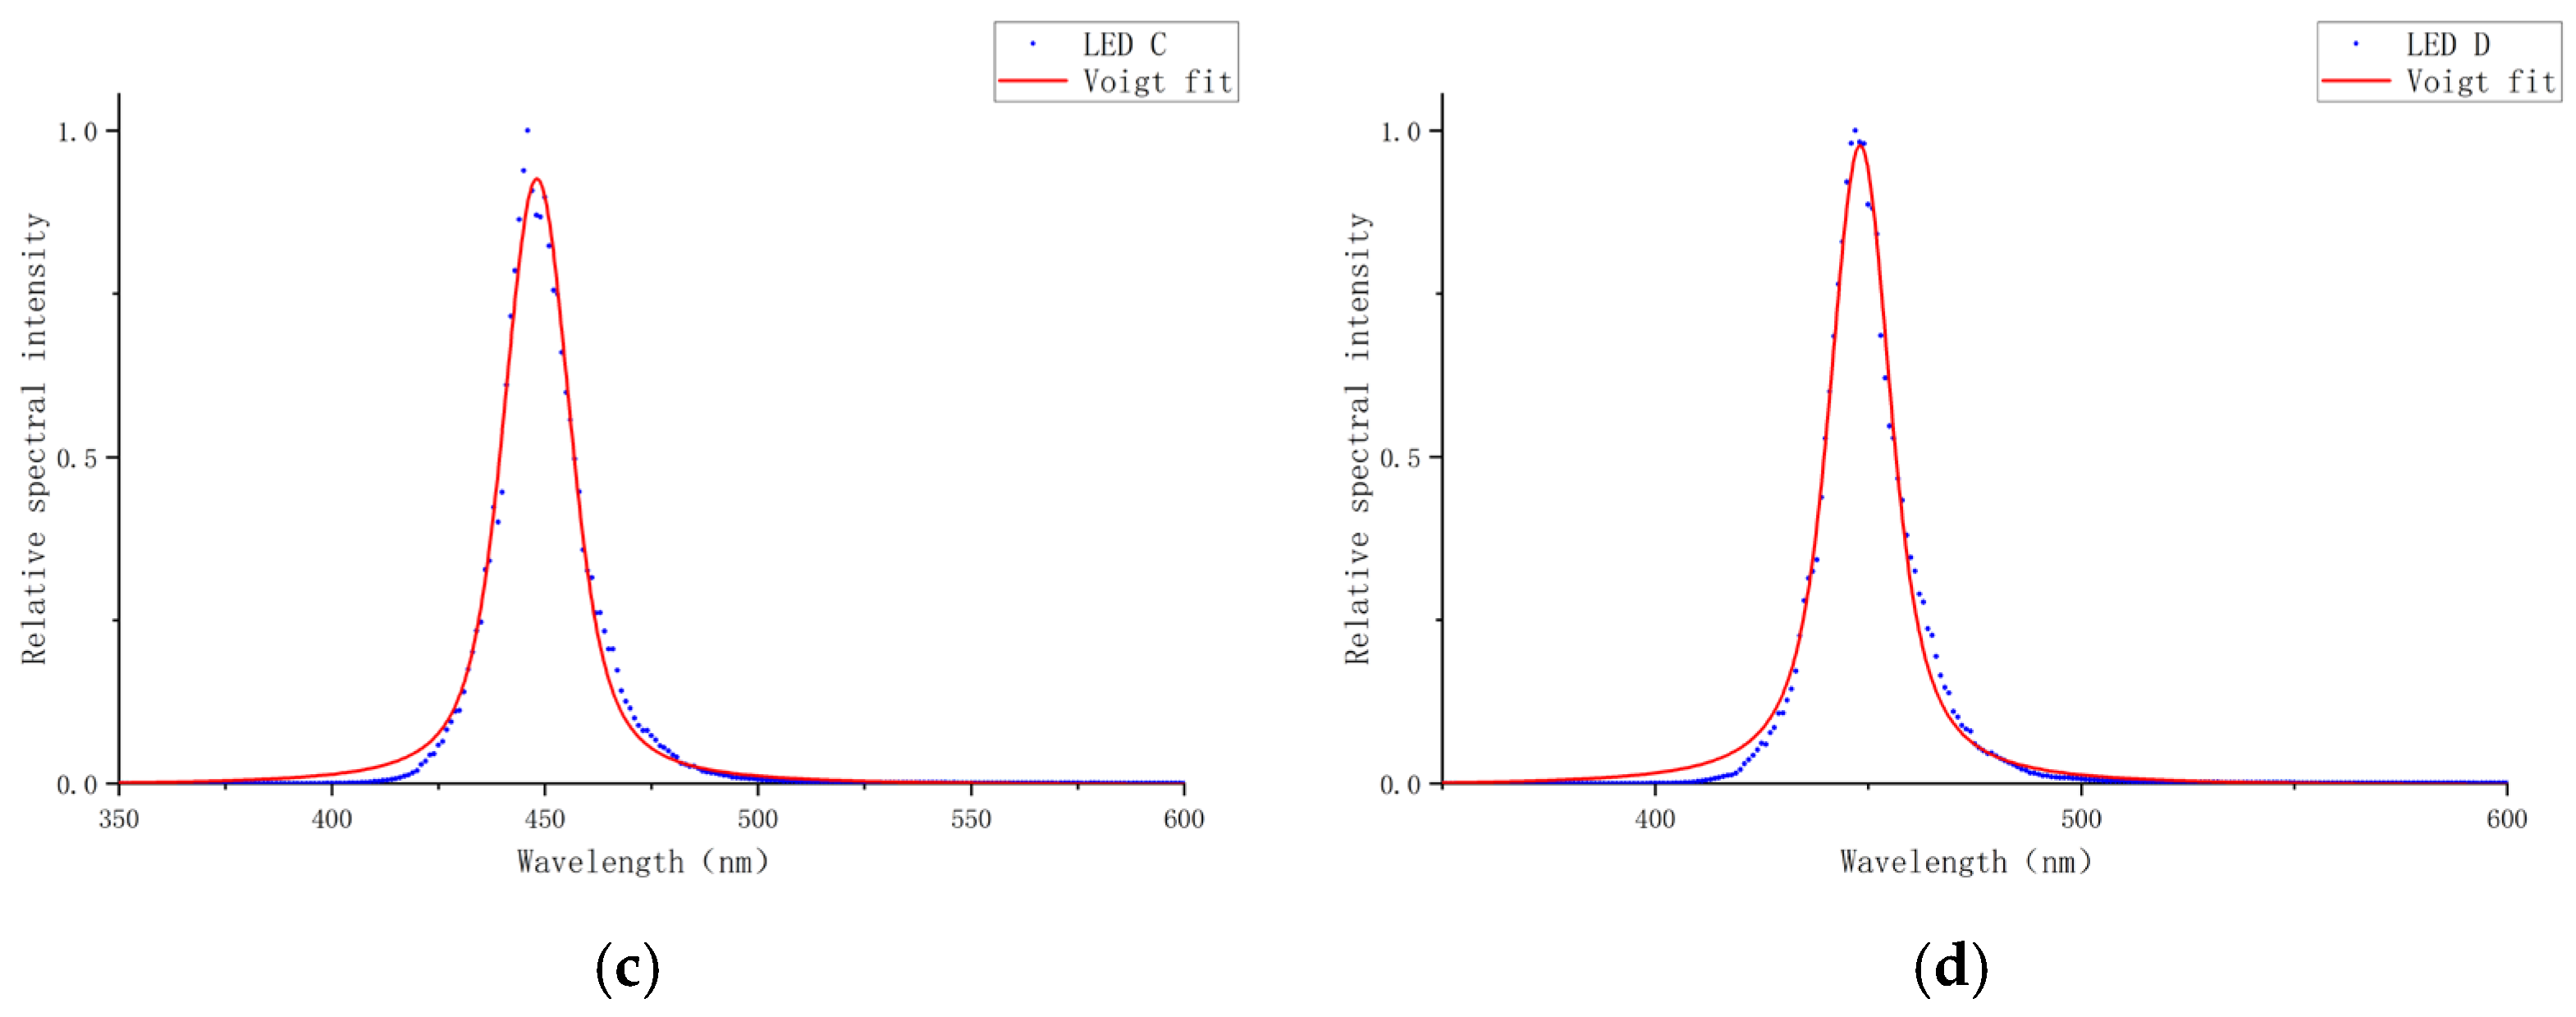
To provide a more comprehensive comparison against established symmetric line shapes, the spectrum of the experimental LEDs’ data was also fitted using a standard Voigt profile [
36]. The comparison of the fitted spectra is shown in
Figure 7.
As illustrated in the spectral fitting results, the Voigt profile exhibits clear limitations in capturing the inherent asymmetry of the experimental spectrum. This deficiency is most pronounced along the steeply rising edge, where a notable discrepancy emerges between the fitted curve and the experimental data.
In summary, both the Gaussian and Voigt functions are fundamentally limited by their symmetry, leading to significant deviations at the rising edge, falling edge, and peak of the LED spectrum. To address these inaccuracies, this study introduces a model based on the EMG function, which inherently captures spectral asymmetry, and further refines it with a corrective component.
3.4. EMG Profile Construction
The blue light spectrum exhibits a smooth falling edge, prompting the adoption of an asymmetric peak model. We employed the EMG function—a convolution of Gaussian and exponential decay functions—originally developed for chromatographic peak tailing [
37]. This approach, though rooted in chromatography, proves adaptable to spectral analysis. The EMG function is defined as
is the independent variable, which represents the wavelength in the model;
represents the spectral intensity at the corresponding wavelength ;
is the magnitude factor, which affects the total area and height of the spectrum;
is the average of the Gaussian component inside the function;
is the standard deviation of the Gaussian component inside the function;
is the time constant of the exponential decay function, indicates that the larger the asymmetry is, the more significant and the smoother the tendency along the falling edge;
is the complementary error function, which is a form of the integration of the Gaussian function.
In the EMG function [Equation (3)], the parameters μ and σ are determined through nonlinear optimization. Specifically, given user-defined target values of center wavelength and FWHM, we apply an iterative fitting process that adjusts μ and σ to minimize the squared relative error between the simulated and target peak positions and FWHMs. The asymmetry parameter τ is calculated using the relation τ = α·σ, where α is a user-defined asymmetry factor (e.g., 1.8 in our simulations). The magnitude factor A is not explicitly fitted, as all spectra are normalized so that the peak intensity is equal to 1, ensuring comparability across simulations.
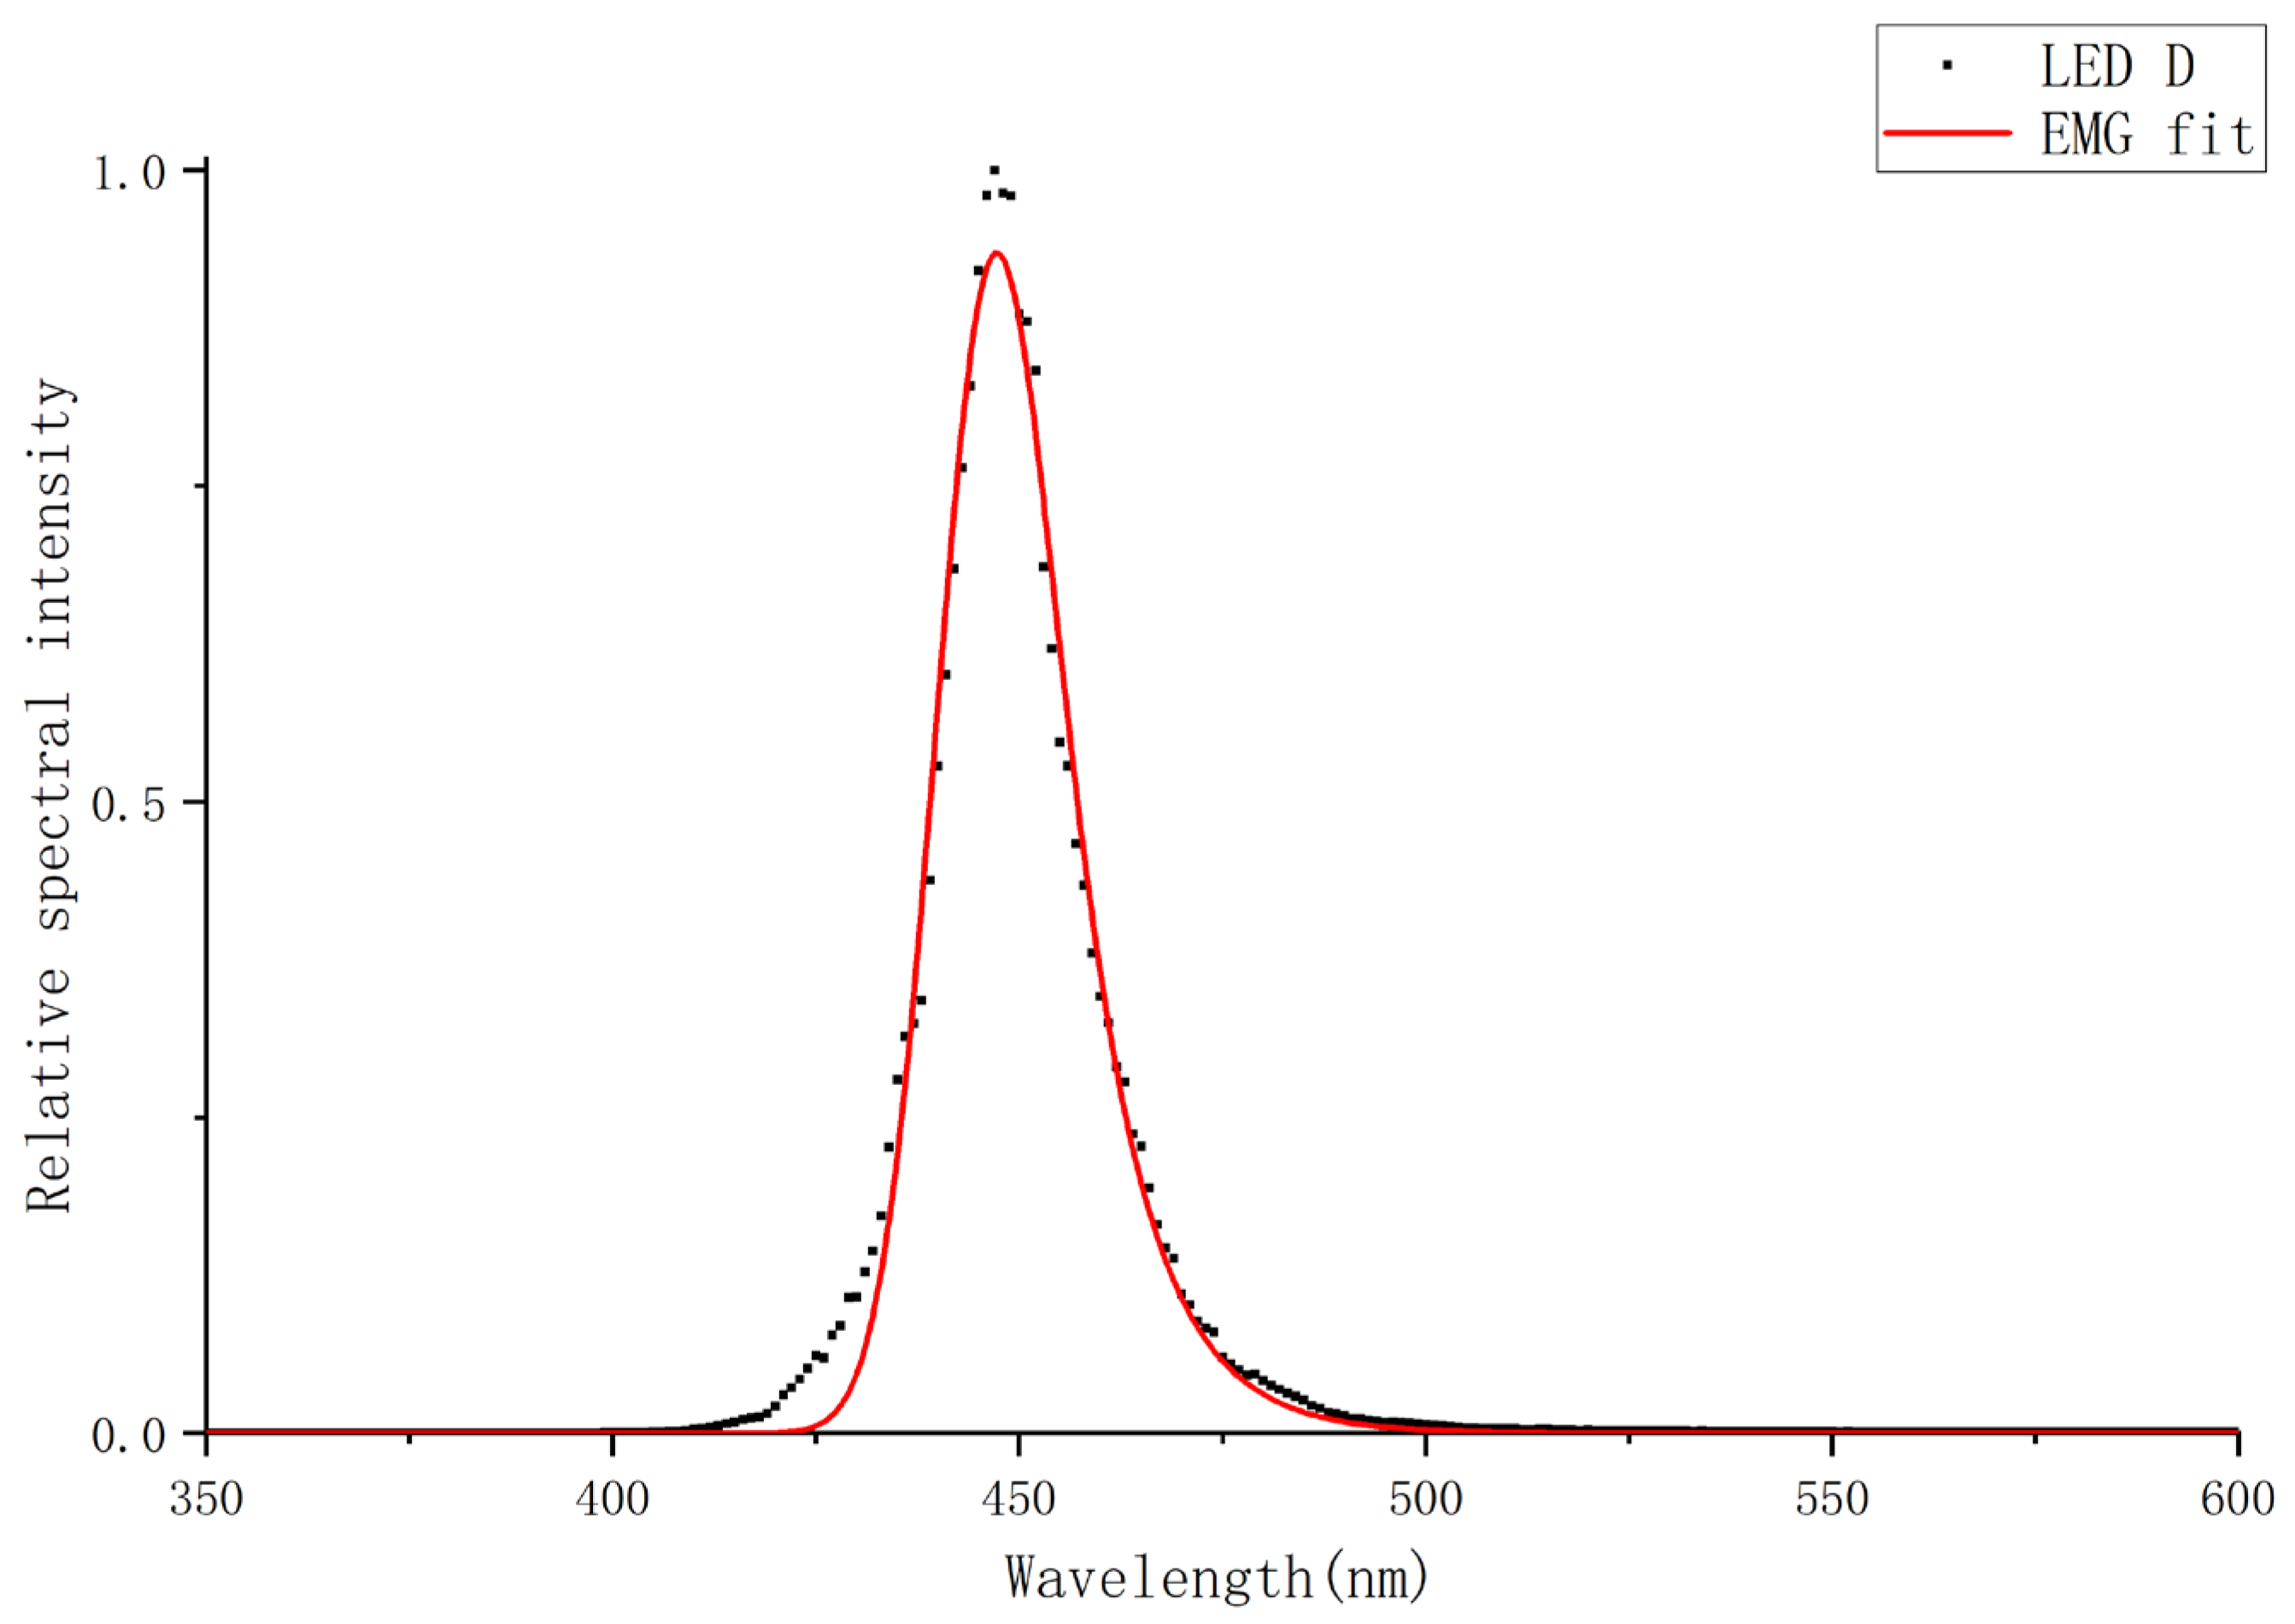
We used the EMG function to fit the experimental data and obtained the comparison results between the fitted spectrogram and the experimental spectrogram as shown in
Figure 8.
3.5. APV Profile Construction
The EMG-simulated spectrum matches the experimental data on the falling edge; however, it exhibits a steeper rising edge and a narrower spectral width. To address limitations of a single correction model in replicating all spectral details, an APV function was introduced as an auxiliary component. This function combines Gaussian and Lorentzian profiles through linear superposition, integrating their respective characteristics. The asymmetric model further permits the sides of the peak to have different widths and different mixing ratios of Gaussian and Lorentzian functions, offering dual flexibility to optimize spectral simulations. The APV function is defined as
is the central wavelength of the APV function;
is the half-breadth;
is the mixing factor of the APV function. is the Lorentzian property, which is more significant the closer it gets to 1;
is the Gaussian component;
is the Lorentzian component;
and are determined from .
The final model combines the EMG and APV functions in a “Base Model + Correction” framework using weighted addition. The total un-normalized spectrum
is given by
where
w is a weighting factor that scales the APV correction. The final spectrum is then normalized to a peak intensity of 1 for comparison with experimental data.
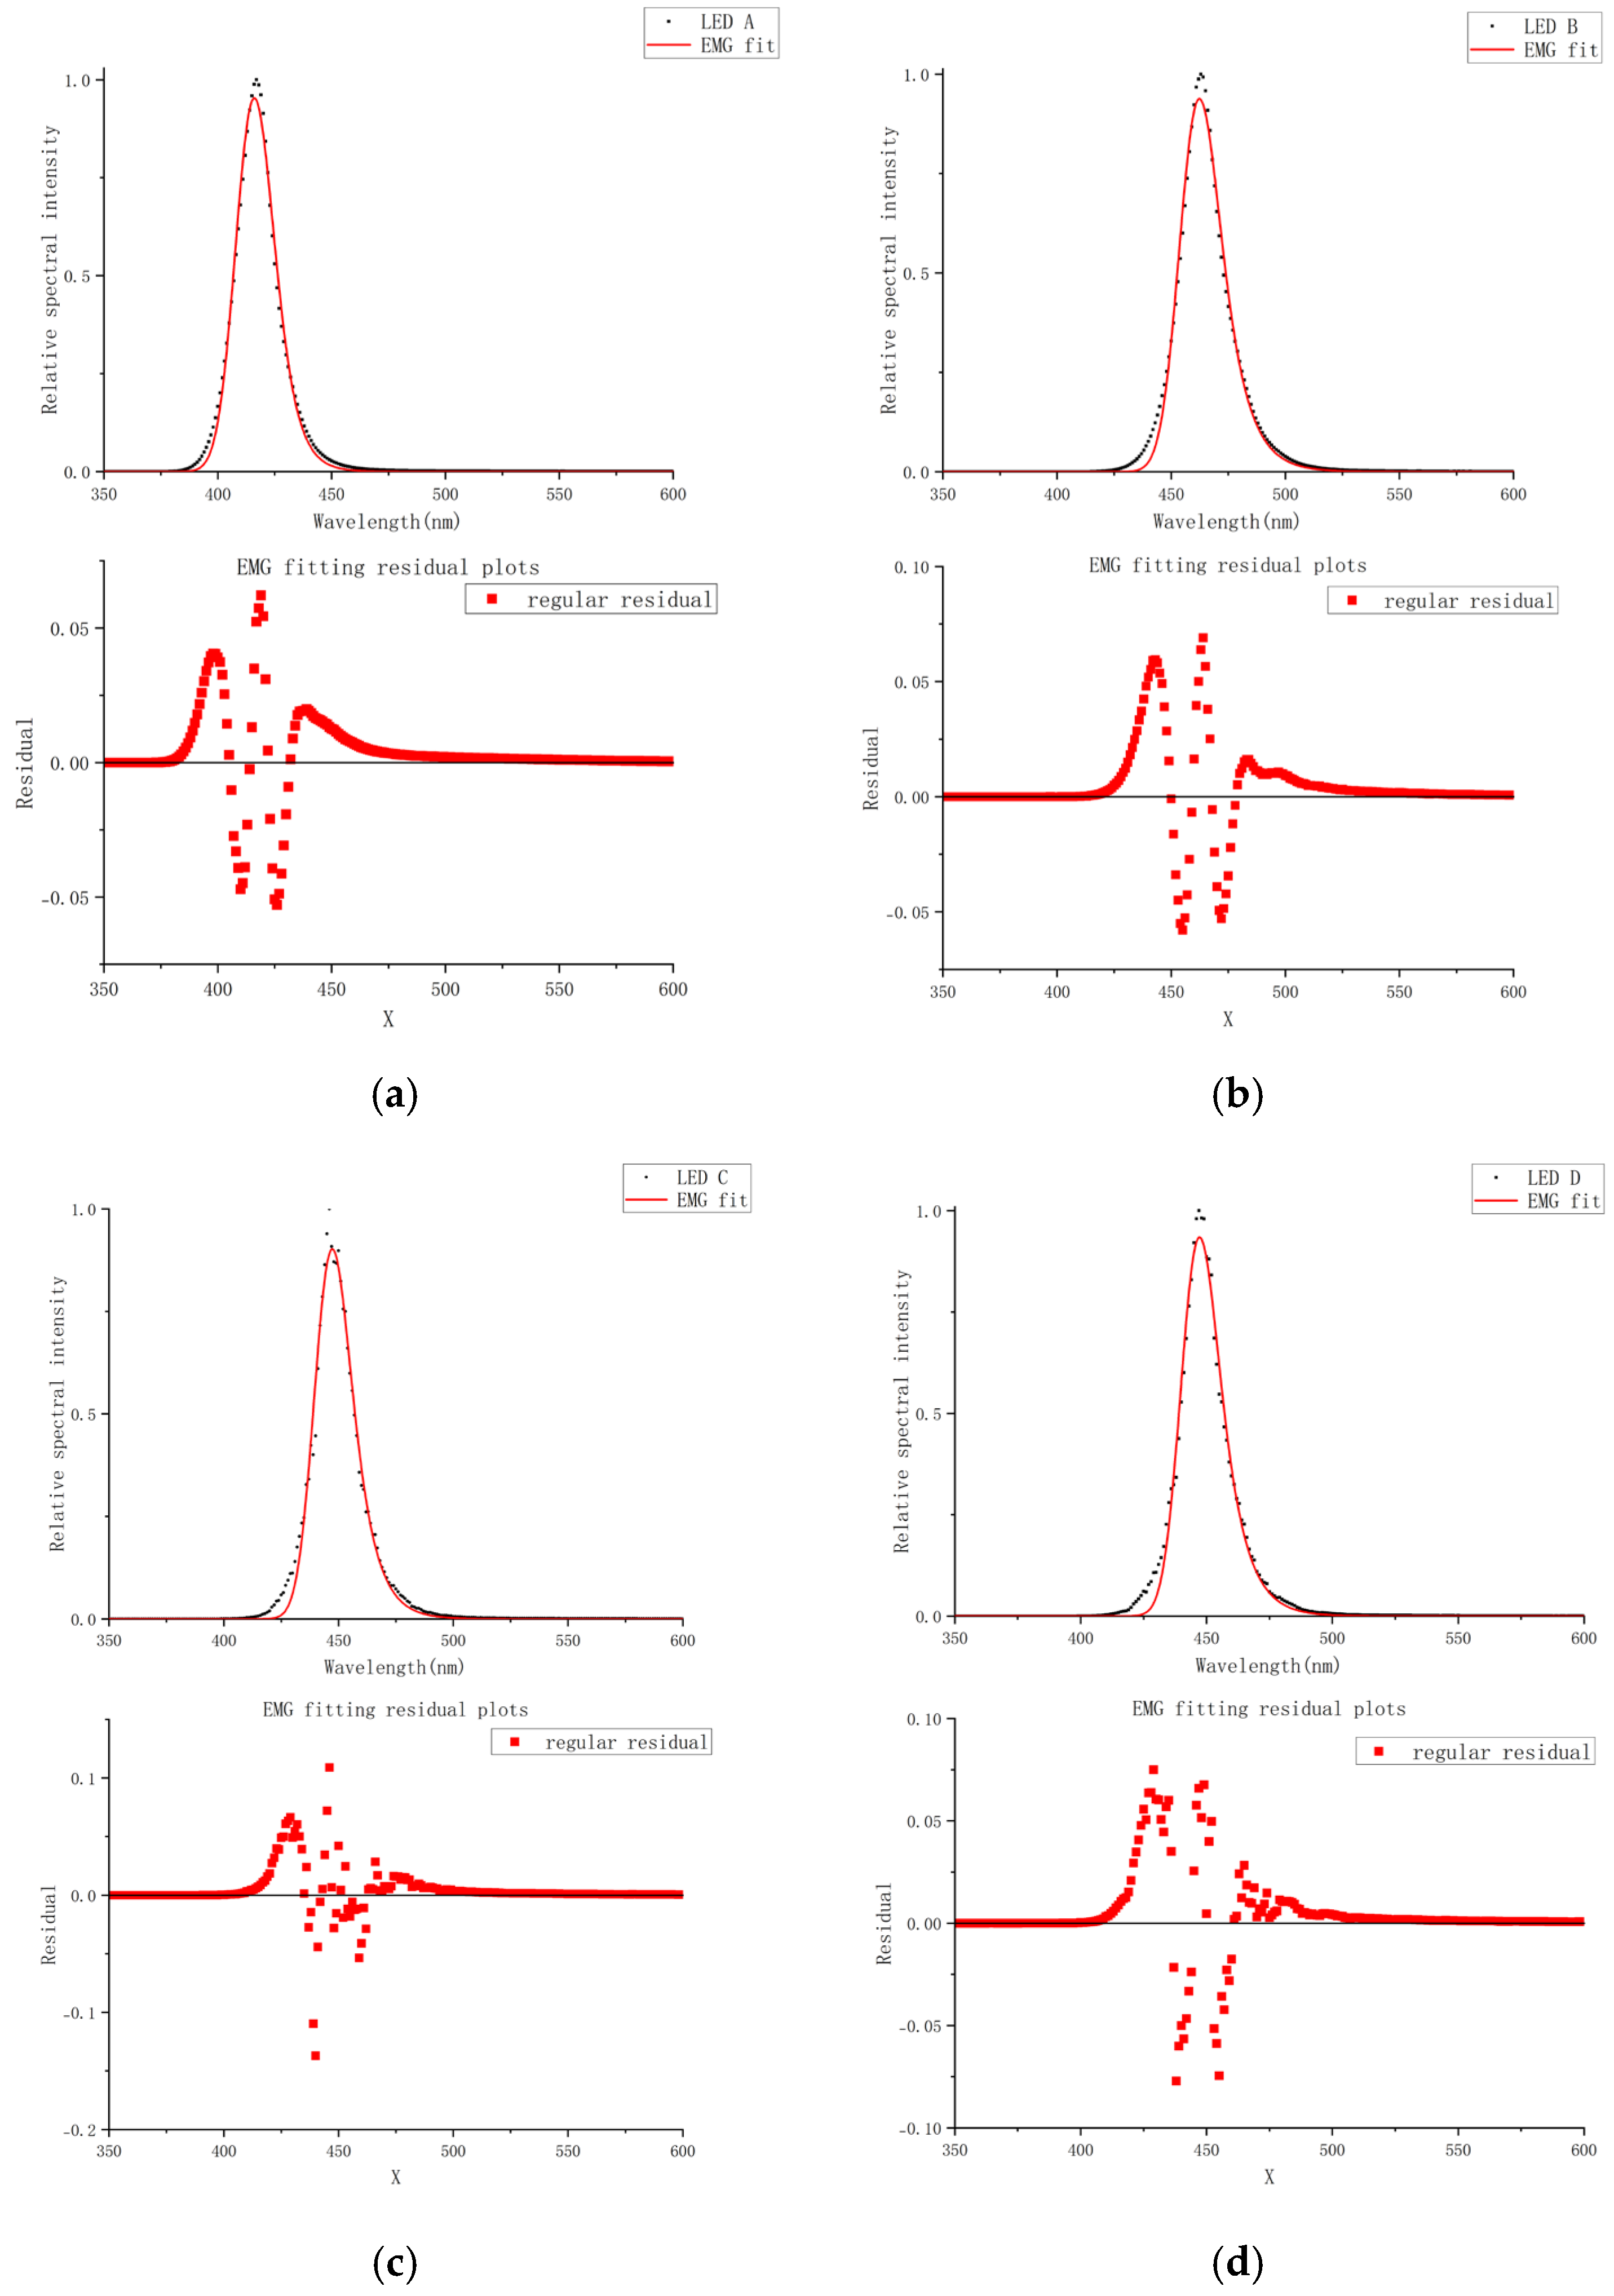
The parameters for this combined model are determined as follows: First, the EMG base model’s parameters (μ, σ, τ) are optimized using a nonlinear least squares algorithm to best fit the experimental data, constrained by the user-defined target center wavelength and bandwidth. Second, the APV function’s parameters (center, fwhm, η) and the weight w are determined through a guided, systematic process based on the residual analysis of the initial EMG fit.
Four experimental datasets were fitted using the EMG base model. While this model accurately captures the primary peak shape and the long-wavelength falling edge, a systematic deviation is consistently observed on the rising edge. As depicted in the residual plots of
Figure 9, this deviation emphasizes the necessity of the APV component for a high-fidelity correction of spectral asymmetry.
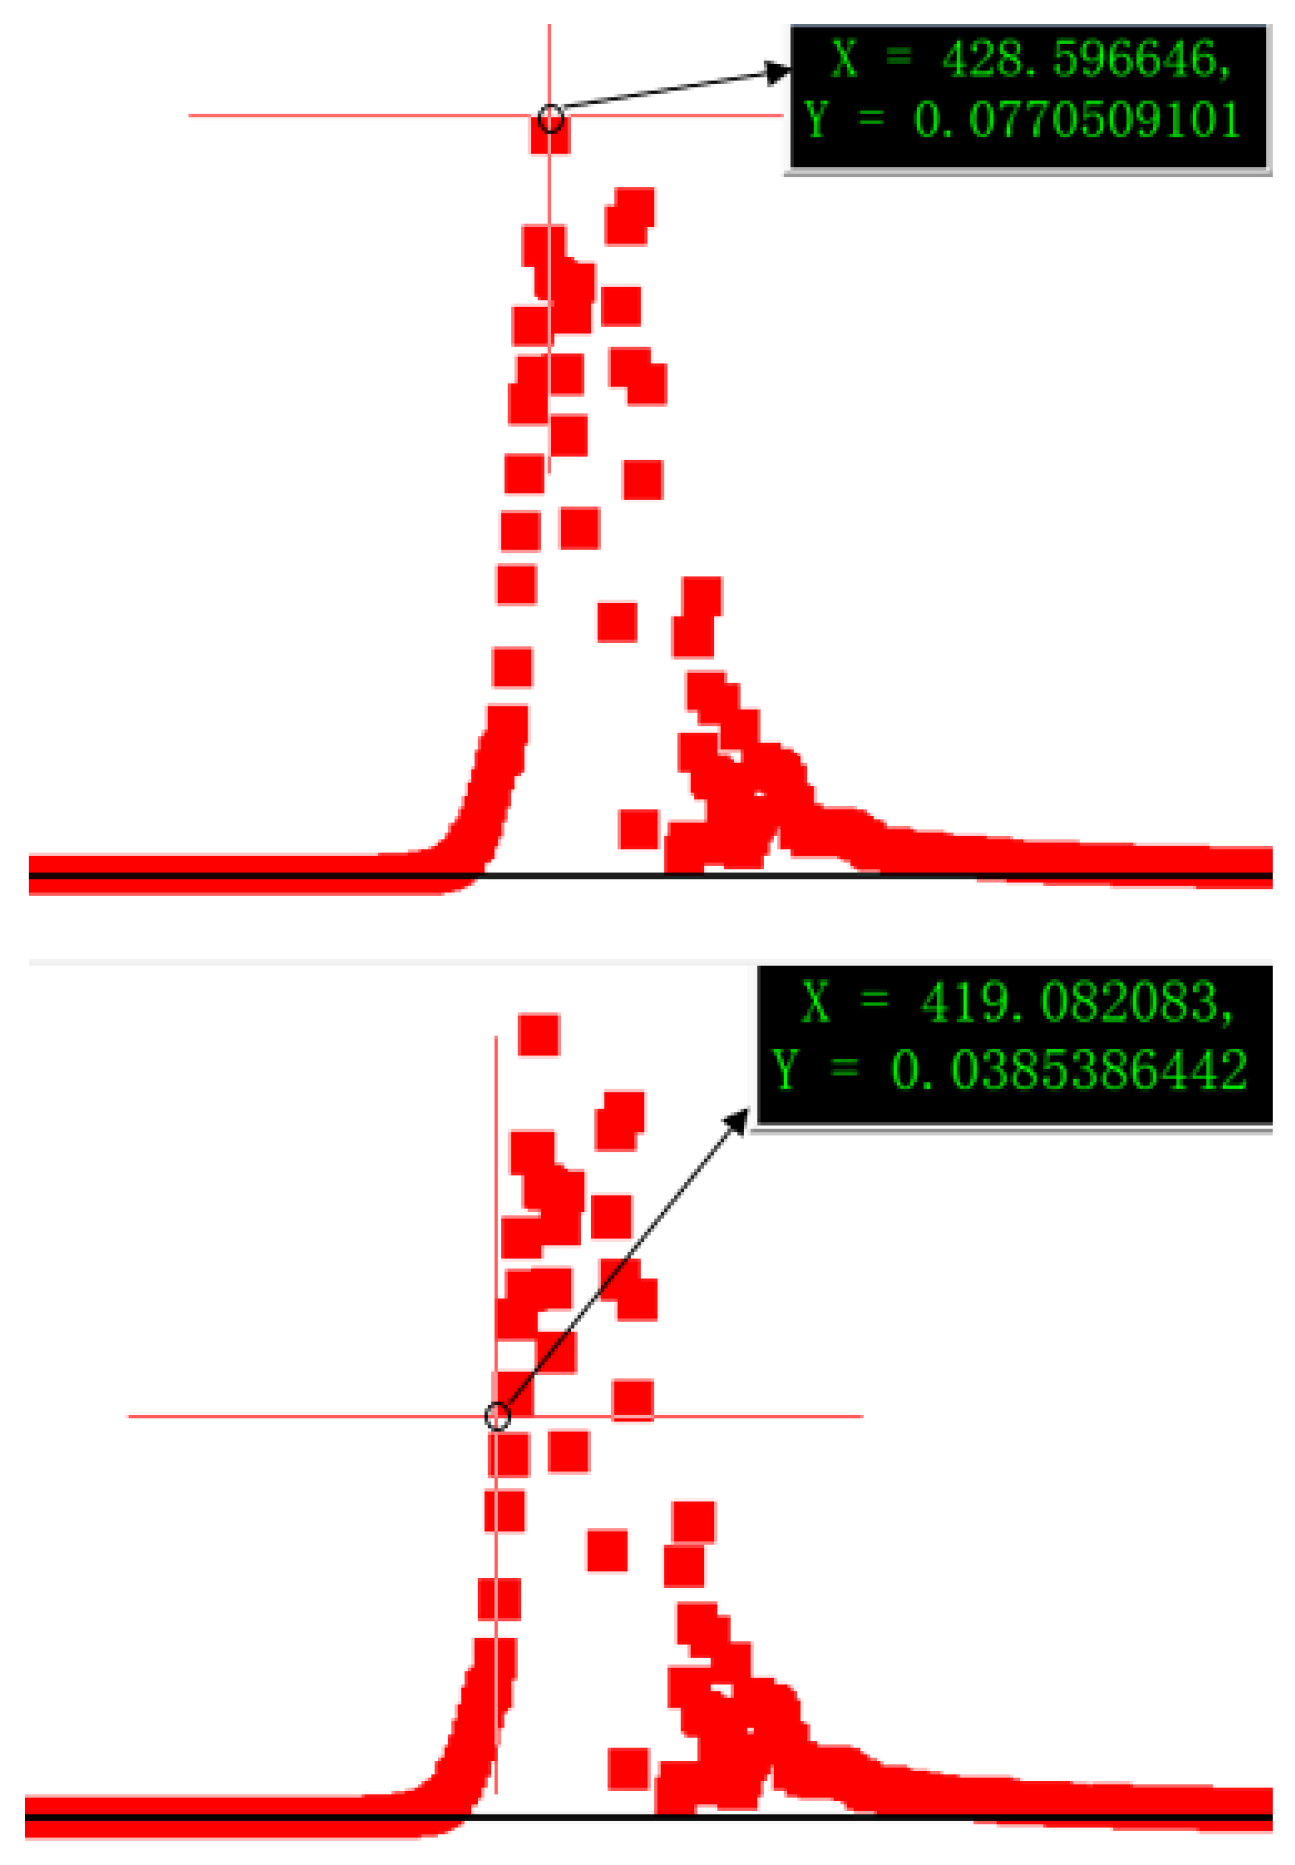
From the above fitted plot, we detect a clear asymmetric peak in the residuals on the steeply rising edge of the spectrum. The center of the APV function is set to align with the peak of the observed residual feature. Residual analysis of LED spectra reveals the feature that justifies the introduction of the APV component. For example, in the case of LED D, the residual peak is centered at approximately 428.6 nm; its fwhm is about 15 nm (as shown in
Figure 10), which is 14.0 nm shorter than the Gaussian mean of the EMG fit (μ = 442.6 nm). This observation supports the definition of the APV center as μ − 14 nm. Similar offsets were observed in the other three LED groups, with the distances also approximately 14 nm shorter than their respective EMG peak centers. These consistent findings across multiple samples establish a data-driven rationale for the choice of the APV center offset.
Following the systematic, residual-guided procedure outlined above, the parameters for the APV corrective component were determined. Specifically, the APV center was defined as μ − 14 nm to align with the observed residual peak, and its FWHM was set to 15 nm to match the residual’s width (as depicted in
Figure 10). The mixing factor η and weight w were then optimized to replicate the feature’s shape and magnitude. The final parameters used for the simulation—center = μ − 14 nm, fwhm = 15, and η = 0.2—were thus established through this data-driven methodology, ensuring the resulting simulated spectra are consistent with the experimental profiles.
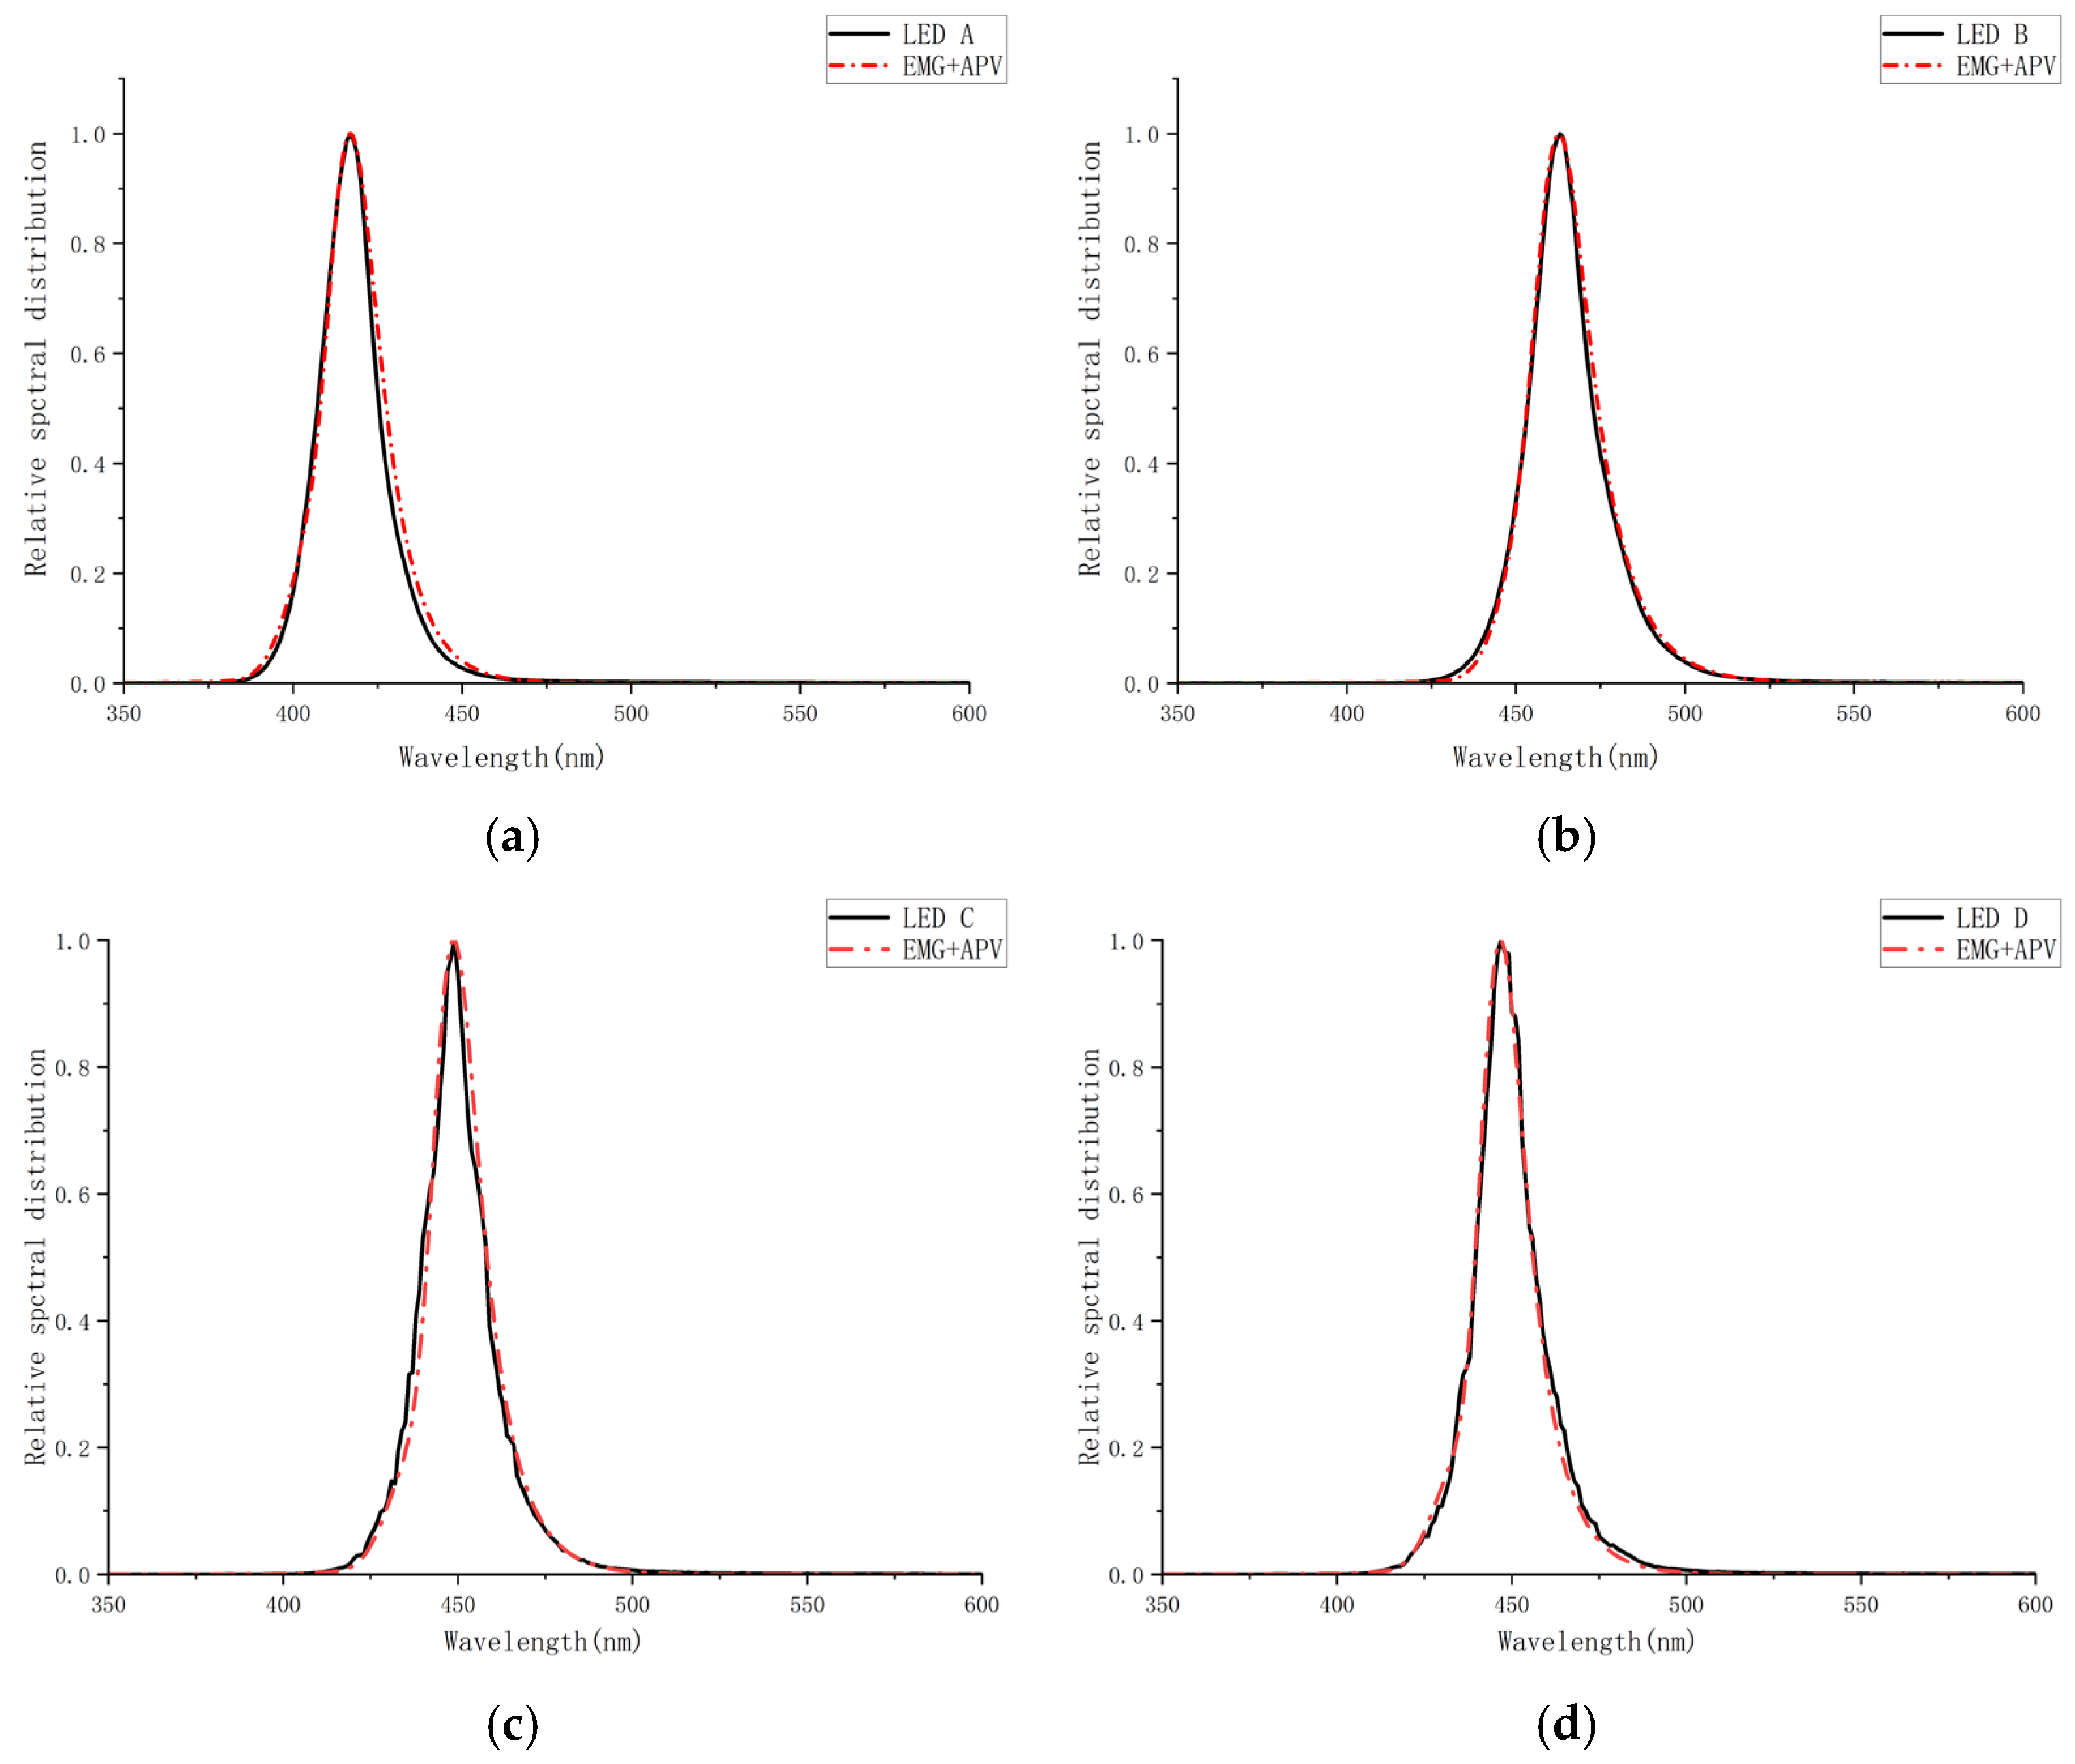
3.6. Results of EMG+APV Model Fitting
The comparison of the simulated spectra with the measured data spectra is shown in
Figure 11.
4. Analysis of Spectral Simulation Results
Observations indicate that the APV-modified spectral simulation better replicates experimental blue light spectra, particularly in the rising and falling edges critical to this study. We integrated a 400–500 nm intensity ratio calculation into the code, and the simulated intensity ratios (LED A = 96.00%, LED B = 97.90%, LED C = 99.40%, LED D = 99.50%) deviated from the experimental values by ≤0.20%. By integrating the EMG and APV functions, the model achieves high-fidelity simulations of blue light spectra consistent with experimental data.
To provide a comprehensive quantitative assessment of the model’s performance and consistency, the previously mentioned models (Gaussian, Voigt, and the proposed EMG+APV model) were applied to the four experimental LEDs. For a quantitative comparison, we evaluated each model using several key metrics, which are presented in
Table 1. These include the coefficient of determination (R
2) and root-mean-square error (RMSE), as well as errors in peak position, FWHM, and the 400–500 nm energy percentage. The results clearly demonstrate that the EMG+APV model outperforms the traditional symmetric models across all datasets, evidenced by its significantly higher R
2 values and lower RMSE, peak, and FWHM errors.
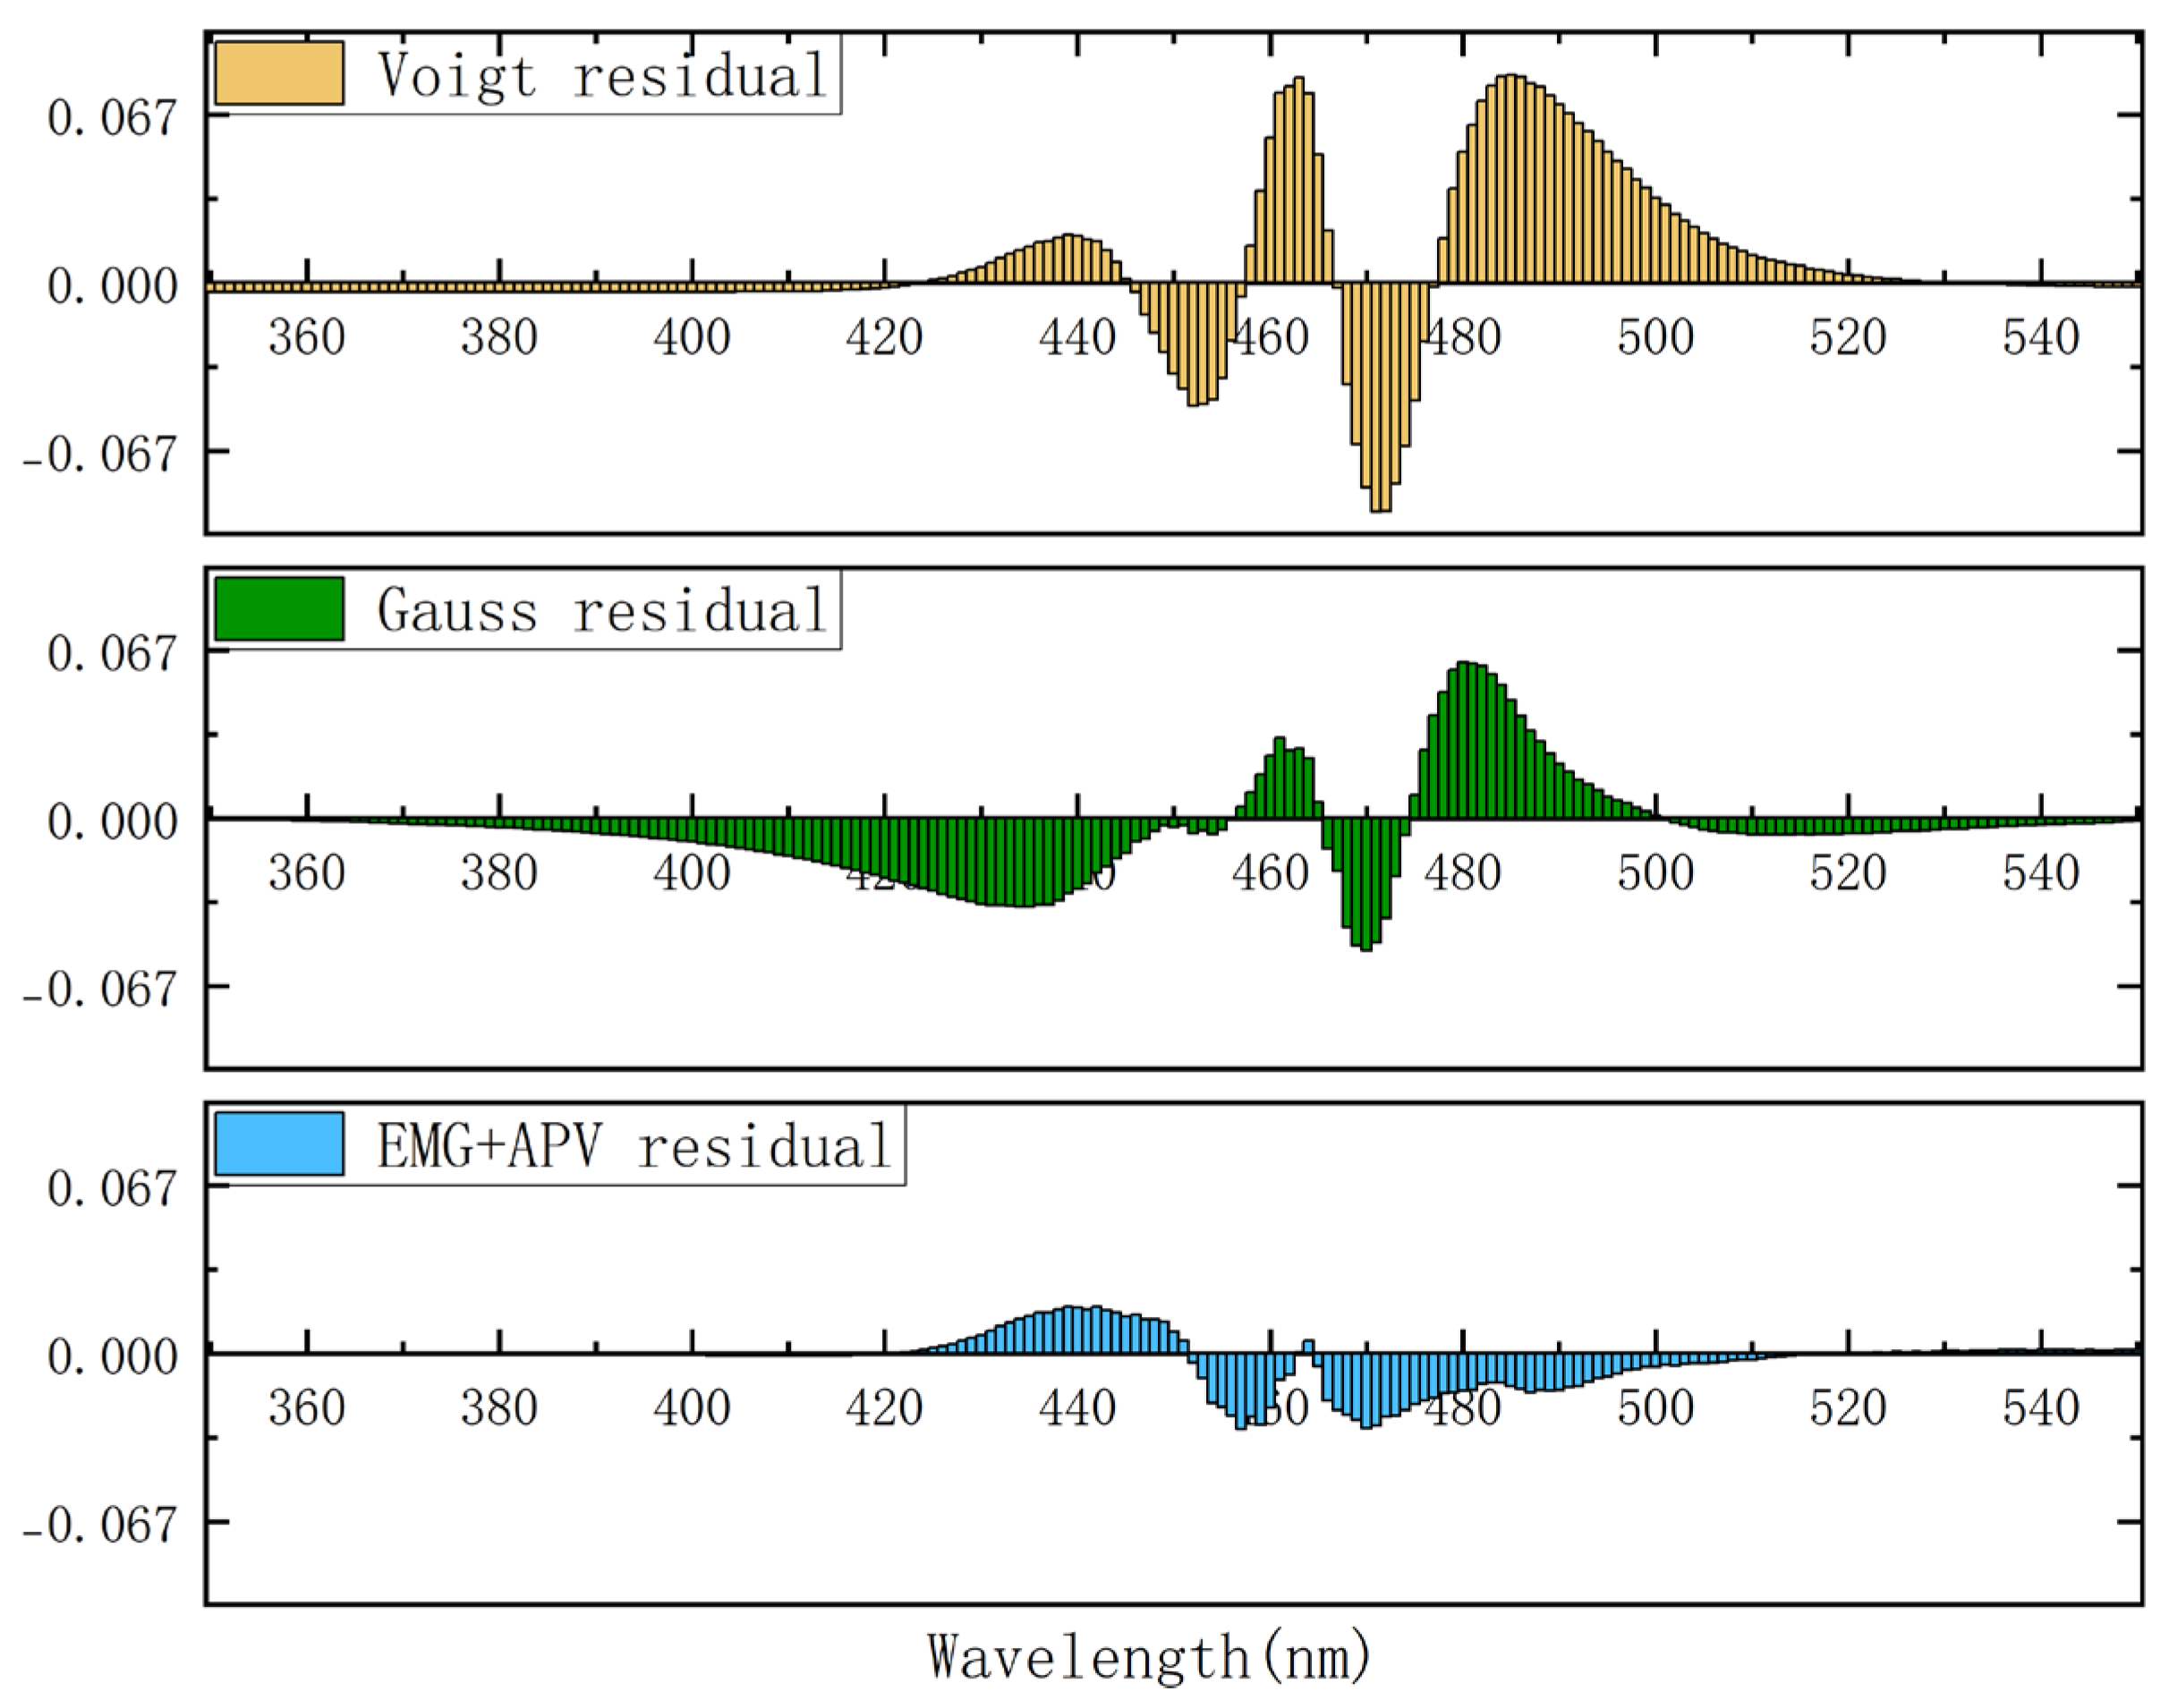
To further visualize the improvement in fit quality summarized in
Table 1, the residuals for the Gaussian, Voigt, and the final EMG+APV models for the representative experimental LED D were compared in
Figure 12. The inadequacy of the traditional symmetric models is immediately apparent. The residuals for both the Voigt fit and the Gaussian fit exhibit large, non-random, S-shaped structures, with deviations reaching as high as ±0.08. This systematic error confirms that these symmetric functions are fundamentally unable to capture the asymmetric nature of the LED spectrum. In contrast, the EMG+APV model proposed in this study provides a good improvement in residuals; its deviations are an order of magnitude smaller and are randomly distributed around the zero axis. This evidence strongly supports the quantitative metrics in
Table 1. It clearly demonstrates the model’s superior ability to accurately replicate the experimental spectral profile. Notably, it eliminates the systematic errors inherent in simpler models.
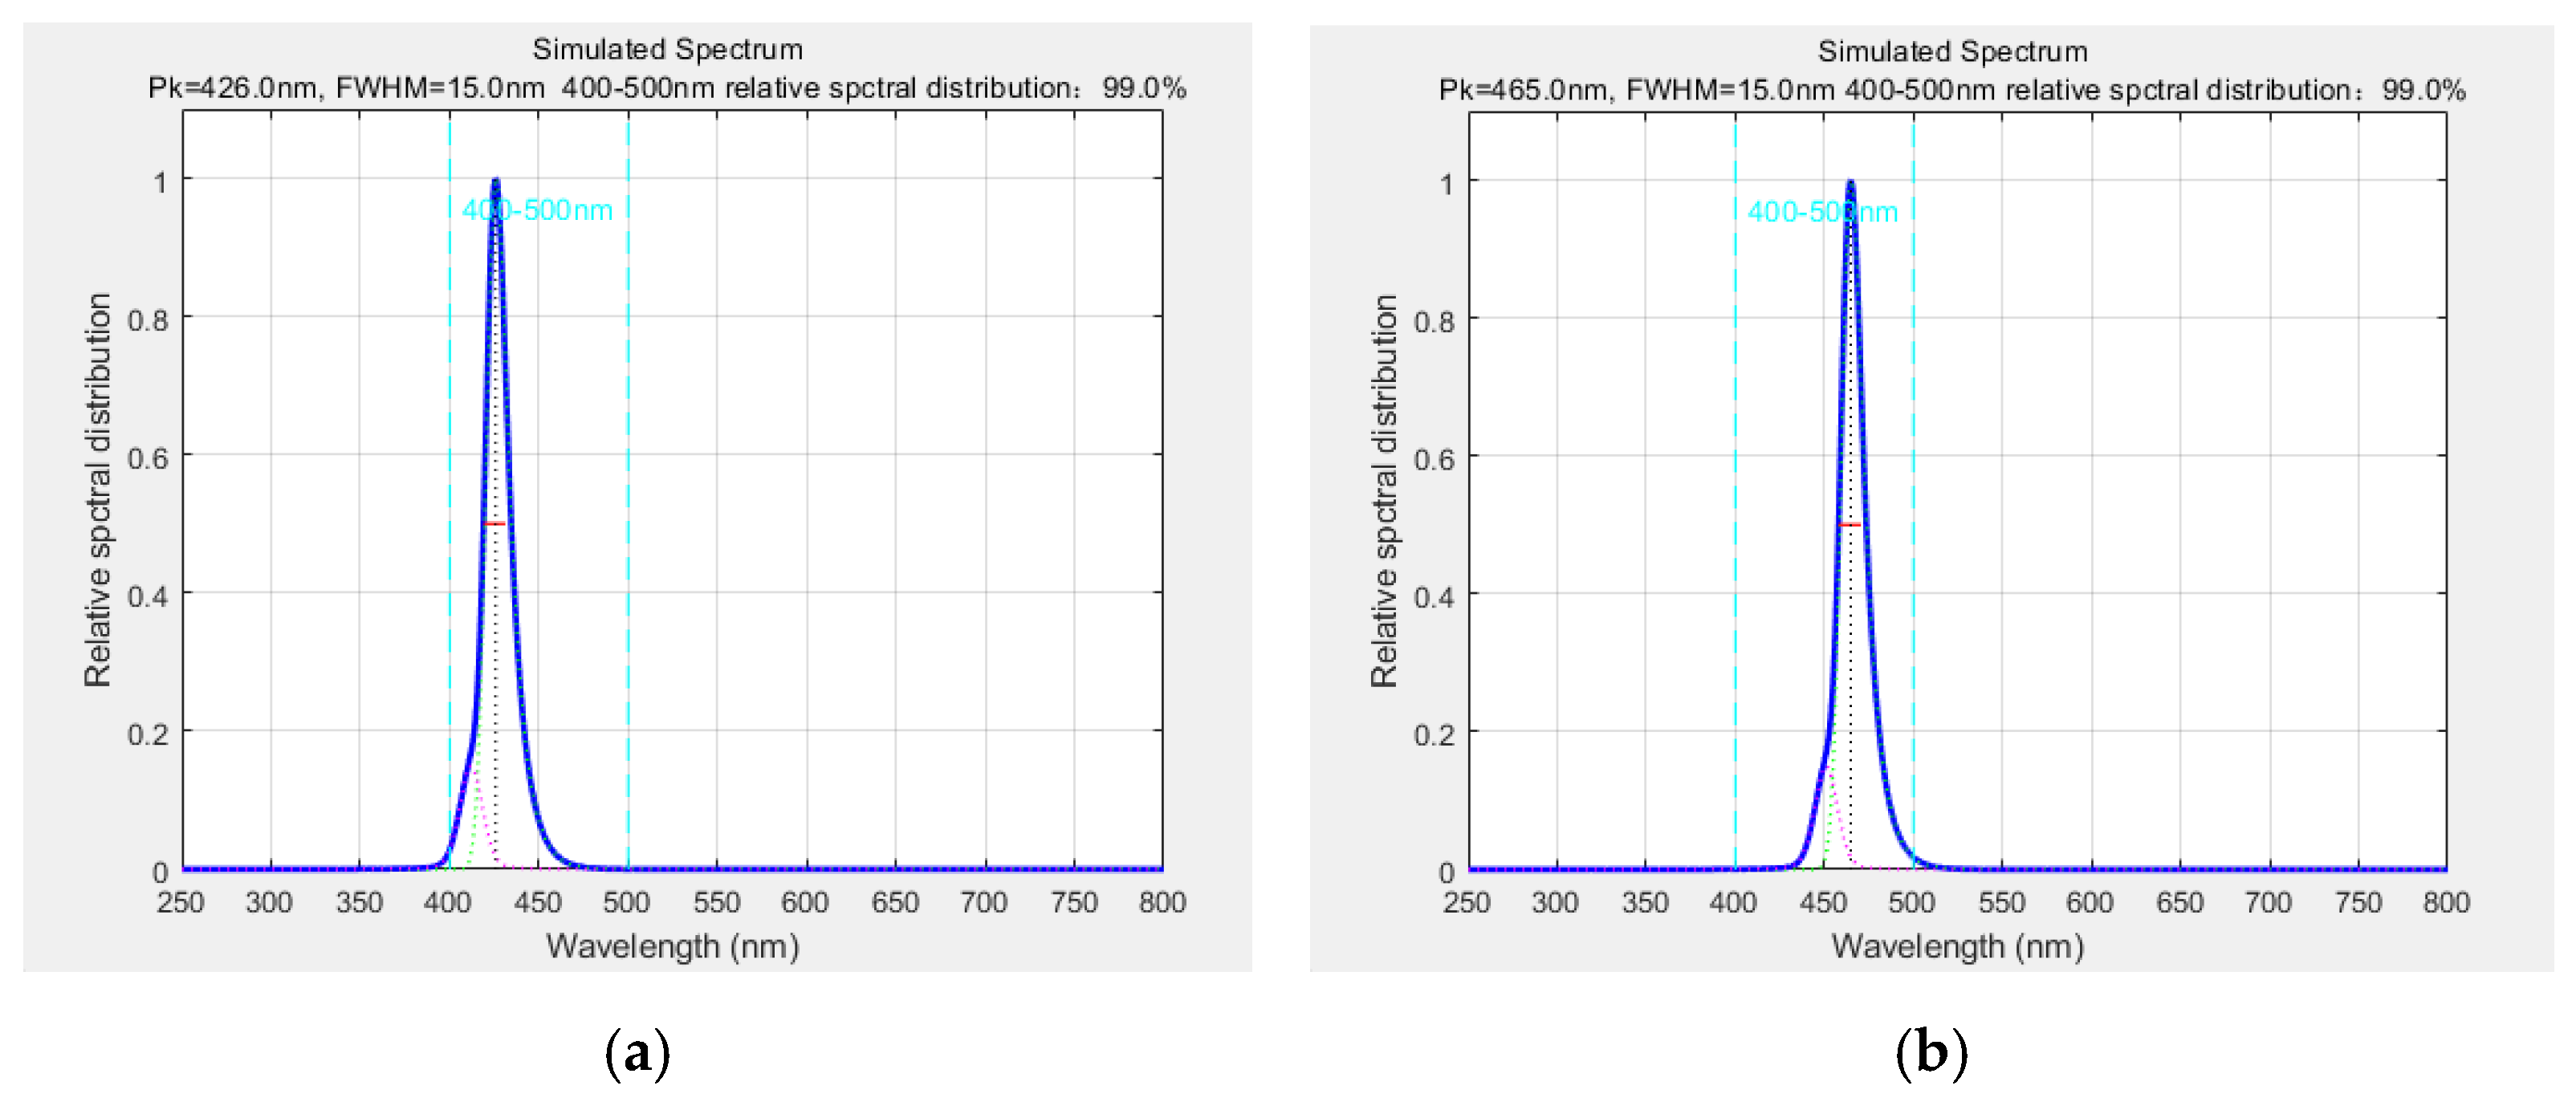
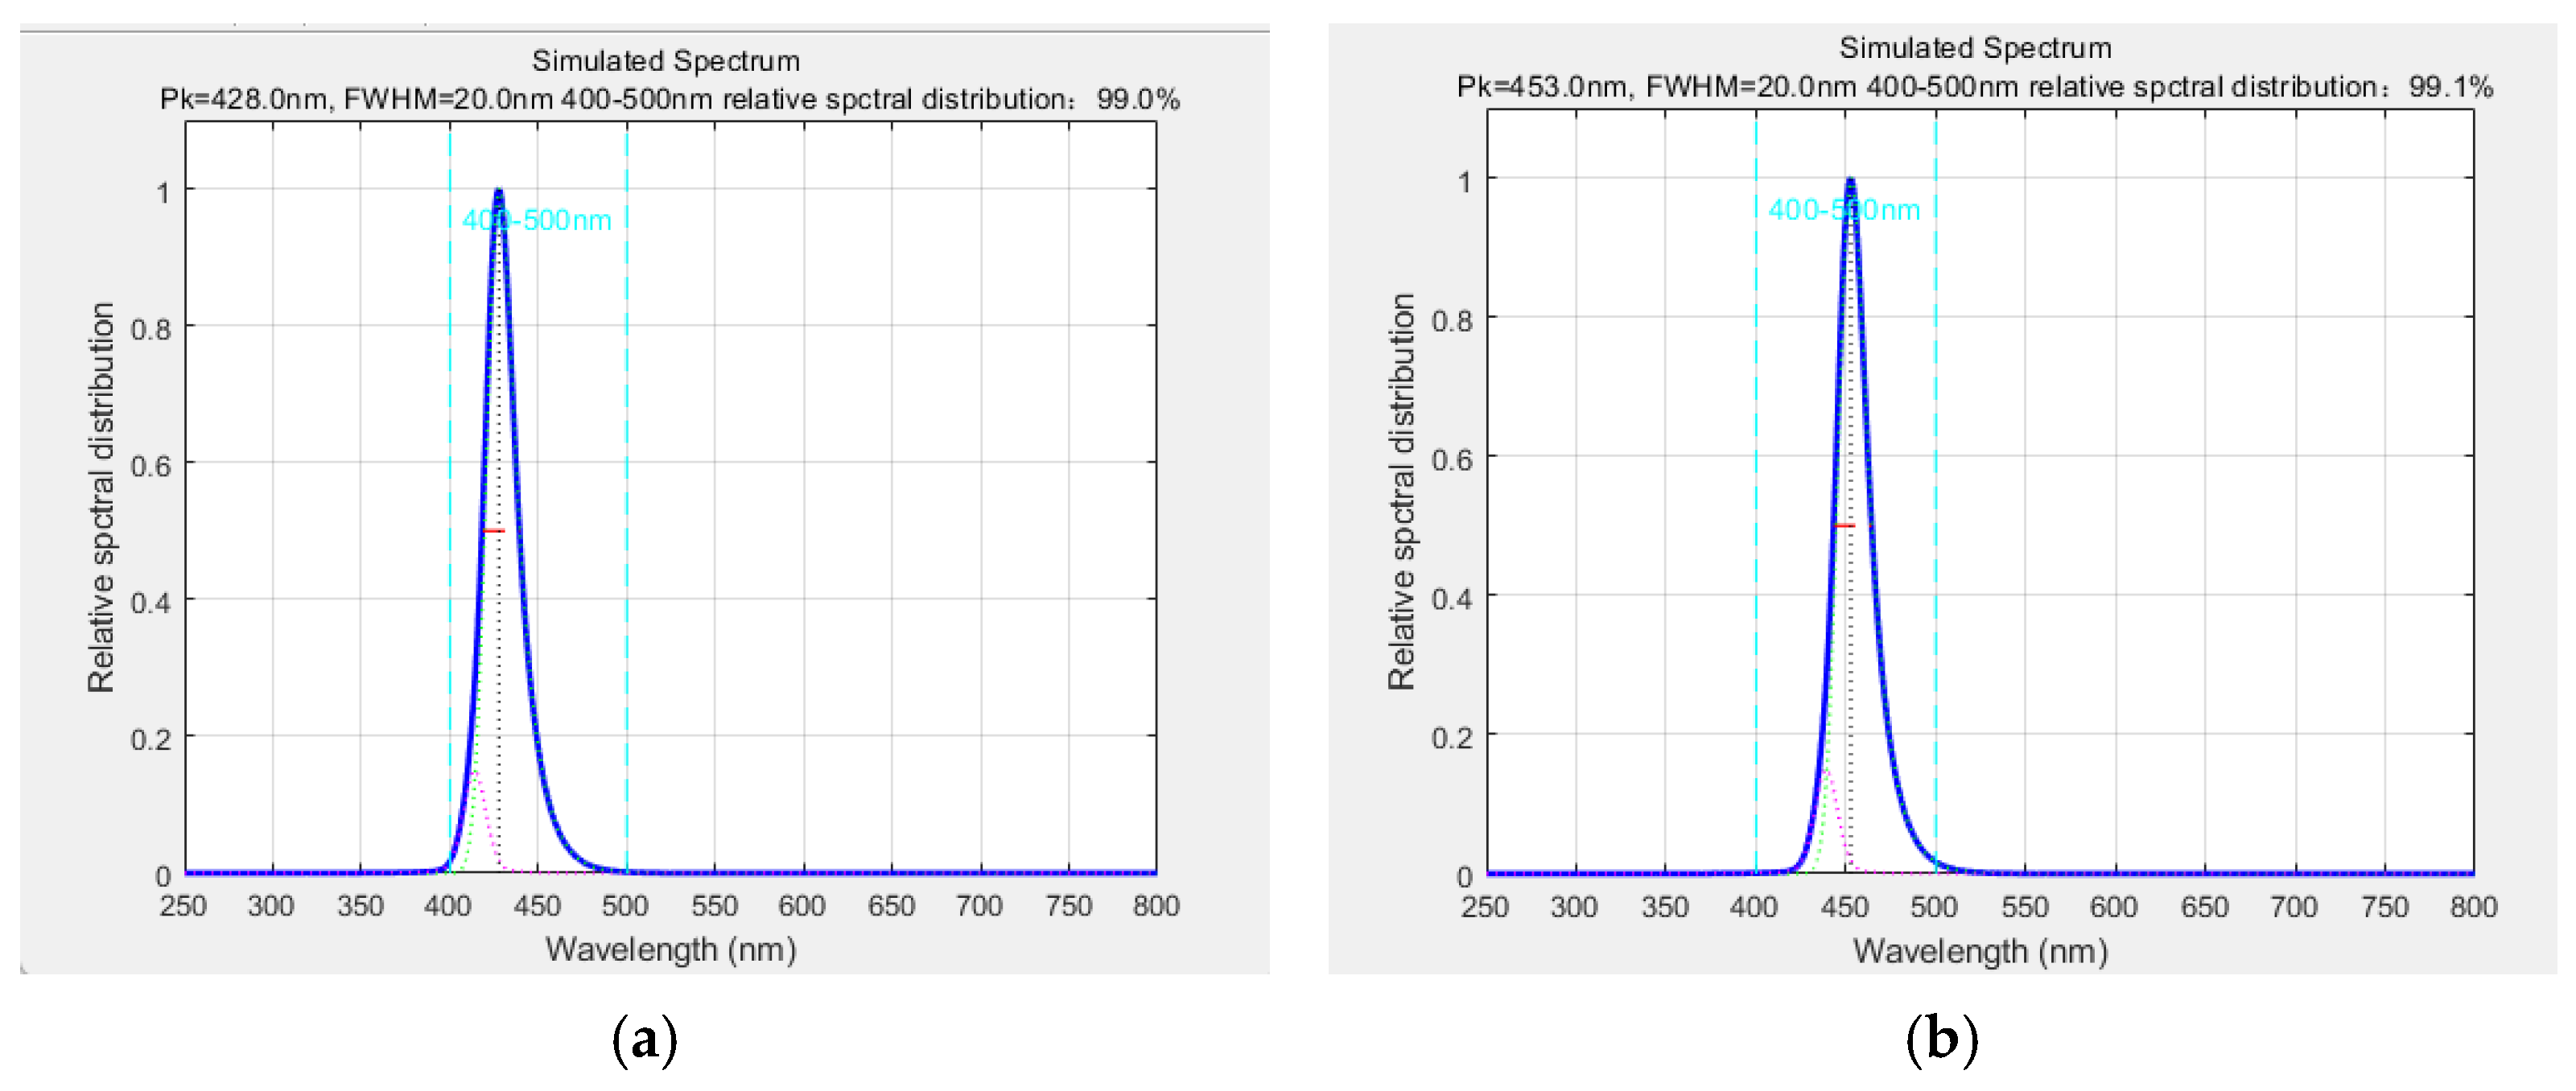
Furthermore, by fixing the bandwidth parameters, we can predict the central wavelength ranges that comply with source specifications. For instance, fixing bandwidths at 15 nm and 20 nm yields the central wavelength coverage shown in
Figure 13 and
Figure 14.
At a bandwidth of 15 nm, the central wavelength must fall within 426–465 nm to meet the light source requirements, while a bandwidth of 20 nm narrows the central wavelength range to 428–453 nm. Because all experimentally measured blue LED spectra exhibited bandwidths below 20 nm, we fixed the bandwidth parameter at this upper limit (20 nm) for simulations. The resulting central wavelength ranges, compliant with standard requirements, demonstrate high reliability, providing critical guidance for screening blue LED light sources.
5. Discussion
We proposed a spectral simulation model that integrates the EMG and APV functions to simulate blue LED emission profiles. Unlike traditional symmetric Gaussian or Lorentzian fitting, this approach captures spectral asymmetry more accurately, particularly in the rising and falling edges, which are critical for evaluating blue light exposure. The model’s strength lies in its minimal input requirement—only two user-defined parameters (center wavelength and bandwidth)—and its ability to predict compliance with specific regulatory criteria, such as >99% intensity in the 400–500 nm range. This makes it an efficient pre-evaluation tool for LED source selection in blue light-related experiments.
The EMG+APV model proposed in this study strikes a balance between accuracy and simplicity compared to other methods mentioned in the literature. For example, while multiple Gaussian models can provide flexibility, they typically require a large number of parameters (typically 9–15) to achieve high accuracy, which increases the risk of overfitting and reduces the physical interpretability of the fit. In contrast, our model achieves high levels of accuracy using a more constrained and physically meaningful set of parameters (as shown in
Table 1, R
2 values consistently exceed 0.995). More importantly, our framework provides key practical advantages with only two intuitive user inputs—center wavelength and bandwidth—whereas other approaches require complex, multi-parameter nonlinear optimization for each new spectrum.
Moreover, the practical significance of the proposed simulation framework becomes apparent when contrasted with traditional hardware-based methods for light source selection. Conventionally, the achievement of stringent in-band energy criteria—such as the >99% requirement for blue light safety evaluation—has necessitated a time-consuming and resource-intensive process. This process typically involves the procurement, physical setup, and repeated spectral measurement of multiple candidate LEDs, often supplemented with various optical filters. Such trial-and-error approaches are not only inefficient but also lack predictive precision. In contrast, our model introduces a prediction paradigm that enables a pre-evaluation of spectral performance. As shown in
Figure 13 and
Figure 14, EMG+APV-based simulations allow the user to systematically explore the relationship between center wavelength, bandwidth, and in-band energy ratio. The simulation provides a clear guide to narrowing down the appropriate LED range prior to physical measurements. As a result, the model simplifies experimental design, reduces resource consumption, and increases the likelihood of compliance on the first attempt.
However, the current implementation is constrained by two primary limitations. First, the simulation is based on a limited dataset of four blue LEDs, measured under idealized laboratory conditions. As such, the parameter tuning may not generalize to the broader diversity of commercial or environmental scenarios. Second, the model assumes static spectra, without accounting for real-time variations caused by temperature, current fluctuations, or device aging—all of which can impact spectral profiles in practical use.
It is also noteworthy that the current study focuses on unimodal LEDs. For light sources with multi-modal spectra, such as PC—LEDs, the proposed model can be extended. A multi-modal spectrum can be mathematically modeled as a linear superposition of multiple EMG+APV functions, with each function representing a single emission peak. This extensibility demonstrates the model’s potential for broader applications in simulating more complex spectral profiles.
Despite these limitations, the model is inherently modular and extensible. Future improvements could involve the integration of dynamic parameters (e.g., thermal response curves, electrical characteristics) and the use of machine learning for parameter estimation across broader datasets. The modeling strategy may also be adapted to simulate other types of LEDs or light sources beyond the blue spectrum, thereby extending its relevance to fields such as optical metrology, medical photobiology, and lighting system design.


