Article

Investigating the Coherence Between Motor Cortex During Rhythmic Finger Tapping Using OPM-MEG

1
Key Laboratory of Ultra-Weak Magnetic Field Measurement Technology, Ministry of Education, School of Instrumentation and Optoelectronic Engineering, Beihang University, 37 Xueyuan Rd., Haidian District, Beijing 100083, China
2
Hangzhou Institute of National Extremely-Weak Magnetic Field Infrastructure, 465 Binan Rd., Binjiang District, Hangzhou 310000, China
3
Hefei National Laboratory, Gaoxin District, Hefei 230088, China
4
Shandong Key Laboratory for Magnetic Field-Free Medicine & Functional Imaging, Institute of Magnetic Field-Free Medicine & Functional Imaging, Shandong University, 27 South Shanda Rd., Licheng District, Jinan 250100, China
*
Authors to whom correspondence should be addressed.
Photonics 2025, 12(8), 766; https://doi.org/10.3390/photonics12080766
Submission received: 20 June 2025 / Revised: 22 July 2025 / Accepted: 24 July 2025 / Published: 29 July 2025

Abstract

Optically pumped magnetometer OPM-MEG has the potential to replace the traditional low-temperature superconducting quantum interference device SQUID-MEG. Coherence analysis can be used to evaluate the functional connectivity and reflect the information transfer process between brain regions. In this paper, a finger tapping movement paradigm based on auditory cues was used to measure the functional signals of the brain using OPM-MEG, and the coherence between the primary motor cortex (M1) and the primary motor area (PM) was calculated and analyzed. The results demonstrated that the coherence of the three frequency bands of Alpha (8–13 Hz), Beta (13–30 Hz), and low Gamma (30–45 Hz) and the selected reference signal showed roughly the same position, the coherence strength and coherence range decreased from Alpha to low Gamma, and the coherence coefficient changed with time. It was inferred that the change in coherence indicated different neural patterns in the contralateral motor cortex, and these neural patterns also changed with time, thus reflecting the changes in the connection between different functional areas in the time-frequency domain. In summary, OPM-MEG has the ability to measure brain coherence during finger movements and can characterize connectivity between brain regions.

1. Introduction

Magnetoencephalography (MEG) based on optically pumped magnetometer (OPM) [1,2] is a non-invasive neuroimaging technology for studying brain activity. It can capture the magnetic field changes of brain neurons and reflect brain activity. Traditional SQUID-MEG requires extremely low liquid helium temperature and thick Dewar flasks [3]. In recent years, OPM-MEG has been widely used in the measurement of brain magnetic field. Its specific sensor layout can be more flexibly arranged in the target area of interest, thereby achieving more accurate measurement. Previous studies have shown that OPM-MEG can provide comparable or even better signal-to-noise ratio, better motion tolerance, and more flexible experimental design than SQUID-MEG in similar motor tasks [4]. These advantages make OPM-MEG a promising tool for studying natural movement paradigms.
The brain’s neural activity is divided into functional areas. Functional regions are linked in temporal, spatial, and frequency domains, forming a complex neural network. This network connection relies on the simultaneous discharge of neurons with similar characteristics to produce synchronous oscillations to achieve neural information transmission and the coordinated work of different brain functional areas. Neurons in the entire information transmission pathway can be adjacent or located in different brain functional areas that are far apart. OPM-MEG has been successfully applied to the detection of mid-band responses and theta rhythms in finger abduction [5] and working memory tasks [6], showing its potential in the study of dynamic neural oscillations. Coherence analysis is widely used to reveal the functional connectivity and information transmission between different brain regions and to evaluate the coordination between brain regions [7,8]. Previous studies have shown that coherence analysis reflects the modulation of motor cortical oscillations and serves as an indicator of cortical connectivity in the brain. Coherence analysis can provide important information about the dynamic changes in brain activity during movement execution [9,10]. However, the coherence of OPM-MEG in finger movement tasks is still insufficient. In-depth revelation of its ability to characterize neural oscillation regulation will help expand its application in motor neuroscience.
This study used magnetoencephalography (MEG) technology based on optically pumped magnetometer (OPM) to obtain the connection between different brain functional areas during finger movement, as well as the changes in this functional connection in time-frequency domain and space. The MEG signals related to finger movement were recorded, and then coherence analysis was performed on them, and the coherence coefficients between signals at different positions were calculated. The relationship between the connection of different cortical areas over time in the three frequency bands of Alpha (8–13 Hz), Beta (13–30 Hz), and low Gamma (30–45 Hz) was further explored through time-frequency analysis [11,12]. This paper aims to verify the ability of OPM-MEG to represent coherence.

2. Materials and Methods

2.1. Experimental Subjects
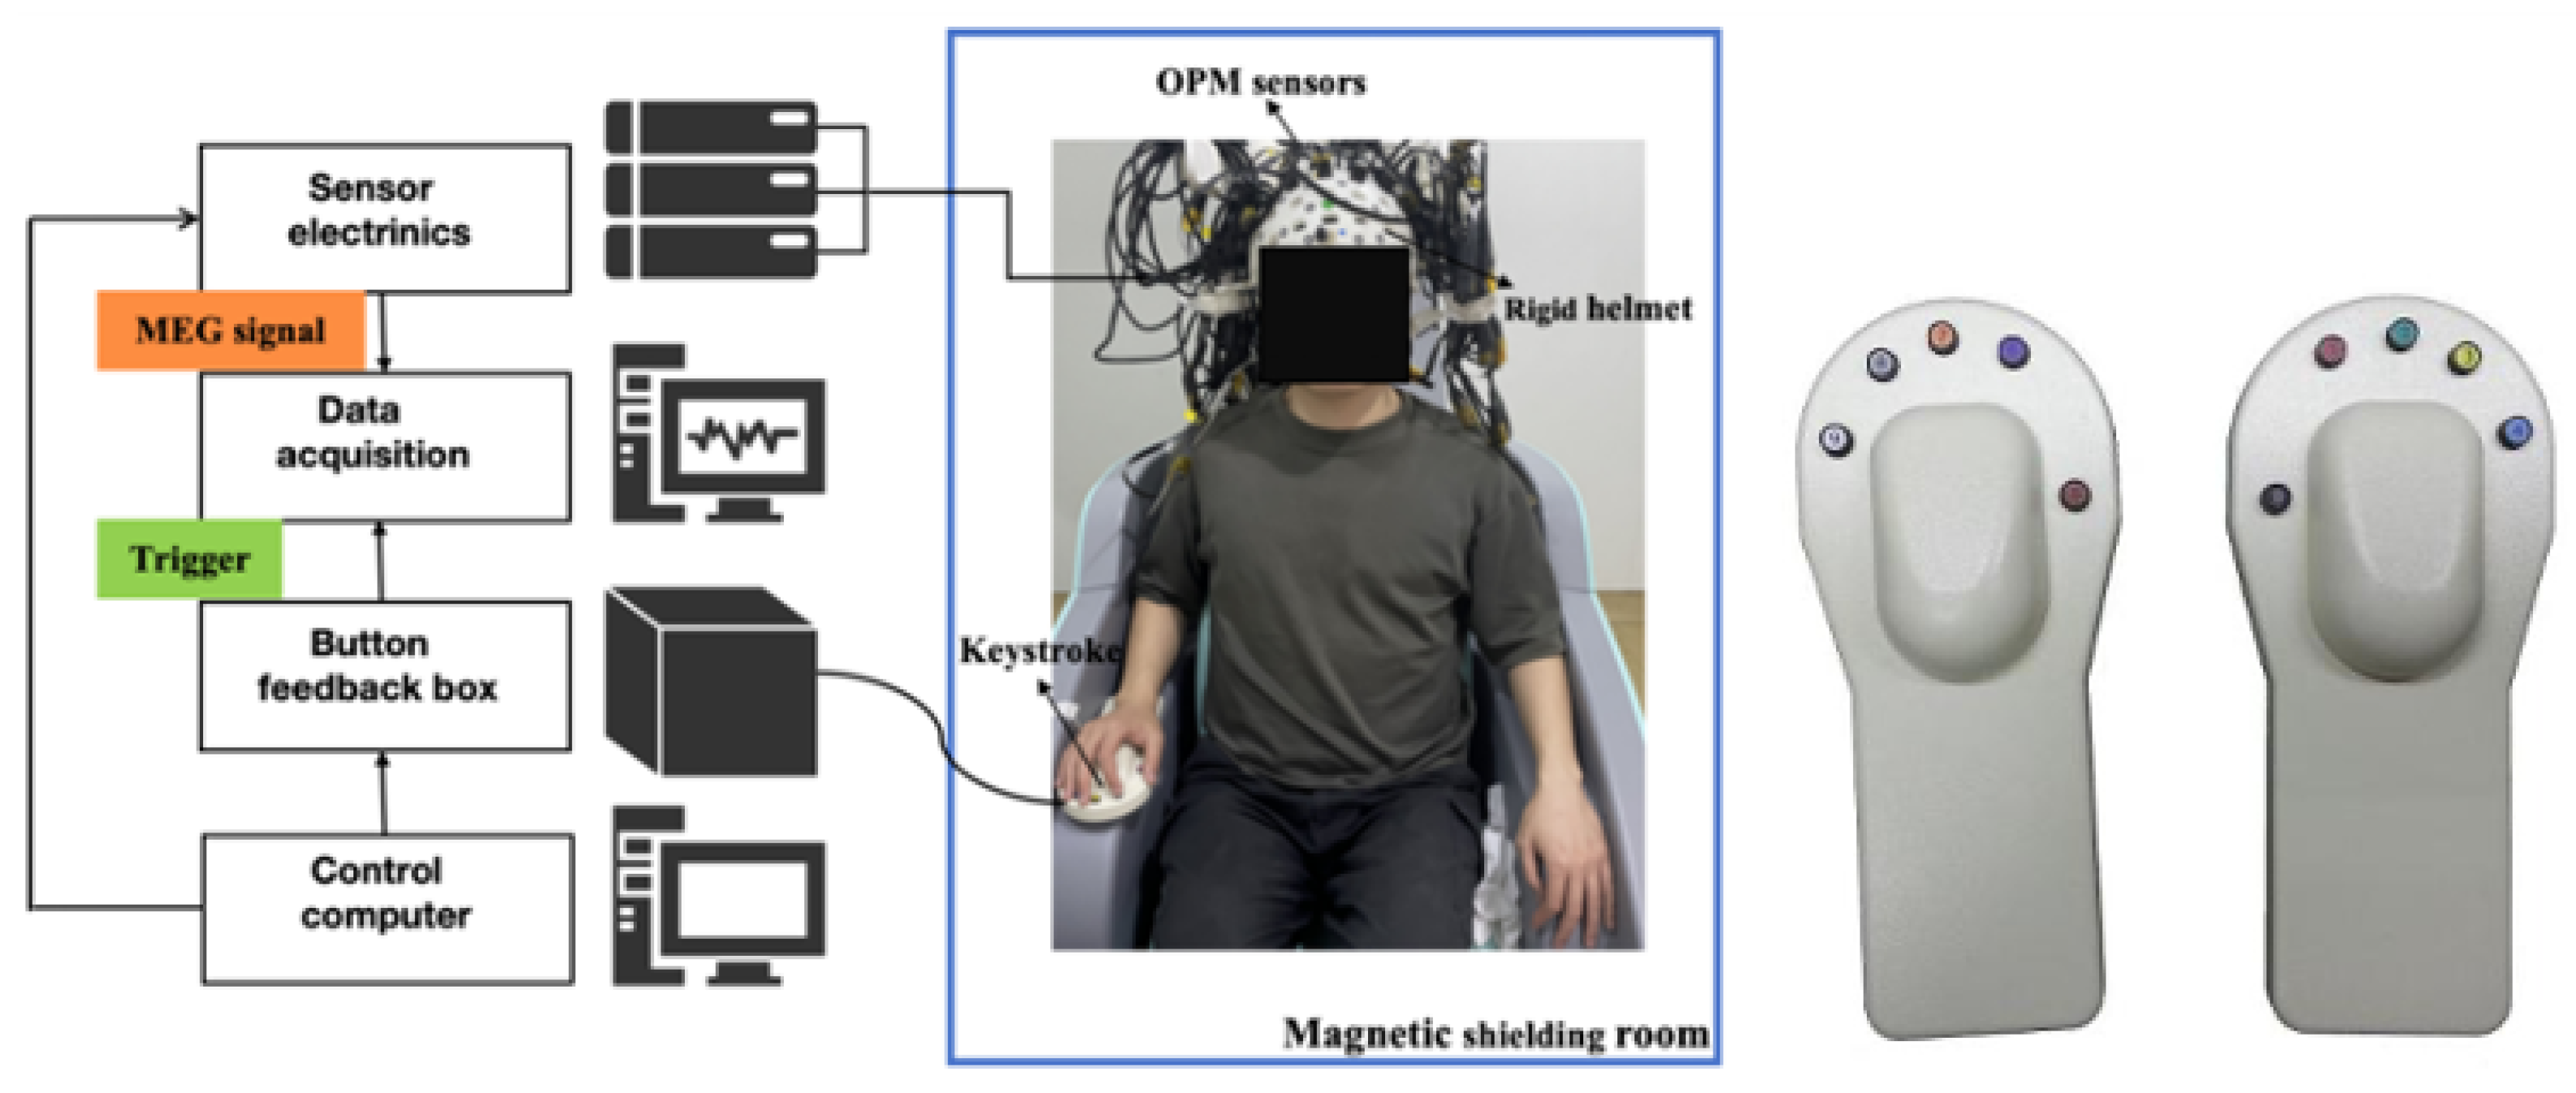
There were 10 healthy subjects in this experiment (average age 27.0 ± 0.5 years, 9 males and 1 female), all of whom were right-handed and had no known congenital developmental disorders, hearing impairments, neurological or psychiatric diseases. All subjects signed informed consent before the experiment. This study followed the Declaration of Helsinki and was approved by the Research Ethics Committee of Beihang University.

2.2. OPM-MEG System

The OPM-MEG experimental setup used in this study is shown in Figure 1. The system uses an optically pumped magnetometer (OPM sensor) produced by QuSpin Inc., Louisville, CO, USA, to measure radial MEG signals, and the sensor is placed in a magnetically shielded room (MSR). The MSR [13,14] is composed of two layers of high magnetic permeability alloy and one layer of copper and equipped with a demagnetization coil [15,16] to reduce the magnetization of the high magnetic permeability alloy layer. The residual magnetic field of the MSR is less than 5 nT. The OPM sensor is fixed with a 3D printed rigid helmet. The sensor is controlled by a computer outside the MSR to minimize experimental interference.The MEG signal from each OPM sensor is recorded using a data acquisition device provided by ART Technology Inc., Beijing, China, with a sampling rate of 1 kHz. Pure tone stimulation is controlled by the Psychtoolbox software 3.0.19 installed on the control computer, sent through headphones, and transmitted to the MSR via a plastic tube. The key feedback device is provided by Shenzhen Medis Medical Technology Co., Ltd., Shenzhen, China. In order to achieve synchronous data recording, both pure tone and key trigger signals are recorded.
The rigid helmet ensures greater sensor stability, significantly reduces artifacts caused by sensor displacement, and maintains precise alignment with the head. This is especially beneficial for long experiments as it minimizes signal errors caused by head movement. MSR effectively suppresses ambient magnetic field interference and significantly improves the signal-to-noise ratio (SNR) of the OPM-MEG system. This is critical for accurately capturing low-frequency neuromagnetic signals with high sensitivity.

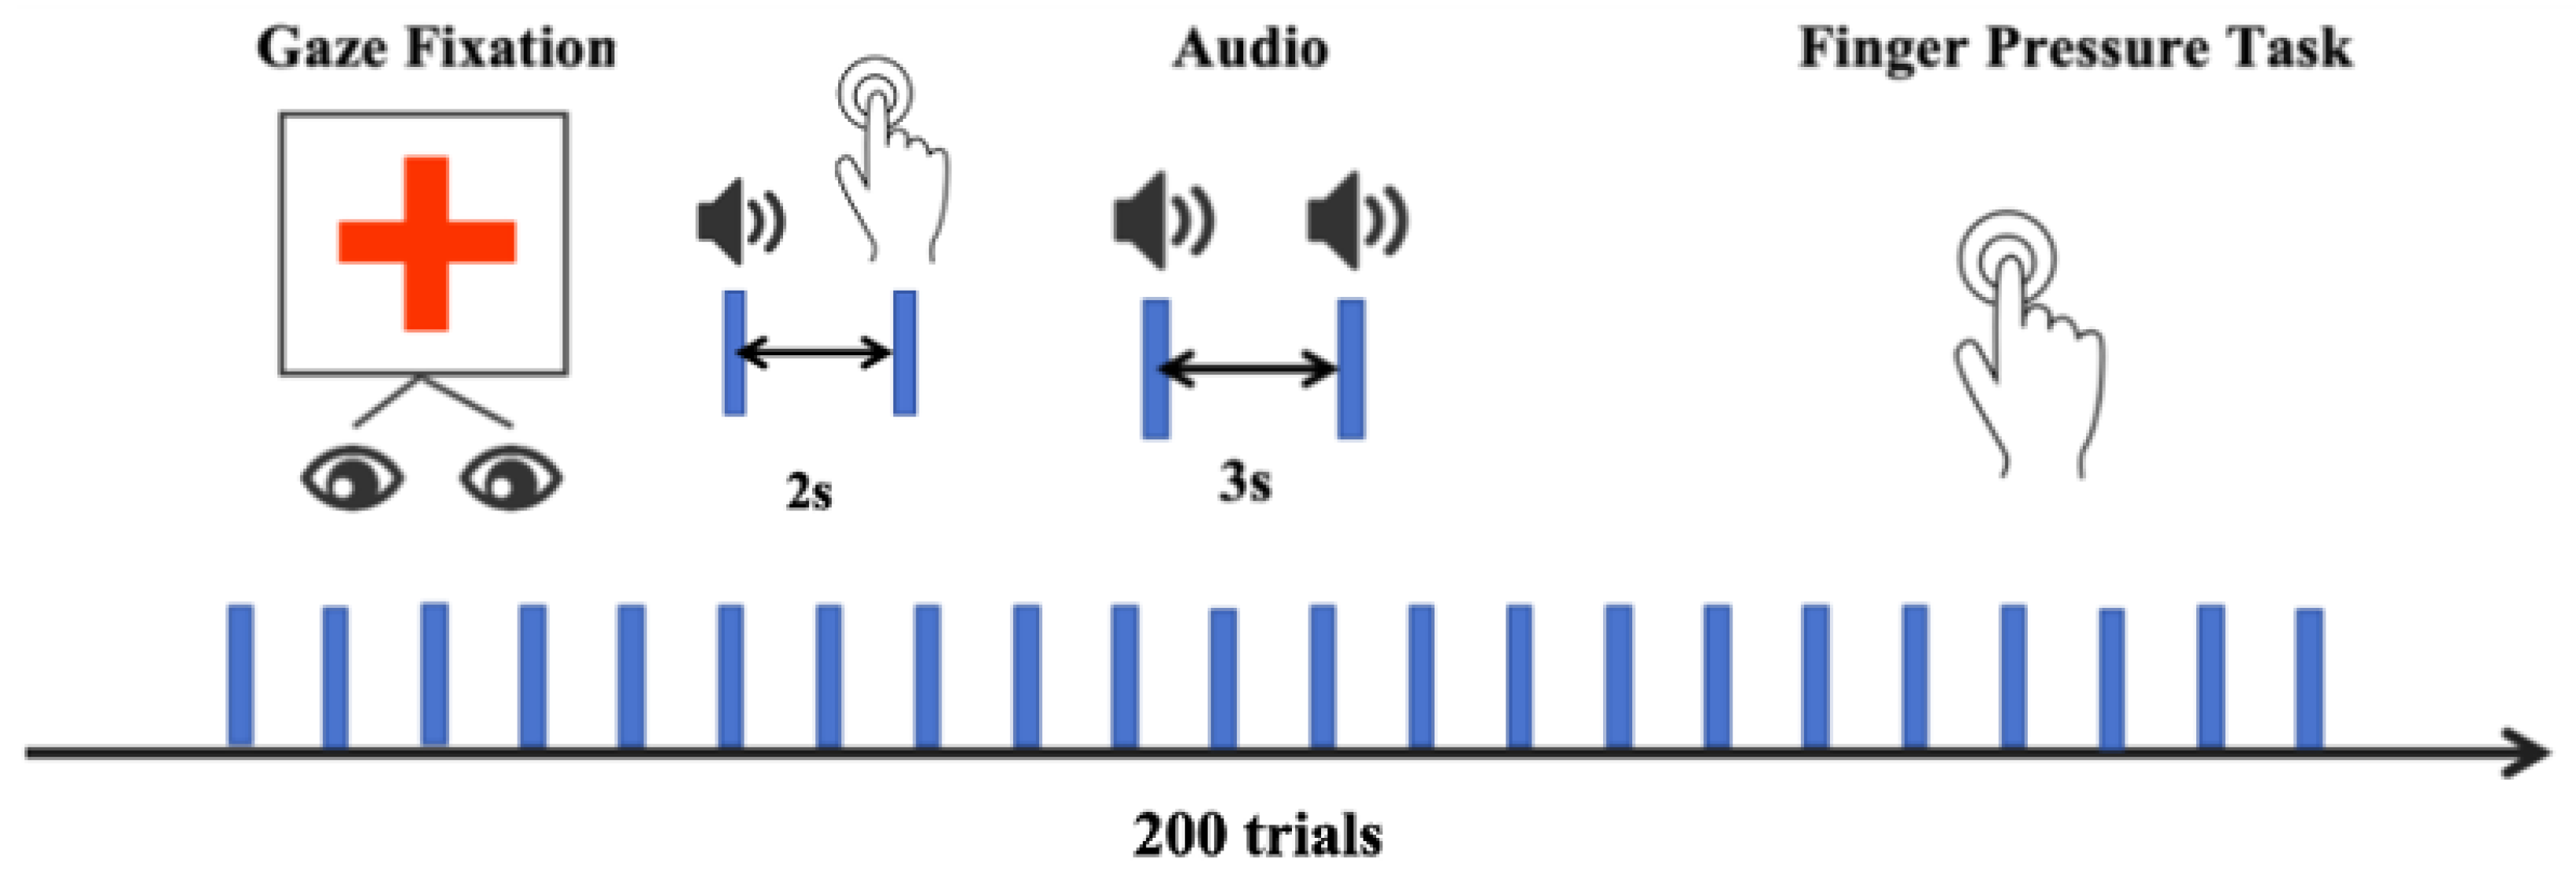
2.3. Experimental Design and Preprocessing

In order to verify the coherence caused by finger tapping movements, a continuous finger tapping movement paradigm was designed in references [17,18]. The schematic diagram of the experimental paradigm design is shown in Figure 2. In the experiment, the participants kept their eyes open and were asked to look at a specific target to avoid eye movements. When an auditory stimulus (1000 Hz, 64 dB) was heard, but it was not annoying to the subjects, the subjects immediately tapped quickly with the index finger of their right or left hand. The inter-stimulus interval was set to 3 s, and about 200 trials were conducted. Before the experiment, the subjects were trained to immediately tap the key with the index finger of their right hand if they heard the sound. The pre-stimulus interval was 1 s (−1 s to 0 s), the auditory stimulus was presented at time zero, the fixation image appeared 200 ms later, and the key prompt was triggered 200 ms later. The subjects were required to complete the key operation within the next 200 ms. The subjects looked at the red cross throughout the process to ensure concentration.
In this study, uniform field correction was used for all OPM-MEG data [19] to reduce the interference of long-range source noise on the spectrum and enhance the spatial specificity of the data. To suppress unknown narrowband noise, especially the frequency components near 25 Hz and 60 Hz, spectral interpolation technology was applied to perform spectrum repair. Subsequently, all data were passed through a 2–60 Hz bandpass filter to retain the task-related neural oscillation frequency band. In addition, for the data under sensorimotor stimulation conditions, a 50 Hz notch filter was further used to remove the interference of power line noise. Next, noisy segments in the data were manually identified and removed through manual inspection to ensure the validity of subsequent analysis. After first checking and removing noisy sections, the continuous data were divided into multiple epochs, with the time range of each epoch being 1.0 s before the onset of stimulation to 2.0 s after the onset of stimulation (total length 3.0 s) to extract the neural response in a single trial. Finally, the independent component analysis (ICA) method was used to remove artifact components related to heartbeat and eye blinking, thereby further improving the clarity of the signal and the reliability of the analysis.

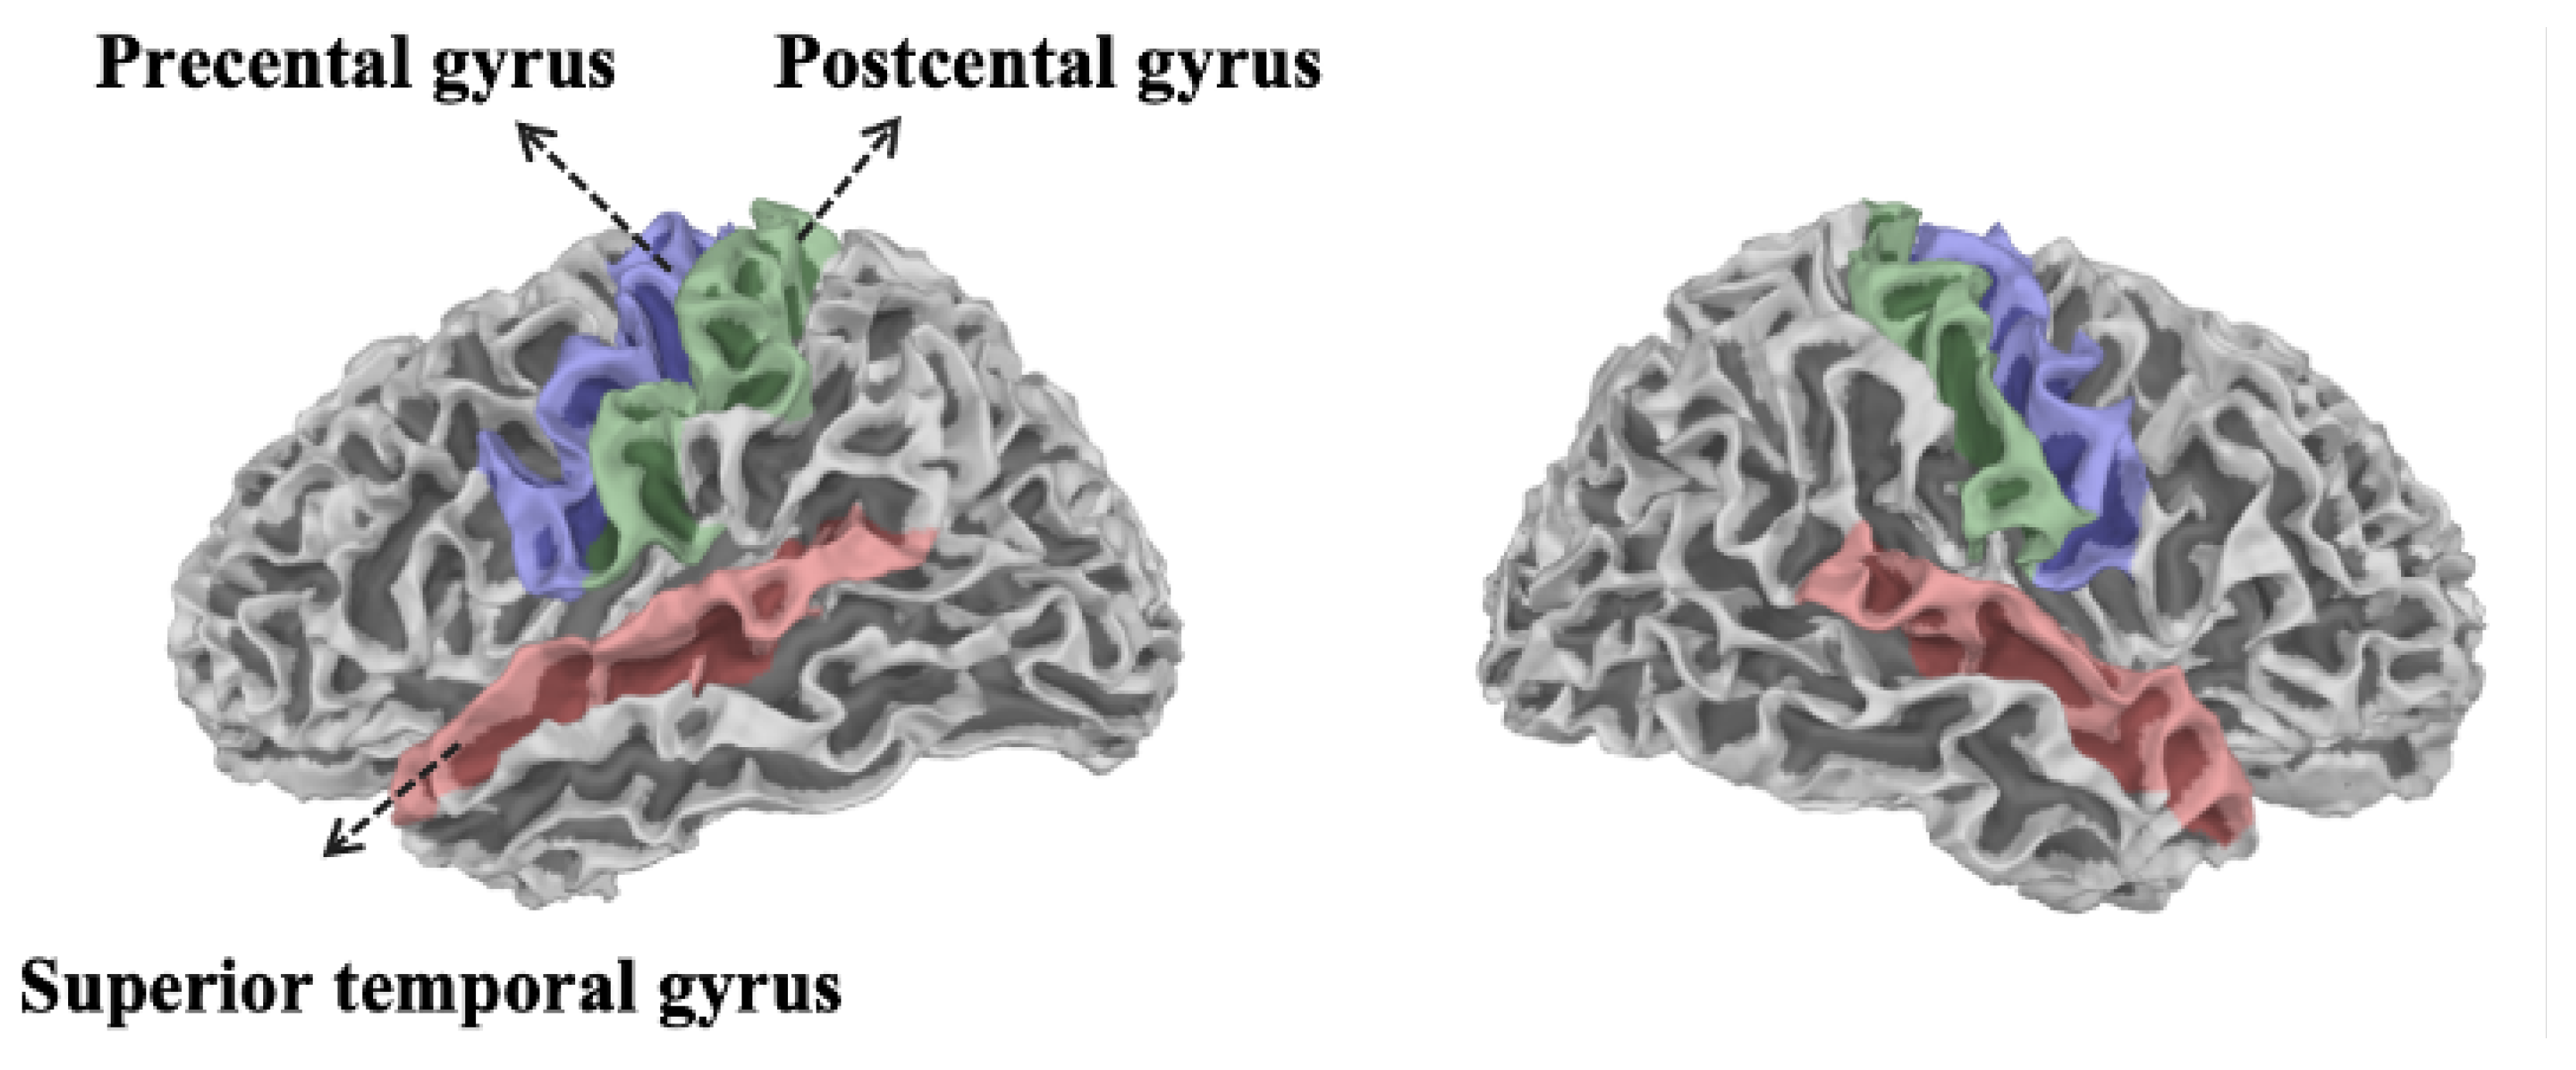
2.4. Registration and Source Localization

In this study, to obtain the three-dimensional structural information of the participants’ heads, we used a structured light scanner (Einscan H, SHINING 3D, Hangzhou, China) to acquire a 3D digital image of each participant’s head while wearing a helmet. The image was then registered with the scalp surface in the anatomical magnetic resonance imaging (MRI) data to determine the spatial position and orientation of the OPM sensor relative to the brain.
The anatomical structural images of all subjects were acquired using a Siemens MAGNETOM Vida 3.0T Biomatrix system (Siemens Healthineers AG, Forchheim, Germany) using a T1-weighted MPRAGE sequence (TR = 2200 ms; TE = 2.53 ms; TI = 1000 ms; flip angle = 8°; field of view = 256 × 256 × 192 mm; voxel size = 1 × 1 × 0.8 mm3).
Cortical reconstruction of the T1 structural MRI was performed using FreeSurfer software v7.2.0 [20], and the scalp, skull, and cerebral cortex were separated using the watershed algorithm to construct a three-layer boundary element model (BEM). Before source localization, the noise covariance matrix was calculated based on the data in the pre-stimulus (−1.0 to 0.0 s) time window to improve the accuracy of subsequent source estimation. Source reconstruction used the dynamic image consistency spatial filtering (DICS) method [21], with a depth weighting factor of 0.8 to correct the bias of the minimum norm estimate on the cortical surface [22]. The regularization parameter was set to 1/SNR2, where the signal-to-noise ratio of OPM-MEG was set to 3 and 1, respectively, reflecting the difference in source localization between the two in a single trial. To control the scope of analysis, the source space was restricted to the region of interest covered by the OPM sensor (the precentral gyrus shown in blue in Figure 3). To enable cross-subject and cross-condition comparisons, the cortical surface of each participant was mapped to the standard template “fsaverage” through surface registration [23]. All processing pipelines were implemented using the MNE-Python toolkit (version 1.10.0) [24,25].

2.5. Registration and Source Localization

In order to analyze the movement-related brain activity recorded by OPM-MEG, this study determined the location of the region of interest (ROI) based on the method proposed in reference [26]. Specifically, the ROI was selected based on the location in Brodmann area 4 (BA4) with the largest power ratio between the neural response before and after the task, reflecting the most significant neural activity changes induced by the motor task. At the same time, the spatial location of the region of interest is also limited by the actual coverage of the OPM sensor, as shown in Figure 3. We focused on the sensor locations corresponding to the movement-related areas in the FreeSurfer automatic cortical parcellation (aparc atlas). This region selection method ensures that the source reconstruction analysis can cover the functional cortex closely related to motor control, thereby improving the interpretability and physiological relevance of the analysis results. In terms of specific regional functional division, the primary motor cortex (M1) is part of the precentral gyrus and is responsible for the execution of voluntary movements, especially playing a key role in fine finger movements. Due to its core position in motor control and its high signal-to-noise ratio in motor tasks, the M1 region was selected as the reference region for coherence analysis in this study. Further, the premotor cortex (PM) is located in front of the primary motor cortex and is widely involved in movement planning and sensory guidance, involving movement execution tasks based on spatial or abstract rules, and may be related to high-level motor cognitive processes such as understanding other people’s movements. In summary, this study selected the contralateral M1 as the reference region for coherence analysis, mainly based on its clear physiological function, stable signal performance, and wide application in previous literature. This area is closely related to sensory-motor integration in tasks such as finger tapping, and is therefore a key node for studying movement-related brain networks.

2.6. Coherence

Coherence is fundamental measures used in the analysis of MEG signals to assess the functional connectivity between different brain regions in the frequency domain.
C x y ( f ) = P x y ( f ) 2 P x x ( f ) P y y ( f )
Here, C x y ( f ) represents the coherence function of frequency, where P x x ( f ) and P y y ( f ) are the respective power spectral densities and P x y ( f ) is the cross-power spectral density, with x and y denoting different signals.

2.7. Statistical Analysis

In order to evaluate the differences in neural responses induced by stimulation, this study first used the Wilcoxon signed rank test method to statistically compare the OPM-MEG data at each time point during the stimulation phase (0–1 s after stimulation) to detect whether there was a significant condition effect.

3. Results

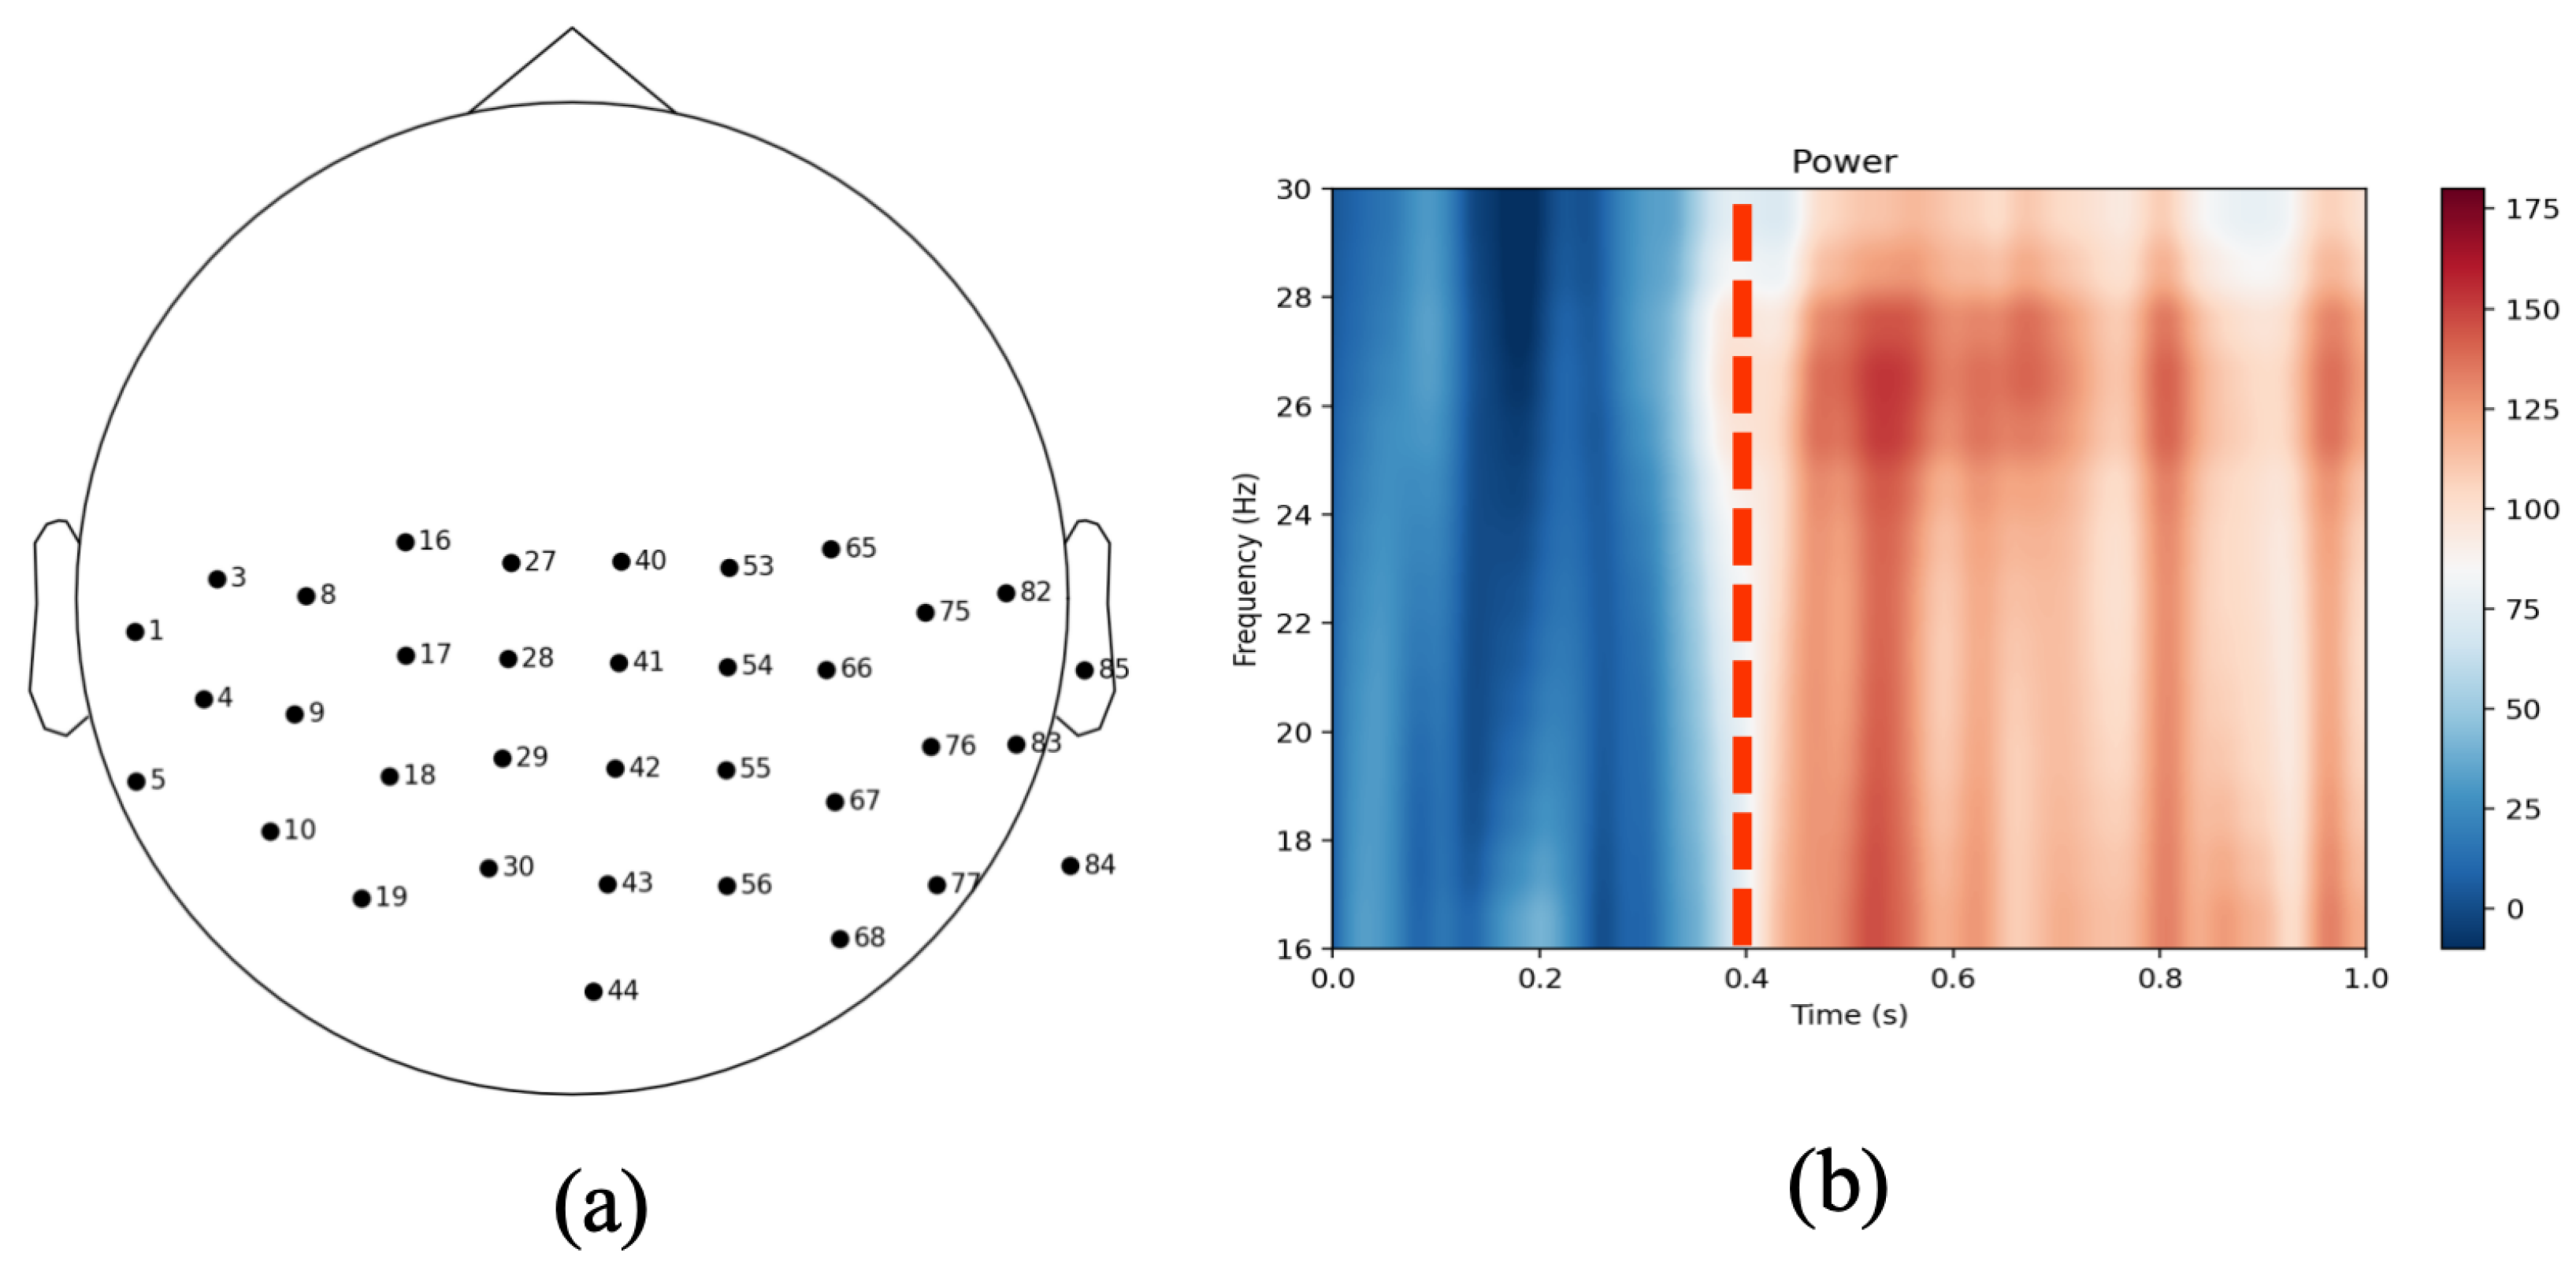
3.1. Sensor-Level Coherence Analysis

The area with the strongest power change in cortical nerve excitation activity related to finger key pressing is mainly concentrated in the Contralateral hemisphere, central area channels, which basically corresponds to the location of the contralateral primary motor cortex, and the channel with the strongest activity is Channel 17. Gross J et al. [27] proposed that the source area with the strongest cortical activity should be selected as the reference area in the dynamic source coherence imaging study. In this paper, Channel 17, which is located in the contralateral primary motor cortex and has the strongest power, is selected as the reference channel. The coherence coefficients of the remaining motor area channels and the reference channel are calculated and expressed as a coherence spectrum in the time-frequency domain (Figure 4).
From the coherence spectrum display results shown in Figure 4, it can be seen that the left central area has extremely high coherence throughout the entire movement process and all frequency bands, while the posterior frontal area and the anterior parietal area have high coherence only in the Alpha band. In addition, the Alpha band in the central area on the ipsilateral (right) side also has a certain degree of coherence. The change in Alpha rhythm caused by finger movement is bilateral, and the intensity of the contralateral side is significantly higher than that of the ipsilateral side, which is consistent with the results obtained in many previous studies.
Figure 5 shows the changes in the topography over time.From the 1–45 Hz passband, three frequency bands, Alpha (8–13Hz), Beta (13–30 Hz), and low Gamma (30–45 Hz), are selected for consideration, respectively. The calculation of the coherence coefficients of the three frequency bands consists in taking the average of the coherence coefficients at each frequency point in the frequency band. The coherence spectrum topology of different frequency bands is shown in Figure 6.
The following information can be obtained from the coherence spectrum topology of different frequency bands shown in Figure 6: First, the locations of the regions with high coherence with Channel 17 in the Alpha, Beta, and low Gamma frequency bands are roughly the same, concentrated in the left central area, the posterior part of the frontal area and the anterior part of the parietal area, basically covering PM and M1; second, for the different neural activity rhythms in the three frequency bands, the range of the coherent area is different, the difference between Alpha and Beta is not very large, while low Gamma is significantly reduced. According to the functional division of the cerebral cortex, the control of finger movement is mainly the contralateral motor cortex, including M1, PM, and the size of the coherence reflects the amount of information transmission between sources. Because PM is mainly involved in the planning of movement, it is speculated that all three rhythm components have information transmission with PM, that is, they are involved in the planning and preparation of movement.
Since the finger key pressing task performed in this paper is relatively simple, the information transmission involved in higher-level functions is lesser, which may be the reason for the smaller coherence area in the low Gamma frequency band. In addition, it can be seen from Figure 6 that the central area and parieto-occipital area on the right side of the Alpha frequency band also have a certain degree of coherence. Since the brain activity areas that control simple finger rhythmic movements also include the ipsilateral cerebellum, thalamus, and posterior parietal lobe [28], this coherence may also be the correlation between deep brain activities mapped to the cortex. In order to have a more intuitive understanding of the time-frequency changes of coherence, Channel 28 located in M1 is taken, divided into three frequency bands of Alpha, Beta, and low Gamma, and the coherence coefficient with Channel 17 on the entire time axis is expressed by a curve, as shown in Figure 7.
The figure shows the change in coherence between Channel 28 (representing M1 area) and Channel 17 (representing PM area) in the Alpha, Beta, and low Gamma frequency bands over time. The red area indicates the statistically significant time period (p < 0.05, FDR correction). Time 0 s corresponds to the moment when the stimulus occurs. The following information can be obtained from the coherence topography of different frequency bands shown in Figure 8: (1) In the Alpha, Beta, and low Gamma frequency bands, the areas showing high coherence are roughly similar to those in the contralateral primary motor cortex, mainly concentrated in the left central area, posterior frontal area, and anterior parietal area, mainly covering the premotor area (PM) and primary motor cortex (M1). (2) In these three frequency bands, the coherence areas are different due to different neural activity rhythms. The Alpha and Beta frequency bands show similar spatial distributions, while the low Gamma frequency band shows a significantly reduced coherence area.

3.2. Source-Level Coherence Analysis

It can be seen from the source localization diagram shown in Figure 8 that the left central area showed extremely high coherence throughout the motor task and in all frequency bands, while the posterior frontal and anterior parietal areas showed high coherence only in the Alpha band. In addition, in the central area on the ipsilateral side (right side) of the finger movement, the Alpha band also showed a certain degree of coherence. The changes in the Alpha rhythm caused by finger movement are bilateral, and the intensity of the contralateral side is significantly higher than that of the ipsilateral side, which is consistent with the results of many previous studies. The color bar represents the coherence magnitude, which is used to reflect the level of neural synchronization between cortices. The results showed that the contralateral primary sensorimotor cortex displayed the most significant coherence enhancement, suggesting that it is in a core regulatory position in task execution. At the same time, obvious coherence activity was also observed in the ipsilateral sensorimotor cortex, indicating a task-related bilateral cortical coordination mechanism.
The following information can be obtained from the coherence topography of different frequency bands shown in Figure 9: (1) In the Alpha, Beta, and low Gamma frequency bands, the areas showing high coherence are roughly similar to those in the contralateral primary motor cortex, mainly concentrated in the left central area, posterior frontal area, and anterior parietal area, mainly covering the premotor area (PM) and primary motor cortex (M1). (2) In these three frequency bands, the coherence areas are different due to different neural activity rhythms. The Alpha and Beta bands show similar spatial distributions, while the low Gamma band shows a significantly reduced coherence area. The analysis results show that the coherence between different frequency bands is statistically different between the dominant hand (right hand) and the non-dominant hand (left hand). Specifically, the maximum value of the Alpha band appears 0.2 s before the tap, with a normalized correlation coefficient of 0.41; the Beta band also appears 0.2 s before the tap, with a normalized coherence coefficient of 0.61; the Gamma band reaches its maximum value 0.1 s after the tap, with a normalized coherence coefficient of 0.71, and then shows a downward trend, with only a small rebound after 0.61 s. By passing the signal of the OPM-MEG system with a high signal-to-noise ratio, we can more clearly observe the dynamic changes in these frequency bands during the task, revealing the different functional characteristics of different frequency bands during movement.

4. Discussion

The Alpha band has the greatest coherence when an action occurs, which may be because the discharge of neurons contained in M1 cells and PM is related to the intensity of the action [29]. The finger force before and after the key is pressed causes the M1 and PM neurons to discharge synchronously, resulting in the most information transmission [30]. In addition, the rhythm of the Beta band mainly comes from the sensorimotor area [31]. PM is responsible for the task of motor planning, and neurons discharge before the action occurs [32]. This may also cause the maximum coherence of the Beta band to appear before the action. For the peak at 0.2 s before the low Gamma band, no clear theoretical basis has been found to explain this phenomenon [33,34,35,36]. Therefore, it is speculated that the increase in coherence before the action may mean that there is a functional connection between the two cortical areas in the final stage of action preparation. Literature [37] has also pointed out that this 30–50 Hz high-frequency rhythmic activity may play an important role as an information carrier in the brain.
The coherence changes observed in the Alpha, Beta, and low Gamma frequency bands in this study are consistent with the phenomenon of pre-exercise Alpha rhythm desynchronization (ERD) and post-exercise Beta rhythm synchronization (ERS) reported in [38,39], further verifying the correctness of the results of this study. However, compared with traditional EEG studies, our use of OPM-MEG not only achieved the recording of movement-related brain area activities at high temporal and spatial resolution, but also revealed for the first time a clear functional connection relationship between M1, PM, and parietal lobe at the source level. In particular, an enhancement of bilateral coherence was observed in the Alpha frequency band, suggesting the existence of a coordination mechanism involving cross-hemispheric or cerebellum.
The brain is a complex network of dynamic systems. There are a large number of functional connections between local and distant brain functional areas, which continuously carry out dynamic information transmission. Signal coherence analysis is a good way to understand this functional connection, which mainly reflects the amount of information transmission between different areas. This paper preliminarily realized the calculation of MEG signal coherence from a methodological perspective and analyzed the coherence of MEG signals caused by finger keystrokes. Preliminary analysis results show that the three frequency bands of Alpha, Beta, and low Gamma are all related to the autonomous keystroke activity of fingers, and these neural patterns change over time. In addition, the increase in coherence coefficient reflects the increase in cooperation between neuronal groups, but it does not mean that neurons are in an excited state. In fact, both inhibitory and excitatory activities can cause changes in coherence. The coherence coefficient only reflects the information transmission between functional areas [40,41,42]. As for whether the purpose of this information transmission is excitation or inhibition, it depends on the specific neurophysiological process. Of course, the specific neural activity processes represented by the three rhythmic components of Alpha, Beta, and low Gamma need further study, and the changes in the coherence of different frequency bands over time, as well as the specific information processing related to this change in the finger movement process, also need further discussion.
One limitation of this study is that the sample size is relatively small and the gender ratio of the subjects is unbalanced, which may limit the statistical power and generalizability of the research results. Future studies are necessary to repeat the results of this study in a larger sample size and gender-balanced participant group and further explore possible gender differences. The rhythmic finger tapping task used in this study is relatively simple, and it is mainly used to evaluate the signal detectability of OPM-MEG in basic motor tasks. Future studies can consider introducing more complex motor paradigms, such as multi-step sequence movements, goal-directed movements, or dual-task movements, to further evaluate the sensitivity of OPM-MEG to subtle differences in motor planning and execution and to further explore the dynamic characteristics of motor networks.

5. Conclusions

This paper uses the OPM-MEG system to measure right- and left-hand finger tapping experiments. The feasibility and accuracy of OPM-MEG in measuring coherence under the movement paradigm were evaluated. The results show that the coherence of the three frequency bands of Alpha (8–13 Hz), Beta (13–30 Hz), and low Gamma (30–45 Hz) and the selected reference signal are roughly in the same position; that the coherence strength and coherence range show a decreasing trend from Alpha to low Gamma; and that the coherence coefficient changes with time. The results provide new experimental evidence to prove the ability of OPM-MEG to measure movement experiments. In summary, this study not only confirms the practicality of OPM-MEG in a simple motor paradigm, but also demonstrates its ability to analyze brain functional connections in frequency, time, and space dimensions, which is superior to traditional EEG methods. In the future, this technology is expected to be extended and applied to more complex motor task paradigms, such as bimanual coordination, motor learning, and motor function research in disease states, providing broader possibilities for the study of motor network mechanisms.

Author Contributions

Conceptualization, H.L. and Y.L. (Yong Li); Data curation, H.L. and Y.L. (Yong Li); Formal analysis, H.L. and Y.L. (Yong Li); Funding acquisition, Y.G. and X.N.; Investigation, H.L. and Y.L. (Yong Li); Methodology, H.L. and Y.L. (Yong Li); Project administration, Y.L. (Ying Liu) and X.N.; Resources, X.N.; Software, H.L. and Y.L. (Yong Li); Supervision, H.L. and Y.L. (Yong Li); Validation, Y.L. (Yong Li) and Y.L. (Ying Liu); Visualization, H.L.; Writing—original draft, H.L.; Writing—review and editing, H.L. All authors have read and agreed to the published version of the manuscript.

Funding

This research was funded by the Innovation Program for Quantum Science and Technology, Hefei National Laboratory, Hefei, 230088, China (No.2021ZD0300503). This study was also supported by the Key R&D Program of Shandong Province (No.2022ZLGX03).

Institutional Review Board Statement

The study was conducted in accordance with the Declaration of Helsinki and approved by the ethical Committee of Beihang University (Nr.BM20200175) for studies involving humans.

Informed Consent Statement

Informed consent was obtained from all subjects involved in the study.

Data Availability Statement

The data, aside from the data published in this manuscript, are not publicly available due to privacy restrictions. You can find the provided data at this link: https://zenodo.org/records/15575984 (accessed on 19 June 2025).

Conflicts of Interest

The authors declare no conflicts of interest.

References

  1. Boto, E.; Holmes, N.; Leggett, J.; Roberts, G.; Shah, V.; Meyer, S.S.; Muñoz, L.D.; Mullinger, K.J.; Tierney, T.M.; Bestmann, S.; et al. Moving magnetoencephalography towards real-world applications with a wearable system. Nature 2018, 555, 657–661. [Google Scholar] [CrossRef]
  2. Liu, Y.; Huang, B.; Li, J.; Li, R.; Zhai, Y. Flow Rate Estimation Based on Magnetic Particle Detection Using a Miniatured High-Sensitivity OPM. IEEE Trans. Instrum. Meas. 2025, 74, 9518010. [Google Scholar] [CrossRef]
  3. Lee, Y.H.; Kim, K. Instrumentation for measuring MEG signals. In Magnetoencephalography: From Signals to Dynamic Cortical Networks; Springer: Berlin/Heidelberg, Germany, 2019; pp. 41–71. [Google Scholar]
  4. Seymour, R.A.; Alexander, N.; Mellor, S.; O’Neill, G.C.; Tierney, T.M.; Barnes, G.R.; Maguire, E.A. Interference suppression techniques for OPM-based MEG: Opportunities and challenges. NeuroImage 2022, 247, 118834. [Google Scholar] [CrossRef]
  5. Gerloff, C.; Richard, J.; Hadley, J.; Schulman, A.E.; Honda, M.; Hallett, M. Functional coupling and regional activation of human cortical motor areas during simple, internally paced and externally paced finger movements. Brain J. Neurol. 1998, 121, 1513–1531. [Google Scholar] [CrossRef]
  6. Bourguignon, M.; Piitulainen, H.; De Tiège, X.; Jousmäki, V.; Hari, R. Corticokinematic coherence mainly reflects movement-induced proprioceptive feedback. Neuroimage 2015, 106, 382–390. [Google Scholar] [CrossRef]
  7. Andres, F.G.; Mima, T.; Schulman, A.E.; Dichgans, J.; Hallett, M.; Gerloff, C. Functional coupling of human cortical sensorimotor areas during bimanual skill acquisition. Brain 1999, 122, 855–870. [Google Scholar] [CrossRef] [PubMed]
  8. Bourguignon, M.; De Tiège, X.; de Beeck, M.O.; Pirotte, B.; Van Bogaert, P.; Goldman, S.; Hari, R.; Jousmäki, V. Functional motor-cortex mapping using corticokinematic coherence. Neuroimage 2011, 55, 1475–1479. [Google Scholar] [CrossRef] [PubMed]
  9. Sacchet, M.D.; Mellinger, J.; Sitaram, R.; Braun, C.; Birbaumer, N.; Fetz, E. Volitional control of neuromagnetic coherence. Front. Neurosci. 2012, 6, 189. [Google Scholar] [CrossRef] [PubMed]
  10. Bourguignon, M.; Jousmäki, V.; de Beeck, M.O.; Van Bogaert, P.; Goldman, S.; De Tiège, X. Neuronal network coherent with hand kinematics during fast repetitive hand movements. Neuroimage 2012, 59, 1684–1691. [Google Scholar] [CrossRef] [PubMed]
  11. Daffertshofer, A.; Peper, C.; Frank, T.; Beek, P. Spatio-temporal patterns of encephalographic signals during polyrhythmic tapping. Hum. Mov. Sci. 2000, 19, 475–498. [Google Scholar] [CrossRef]
  12. Zhang, X.; Jiang, X.; Yuan, X.; Zheng, W. Attentional focus modulates automatic finger-tapping movements. Sci. Rep. 2021, 11, 698. [Google Scholar] [CrossRef]
  13. Jia, L.; Li, J.; Song, X.; Ning, X.; Yang, J.; Qi, S.; Long, T.; Wu, Z.; Wang, R. Hardware-Based Interference Suppression Techniques for OPM-MEG: A Review. IEEE Sens. J. 2024, 25, 2090–2102. [Google Scholar] [CrossRef]
  14. Jia, L.; Song, X.; Suo, Y.; Li, J.; Long, T.; Ning, X. Magnetic field interference suppression for minimized SERF atomic magnetometer. Sens. Actuators A Phys. 2023, 351, 114188. [Google Scholar] [CrossRef]
  15. Yuan, S.; Cui, P.; Shi, M.; Zhang, X.; Yang, J.; Zhang, L.; Ma, Y. Biplanar coils design for spatial nonlinear magnetic fields using an enhanced target field method. J. Phys. D Appl. Phys. 2024, 57, 405002. [Google Scholar] [CrossRef]
  16. Yuan, S.; Shi, M.; Zhang, L.; Yang, J.; Li, T.; Ma, Y. A Design Method of Biplanar Uniform Field Coils Based on Magnetic Shielding Rooms. IEEE Trans. Magn. 2024, 60, 7201904. [Google Scholar] [CrossRef]
  17. Stavrinou, M.L.; Moraru, L.; Cimponeriu, L.; Della Penna, S.; Bezerianos, A. Evaluation of cortical connectivity during real and imagined rhythmic finger tapping. Brain Topogr. 2007, 19, 137–145. [Google Scholar] [CrossRef] [PubMed]
  18. Guo, X.; Xiang, J.; Wang, Y.; O’Brien, H.; Kabbouche, M.; Horn, P.; Powers, S.W.; Hershey, A.D. Aberrant neuromagnetic activation in the motor cortex in children with acute migraine: A magnetoencephalography study. PLoS ONE 2012, 7, e50095. [Google Scholar] [CrossRef]
  19. Tierney, T.M.; Alexander, N.; Mellor, S.; Holmes, N.; Seymour, R.; O’Neill, G.C.; Maguire, E.A.; Barnes, G.R. Modelling optically pumped magnetometer interference in MEG as a spatially homogeneous magnetic field. NeuroImage 2021, 244, 118484. [Google Scholar] [CrossRef] [PubMed]
  20. Fischl, B. FreeSurfer. Neuroimage 2012, 62, 774–781. [Google Scholar] [CrossRef]
  21. Hämäläinen, M.S.; Ilmoniemi, R.J. Interpreting magnetic fields of the brain: Minimum norm estimates. Med Biol. Eng. Comput. 1994, 32, 35–42. [Google Scholar] [CrossRef] [PubMed]
  22. Lin, F.H.; Witzel, T.; Ahlfors, S.P.; Stufflebeam, S.M.; Belliveau, J.W.; Hämäläinen, M.S. Assessing and improving the spatial accuracy in MEG source localization by depth-weighted minimum-norm estimates. Neuroimage 2006, 31, 160–171. [Google Scholar] [CrossRef] [PubMed]
  23. Fischl, B.; Sereno, M.I.; Tootell, R.B.; Dale, A.M. High-resolution intersubject averaging and a coordinate system for the cortical surface. Hum. Brain Mapp. 1999, 8, 272–284. [Google Scholar] [CrossRef]
  24. Gramfort, A.; Luessi, M.; Larson, E.; Engemann, D.A.; Strohmeier, D.; Brodbeck, C.; Parkkonen, L.; Hämäläinen, M.S. MNE software for processing MEG and EEG data. Neuroimage 2014, 86, 446–460. [Google Scholar] [CrossRef]
  25. Gramfort, A.; Luessi, M.; Larson, E.; Engemann, D.A.; Strohmeier, D.; Brodbeck, C.; Goj, R.; Jas, M.; Brooks, T.; Parkkonen, L.; et al. MEG and EEG data analysis with MNE-Python. Front. Neuroinform. 2013, 7, 267. [Google Scholar] [CrossRef]
  26. An, N.; Gao, Z.; Li, W.; Cao, F.; Wang, W.; Xu, W.; Wang, C.; Xiang, M.; Gao, Y.; Wang, D.; et al. Source localization comparison and combination of OPM-MEG and fMRI to detect sensorimotor cortex responses. Comput. Methods Programs Biomed. 2024, 254, 108292. [Google Scholar] [CrossRef]
  27. Gross, J.; Kujala, J.; Hämäläinen, M.; Timmermann, L.; Schnitzler, A.; Salmelin, R. Dynamic imaging of coherent sources: Studying neural interactions in the human brain. Proc. Natl. Acad. Sci. USA 2001, 98, 694–699. [Google Scholar] [CrossRef] [PubMed]
  28. Pollok, B.; Gross, J.; Müller, K.; Aschersleben, G.; Schnitzler, A. The cerebral oscillatory network associated with auditorily paced finger movements. Neuroimage 2005, 24, 646–655. [Google Scholar] [CrossRef]
  29. Peng, J.; Zikereya, T.; Shao, Z.; Shi, K. The neuromechanical of Beta-band corticomuscular coupling within the human motor system. Front. Neurosci. 2024, 18, 1441002. [Google Scholar] [CrossRef]
  30. Akdogan, I.; Ogmen, H.; Kafaligonul, H. The phase coherence of cortical oscillations predicts dynamic changes in perceived visibility. Cereb. Cortex 2024, 34, bhae380. [Google Scholar] [CrossRef] [PubMed]
  31. Lukas, R.; Rhodes, N.; Boto, E.; Holmes, N.; Hill, R.M.; Gonzalo, R.R.; Shah, V.; Doyle, C.; Osborne, J.; Bowtell, R.W.; et al. Tracking the neurodevelopmental trajectory of beta band oscillations with optically pumped magnetometer-based magnetoencephalography. eLife 2024, 13, RP94561. [Google Scholar] [PubMed]
  32. Balasubramanian, P.; De Leon, R.P.; Snyder, D.B.; Beardsley, S.A.; Hyngstrom, A.S.; Schmit, B.D. Altered Cortical Activity during a Finger Tap in People with Stroke. Brain Topogr. 2024, 37, 907–920. [Google Scholar] [CrossRef] [PubMed]
  33. Xiang, J.; DeGrauw, X.; Korman, A.M.; Allen, J.R.; O’Brien, H.L.; Kabbouche, M.A.; Powers, S.W.; Hershey, A.D. Neuromagnetic abnormality of motor cortical activation and phases of headache attacks in childhood migraine. PLoS ONE 2013, 8, e83669. [Google Scholar] [CrossRef] [PubMed]
  34. Rier, L.; Zamyadi, R.; Zhang, J.; Emami, Z.; Seedat, Z.A.; Mocanu, S.; Gascoyne, L.E.; Allen, C.M.; Scadding, J.W.; Furlong, P.L.; et al. Mild traumatic brain injury impairs the coordination of intrinsic and motor-related neural dynamics. NeuroImage Clin. 2021, 32, 102841. [Google Scholar] [CrossRef]
  35. Mashat, M.E.M.; Lin, C.T.; Zhang, D. Effects of task complexity on motor imagery-based brain–computer interface. IEEE Trans. Neural Syst. Rehabil. Eng. 2019, 27, 2178–2185. [Google Scholar] [CrossRef] [PubMed]
  36. Hamedi, M.; Salleh, S.H.; Noor, A.M. Electroencephalographic motor imagery brain connectivity analysis for BCI: A review. Neural Comput. 2016, 28, 999–1041. [Google Scholar] [CrossRef]
  37. Meador, K.J.; Ray, P.G.; Echauz, J.R.; Loring, D.W.; Vachtsevanos, G.J. Gamma coherence and conscious perception. Neurology 2002, 59, 847–854. [Google Scholar] [CrossRef]
  38. Pfurtscheller, G.; Da Silva, F.L. Event-related EEG/MEG synchronization and desynchronization: Basic principles. Clin. Neurophysiol. 1999, 110, 1842–1857. [Google Scholar] [CrossRef]
  39. Pfurtscheller, G.; Zalaudek, K.; Neuper, C. Event-related beta synchronization after wrist, finger and thumb movement. Electroencephalogr. Clin. Neurophysiol. Mot. Control 1998, 109, 154–160. [Google Scholar] [CrossRef]
  40. Thaut, M.H.; Abiru, M. Rhythmic auditory stimulation in rehabilitation of movement disorders: A review of current research. Music Percept. 2010, 27, 263–269. [Google Scholar] [CrossRef]
  41. Wang, L.; Zhang, J.; Zhang, Y.; Yan, R.; Liu, H.; Qiu, M. Conditional granger causality analysis of effective connectivity during motor imagery and motor execution in stroke patients. BioMed Res. Int. 2016, 2016, 3870863. [Google Scholar] [CrossRef]
  42. Benz, H.L.; Zhang, H.; Bezerianos, A.; Acharya, S.; Crone, N.E.; Zheng, X.; Thakor, N.V. Connectivity analysis as a novel approach to motor decoding for prosthesis control. IEEE Trans. Neural Syst. Rehabil. Eng. 2011, 20, 143–152. [Google Scholar] [CrossRef] [PubMed]
Figure 1. OPM-MEG system and buttons.
Photonics 12 00766 g001
Figure 2. Experimental paradigm.
Photonics 12 00766 g002
Figure 3. Regions of interest in the brain.
Photonics 12 00766 g003
Figure 4. (a) Sensor layout and coherence. (b) Time-frequency diagram of Sensor 17.
Photonics 12 00766 g004
Figure 5. Topography of time domain signals.
Photonics 12 00766 g005
Figure 6. Topography of coherence results in the frequency domain.
Photonics 12 00766 g006
Figure 7. Alpha, Beta, and Gamma source waveforms, statistically significant (p < 0.05, FDR corrected).
Photonics 12 00766 g007
Figure 8. Source localization, statistically significant (p < 0.05, FDR corrected).
Photonics 12 00766 g008
Figure 9. The top three figures show the source waveforms and statistically significant points (p < 0.05, FDR correction) of Alpha, Beta, and lower Gamma of the dominant hand (right hand); the bottom three figures show the source waveforms and statistically significant points of Alpha, Beta, and lower Gamma of the dominant hand (left hand).
Photonics 12 00766 g009
Disclaimer/Publisher’s Note: The statements, opinions and data contained in all publications are solely those of the individual author(s) and contributor(s) and not of MDPI and/or the editor(s). MDPI and/or the editor(s) disclaim responsibility for any injury to people or property resulting from any ideas, methods, instructions or products referred to in the content.

