1. Introduction
The spin-exchange relaxation-free (SERF) atomic magnetometer has been widely recognized as an advanced platform for magnetic field sensing due to its exceptional sensitivity and precision [
1,
2]. This technique utilizes alkali metal atoms operating in a regime free of spin exchange relaxation, enabling ultrasensitive magnetic field detection [
3]. Its applications span a wide range of fields, including medical diagnostics—such as the detection of cardiac and cerebral magnetic signals—as well as geophysical exploration and geological research [
4]. In SERF magnetometers, electronic polarization of alkali metal atoms is achieved through optical pumping with circularly polarized light, whereas the nuclear polarization of inert gas atoms is realized via spin-exchange collisions. This dual polarization scheme contributes significantly to the achievement of high precision measurements under strongly coupled and magnetically self-compensated conditions [
5,
6]. Recent progress in this field has been directed toward improving the uniformity of the electron spin polarization and stabilizing the pump light power, to suppress the impact of external perturbations on the precision of the measurement [
7,
8]. Given its remarkable performance, the SERF atomic magnetometer is regarded as a highly promising tool for a wide array of multidisciplinary applications in both scientific research and engineering practice, and is anticipated to drive the advancement of next-generation magnetic sensing technologies [
9].
In high-precision optical measurements and magnetic field detection, the stability of optical power is crucial to ensuring the accuracy and reliability of measurement results [
10]. The primary methods for stabilizing laser power include mechanical aperture adjustment, acousto-optic modulators (AOM) [
11,
12], electro-optic modulators (EOM) [
13,
14,
15], laser current feedback control, and liquid crystal variable retarders (LCVR) [
16,
17]. Mechanical apertures have a simple structure, but suffer from slow response times and mechanical wear. AOM utilizes the acousto-optic effect to generate ultrasonic gratings, enabling laser intensity modulation via diffraction efficiency. They are capable of closed-loop power stabilization with fast response, but are sensitive to polarization. EOM, based on the electro-optic effect, modulate the refractive index of a crystal through an external electric field, thereby controlling the phase or amplitude of the laser beam. EOM systems offer extremely low noise and high stability, but are typically expensive. Laser current feedback circuits enable fast and stable control; however, they are susceptible to temperature drift, requiring thermal management for optimal performance, and their dynamic range is often limited. In contrast, LCVRs offer significant advantages. They enable precise modulation of optical intensity by electrically controlling the orientation of liquid crystal molecules, combining millisecond-level response times with sub-milliwatt power consumption. LCVRs allow for continuously tunable optical power, low power operation, and broad wavelength compatibility. Moreover, their excellent low-frequency stability ensures that no additional low-frequency noise is introduced into the magnetometer system. The fully solid-state architecture eliminates mechanical wear, supporting lifetimes exceeding one million cycles. Furthermore, the LCVR is compact, easily integrable, and supports both analog continuous modulation and closed-loop control, while maintaining stability over a wide temperature range and offering a cost-effective solution. At present, various types of LCVRs have been developed for laser power stabilization, including conventional liquid crystal cells, ferroelectric liquid crystals (FLCs), and polymer-dispersed liquid crystals (PDLCs), each with distinct characteristics. Conventional liquid crystal cells provide high precision but are typically bulky and sensitive to temperature drift. FLCs exhibit rapid response times but are limited by high costs and discrete modulation capability. PDLCs offer structural simplicity but suffer from high optical losses and poor stability. Compared with these technologies, the liquid crystal variable retarder based on micro-electromechanical systems (MEMS-LCVR) exhibits significant advantages [
18]. Manufactured using semiconductor fabrication techniques, the MEMS-LCVR offers an excellent cost–performance ratio. Its miniaturized design enables reduced volume and improved system integration. Additionally, it features low driving voltage requirements, high operational stability (including compatibility with closed-loop control), and a wide operating temperature range. These characteristics make the MEMS-LCVR particularly well-suited for applications in space-constrained environments, such as portable devices, medical instruments, and multi-channel systems. As a result, the MEMS-LCVR is increasingly emerging as a mainstream solution in the field of optical power stabilization. Its economic efficiency, high performance, and compactness align well with the core demands of modern optoelectronic systems for high performance, miniaturization, and low cost [
19,
20].
In this study, LCVR is adopted to achieve laser power stabilization, with a MEMS-based variant chosen for its favorable trade-off between performance, size, and cost. The LCVR is integrated into a polarization measurement system utilizing phase modulation, where the control voltage is programmed to increase monotonically—corresponding to a decreasing phase retardation sequence—to minimize the system’s response latency. Furthermore, the incident angle of light on the LCVR is maintained within a narrow angular range to enhance measurement precision [
21]. In conclusion, the optical power stabilization method proposed in this study, based on the integration of MEMS technology with a liquid crystal attenuator, demonstrates notable advantages in terms of cost-efficiency, compactness, and operational effectiveness. This approach contributes to the advancement of high-precision optical measurement techniques. Owing to its broad application potential, the proposed technology offers a practical and efficient solution for fields requiring precise magnetic field measurements, such as medical imaging and geophysical exploration.
2. Method
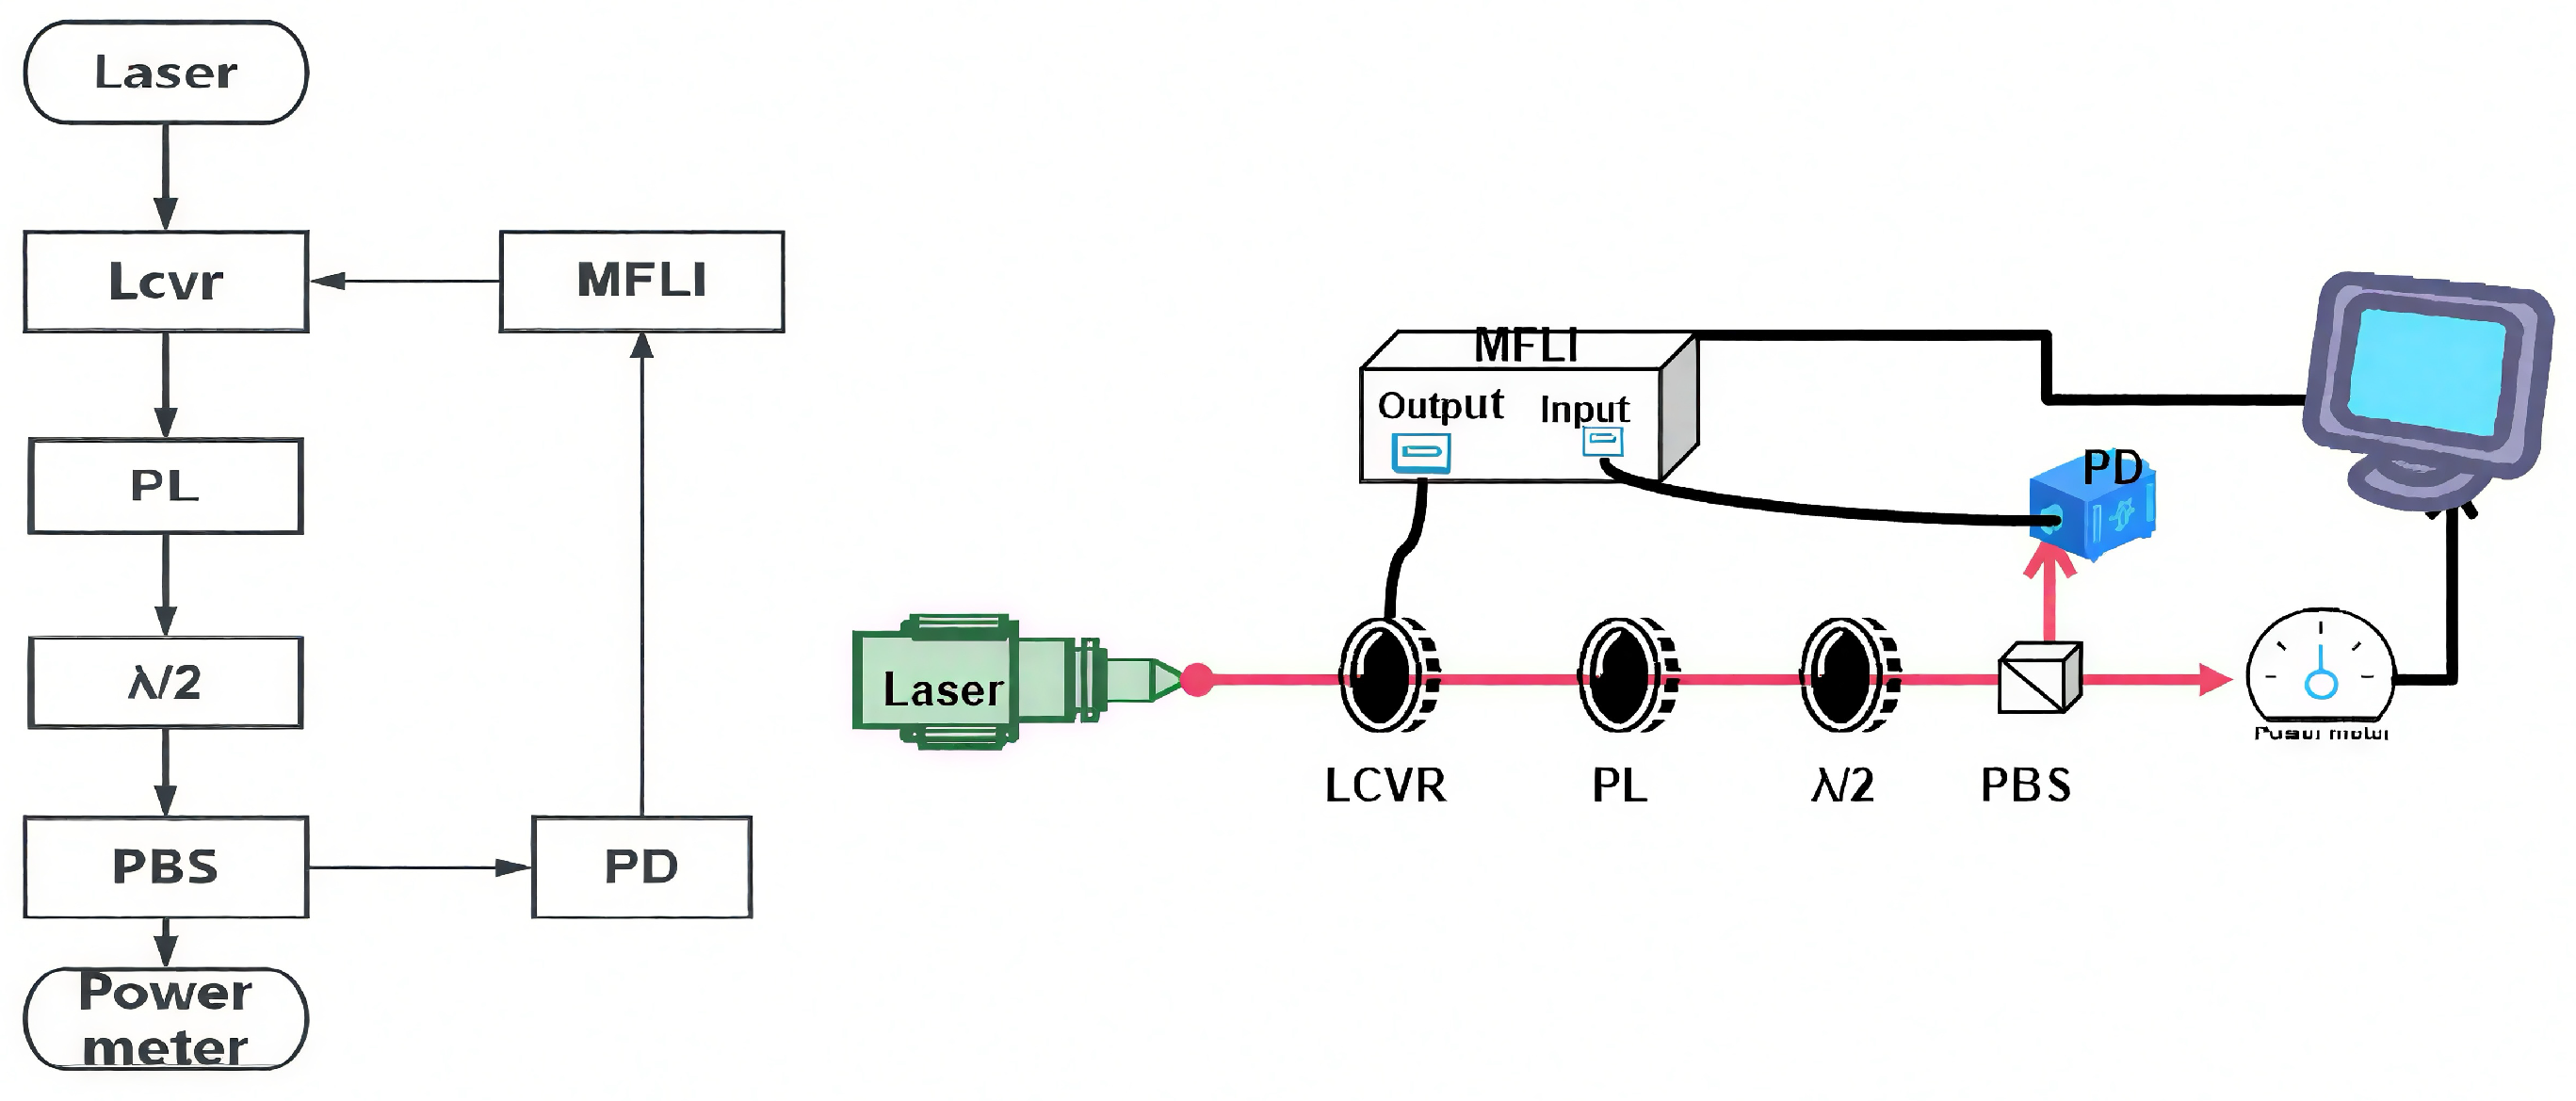
In this study, a closed-loop optical power stabilization system was constructed based on a LCVR utilizing MEMS technology. As illustrated in
Figure 1, the experimental setup primarily consists of a 795 nm semiconductor laser, a half-wave plate, and a linear polarizer, an LCVR with an operating wavelength range of 700–1100 nm, a retardance tunable from 0 to
, a response time of 15.5 ms (rising) and 1.5 ms (falling), an operating temperature range of
°C to
°C, a polarization beam splitter (PBS), a photodetector (PD), an MFLI lock-in amplifier, and a PID control system.
Linearly polarized light emitted from the laser is first pre-conditioned by a half-wave plate to adjust the polarization orientation before entering the LCVR. The LCVR continuously modulates the polarization direction of the incident laser beam in response to an externally applied voltage signal, with a tunable range of 0–90°. The polarization-modulated beam then passes through a linear polarizer oriented at a 45° angle with respect to the optical axis of the LCVR. As a result, the transmitted optical power exhibits a periodic attenuation behavior corresponding to the changes in the polarization state. In the PBS-based beam-splitting system, the transmitted p-polarized component is monitored in real time using a power meter, while the reflected s-polarized component is converted into an electrical signal via the PD and subsequently input to the lock-in amplifier. There, it undergoes phase-sensitive detection against a reference signal that corresponds to the target optical power. The resulting error signal is processed by a PID controller, which adjusts the feedback voltage applied to the LCVR, thus forming a closed-loop control system. This dynamic feedback mechanism maintains equilibrium among the polarization state, optical power, and electrical signal. The integration and optimization of these components ensure precise control and stable output of the optical power, fulfilling the stringent requirements of high-precision optical measurement systems.
Through the implementation of this system, the stability of optical power was thoroughly investigated and validated, providing novel strategies and methodologies for future high-precision optical measurement technologies. The constructed optical power stabilization system fully leveraged the critical role of polarizers, enabling precise control over the polarization state of the light beam. The polarizers not only effectively converted natural light into polarized light to meet experimental requirements related to biasing and detection, but also significantly suppressed noise induced by intensity fluctuations through fine adjustment. This process was essential for enhancing system stability and measurement accuracy, particularly in applications that demand high-precision optical measurements. In addition, the combined use of the half-wave plate and the PBS endowed the system with the capability of finely tuning the polarization state of the light beam. By precisely adjusting the orientation of the half-wave plate and optimizing the positioning of the PBS, the optical path was further refined, thereby minimizing interference caused by undesired polarization state variations. This optimization contributed significantly to the overall system stability and measurement precision. The accurate control of the polarization state not only improved the system’s resilience to external disturbances but also ensured the high-performance operation of the optical power stabilization mechanism. Therefore, the integration of the half-wave plate and PBS serves as an indispensable optical configuration within the system. Their synergistic operation plays a decisive role in achieving accurate and stable control of the optical power.
Liquid crystal molecules exhibit long-range orientational order and can be classified into several phases, such as nematic and smectic phases. Nematic liquid crystals are commonly used in LCVRs due to their molecular orientation being readily tunable by an external electric field. When light enters a liquid crystal layer, birefringence occurs: the incident light is split into an ordinary ray (o-ray), which vibrates along the molecular long axis, and an extraordinary ray (e-ray), which vibrates perpendicular to it. These two components propagate at different velocities within the liquid crystal medium, resulting in a phase difference (retardation). By applying an external electric field (typically in the form of a voltage), the orientation of the liquid crystal molecules is altered, thereby modulating the refractive index difference
between the o-ray and e-ray [
22].
Here,
and
represent the refractive indices of the extraordinary and ordinary rays, respectively. The resulting optical path difference
can be expressed as follows:
Here,
d denotes the thickness of the liquid crystal layer. Consequently, the resulting phase retardation
of the output light can be expressed as follows:
Here,
denotes the wavelength of the incident light. Under the influence of an external electric field E, the variation of the refractive index difference with respect to
E can be approximately described by a hyperbolic secant function, as follows:
Here,
represents the refractive index difference in the absence of an electric field, and
denotes the threshold electric field, which is approximately 1 V in this experiment. Accordingly, the relationship between the phase retardation
and the applied electric field E can be expressed as follows:
The phase retardation
is continuously tunable with the applied electric field and decreases as the voltage increases. In this experiment, the modulation range of the LCVR extends from 0 to
. This implies that the LCVR can be used to manipulate the polarization state of laser light under an external electric field. When the optical axis of the LCVR is aligned at
with respect to the
X-axis, the corresponding Jones matrix
after the LCVR is given by the following:
For an arbitrary incident polarization state
, the resulting output state can be expressed as follows:
By dynamically tuning
, the polarization state of the laser can be continuously scanned over the Poincaré sphere. In the experimental system incorporating the LCVR, a closed-loop optical power feedback control system is designed, in which a low-power beam is used as the feedback signal and a higher-power beam serves as the output for the magnetometer system. To control the polarization state of the laser and the beam-splitting ratio, a combination of a half-wave plate (HWP) and a polarizing beam splitter (PBS) is employed. The reflected beam from the PBS is used as the feedback signal, and the optical power is adjusted by rotating the orientation of the HWP plate. However, due to the presence of elliptically polarized or unpolarized components in the laser beam, the splitting ratio may become unstable. To ensure that the incident light is purely linearly polarized, a linear polarizer (PL) is placed before the HWP plate. The Jones matrices for the polarizer (PL), the polarizing beam splitter (PBS), and the half-wave plate (HWP) are given as follows:
Here,
denotes the Jones matrix of the PL, whose transmission axis is oriented at an angle
with respect to the
X-axis.
represents the Jones matrix of the HWP, whose fast axis is oriented at an angle
relative to the
X-axis.
and
denote the Jones matrices corresponding to the transmitted and reflected ports of the PBS, respectively. Therefore, the cumulative Jones matrix for the laser beam passing sequentially through these three components can be expressed as follows:
Here,
denotes the Jones matrix of the transmitted optical path, and
represents the Jones matrix of the reflected optical path. By combining with Equation
, the overall Jones matrix of the reflected optical path incorporating the LCVR is obtained as follows:
For an arbitrary incident polarization state
, the optical intensity detected by the photodetector (PD) in the feedback loop can be expressed as follows:
According to Equation (
15), by setting the angle between the PL and the HWP to
, which corresponds to
, and further setting
, Equation (
15) can be simplified as follows:
The amplitude can be expressed as follows:
It can be seen that
is a monotonically decreasing function within the range
, and that
decreases monotonically with the electric field
E. Since the voltage range used in the experiment is 2–10 V,
increases monotonically with
E in this range.
Based on the above analysis, a PID controller is selected to implement closed-loop control of the optical power [
23]. The control system is constructed as shown in the
Figure 2.
The target optical power is set as the reference input
, and the error signal
is computed as the difference between
and the feedback signal. This error signal is processed by the PID controller to generate the control signal
, which directly acts on the LCVR. The transmitted light from the PBS, denoted as
, serves as the system output, while the reflected light is used as the feedback signal. Since the ratio between the feedback optical power and the transmitted light is fixed, a feedback gain
H is introduced in the feedback loop, so that the error signal is given by
. PID control is a linear combination of proportional, integral, and derivative control, making it particularly suitable for linear systems and steady-state control scenarios. In this work, since
increases monotonically with the electric field
E, PID control is also applicable. The role of proportional control is to directly amplify the error signal, enabling a rapid response to the current error.
The integral control component accumulates the historical error over time, effectively eliminating steady-state error.
The derivative control component predicts the trend of error variation and helps suppress overshoot.
Therefore, the overall control signal can be expressed as follows:
As discussed earlier, since
increases monotonically with the electric field
E, the control signal should decrease when the error signal is negative and increase when the error signal is positive. Therefore, the proportional gain must be set as a positive value to ensure that the system operates under negative feedback.
In the SERF atomic magnetometer system, the primary role of the pump beam is to induce the orientation (vector polarization) and alignment (tensor polarization) of atomic spins. The polarization state and power of the pump light significantly affect the efficiency of optical pumping [
24]. In practical applications, laser sources often exhibit amplitude noise and polarization fluctuations, which influence the polarization angle of the atomic ensemble [
25]. These fluctuations, in turn, affect the effective magneto-optical rotation signal and magnetic field sensitivity. Under weak magnetic field conditions, the optical rotation angle
of the probe beam is primarily influenced by the atomic spin polarization, which is affected by both the pumping rate P and the atomic spin relaxation rate
. According to the related literature, when the pump light intensity I is stable and under appropriate conditions,
is approximately proportional to
and, further, to the magnetic field B, as expressed by the following:
This equation reveals that the polarization rotation angle of the probe light is directly proportional to the pumping rate P and the magnetic field strength B, while being inversely affected by the spin relaxation rate . The pumping rate P itself is proportional to the optical power of the pump laser , and consists of three main contributions: optical broadening, spin-destruction relaxation, and spin-exchange relaxation. Under SERF operating conditions, spin-exchange relaxation is effectively suppressed, which makes the system more sensitive to fluctuations in optical power. Therefore, any variation in the pump laser power directly alters the pumping rate P, leading to changes in the polarization rotation angle , which in turn causes drift in the output signal of the magnetometer and degrades the accuracy of magnetic field measurements. Consequently, maintaining stable optical power is a fundamental requirement for ensuring the high sensitivity and stability of SERF atomic magnetometers.
Subsequently, the LCVR based optical power control system is integrated with the SERF atomic magnetometer. The experimental schematic and partial physical setup of a SERF atomic magnetometer are shown in
Figure 3. The experimental platform for the magnetometer comprises an optical system, a temperature control system, and a magnetic field compensation system [
26]. The overall system is compactly designed to facilitate the investigation of the impact of optical power stabilization on the performance of magnetic field measurements. The experimental procedure begins with the initialization of the laser source, during which the drive current is set to 180 mA and the temperature is adjusted to 28.5 °C, ensuring that the laser wavelength is locked to the rubidium D1 transition frequency (377.1 THz). After polarization shaping, the output beam is coupled into the optical path of the magnetometer via a polarization-maintaining fiber, with an incident optical intensity of approximately 10
. The pumping light is provided by an ultra-narrow linewidth (<1 kHz) and high power-stability 795 nm laser [
27], featuring a high side-mode suppression ratio (>60 dB) and low beam divergence (<1 mrad). These characteristics enhance the polarization efficiency of rubidium atoms and improve the signal-to-noise ratio (SNR) of magnetic field detection. Such lasers are widely used in rubidium spectroscopy, atomic clocks, and quantum devices due to their superior compatibility and stability.
To achieve the atomic density required for magnetometry, a high-frequency sinusoidal signal (190 kHz, 1.5 V) generated by a function generator is used to drive a power amplifier for heating the rubidium vapor cell. Temperature stabilization is implemented through a LabVIEW-based closed-loop control program, maintaining the vapor cell at 145 ± 0.03 °C to ensure stable operation under SERF conditions.
The optical signal is collected via a photodetector, converted into a voltage signal by a transimpedance amplifier [
28], and passed through a band-pass filter. The signal processing unit consists of a lock-in amplifier (SRS model) and its band-pass filter, configured with a bandwidth of 1–10 Hz for magnetic field compensation and 1–10 Hz for signal measurement. This configuration enhances frequency-domain signal extraction and suppresses low-frequency noise.
Magnetic field compensation is implemented via a set of three-axis compensation coils, enabling independent adjustment of transverse (X- and Y- axes) and longitudinal (Z-axis) magnetic fields. For transverse compensation, a 3 Hz, 200 mV sinusoidal signal is applied, with DC offset tuning to generate an ideal second-order sinusoidal output waveform. Longitudinal (Z-axis) compensation is subsequently performed by applying a 1 V DC bias after transverse field suppression to fully cancel the ambient magnetic field. Following compensation, system calibration is performed by applying a 1 kHz, 150 nT AC magnetic field along the sensitive axis. A lock-in amplifier is used for demodulation, and the demodulation phase is finely adjusted to maximize the system’s response amplitude, thereby enhancing sensitivity to the reference signal. A final calibration signal of 30.5 Hz, 100 is applied, and the LabVIEW-based data acquisition system is triggered to record the magnetic response for subsequent spectral analysis and sensitivity evaluation.
The data acquisition system is based on the NI (National Instruments) platform and includes the LabVIEW development environment, an NI-DAQ data acquisition card, and the associated drivers. This platform offers high synchronization and broad modular compatibility, supporting multi-channel signal acquisition and real-time data processing, which meets the demands of frequency-domain signal analysis and stability assessment required in this experiment.
3. Result and Discussion
To verify the effectiveness of the proposed optical power stabilization system in enhancing magnetometer performance, a comparative analysis was conducted between two operational modes of the system: with and without MEMS-LCVR-based control. Experimental results reveal that, in the absence of the optical power control system, the magnetometer output exhibits prominent 1/f-type noise in the low-frequency region (particularly below 10 Hz), resulting in a high noise baseline. Upon implementing the closed-loop control system based on a LCVR, the low-frequency noise was significantly suppressed, and the overall noise level was markedly reduced, indicating improved output stability. The primary cause of this improvement lies in the fact that even slight fluctuations in pump laser power can directly affect the atomic polarization efficiency, thereby modulating the amplitude of the magnetic signal and introducing systematic errors. Instabilities in optical power ultimately manifest as uncertainties in magnetic signal output, especially pronounced at low frequencies. Thus, ensuring optical power stability is essential for achieving accurate magnetic field measurements. The MEMS-LCVR device employed in this study features low driving voltage, sub-millisecond response time, and the absence of mechanical components. Compared to conventional electro-optic modulators, it offers a more compact structure and is easier to integrate, making it highly suitable for miniaturized magnetometer systems. Coupled with a closed-loop PID control program developed on the LabVIEW platform, the system is capable of real-time feedback regulation of laser power, ensuring precise and stable output control. Notably, this approach effectively suppresses noise disturbances caused by optical power drift without significantly increasing system complexity or power consumption.
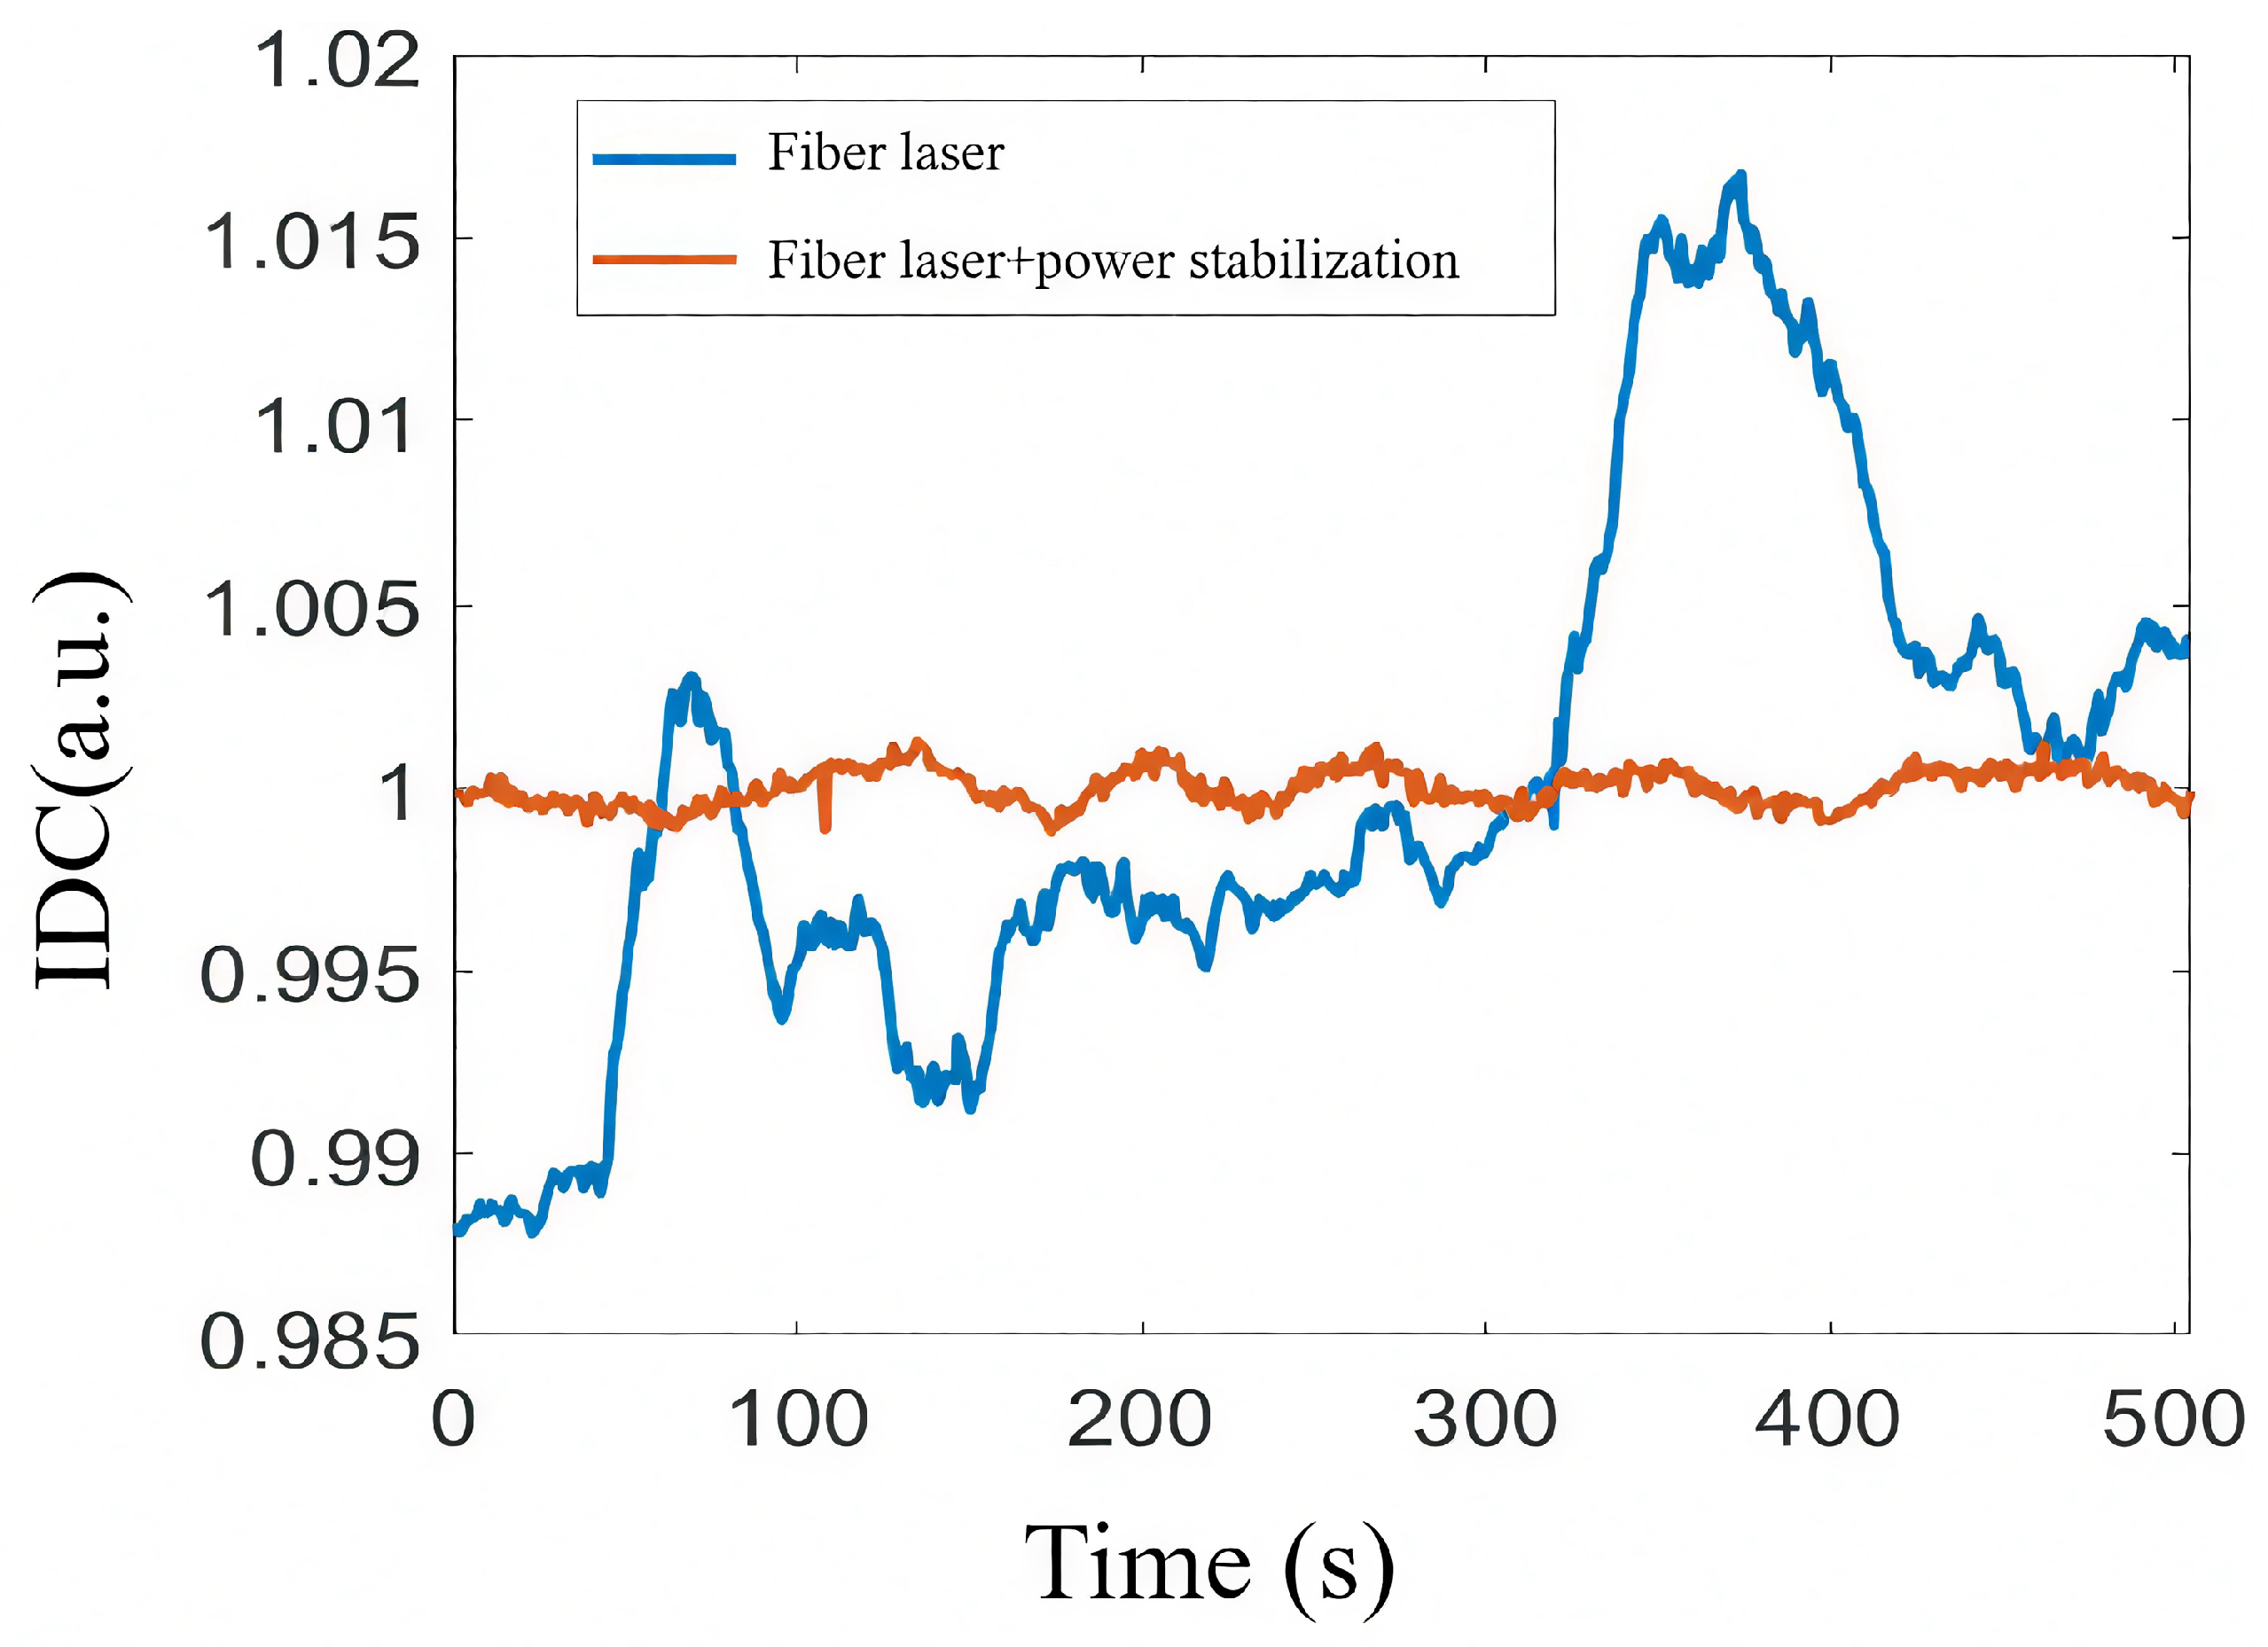
Figure 4 illustrates the comparison of output power from the fiber laser before and after implementation of the power stabilization system. The horizontal axis represents time, and the vertical axis denotes the normalized optical power. The blue curve corresponds to the scenario without stabilization control, where the power fluctuates between 0.988 and 1.017 over a 500 s period, with a peak-to-peak value of 0.029, an average of 0.999, and a relative instability of
. In contrast, the orange curve shows the stabilized case, where power remains nearly constant around 1.000, fluctuating only between 0.999 and 1.001, with a peak-to-peak variation of just 0.002, an average of 1.000, and a significantly reduced relative instability of
. These results clearly demonstrate that the stabilization strategy effectively suppresses transient power fluctuations and enhances the overall system stability. In summary, the MEMS-LCVR-based optical power stabilization scheme offers significant advantages in improving the low-frequency performance of SERF magnetometers. With its compact design, low cost, and flexible control, the method presents a novel and efficient solution for the miniaturization, integration, and high-performance development of atomic magnetometer systems.
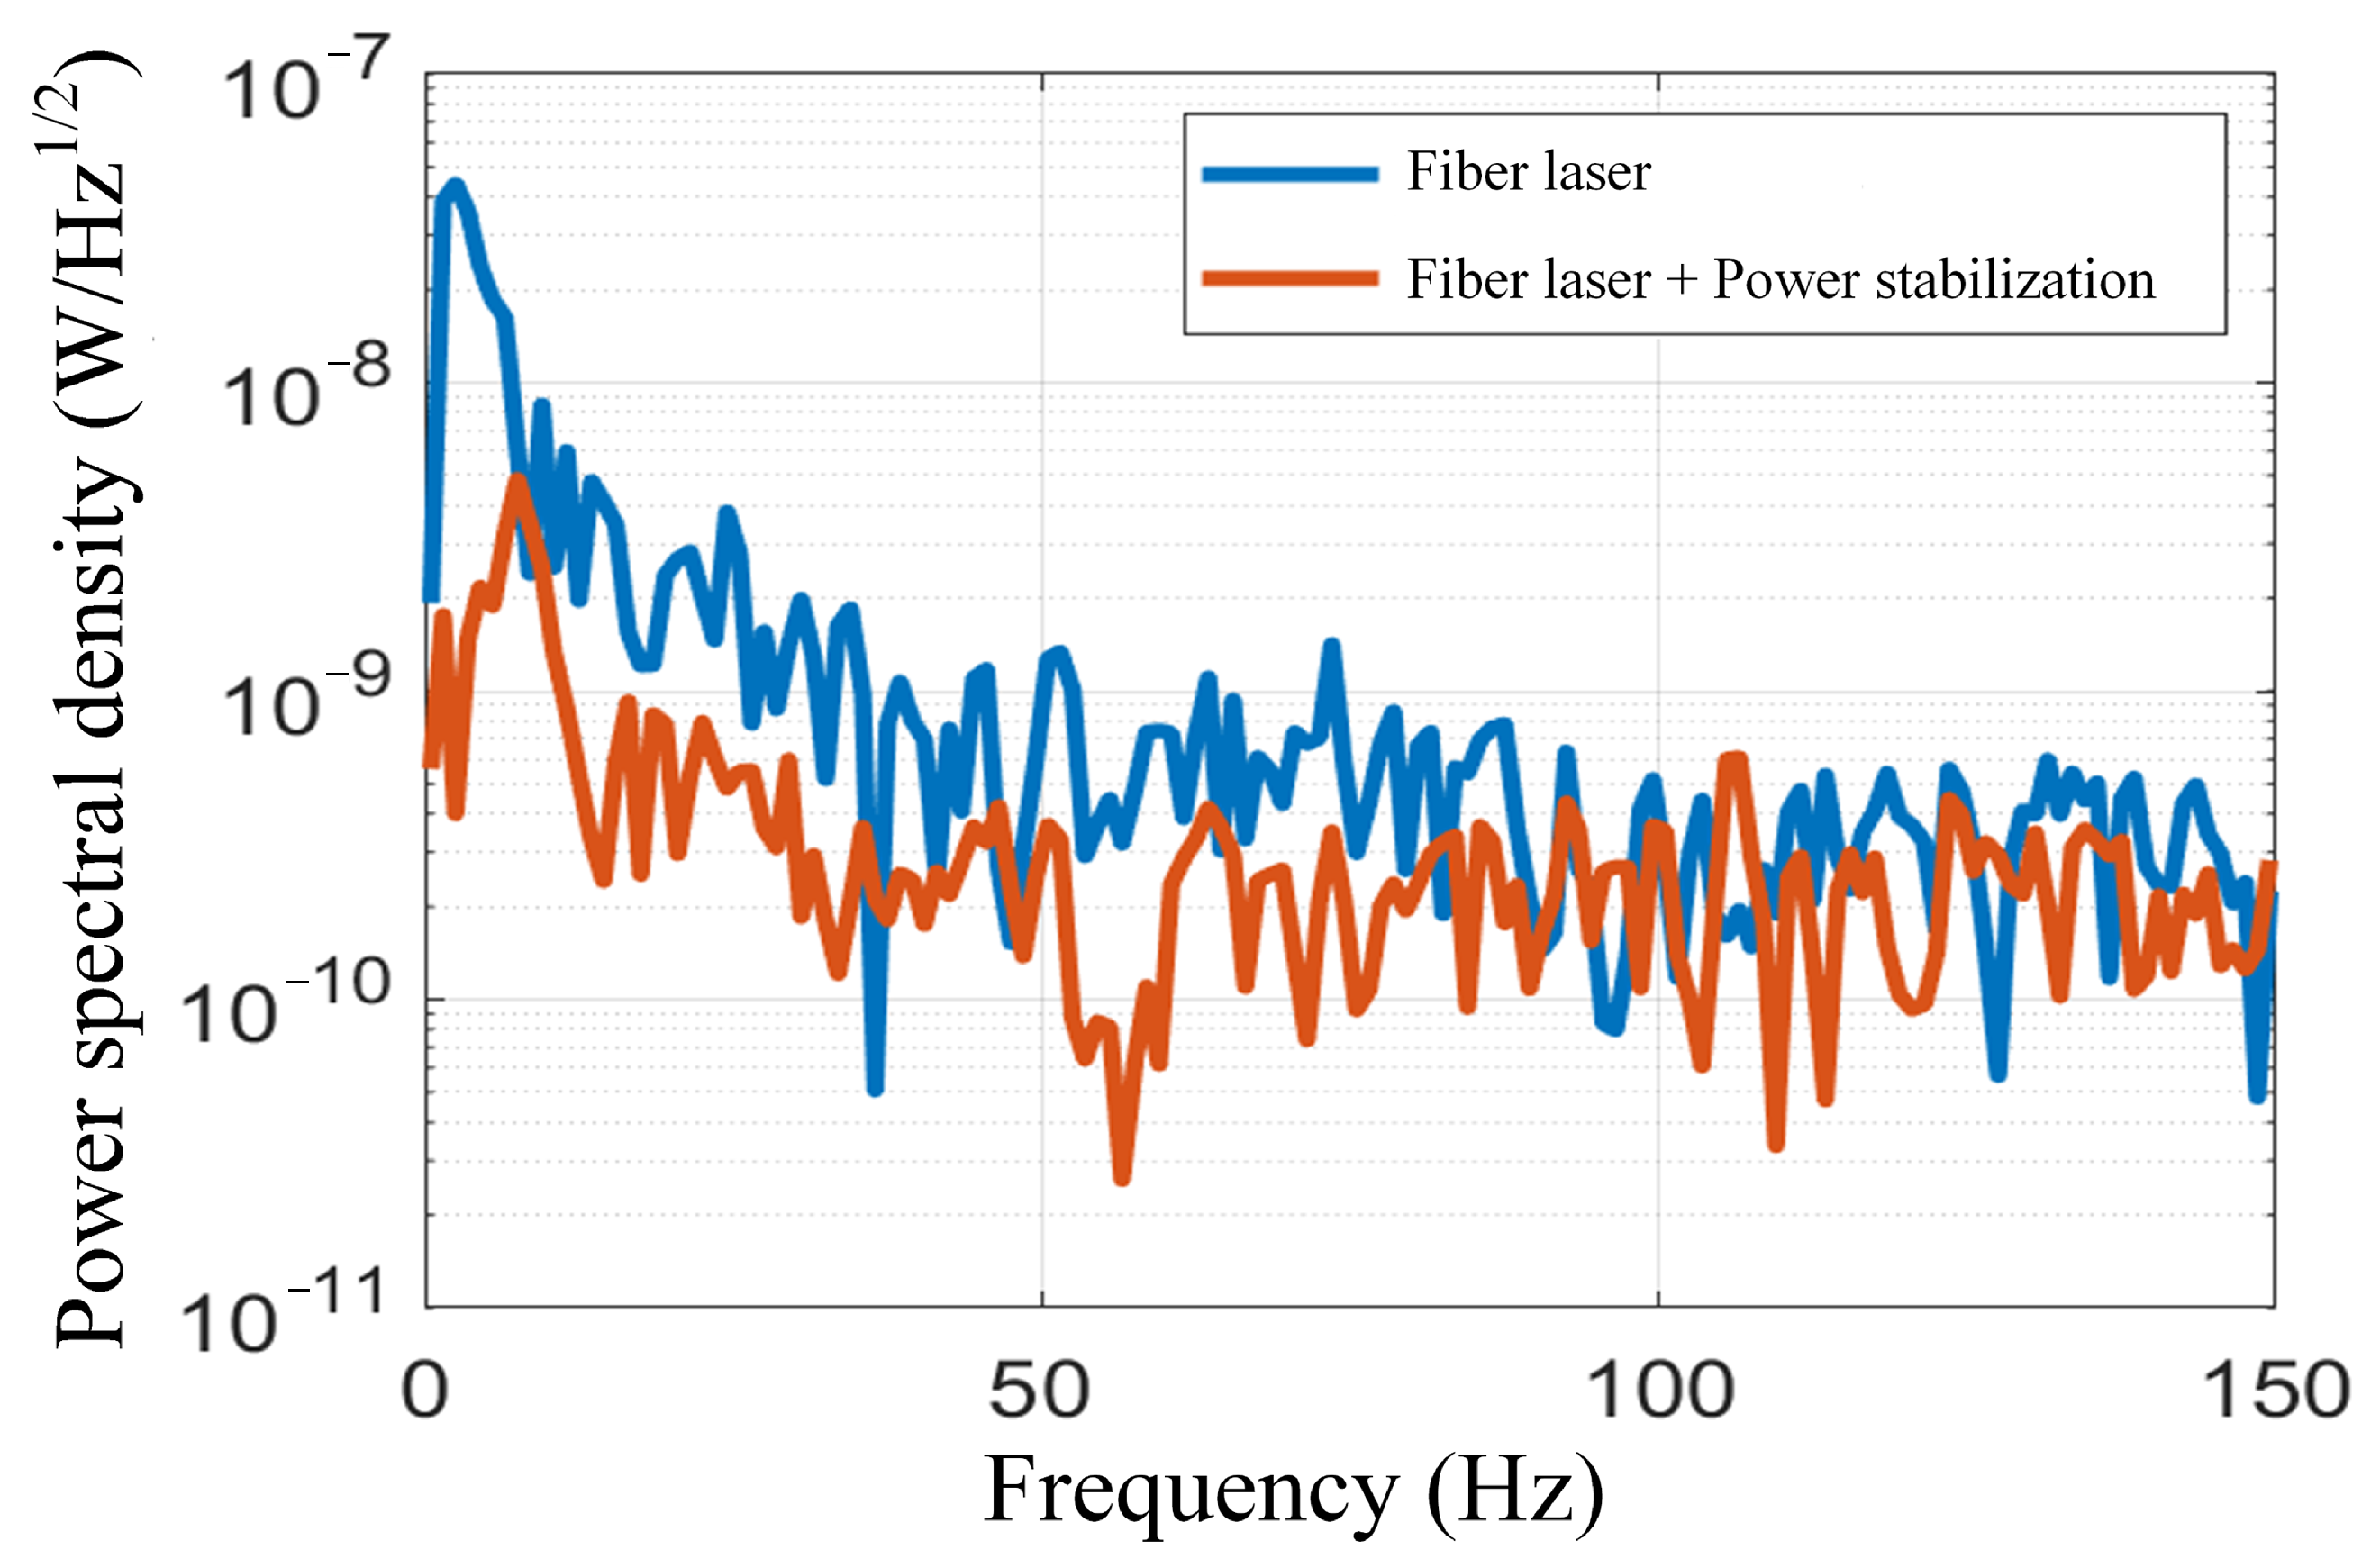
Figure 5 shows a comparison of the power spectral density of the output laser from the fiber laser before and after power stabilization, with the horizontal axis representing frequency (Hz) and the vertical axis showing power spectral density (
), displayed on a logarithmic scale. This metric indicates the magnitude of fluctuations in the laser output power caused by low-frequency noise signals (measured within a range of 0 to −150 Hz) from the laser control system. The blue curve represents the fiber laser without power stabilization treatment, which has a higher power spectral density at 0 Hz, approximately
, and then decreasing non-monotonically as the frequency increases, with more intense fluctuations across the entire frequency range. The orange curve represents the fiber laser after power stabilization treatment, with an initial power spectral density in the low-frequency range slightly lower than the untreated case, around
, and the overall curve is relatively smoother with smaller fluctuation amplitudes. By comparison, it can be seen that the laser with power stabilization experiences a significant reduction in the influence of noise signals on output power. This indicates that the adopted power stabilization method is not only effective in the time domain but also positively impacts the performance of the fiber laser in the frequency domain, effectively reducing the fluctuation of power spectral density and enhancing the laser output’s anti-interference capability. The fluctuations in laser output power caused by noise signals from the laser control system will be reflected in the sensitivity measurement results of the magnetometer; hence, this part of the noise is also referred to as optical noise in magnetometer sensitivity measurement experiments. Therefore, the reduction of the power spectral density of the laser is of great significance for improving the sensitivity of the magnetometer.
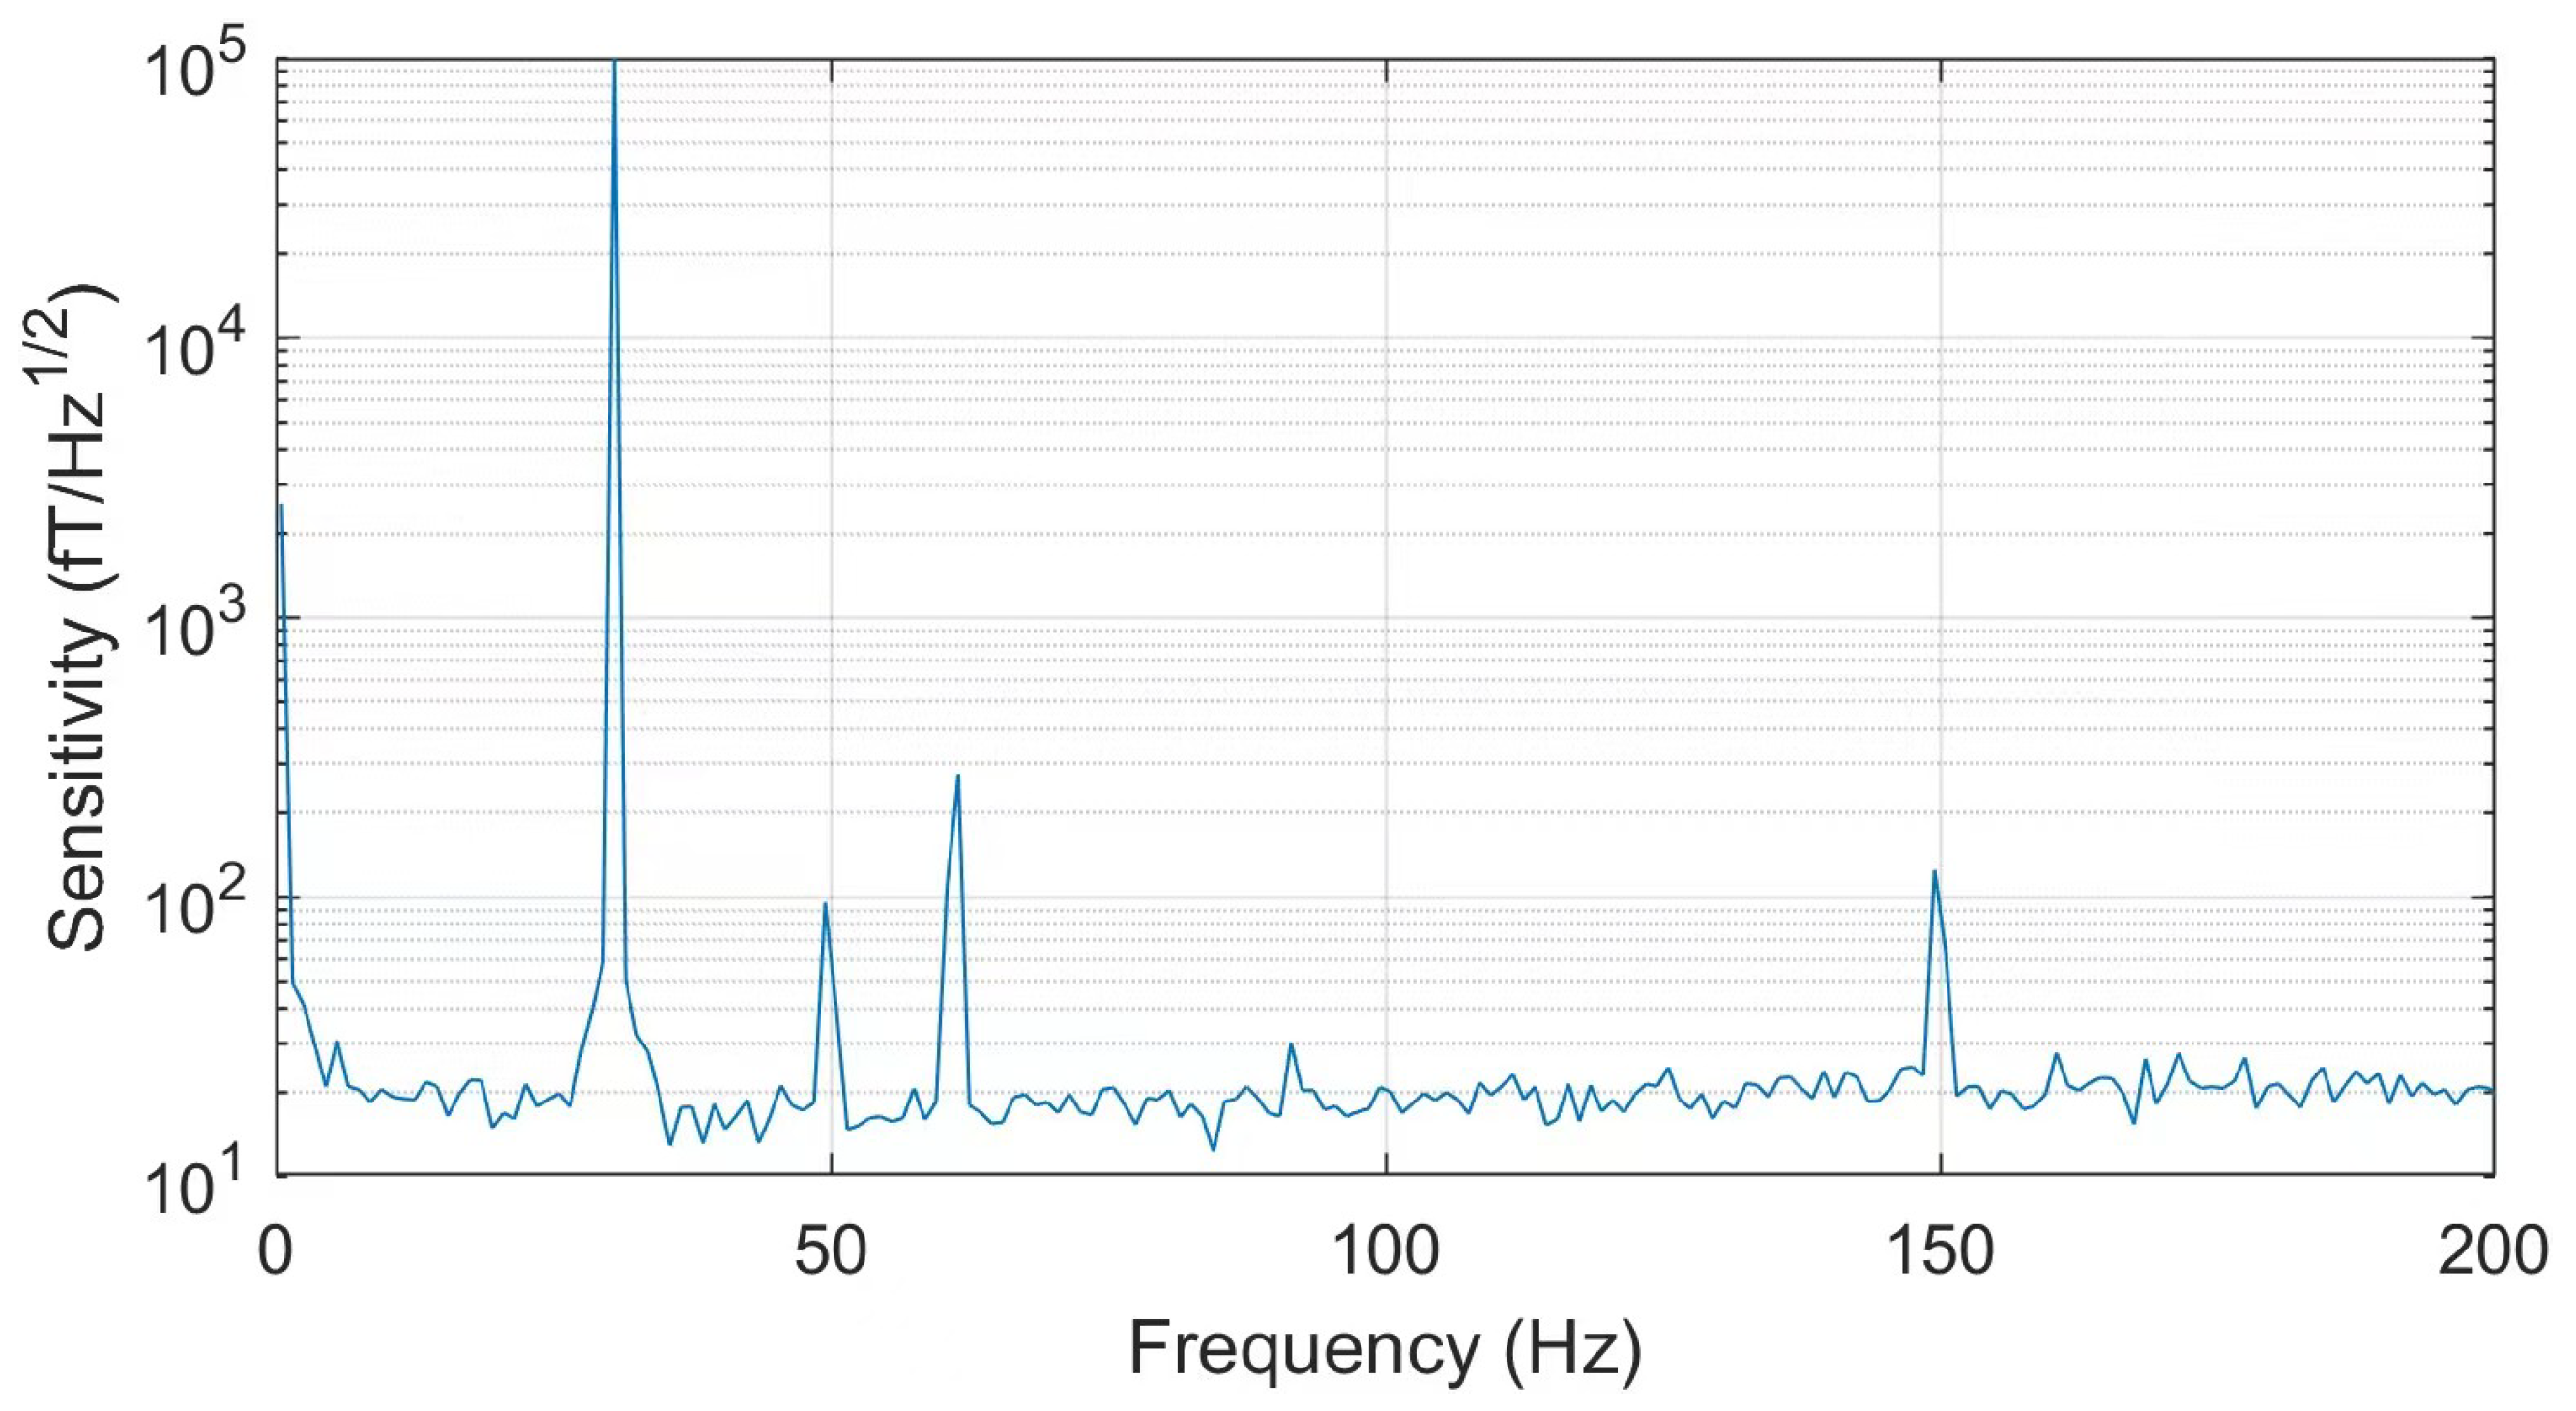
Figure 6 illustrates the experimental results of measuring the magnetometer’s sensitivity using the fiber laser with power stabilization. The anomalous point at 50 Hz is caused by the industrial frequency alternating current used in the experiment, while the anomalous point at 30 Hz is due to the actively applied magnetic field noise signal. After removing these anomalous points and calculating the average, the sensitivity of the magnetometer is approximately
.

