Article

Scattering of Radiation by a Periodic Structure of Circular and Elliptical Microcavities in a Multimode Optical Waveguide

by
Alexandra Yu. Petukhova
1,*,
Anatolii V. Perminov
1,
Mikhail A. Naparin
2 and
Victor V. Krishtop
1,2,*
1
Department of General Physics, Perm National Research Polytechnic University, 614990 Perm, Russia
2
Department of Nanotechnology and Microsystem Techniques, Perm State University, 614068 Perm, Russia
*
Authors to whom correspondence should be addressed.
Photonics 2025, 12(7), 727; https://doi.org/10.3390/photonics12070727
Submission received: 4 June 2025 / Revised: 1 July 2025 / Accepted: 14 July 2025 / Published: 17 July 2025
(This article belongs to the Section Optical Interaction Science)

Abstract

We developed a mathematical model to examine the scattering of radiation by a periodic structure of circular and elliptical microcavities formed in a planar optical waveguide. The waveguide simulates the behaviour of a 62.5/125 µm multimode optical fibre. The calculations focused on the intensity distribution of scattered light with a wavelength of 1310 nm along the periodic structure, i.e., along the side surface of the waveguide, as a function of the microcavity dimensions and their spatial arrangement within the waveguide core. The optimal geometrical parameters of the microstructure, ensuring the most uniform light scattering, were identified. The model is valid for multimode optical fibres containing strictly periodic structures of microcavities with spherical or elliptical cross-sections that scatter laser radiation in all directions. One potential application of such fibres is as light sources in medical probes for surgical procedures requiring additional illumination and uniform irradiation of affected tissues. Furthermore, the findings of this study offer significant potential for the development of sensing elements for fibre-optic sensors. The findings of this study will facilitate the design of scattering structures with microcavities that ensure a highly uniform scattering pattern.

1. Introduction

When the power of the laser radiation exceeds a critical threshold level, an optically transparent medium begins to absorb laser radiation, resulting in the optical breakdown of the waveguide. The breakdown mechanism has been previously studied by S. Todoroki and Y. Shuto [1,2,3,4]. In their work, Y. Shuto proposed several hypotheses regarding the mechanism of optical breakdown. These theoretical developments made a significant contribution to the fundamental understanding of optical breakdown in fibres [5,6], which were subsequently verified experimentally by S. Todoroki.
The initiation of a plasma spark, induced by contact with an initiator, marks the commencement of the waveguide core breakdown. As the spark propagates towards the laser source, the waveguide core melts, leading to the formation of a structure composed of microcavities filled with pressurised oxygen. This results in a microcavity structure that retains waveguiding and mechanical properties.
Following optical breakdown, microcavities of various shapes and sizes typically extend over several centimetres or more while exhibiting varying degrees of periodicity [7,8,9]. The most encountered microcavity geometries include bullet-shaped, elliptical and spherical forms [10,11]. The influence of each of these shapes on light scattering is distinct and merits dedicated investigation. The present study focuses on radiation scattering by spherical and elliptical microcavities.
To examine the scattering processes on a periodic microcavity structure, we employed mathematical modelling using COMSOL Multiphysics (6.1) [https://www.comsol.com/release/6.1 URL (accessed on 24 June 2025)]. The model under consideration is that of strictly periodic microcavity structures with specified shape and size. The simulations were carried out for radiation with a wavelength of λ0 = 1310 nm in a planar optical waveguide simulating the behaviour of a 62.5/125 μm multimode fibre with periodic structures of microcavities with spherical or elliptical cross-sections that scatter laser radiation in all directions. The intensity distribution of scattered radiation along the periodic structure (along the side surface of the waveguide) was evaluated depending on the size and mutual arrangement of these microcavities within the waveguide core.
The scientific novelty of our research lies in a comprehensive approach to studying radiation scattering processes in multimode mode, which includes a detailed analysis of the dependence of radiation power on changing structural parameters, an investigation of the influence of various microcavity shapes (spherical and elliptical) on scattering characteristics, the development of a methodology for quantitative assessment of radiation distribution uniformity, and the determination of optimal structural parameters to achieve uniform scattering.
In study [12], single-mode optical fibres for medical applications were considered; however, their use is significantly limited for several reasons. Experimental data demonstrate that during the operation of single-mode fibres, rapid attenuation of scattered radiation occurs on the formed structures immediately after the appearance of the first defects, which significantly limits their practical application possibilities. In contrast, our research is focused on a detailed study of light scattering processes in multimode mode. In this mode, a more diverse shape of the formed microcavities and a significantly more uniform distribution of radiation along the lateral surface of the fibre are observed. The multimode mode has an important advantage—the ability to increase scattering power, which is critical for medical applications requiring high illumination intensity. An additional advantage is the possibility of spectral adaptation of the device to various tasks by changing the wavelength. At the same time, changing the core diameter of the fibre allows regulating the efficiency of light capture and scattering characteristics. The results obtained significantly expand theoretical understanding of light scattering mechanisms, opening up new prospects in the development of medical probes and optical sensors with uniform radiation distribution.
The study of waveguide breakdown has significant practical importance, as after optical breakdown, a microcavity structure is formed that preserves the basic waveguide properties (mechanical and waveguiding characteristics). These modified fibres find application in the following areas:
  • Medical diagnostics and surgery—creation of special probes for operations requiring additional lighting and uniform irradiation of affected areas. For practical application of radiation scattered on a periodic structure, it is crucial to ensure maximum power distribution uniformity along the optical fibre length. For this purpose, optimal geometric parameters of the microstructure were determined [13,14,15]. The impact of emitting microcavities with various scattering intensity profiles on living tissues was investigated by Strobl et al. [16,17].
  • Optical sensors—development of sensitive elements for fibre-optic sensors. Each microcavity functions as a Fabry–Pérot micro interferometer; consequently, a periodic microcavity structure represents a system of coupled and interacting Fabry–Pérot micro interferometers. When coherent radiation passes through such a structure, multiband interference occurs, with the interference pattern depending on external influences [15,18,19]. This property can be applied for sensor creation. In areas of maximum radiation reflection, power increases, which may further enhance the sensor quality factor. The existing studies in this field [20,21,22,23] are mainly focused on the research of Bragg gratings and their application in fibre-optic sensors.
  • Radiation diffusers—uniform distribution of light flux in various diagnostic devices.
  • Optical systems—creation of new device types with specified scattering characteristics [24,25].
Despite the fact that broken fibre cannot be used in fibre-optic communication lines, it has significant potential for application as a functional element in various optical systems. This opens up new prospects for the development of modern optical technologies.

2. Problem Statement and Numerical Methods

2.1. Problem Statement

In this study, a section of a planar waveguide was selected to simulate radiation scattering by a periodic structure of microcavities. This section represented a multimode optical fibre with a core diameter of 62.5 µm, which is equivalent to that of a standard multimode fibre, facilitating the propagation of multiple modes within the waveguide. Our previous study [12] addressed a planar waveguide model simulating a single-mode fibre, which differed in waveguide geometry, radiation wavelength and number of propagating modes.
Figure 1 shows the geometry of the computational domain as a longitudinal cross-section of the planar waveguide, which contains a periodic microcavity structure. It is assumed that both the waveguide and the microcavities are infinite along the z-axis. The length of the simulated waveguide section along the x-axis is 200 µm, with an operating wavelength of 1310 nm for the multimode fibre.
The material properties of the various waveguide regions were specified according to the following standard multimode fibre characteristics (materials selected from library the COMSOL Multiphysics®, Stockholm, Sweden):
  • Waveguide core (Region 1 in Figure 1): GeO + SiO2;
  • Waveguide cladding (Region 2 in Figure 1): fused silica (SiO2);
  • Microcavities (Region 3 in Figure 1): air.
The material properties were selected from the COMSOL Multiphysics library. The scattering problem was modelled using the Electromagnetic Waves module within COMSOL Multiphysics® [Develop—COMSOL Inc., Stockholm, Sweden], which accounts for electromagnetic interactions.
Although real optical fibres exhibit cylindrical geometry, we assumed the strict axisymmetry of both the microcavities and the radiation propagating through the fibre. Consequently, any arbitrary diametral cross-section of the fibre is equivalent to that of a planar waveguide infinite along one axis. This approximation allows the problem to be solved in a two-dimensional planar formulation using a Cartesian coordinate system, which is accurately implemented in the COMSOL®. In the proposed mathematical model, the solution is performed in the cross-section of a planar, infinitely long waveguide along the z-axis. The microcavities of the spherical and elliptical sections are assumed to be infinitely extended along the z-axis. All calculations are performed in the xy-plane as shown in Figure 1.
The Port boundary condition was implemented at both waveguide ends to simulate radiation input and output. This condition facilitates the precise specification of electromagnetic field parameters at the model boundaries, including amplitude, mode, polarisation and phase. The right-side boundary was designated as the input port (Port 1 in Figure 1) with an input radiation power of P i n = 1 W/m. The left-side boundary was designated the output port (Port 2 in Figure 1).
The propagation of the electromagnetic wave is described by the equation for the electric field vector E [26],
× μ i 1 × E i ω n i / c 0 2 E i = 0 ,
where i = 1, 2, 3—index for the regions corresponding to different media; ∇—nabla operator, μi—magnetic permeability of the medium (assumed to be 1 for all media), c0—speed of light in vacuum, ω—frequency of the electromagnetic wave, and ni—the refractive indices of the respective media.
The model assumes that two modes propagate along the waveguide: the fundamental mode and the first higher-order mode. The resulting optical field is the superposition of these two modes, E = E 1 + E 2 . The solution to Equation (1) for each mode is found as a plane wave propagating along the x-axis and polarised along the z-axis. The mode amplitudes depend only on the y-coordinate [27],
E z j x , y , t = E z j y e x p i β j x e x p i ω t ,
where j = 1, 2—mode number, and βj—propagation constants for each optical mode at the wavelength of 1310 nm in each region of the computational domain (core, cladding, or microcavity; Figure 1). The propagation constant is given by   β j = k j n e f f , where the effective refractive index n e f f is calculated as follows:
n e f f = λ c λ 1 n 2 + λ 2 λ c n 1 / λ 2 λ 1 ,
where λc—wavelength of the input radiation with the degree of non-monochromaticity Δ λ / λ c , where
Δ λ = ( λ 2 λ 1 ) / 2 .
For the simulations, the wavelength range was taken as λ1 = 1300 nm and λ2 = 1320 nm. The wave number kj in the core, cladding and microcavities for each mode is defined as follows:
k j = 2 π / λ c j .
Figure 2 and Figure 3 present the spatial distribution of the amplitude of the electric field vector (electric field intensity) within the computational domain containing spherical and elliptical microcavities, respectively, for each mode. The combined field distribution resulting from the superposition of both modes for circular microcavities was previously illustrated in Figure 1.
The horizontal boundaries of the planar waveguide (see Figure 1) incorporate PEC boundary conditions, a standard feature in COMSOL Multiphysics. This boundary condition enforces a zero tangential component of the electric field, expressed as follows:
n × E = 0 ,
where n—normal vector at the boundary of Region 2 (see Figure 1), and E—electric field vector.
The model includes multiple interfaces between Regions 1–2 and 2–3 (see Figure 1), which represent boundaries between two dielectric media. The normal E n and tangential E τ components of the electric field vector at these interfaces satisfy the following continuity conditions:
ε i E i n = ε l E l n ,   E i τ = E l τ ,
where i, l = 1, 2, 3 and i ≠ l; εi and εl—permittivities of the corresponding media.
In the model under consideration, the entire planar waveguide is surrounded by a PML attached to its outer boundary, which absorbs all outgoing waves. This layer is used to reduce computation time and memory usage. From a physical standpoint, the PML can be conceptualised as simulating an object in infinite free space, where radiation exiting the object undergoes no reflections. The absorption characteristics within the PML are determined as follows:
α A exp B k ,
where k = r _ P M L / d _ P M L , A = 1.4508; B = 5.2 × 10⁻¹²—real and imaginary parts of the refractive index in the PML; r _ P M L = 0.5   μ m · s —distance from the PEC edge to the current PML, s—layer number, d_PML, is the total thickness of the PML. Typically, PML thickness ranges from 4 to 8 mesh layers; in this study, 8 layers were used.
The computational mesh was designed with the requirement that at least four elements must resolve the vacuum wavelength, λc = 1310 nm, within the fibre core with a refractive index of n1 = 1.481. This results in a minimum linear size of a mesh element of
e m i n = λ c 4 · n 1 0.17   µ m .
To enhance resolution, we set the element size within microcavities and their boundary layers to e m i n   = 0.1 μm.

2.2. Numerical Calculation Methodology
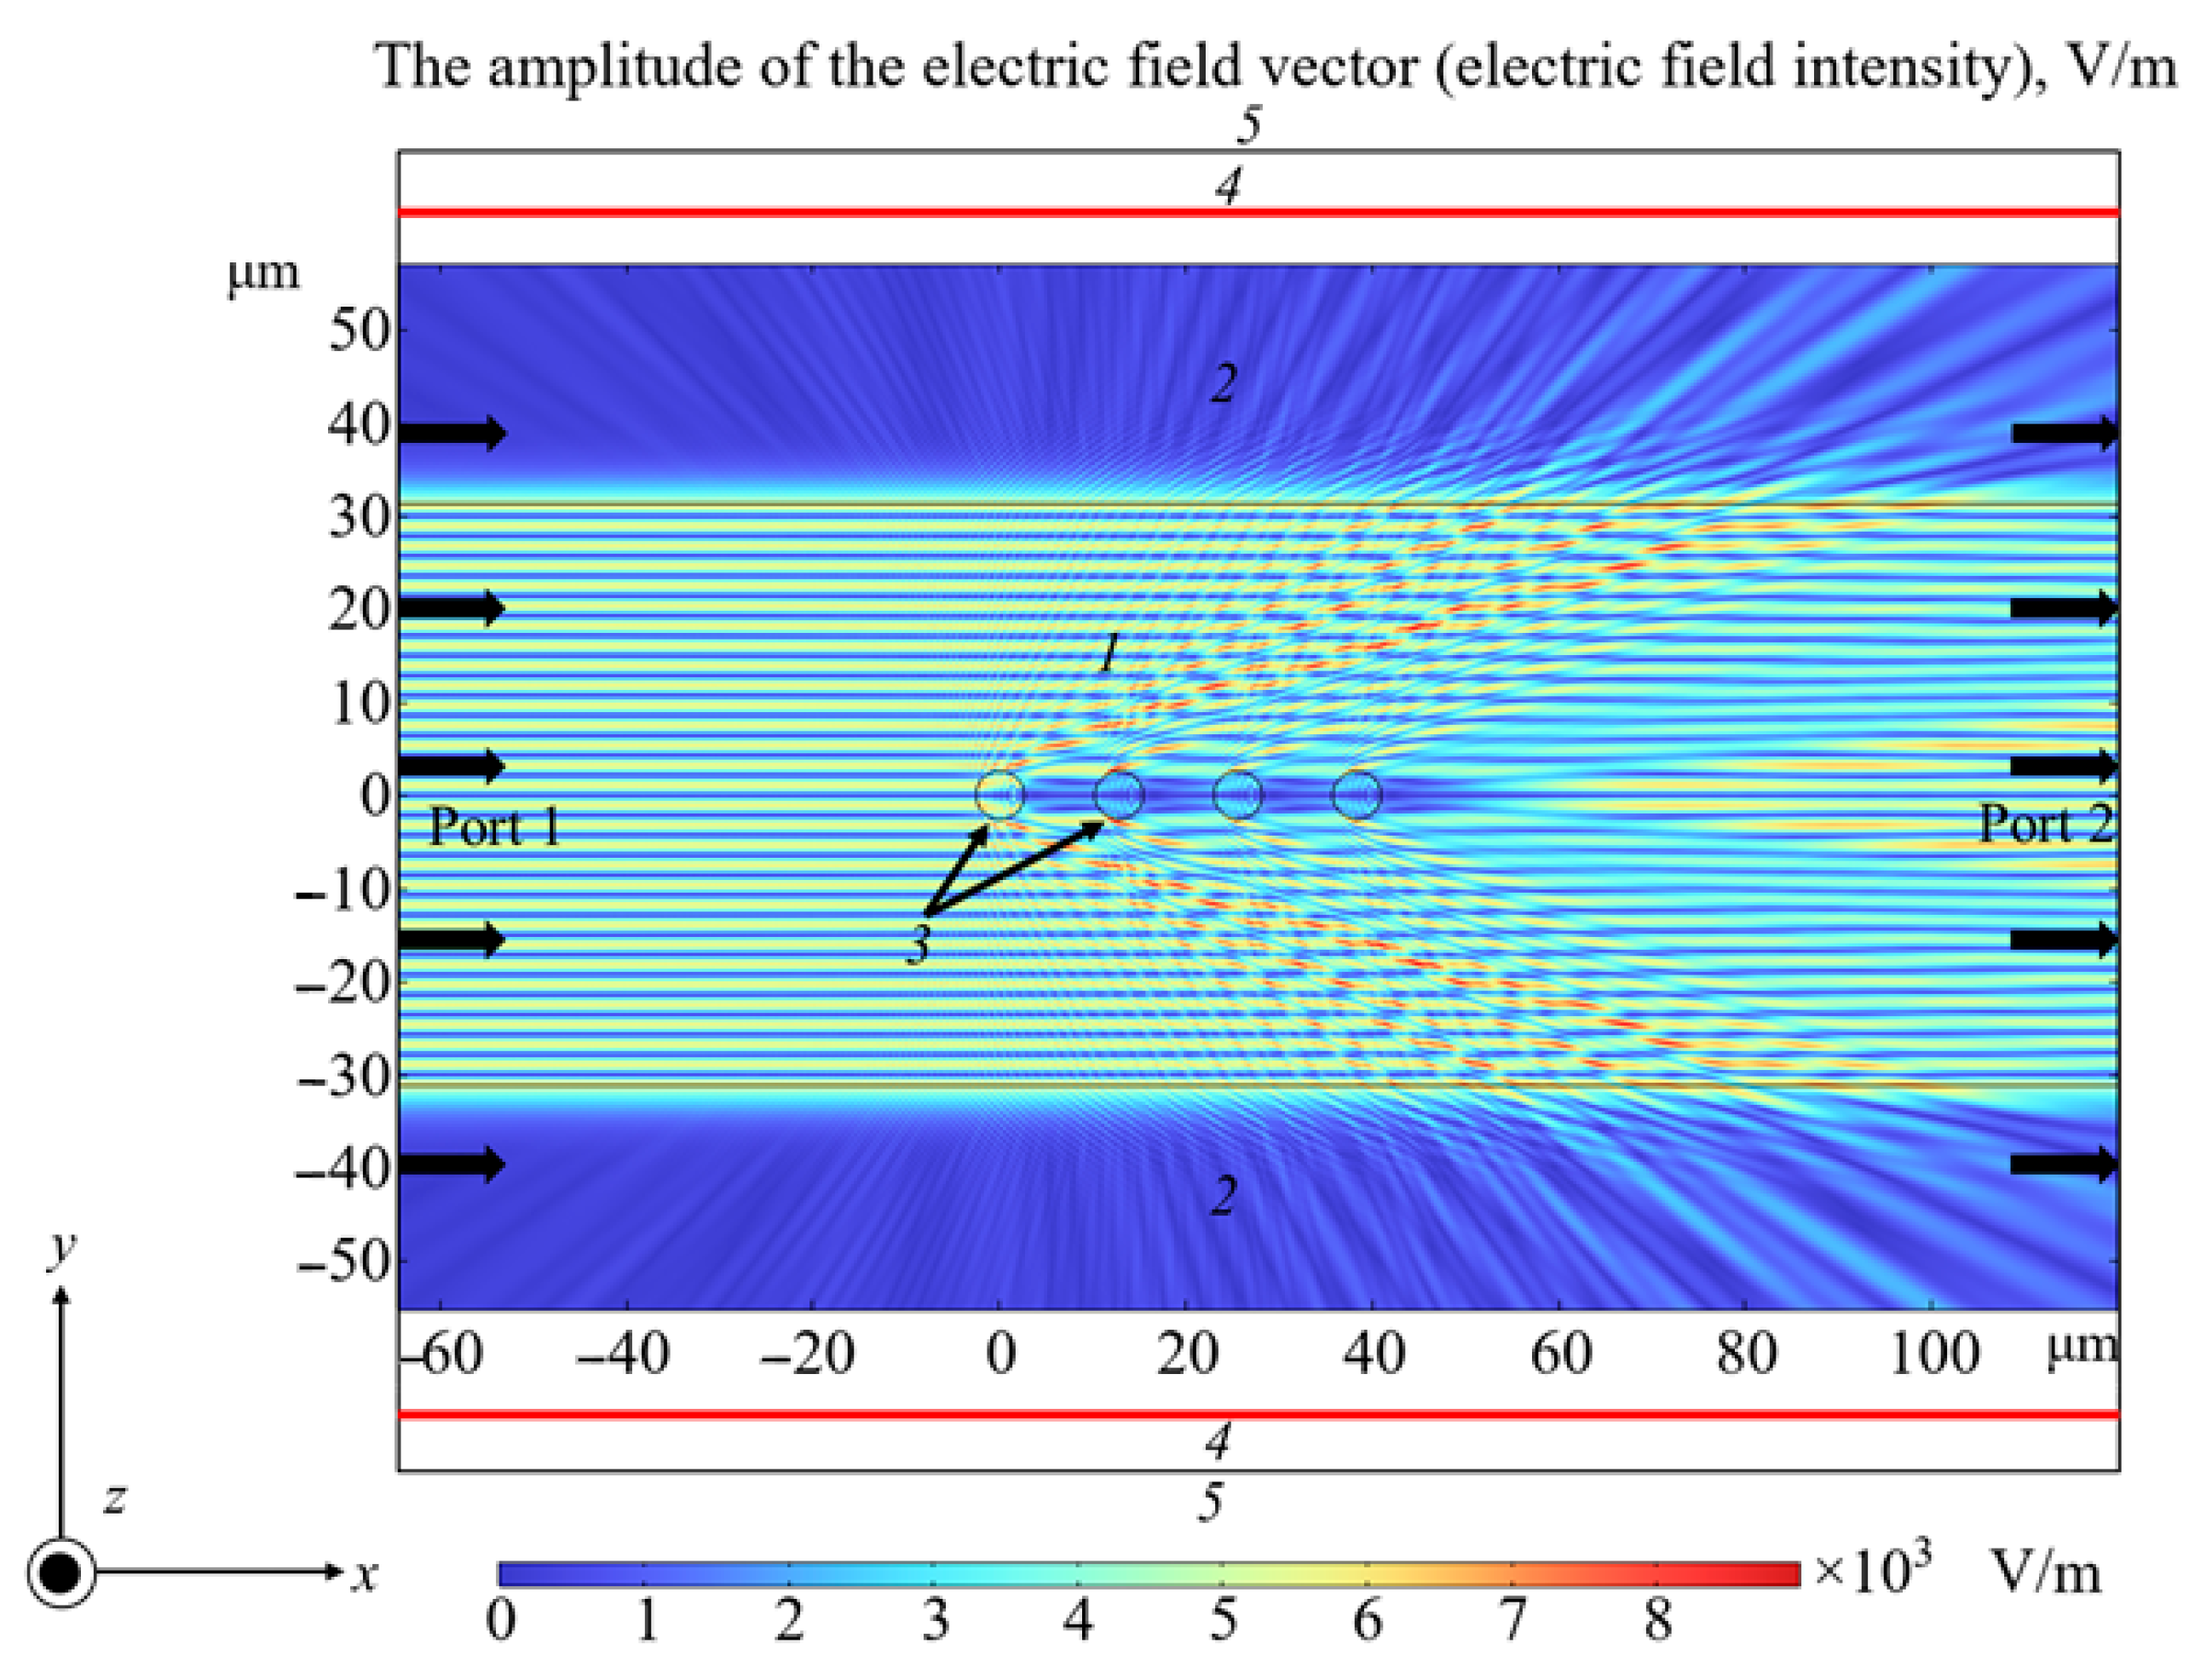
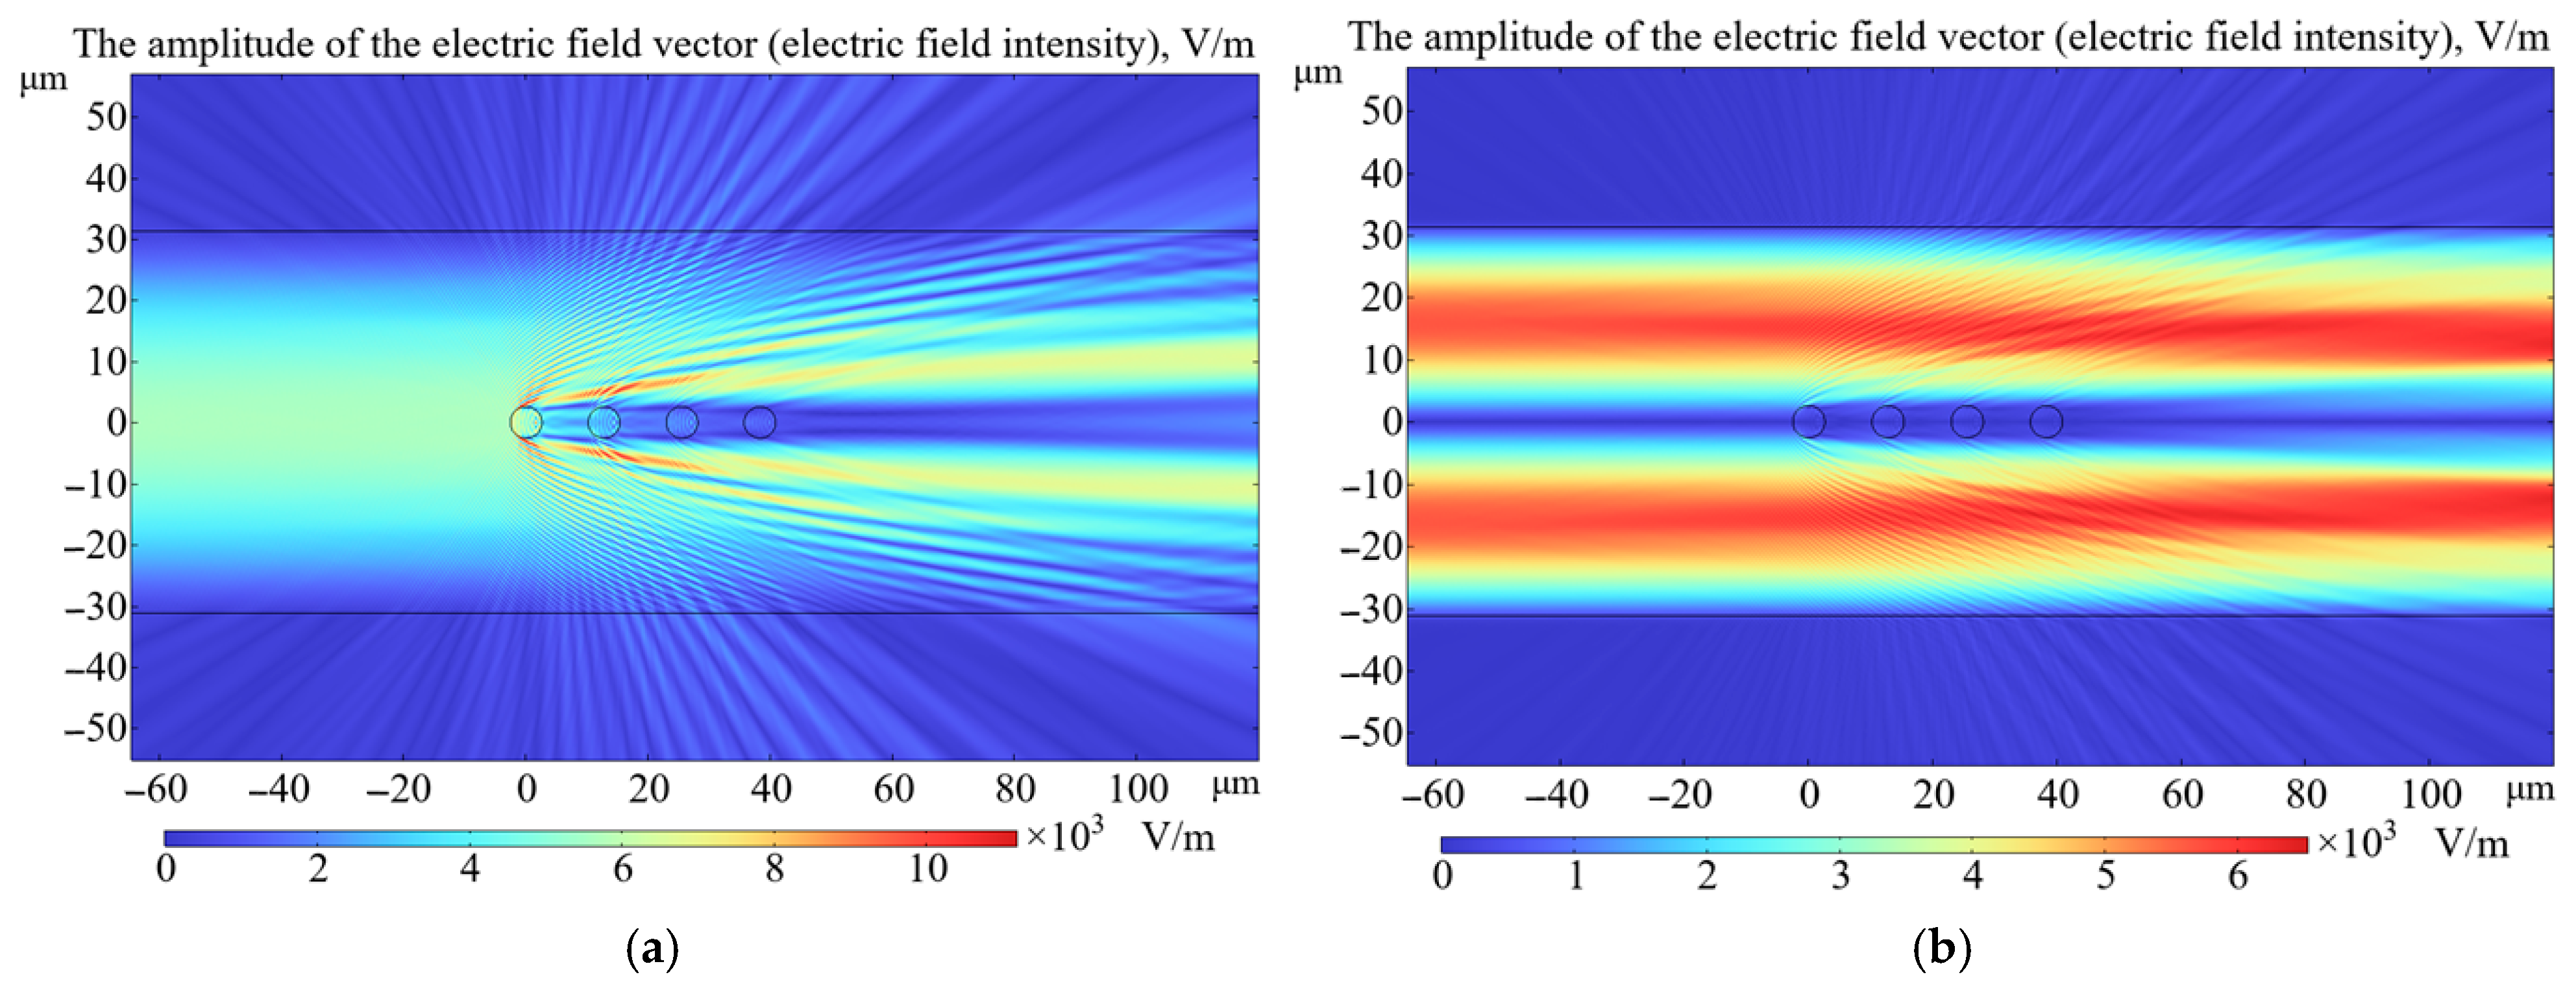
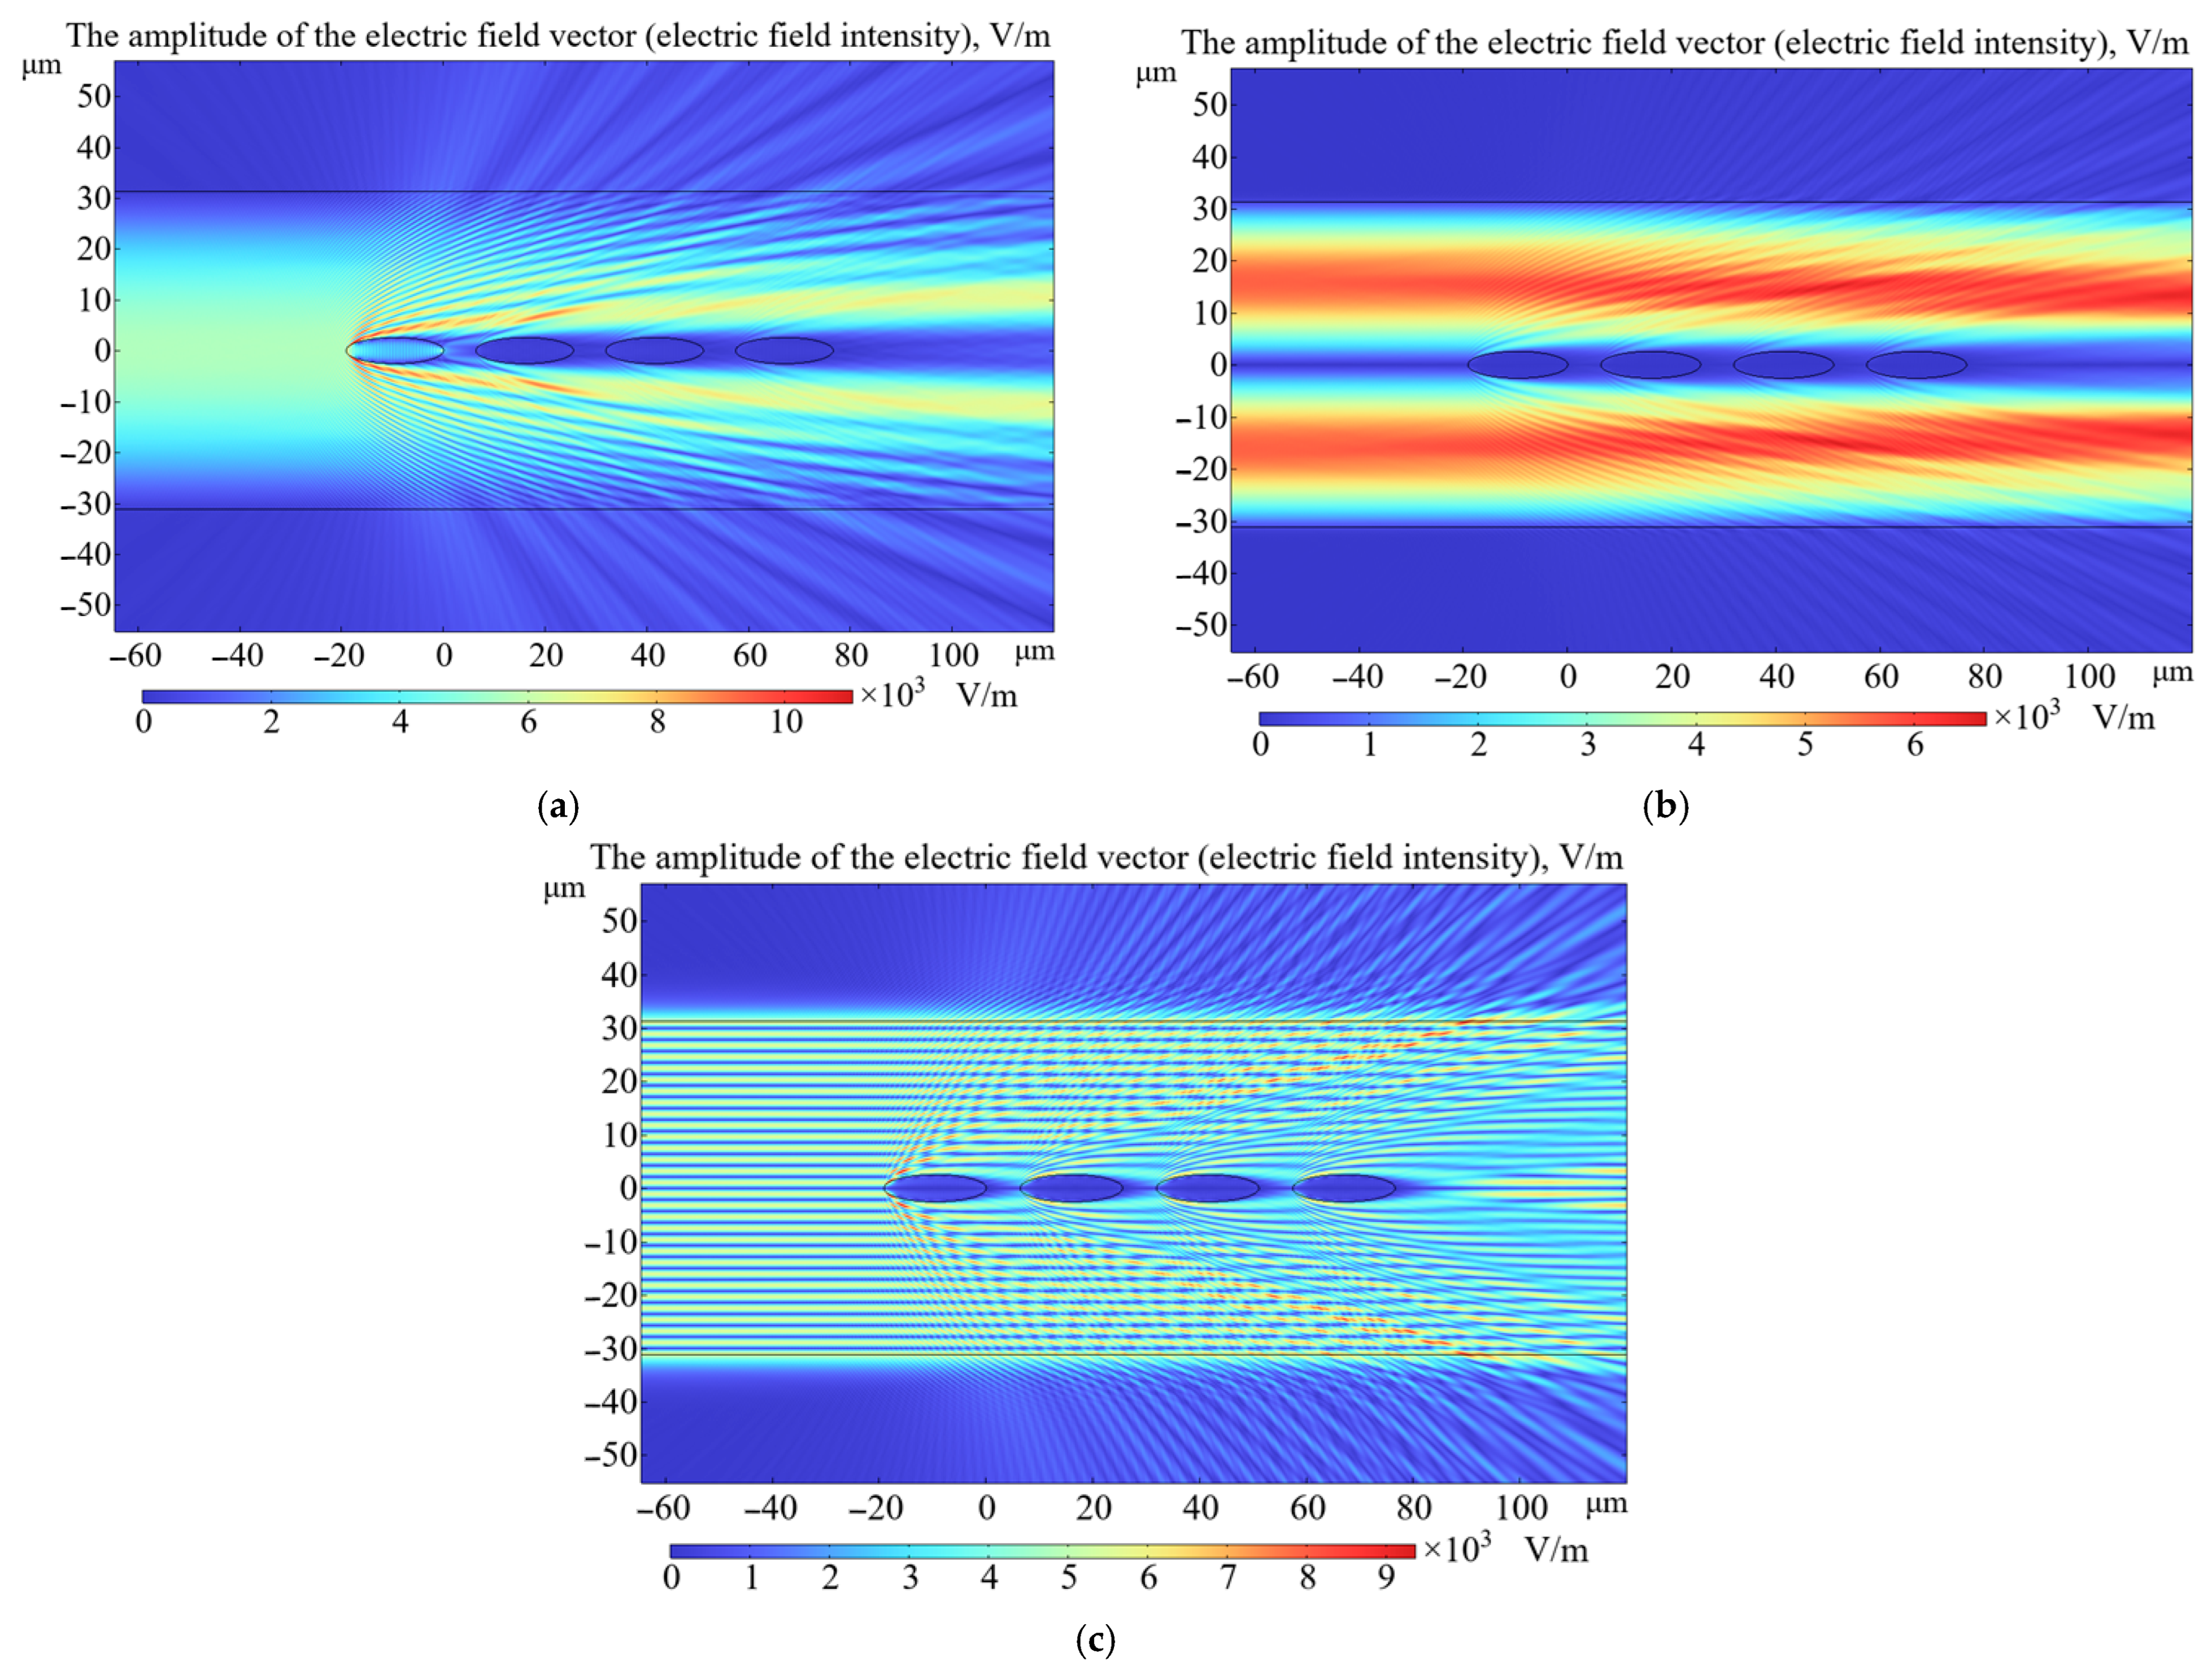
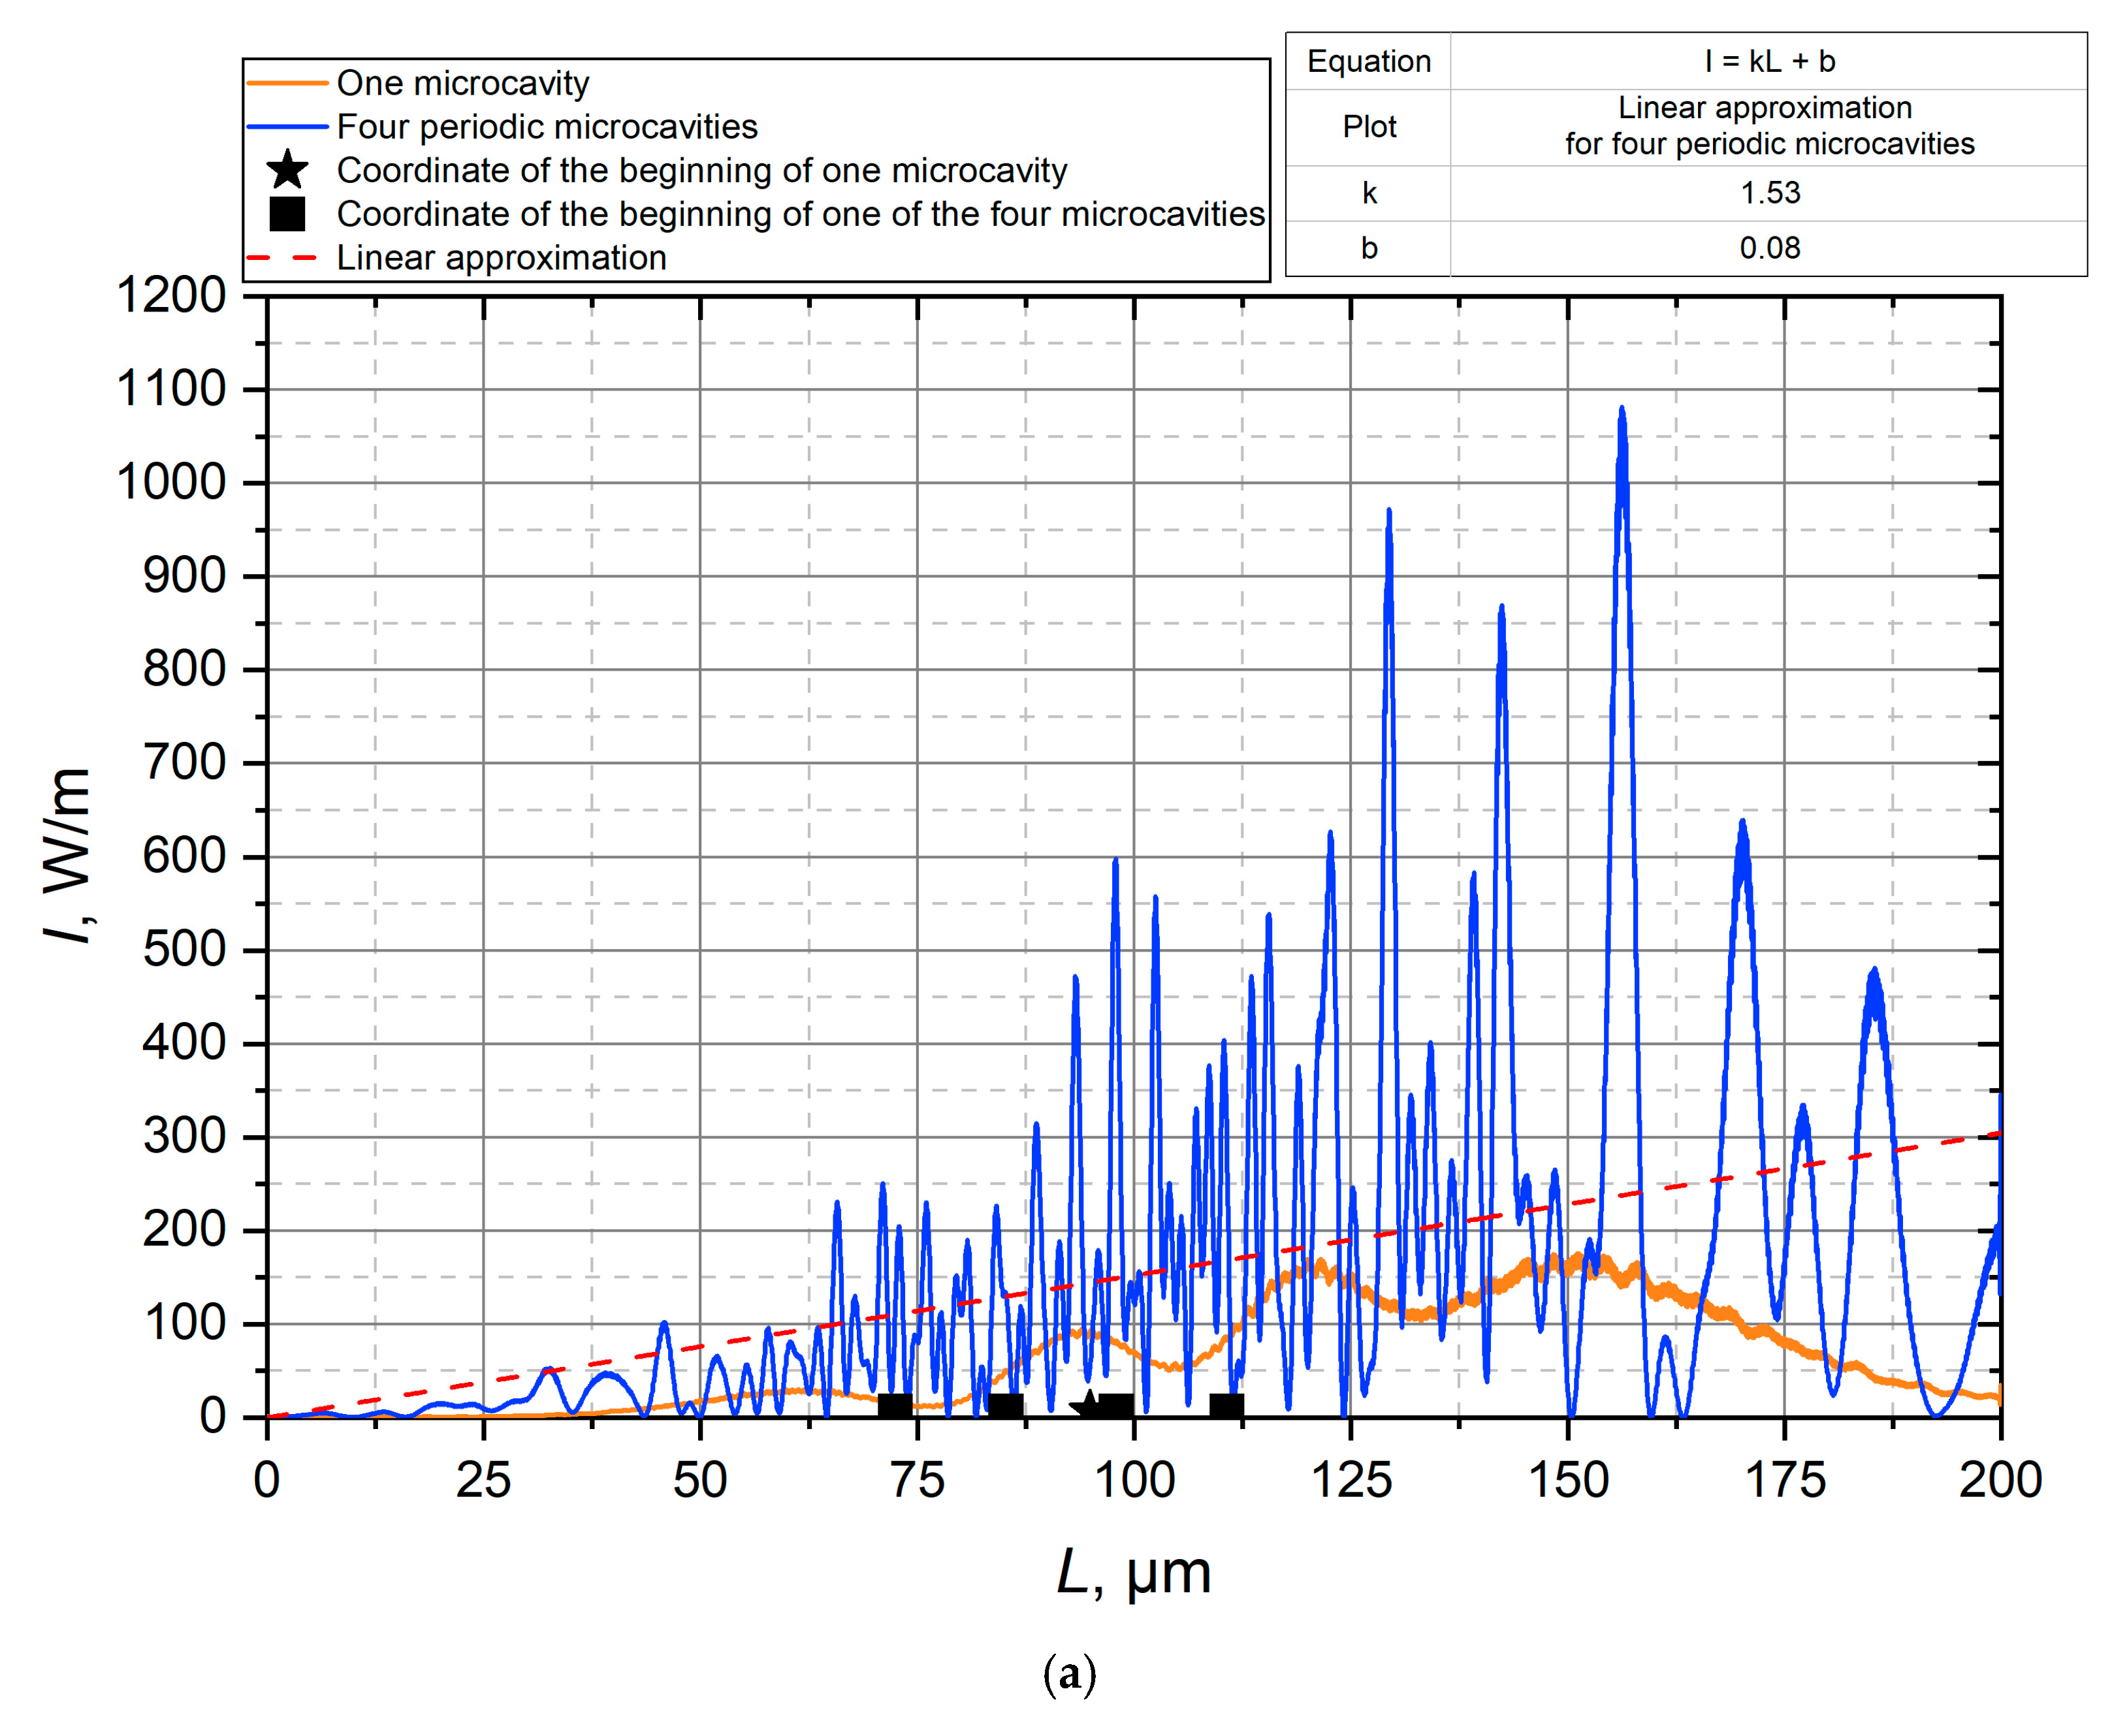
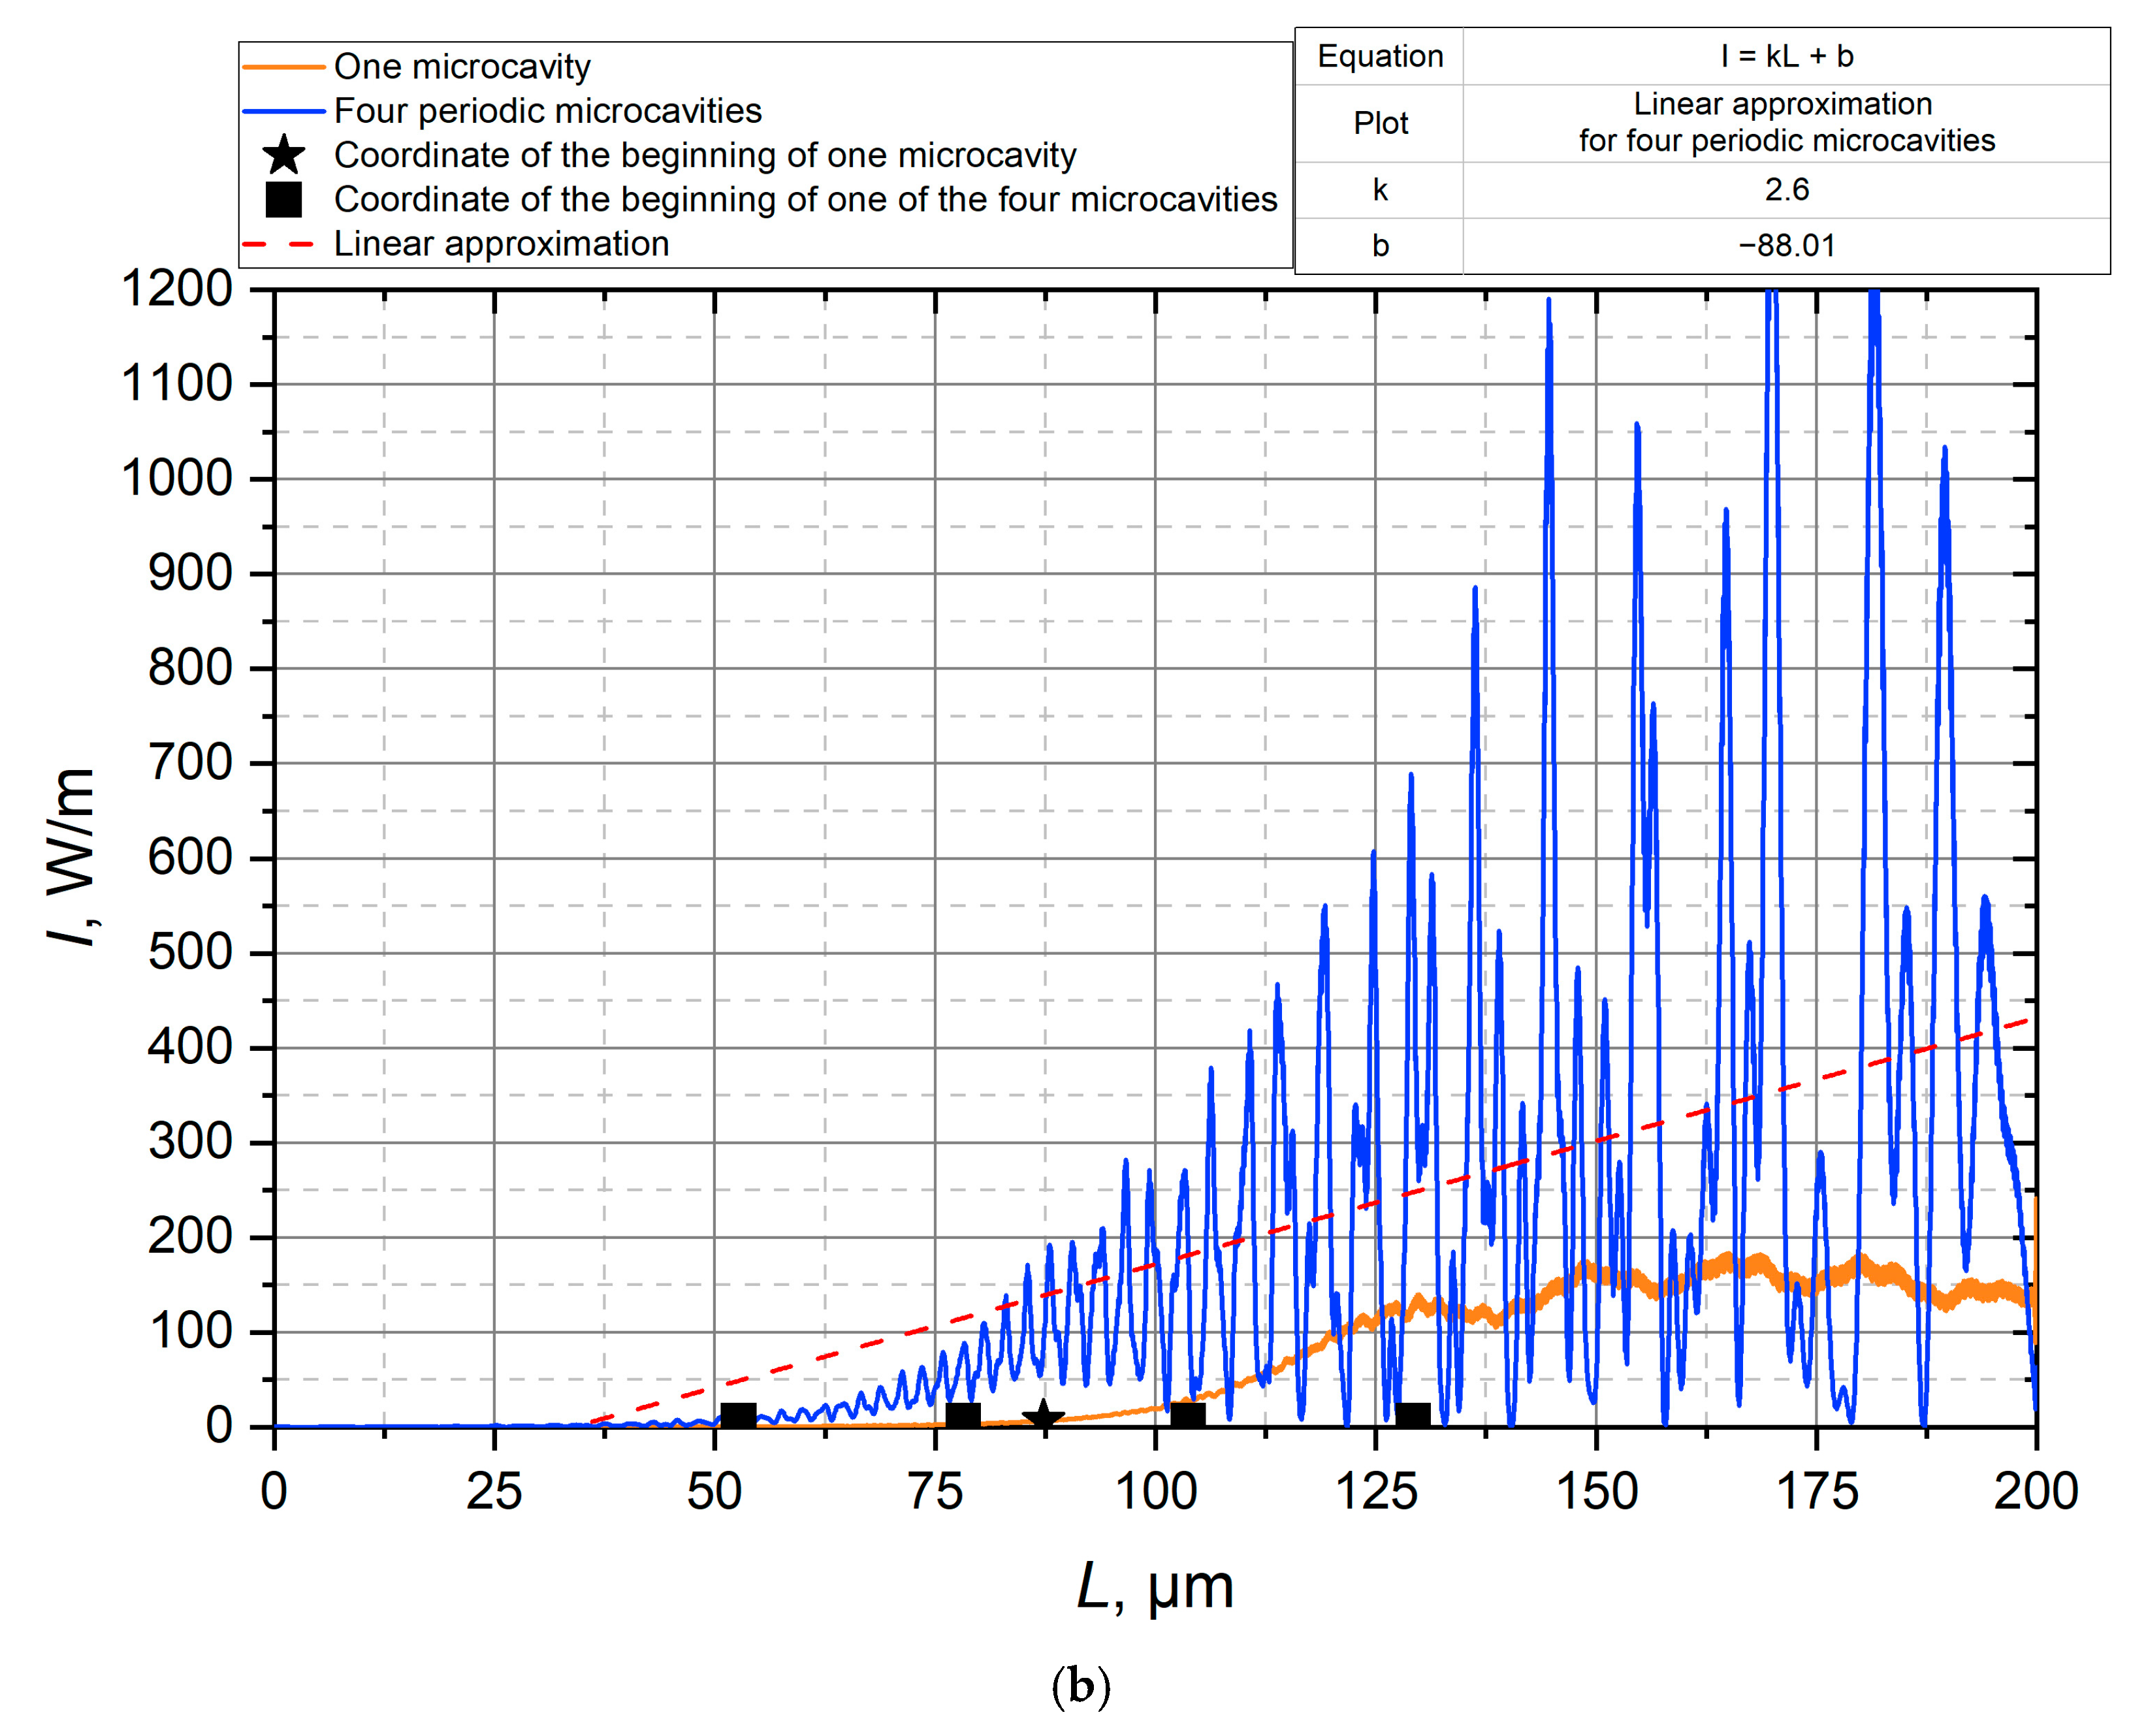
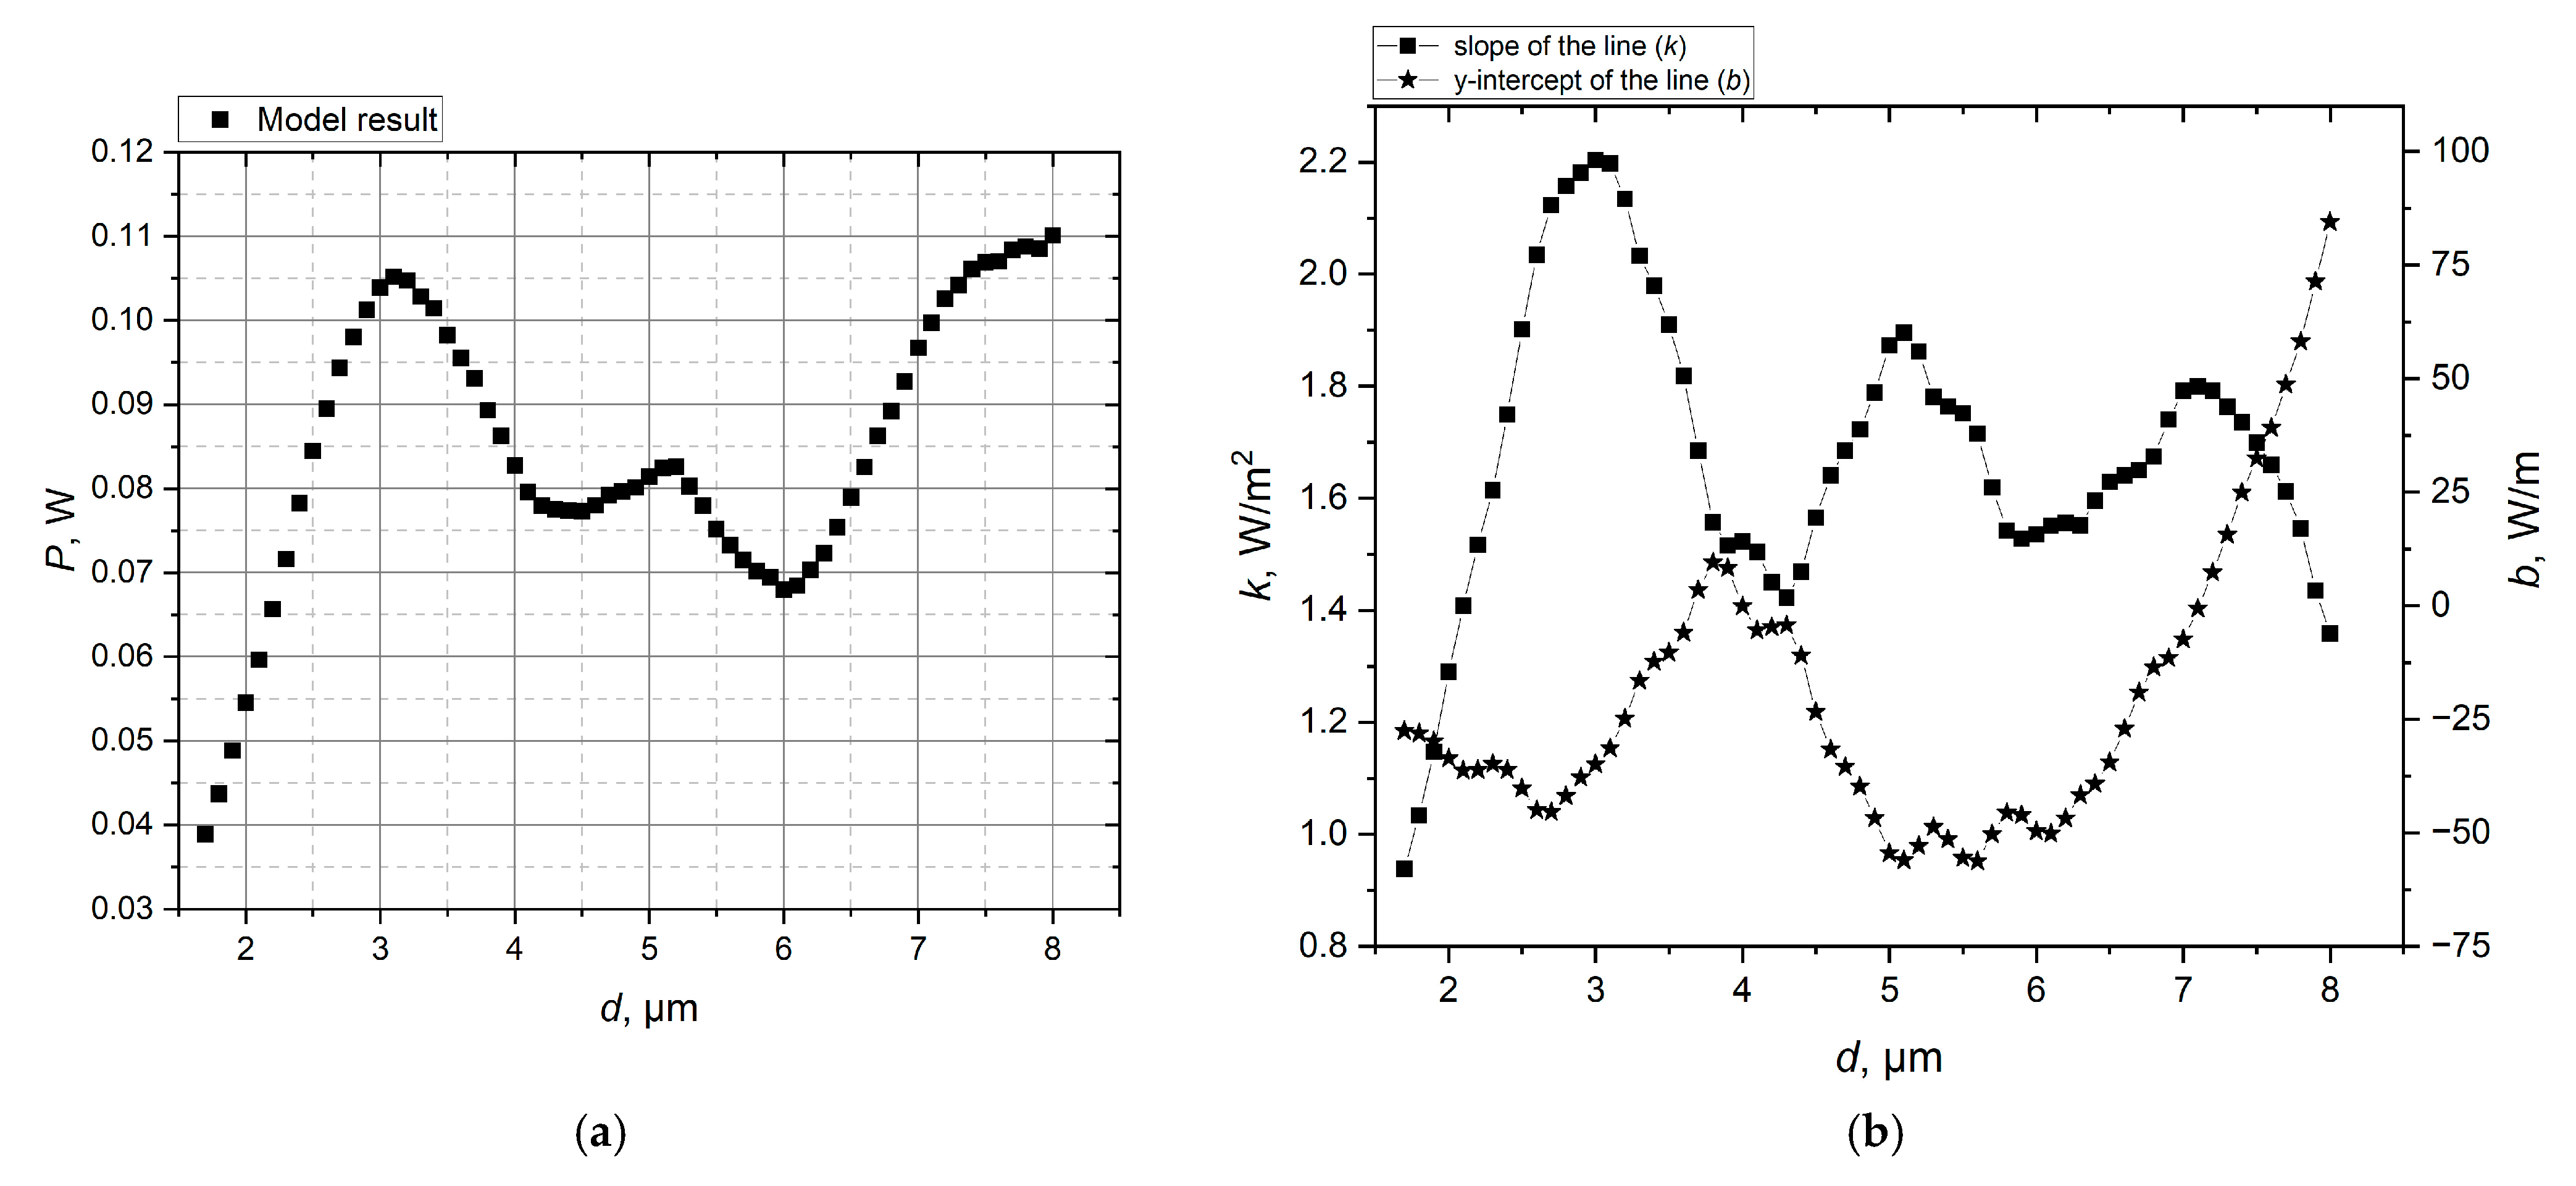
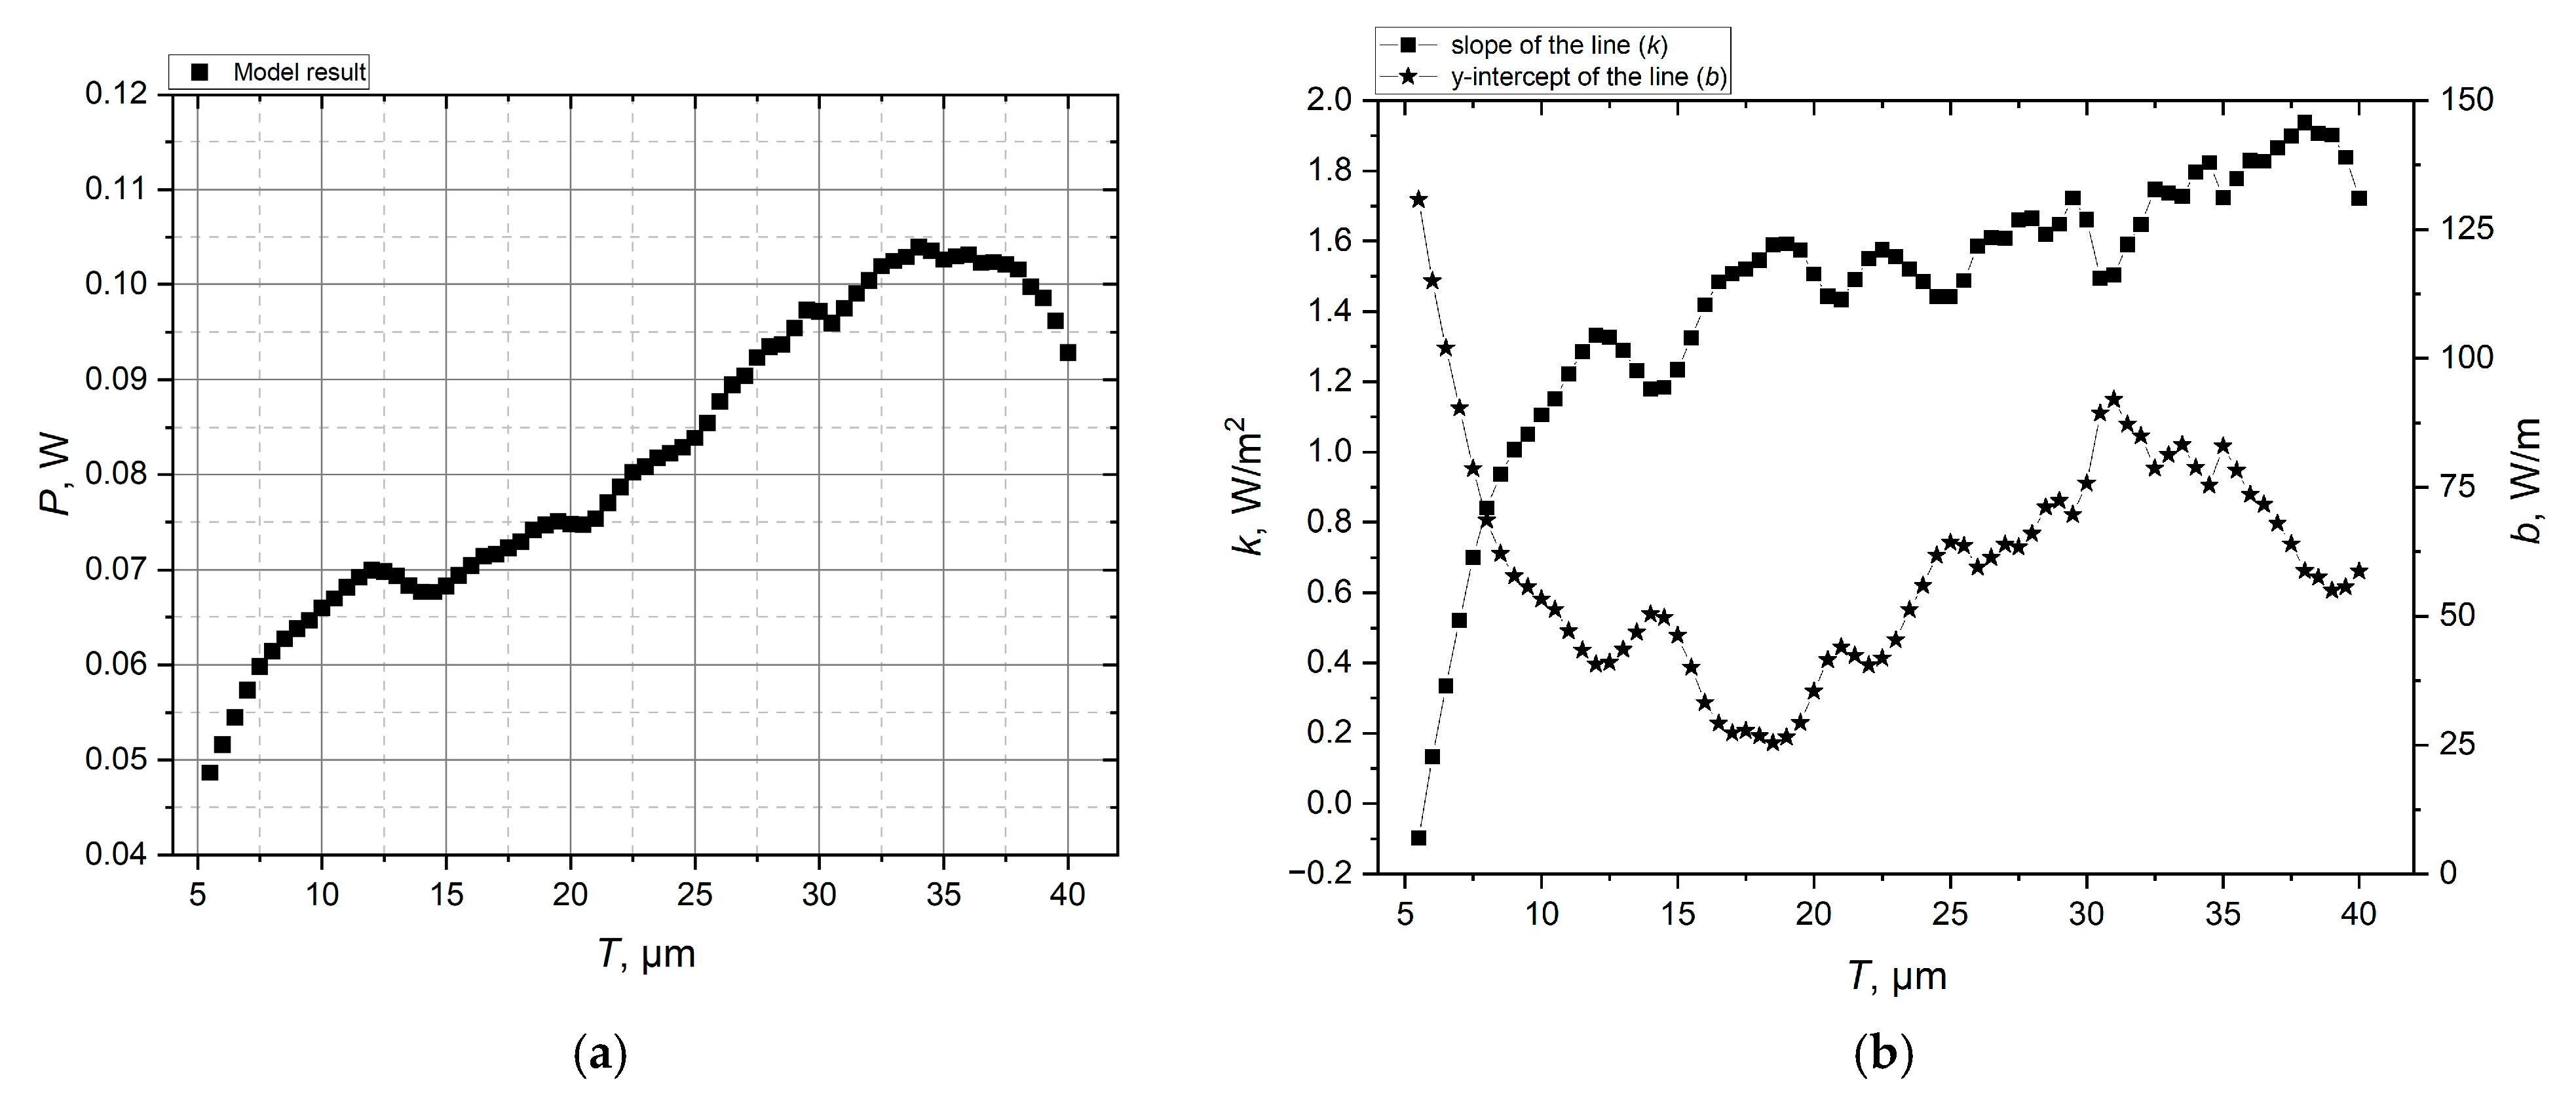
The mathematical model developed in this study facilitates the calculation and analysis of the distribution of the linear power density scattered from the upper and/or lower surfaces of the planar waveguide. This quantity is qualitatively comparable to the intensity of radiation emitted from the lateral surface of an optical fibre. The model allows the physical properties of the media to be altered, along with the geometric parameters of individual microcavities and the entire periodic structure (e.g., dimensions and periodicity). The model was implemented with four microcavities in the periodic structure. Two common shapes of microcavities were considered: spherical and elliptical, shown in Figure 4, where d is the diameter of the microcavity, l is the length of the microcavity, and T is the period of the structure.
The dimensions and shapes were selected based on experimental data [12]. The minimum and maximum values for the diameter, length, and periodicity of microcavities are presented in Table 1.
Based on Equations (1)–(3), the distribution of the electric field strength on the top surface of the waveguide was determined (Figure 1). The power radiation scattered by the microcavity structure per unit length was calculated. The linear power density of radiation scattered by a single microcavity and the linear power density of radiation scattered by a periodic structure of microcavities were calculated separately. The linear power density distributions along the waveguide surface were plotted and analysed based on the data obtained. Figure 5 illustrates examples of the scattered radiation distributions for the entire structure with spherical (Figure 5a) and elliptical (Figure 5b) microcavities (blue curves) and for an individual microcavity (orange curves). For a single microcavity, the spectrum exhibits weak interference peaks. In contrast, the scattered radiation spectrum becomes more complex when multiple microcavities are arranged in a periodic structure. Additional peaks in the spectrum are attributed to interference between radiation scattered by different microcavities within the periodic structure. As the number of microcavities increases, the linear power density of the radiation scattered from the side surface of the waveguide also increases.
To evaluate the uniformity of the power distribution of the radiation scattered by the microcavity structure, we introduced uniformity coefficients. The distribution of the linear power density along the periodic microcavity structure (waveguide side surface) was approximated by a trend line in the form y = k x + b , where the coefficient k [W/m2]—slope of the line and b [W/m]—y-intercept. The coefficients of k and b, determined using the method of least squares, served as indicators of uniformity.
The distribution of the linear power density of scattered radiation along the periodic microcavity structure was most uniform when the following necessary conditions were satisfied:
b 0 k 0 .
Criterion (10) is subsequently used to analyse the dependencies of the coefficients k and b on the geometric parameters of the periodic microcavity structure. Numerical calculations were carried out for both spherical and elliptical microcavity periodic structures, using geometric parameters close to those listed in Table 1. The results obtained and subsequently analysed were found to be equivalent to those shown in Figure 5. The analysis yielded integral characteristics, which were subsequently represented as plots of the total power scattered from the side surface of the waveguide and the uniformity coefficients as functions of the structural geometric parameters. The influence of each geometric parameter on the power density distribution along the waveguide (optical fibre) was assessed. As a result, parameter ranges were identified for which the most uniform distributions of the linear power density of scattered radiation are achieved.

3. Results

By using the distributions exemplified in Figure 5, we constructed plots showing the dependence of the total power P [W], scattered from the side (upper) surface of the waveguide (optical fibre), and the uniformity coefficients k and b, on the geometric parameters of the microcavity structure. The total power scattered from the side surface of the fibre was calculated using the following expression:
P = 0 L I   d y   [ W ] ,
where L—length of the waveguide and I—linear power density of radiation along the waveguide section. The results of the calculations are presented in Figure 6 and Figure 7.
The analysis of spherical microcavities focused on variations in diameter and period. Figure 6a shows a nonlinear dependence of the total scattered power on the cavity diameter, exhibiting a complex behaviour. The period of the microcavity structure was held constant at T = 12.76 μm. The resulting curve exhibits three local maxima corresponding to cavity diameters of 3.2 μm, 5.2 μm, and 8 μm.
The first local maximum in Figure 6a (at d ≈ 3.2 μm) corresponds to a region near the local minimum for coefficient b and the local maximum for coefficient k (Figure 6b). For microcavity diameters close to 3.2 µm, the analysis of curves similar to those shown in Figure 5 indicates intense scattering at the first microcavity, followed by significant attenuation of the scattered power along the remaining cavities in the structure. The application of Criterion (10) to analyse the uniformity coefficients in Figure 6b suggests that the most effective microcavity structures, in terms of uniform power distribution along the waveguide, correspond to diameters in the ranges of 3.6–4.4 µm and 7.5–8.0 µm. Notably, within the latter range, the scattered power reaches its maximum value (Figure 6a).
Figure 7 shows the dependencies of the power scattered from the side surface of the waveguide and the uniformity coefficients on the period T of the spherical microcavity structure. As the period increases, the scattered power exhibits an almost monotonic growth (Figure 7a). A maximum value of the scattered power P is observed near T ≈ 33 μm. The curve in Figure 7a is characterised by sharp decreases at the boundaries of the investigated period range, i.e., near T = 5 μm and T = 40 μm.
The analysis of the curves in Figure 7b demonstrates that the optimal compliance with Criterion (10) is observed within the period range of 5–7 μm. However, as previously observed, this range corresponds to a significant decrease in the scattered power. From the perspective of scattering efficiency, a more favourable range lies between 30 µm and 37 µm, in proximity to the local maximum of the coefficient b. Within this interval, the scattered radiation achieves its most uniform distribution along the microcavity structure, while the scattered power reaches its highest values.
For a periodic structure comprising four circular microcavities, the most uniform distribution of scattered radiation along the waveguide without the significant loss of power is achieved for cavity diameters in the range of 3.6–4.4 μm and 7.5–8.0 μm, with a constant period of T = 12.76 μm. When the microcavity diameter is fixed at d = 5.15 μm, the optimal period of the microcavity structure lies in the range of 30 μm to 37 μm.
For microcavities having an elliptical cross-section, the following three parameters were analysed: the length and diameter of the cavity (corresponding to the major and minor semi-axes of the ellipse), along with the periodicity of microcavity arrangement within the structure.
Figure 8 presents the dependencies of the scattered power P from the side surface of the waveguide and the uniformity coefficients on the microcavity length l for a microstructure period of T = 25.51 μm and a cavity diameter of d = 5.15 μm. As demonstrated in Figure 8a, for relatively short elliptical microcavities with a diameter of up to 7.5 μm, the scattered power fluctuates around 0.137 W. However, with an increase in microcavity length, a decrease in power is observed, following a nearly linear trend. The analysis of Figure 8b using Criterion (10) indicates an optimal range of microcavity lengths between 10 μm and 12 μm. Within this range, the coefficient b reaches a maximum, while the coefficient k exhibits a local minimum, and the scattered power P approaches its peak value. It is worth noting that for cavity lengths greater than 17.0 μm, the coefficient k exhibits a monotonous decrease, while the coefficient b remains close to zero. This phenomenon indicates a weak scattering effect at the first microcavity, consequently leading to a more uniform distribution of scattered power along the microcavity structure. However, within this range, the total scattered power rapidly decreases with increasing microcavity length, thereby indicating a decline in the efficiency of the scattering structure. For a periodic structure comprising four circular microcavities, the most uniform distribution of scattered radiation along the waveguide without significant loss of power is achieved for cavity diameters in the range of 3.6–4.4 μm and 7.5–8.0 μm, with a constant period of T = 12.76 μm. When the microcavity diameter is fixed at d = 5.15 μm, the optimal period of the microcavity structure lies in the range of 30 μm to 37 μm.
Figure 9 presents the dependencies of the power scattered from the side surface of the waveguide and the uniformity coefficients on the diameter of elliptical microcavities at a microcavity length of l = 19.18 μm and a structure period of T = 25.51 μm. Figure 9a reveals a non-monotonic increase in integrated scattered power P with a variation in microcavity diameter, reaching a maximum at d ≈ 8.8 μm. Figure 9b shows that Criterion (10) is best satisfied within two diameter ranges of 1.0–2.8 μm and 5.0–6.6 μm. The lower range exhibits significantly lower scattered power than that observed in the upper range. As the total scattered power from the waveguide surface approaches its maximum, the coefficient k approaches its peak value. The coefficient b reaches its local minimum, although it still retains relatively high values. The findings indicate dominant scattering at the initial microcavities rather than uniform distribution along the structure.
Figure 10 shows the dependencies of the power scattered from the side surface of the waveguide and the uniformity coefficients on the periodicity of the elliptical microcavity arrangement, with the microcavity length of l = 19.18 μm and diameter of d = 5.15 μm. Figure 10a shows a nearly monotonous increase in scattered power with an increase in the period. Within the range of 36–40 μm, the dependence reaches its maximum, followed by a downward trend in integral power beyond this region.
Figure 10b shows that in the region where the scattered power reaches its maximum, the coefficient k reaches peak values as well, while the coefficient b tends to its minimum. This finding indicates a strongly non-uniform distribution of scattered power along the microcavity structure. The distribution of scattered power that satisfies Criterion (10) is optimised when the period of the elliptical microcavity structure lies within the range of 19.18–32 μm. However, it should be noted that within this range, the integral scattered power fails to reach its maximum values.
The calculations demonstrated that, for elliptical microcavities with a structure period of T = 25.51 μm and a cavity diameter of d = 5.15 μm, the optimal microcavity lengths lie within the range of 10–12 μm. When the microcavity length (l = 19.18 μm) and the period (T = 25.51 μm) are constant, the diameters corresponding to the most uniform distribution of scattered power fall within two ranges of 1.0–2.8 μm and 5.0–6.6 μm. However, in the lower range, the scattered power is significantly lower than in the upper range. When both the length and diameter of the elliptical microcavities are fixed at l = 19.18 μm and d = 5.15 μm, respectively, the periods that satisfy Criterion (10) are found to lie within the range of 19.18–32 μm.

4. Discussion

In the present work, mathematical models of radiation scattering in a planar optical waveguide simulating a 62.5/125 μm multimode fibre on periodic structures of spherical and elliptical microcavities were developed using the COMSOL Multiphysics application package. It is important to note that the two-dimensional planar approximation of the cylindrical fibre does not take into account three-dimensional effects (e.g., mode coupling and axial distribution of microcavities), but it has allowed us to significantly simplify the mathematical model and provide an understanding of the basic scattering mechanisms. In further studies, it is planned to move to the three-dimensional approximation.
The models incorporated periodic structures of microcavities with circular and elliptical cross-sections, representing spherical and elliptical microcavities, respectively.
The simulations involved strictly periodic microcavity structures with three variable geometric parameters, including the cavity length (for elliptical microcavities), the cavity diameter, and the periodicity of the structure. In each simulation, one of these input parameters was varied while the others were constant. The output parameter was the power of the radiation scattered from the side surface. The analysis focused on the power scattered along the periodic microcavity structure.
Specific uniformity parameters were introduced in order to assess the uniformity of the power distribution of scattered radiation. These parameters characterise the slope and height of the trend lines in the scattered radiation spectra. The dependencies of the total scattered power and the uniformity coefficients on the diameter and length (in the case of elliptical cavities) of the microcavities, as well as their periodic spacing within the structure, were obtained. The analysis of these relationships demonstrated the feasibility of identifying optimal parameters for the microcavity structure that ensure the most uniform scattering of radiation along the structure.
The mathematical models developed in this work differ from the single-mode fibre model presented in the work [20] in three key aspects, including the number of propagating modes, the operating wavelength and the core diameter. The single-mode fibre model considered only the fundamental mode, which propagated along the core while being reflected by the microcavities. In contrast, our multimode fibre models incorporate multiple modes (two in this case), which are partially reflected by the outer surface of the core, along with the periodic microcavity structure.
Subsequent research will focus on formulating and solving an optimisation problem for periodic structures comprising spherical and elliptical microcavities through comprehensive numerical experiments. This investigation will involve the simultaneous variation in multiple geometric parameters to determine the dependence of the linear power density of scattered radiation and the uniformity coefficients on the geometric parameters of the periodic structure in a multifactor scenario. Consequently, the optimal geometric parameters that ensure the highest uniformity of radiation scattered by the microcavity structure will be obtained. In addition to addressing the multifactorial case, it is also necessary to develop a mathematical model of scattering in an axisymmetric (cylindrical) geometry for a better approximation of real-world conditions.
It should be noted that the mathematical models proposed by the authors were compared with existing scattering theories, in particular, with Mie theory for spherical cavities. Mie theory is well developed for describing the scattering of radiation on a single spherical object, but its application to the analysis of scattering on a group of microcavities or on a non-spherical microcavity is significantly complicated. The essence of Mie theory is that each particle is considered as an independent scatterer, and the interaction between particles (e.g., re-scattering of light from one particle to another) and interference of waves scattered by different particles are not taken into account.
In the initial stages of the study, a qualitative comparison of the calculated scattered radiation fields for a single microcavity was performed. The comparison of the results obtained using Mie theory and COMSOL tools showed a satisfactory correspondence.

5. Conclusions

The numerical simulations yielded the distributions of both the linear power density of scattered radiation along the fibre side surface and the electric field intensity within the fibre core by analysing various configurations of spherical and elliptical microcavities (diameter, length and mutual arrangement) in a 62.5/125 μm multimode fibre at λ0 = 1310 nm. The results showed that microcavities with large diameters scatter radiation in all directions, while microcavities with small diameters facilitate the radiation propagation without significant scattering.
Based on the obtained data, we constructed graphs showing the dependence of the power scattered from the side surface of the fibre, as well as the uniformity coefficients k and b, on the microcavity length, diameter and spatial period within the structure. In this study, the coefficients k and b are used to quantify the variations in the uniformity of the scattered power distribution as the geometric parameters of the periodic microcavity structure are altered.
For a periodic structure composed of four spherical microcavities, the most uniform distribution of radiation scattered along the waveguide without significant loss of total power is achieved with the following combinations of microcavity parameters:
  • Microcavity diameter of d = 3.6–4.4 μm or d = 7.5–8.0 μm, with a fixed period of T = 12.76 μm;
  • Microcavity period of T = 30.0–37.0 μm, with a fixed diameter of d = 5.15 μm.
For a periodic structure composed of four elliptical microcavities, these combinations are as follows:
  • Microcavity diameter of d = 5.0–6.6 μm, with a fixed length of l = 19.18 μm and a period of T = 25.51 μm;
  • Microcavity length of l = 10–12 μm, with a fixed diameter of d = 5.15 μm and a period of T = 25.51 μm;
  • Microcavity period of T = 19.18–32 μm, with a fixed length of l = 19.18 μm and a diameter of d = 5.15 μm.
It should be noted that, although beyond the main scope of this study, we also investigated other microcavity geometries that manifest during optical fibre breakdown, particularly bullet-shaped cavities. The simulations demonstrated that elliptical and spherical microcavities with a period exceeding their characteristic dimensions ensure the most uniform power distribution along the periodic microstructure in multimode fibres.

Author Contributions

Conceptualization, A.Y.P. and A.V.P.; methodology, V.V.K.; software, M.A.N.; validation, A.Y.P. and A.V.P.; formal analysis, M.A.N.; resources, A.V.P. and V.V.K.; writing—original draft preparation, A.Y.P. and M.A.N.; writing—review and editing, V.V.K.; visualization, A.Y.P.; supervision, A.V.P.; project administration, V.V.K.; funding acquisition, A.V.P. and V.V.K. All authors have read and agreed to the published version of the manuscript.

Funding

This research was funded by the Russian Science Foundation, grant number 23-21-00169, https://rscf.ru/project/23-21-00169/ (accessed on 24 June 2025), supervised by A.V. Perminov. The research was funded by the Ministry of Science and Higher Education of the Russian Federation (Project No. FSNM-2023-0006) and supervised by V.V. Krishtop.

Institutional Review Board Statement

Not applicable.

Informed Consent Statement

Not applicable.

Data Availability Statement

Data underlying the results presented in this paper are not publicly available at this time but may be obtained from the authors upon reasonable request.

Conflicts of Interest

The authors declare no conflicts of interest.

Abbreviations

The following abbreviations are used in this manuscript:
PECperfect electric conductor
PMLperfectly matched layer

References

  1. Todoroki, S. Origin of periodic void formation during fiber fuse. Opt. Express 2005, 13, 6381–6389. [Google Scholar] [CrossRef] [PubMed]
  2. Todoroki, S. In-situ observation of fiber-fuse propagation. Jpn. J. Appl. Phys. 2005, 44, 4022–4024. [Google Scholar] [CrossRef]
  3. Todoroki, S. Transient propagation mode of fiber fuse leaving no voids. Opt. Express 2005, 13, 9248–9256. [Google Scholar] [CrossRef] [PubMed]
  4. Shuto, Y. Fiber Fuse Phenomenon, 3rd ed.; Design Egg, Inc.: Osaka, Japan, 2021; p. 370. ISBN 978-4-8150-1631-9. [Google Scholar]
  5. Shuto, Y. Cavity pattern formation and its dynamics of fiber fuse in single-mode optical fibers. J. Inform. Math. Sci. 2020, 12, 271–288. [Google Scholar] [CrossRef]
  6. Shuto, Y.; Yanagi, S.; Asakawa, S.; Kobayashi, M.; Nagase, R. Fiber fuse phenomenon in step-index single-mode optical fibers. IEEE J. Quantum Electron. 2004, 40, 1113–1121. [Google Scholar] [CrossRef]
  7. Konin, Y.A.; Scherbakova, V.A.; Perminov, A.V.; Petukhova, A.Y. Study of micro-cavities formed by optical breakdown under the influence of a magnetic field. Opt. Commun. 2022, 517, 128242. [Google Scholar] [CrossRef]
  8. Konin, Y.A.; Scherbakova, V.A.; Bulatov, M.I.; Malkov, N.A.; Lucenko, A.S.; Starikov, S.S.; Grachev, N.A.; Perminov, A.V.; Petrov, A.A. Structural characteristics of internal microcavities produced in optical fiber via the fuse effect. J. Opt. Tech. 2021, 88, 672–677. [Google Scholar] [CrossRef]
  9. Starikova, V.A.; Petukhova, A.Y.; Konin, Y.A.; Perminov, A.V. Plasma spark formation during optical breakdown of an optical fiber. Foton-Express 2023, 6, 396–397. (In Russian) [Google Scholar] [CrossRef]
  10. Konin, Y.A.; Starikova, V.A.; Petukhova, A.Y.; Grachev, N.A.; Petrov, A.A.; Perminov, A.V. Mathematical model of radiation scattering on a quasi–periodic structure in an optical fiber. Appl. Photonics 2023, 10, 42–55. [Google Scholar] [CrossRef]
  11. Petukhova, A.Y.; Konin, Y.A.; Perminov, A.V. Obtaining a scattering structure by the method of optical breakdown in special fibers. Appl. Photonics 2023, 9, 26–53. [Google Scholar] [CrossRef] [PubMed]
  12. Petukhova, A.Y.; Perminov, A.V.; Starikova, V.A.; Konin, Y.A. Mathematical model of radiation scattering on quasi-periodic microstructure in optical fiber. Bull. Russ. Acad. Sci. Phys. 2024, 88, 1000–1009. [Google Scholar] [CrossRef]
  13. Konin, Y.A.; Bulatov, M.I.; Scherbakova, V.A.; Garanin, A.I.; Tokareva, Y.D.; Mosheva, E.V. Investigation of the properties of the tsssno-volokonnyi temperature sensor created by the melting effect. Instrum. Tech. Exp. 2020, 4, 7882. [Google Scholar] [CrossRef]
  14. Konin, Y.A.; Shcherbakova, V.A.; Garanin, A.I.; Mosheva, E.W.; Grachev, N.A. The Development of All-fiber Temperature Sensor for Extreme Conditions. In Proceedings of the 2021 IEEE Conference of Russian Young Researchers in Electrical and Electronic Engineering (ElConRus), Moscow, Russia, 26–29 January 2021; IEEE: Piscataway, NJ, USA, 2021; pp. 1317–1320. [Google Scholar] [CrossRef]
  15. Konin, Y.A.; Garanin, A.I.; Scherbakova, V.A. Research the thermal sensitivity of a fiber optic sensor created with the catastrophic fuse. In Proceedings of the 2019 IEEE Conference of Russian Young Researchers in Electrical and Electronic Engineering (EIConRus), Moscow, Russia, 28–31 January 2019; Volume 32, pp. 90–104. [Google Scholar] [CrossRef]
  16. Ströbl, S.; Domke, M.; Rühm, A.; Sroka, R. Investigation of non-uniformly emitting optical fiber diffusers on the light distribution in tissue. Biomed. Opt. Express 2020, 11, 3601–3617. [Google Scholar] [CrossRef] [PubMed]
  17. Ströbl, S.; Wäger, F.; Domke, M.; Rühm, A.; Sroka, R. Homogeneously emitting, mechanically stable and efficient fs-laser machined fibre diffusers for medical applications. Lasers Surg. Med. 2020, 54, 588–599. [Google Scholar] [CrossRef] [PubMed]
  18. Konin, Y.A.; Petrov, A.A.; Starikova, V.A.; Smolnikov, A.G. Wide temperature range fiber optic sensor. Bull. Russ. Acad. Sci. Phys. 2022, 86, 100–103. [Google Scholar] [CrossRef]
  19. Konin, Y.A.; Petrov, A.A.; Perminov, A.V.; Petukhova, A.Y.; Smolnikov, A.G.; Lucenko, A.S.; Trushnikov, V.S. Fiber optic sensor for cryogenic liquids. Bull. Russ. Acad. Sci. Phys. 2024, 88, 983–985. [Google Scholar] [CrossRef]
  20. Nuerev, I.I. Modeling of spectral characteristics of fiber Bragg gratings with phase shift for solving problems of optomechanics in sensor systems. Inf. Technol. Radioelectron. Telecommun. 2015, 5, 127–133. [Google Scholar]
  21. Safaryan, K.A.; Goldobin, A.A.; Trefilov, I.A.; Goncharov, M.M. Modeling of a fiber-optic vibration sensor based on a fixed Bragg grating. Appl. Photonics 2024, 11, 123–135. [Google Scholar] [CrossRef]
  22. Matveenko, V.P.; Serovaev, G.S.; Kosheleva, N.A. Results of mathematical modeling supporting the reasonable use of fiber-optic strain sensors based on Bragg gratings. In Proceedings of the XII All-Russian Congress on Fundamental Problems of Theoretical and Applied Mechanics, Ufa, Russia, 19–24 August 2019; Volume 3, pp. 1333–1335. [Google Scholar]
  23. Zakharov, V.N. Modeling of fiber-optic sensors for electrical quantities based on Bragg gratings with instrumental error correction. In Proceedings of the ITNT-2019. New Technology, Samara, Russia, 21–24 May 2019; Volume 1, pp. 499–504. [Google Scholar]
  24. Kashaganova, G.B.; Amirgalieva, S.N.; Kalizhanova, A.U.; Kartbaev, T.C.; Kozbakova, A.X. Numerical modeling of a fiber Bragg grating in MATLAB environment. In Proceedings of the International Symposium “Reliability and Quality”, Penza, Russia, 21–31 May 2018; Volume 1, pp. 329–333. [Google Scholar]
  25. Glushkov, E.V.; Glushkova, N.V.; Evdokimov, A.A. Hybrid numerical-analytical scheme for calculating elastic wave diffraction in locally inhomogeneous waveguides. Acoust. Phys. 2018, 64, 1–9. [Google Scholar] [CrossRef]
  26. Yamada, M.; Kinoshita, T.; Kimura, Y.; Koyama, O.; Sato, N. Scattering characteristic of light generating an optical fiber fuse. In Proceedings of the 2014 OptoElectronics and Communication Conference and Australian Conference on Optical Fibre Technology, Melbourne, Australia, 6–10 July 2014; pp. 179–180. [Google Scholar]
  27. Korsakova, E.A.; Lvov, A.E.; Kashuba, I.A.; Korsakov, V.S.; Salimgareev, D.D.; Korsakov, A.S.; Zhukova, L.V. Fiber-optic assemblies based on polycrystalline lightguides for the mid-IR. J. Opt. Tech. 2019, 86, 439–445. [Google Scholar] [CrossRef]
Figure 1. Resulting radiation distribution for two modes in the fibre model with a periodic microcavity structure. Here: 1—core, 2—cladding, 3—microcavities, 4—perfect electric conductor (PEC) boundary conditions, 5—perfectly matched layer (PML). The red lines indicate the boundaries at which the lateral scattering of radiation is calculated.
Photonics 12 00727 g001
Figure 2. Distribution of the amplitude of the electric field vector for waveguide modes in multimode fibre with microcavities having spherical cross-sections: (a) fundamental mode E1; (b) first higher-order mode E2.
Photonics 12 00727 g002
Figure 3. Distribution of the amplitude of the electric field vector for waveguide modes in multimode fibre with microcavities having elliptical cross-sections: (a) fundamental mode E1; (b) first higher-order mode E2; (c) total field E.
Photonics 12 00727 g003
Figure 4. Geometry of microcavities with (top) circular cross-section (spherical shape) and (bottom) elliptical cross-section (elliptical shape), where d—microcavity diameter, l—microcavity length and T—structure period.
Photonics 12 00727 g004
Figure 5. Linear power density distribution I of radiation scattered by the periodic structure of spherical (a) and elliptical (b) microcavities along the side (upper) surface of the waveguide of length L. The origin of coordinates in Figure 1 corresponds to the position of the first microcavity. The locations of the microcavities are indicated by black squares.
Photonics 12 00727 g005aPhotonics 12 00727 g005b
Figure 6. Power scattered from the side surface of the waveguide (a) and the uniformity coefficients (b) as functions of the diameter of spherical microcavities at a constant period of T = 12.76 μm.
Photonics 12 00727 g006
Figure 7. Power scattered from the side surface of the waveguide (a) and the uniformity coefficients (b) as functions of the periodicity of the spherical microcavity structure at a constant diameter d = 5.15 μm.
Photonics 12 00727 g007
Figure 8. Power scattered from the side surface of the waveguide (a) and the uniformity coefficients (b) as functions of the diameter of elliptical microcavities at T = 25.51 μm and d = 5.15 μm.
Photonics 12 00727 g008
Figure 9. Power scattered from the side surface of the waveguide (a) and the uniformity coefficients (b) as functions of the diameter of elliptical microcavities at T = 25.51 μm and l = 19.18 μm.
Photonics 12 00727 g009
Figure 10. Power scattered from the lateral surface of the waveguide (a) and the uniformity coefficients (b) as functions of elliptical microcavities at l = 19.18 μm and d = 5.15 μm.
Photonics 12 00727 g010
Table 1. Geometric parameters of spherical and elliptical microcavities obtained experimentally [12].
Microcavity ShapeLength l, μmDiameter d, μmPeriodicity T, µm
Min.Max.Min.Max.Min.Max.
Sphere0.863.866.3838.27
Ellipse2.2011.980.865.1520.4138.26
Disclaimer/Publisher’s Note: The statements, opinions and data contained in all publications are solely those of the individual author(s) and contributor(s) and not of MDPI and/or the editor(s). MDPI and/or the editor(s) disclaim responsibility for any injury to people or property resulting from any ideas, methods, instructions or products referred to in the content.

