Article

High-Sensitivity Dynamic Detection of Dissolved Acetylene in Transformer Oil Based on High-Power Quartz-Enhanced Photoacoustic Spectroscopy Sensing System

by
Yuxiang Wu
1,2,
Tiehua Ma
1,2,
Chenhua Liu
3,
Yashan Fan
3,
Shuai Shi
3,
Songjie Guo
3,
Yu Wang
3,
Xiangjun Xu
3,
Guqing Guo
3,
Xuanbing Qiu
3,
Zhijin Shang
3,* and
Chuanliang Li
3
1
State Key Laboratory of Dynamic Measurement Technology, North University of China, Taiyuan 030051, China
2
School of Electrical and Control Engineering, North University of China, Taiyuan 030051, China
3
Shanxi Engineering Research Center of Precision Measurement and Online Detection Equipment, School of Applied Science, Taiyuan University of Science and Technology, Taiyuan 030024, China
*
Author to whom correspondence should be addressed.
Photonics 2025, 12(7), 713; https://doi.org/10.3390/photonics12070713
Submission received: 18 June 2025 / Revised: 30 June 2025 / Accepted: 9 July 2025 / Published: 16 July 2025
(This article belongs to the Section Lasers, Light Sources and Sensors)

Abstract

To enable the highly sensitive detection of acetylene (C2H2) dissolved in transformer oil, a high-power quartz-enhanced photoacoustic spectroscopy (QEPAS) sensing system is proposed. A standard 32.7 kHz quartz tuning fork (QTF) was employed as an acoustic transducer, coupled with an optimized acoustic resonator to enhance the acoustic signal. The laser power was boosted to 150 mW using a C-band erbium-doped fiber amplifier (EDFA), achieving a detection limit of 469 ppb for C2H2 with an integration time of 1 s. The headspace degassing method was utilized to extract dissolved gases from the transformer oil, and the equilibrium process for the release of dissolved C2H2 was successfully monitored using the developed high-power QEPAS system. This approach provides reliable technical support for the real-time monitoring of the operational safety of power transformers.

1. Introduction

Oil-immersed transformers play a critical role in voltage regulation, energy transmission, and system protection. Their operational integrity directly impacts the safety and stability of the power grid. Statistics show that a single transformer failure can result in an average direct economic loss of USD 125,000 and may trigger cascading failures across the grid [1,2]. Dissolved gas analysis (DGA) technology is used to detect transformer faults by monitoring the concentration and dynamics of characteristic gases dissolved in transformer oil. It has become a cornerstone of transformer condition monitoring systems. Key fault-indicative gases in DGA include carbon monoxide (CO), carbon dioxide (CO2), methane (CH4), ethylene (C2H4), and acetylene (C2H2) [3]. During normal aging, insulating oil primarily generates CO and CO2. When fault temperatures slightly exceed normal operating levels, CH4 and C2H4 are predominantly produced. In the event of arc discharge—when the arc channel temperature reaches 300 °C and the duration exceeds 5 milliseconds—the concentration of C2H2 in the oil can increase tenfold within 24 h. If such high-energy discharges are not promptly detected, they may lead to insulation breakdown and catastrophic failure within 72 h [4,5]. Therefore, real-time monitoring of dissolved C2H2 is crucial for ensuring the reliable and safe operation of the power grid.
Various gas analysis techniques have been developed and widely applied for the detection of dissolved gases in transformer oil, including gas chromatography (GC), Fourier transform infrared spectroscopy (FTIR), Raman spectroscopy, tunable diode laser absorption spectroscopy (TDLAS), and photoacoustic spectroscopy (PAS) [6,7,8,9,10,11,12,13]. According to the IEEE standard, GC is regarded as the authoritative method for measuring dissolved gases in transformer oil due to its high sensitivity and capability to simultaneously analyze multiple gas components. However, its frequent calibration requirements, complex operation procedures, and bulky instrumentation hinder its applicability for real-time monitoring and prompt fault diagnosis in transformers. FTIR technology employs a Michelson interferometer and Fourier transform algorithms to analyze the absorption characteristics of dissolved gases at specific infrared wavelengths in the frequency domain [14,15]. This technique enables the simultaneous detection of multiple gas species and simplifies sample pre-processing. Nevertheless, the use of precision optical components increases both equipment and maintenance costs. Raman spectroscopy is capable of detecting characteristic fault gases, but its sensitivity is relatively low compared to other techniques. TDLAS technology offers real-time gas detection with high selectivity; however, its performance depends on laser intensity calibration to maintain measurement accuracy [16,17,18,19,20,21,22]. PAS technology detects weak acoustic signals generated by the interaction between target gases and laser light at specific wavelengths, using an acoustic–electric transducer [23,24,25,26,27,28,29,30]. This approach eliminates the influence of light intensity fluctuations common in traditional absorption spectroscopy. Nonetheless, PAS systems based on broadband response microphones and low-frequency photoacoustic cells are more susceptible to environmental and gas flow noise.
As an alternative approach to PAS, quartz-enhanced photoacoustic spectroscopy (QEPAS) has undergone rapid development since it was first reported in 2002 [31]. In QEPAS, a compact and high-Q-factor quartz tuning fork (QTF) is employed as a sharply resonant acoustic transducer, replacing the conventional microphone [31,32,33,34,35,36,37]. The detection sensitivity of QEPAS is influenced by the acoustic energy concentrated in the gap between the prongs of the tuning fork. To enhance this acoustic energy, Dong et al. optimized the parameters of the acoustic micro-resonator (AmR) and identified the optimal positioning range that yields the highest signal-to-noise ratio [32]. In 2023, Zheng et al. introduced a Helmholtz resonator to QEPAS sensor, utilizing acoustic filtering via Helmholtz resonance to effectively reduce the noise level [33]. Ma et al. demonstrated an H-shaped acoustic AmR that improved laser energy utilization by coupling two off-axis acoustic resonators [34].
Another strategy to increase acoustic energy involves enhancing the excitation laser power. In 2022, Shang et al. employed a high-power multimode laser diode, achieving an order-of-magnitude increase in the QEPAS signal [38]. In 2024, Qiao et al. developed a high-power solid-state laser based on Tm:YAP crystal, which delivered a maximum output power of 150 mW, advancing QEPAS technology through the integration of high-power lasers [39]. Laser power can also be amplified via stimulated emission in optical amplifiers based on doped optical fibers. However, their operational wavelength ranges are inherently limited by the electronic transitions of the dopant ions. Currently, the most widely used Erbium-doped fiber amplifiers (EDFAs) operate within the following bands: the S band (1450–1550 nm), C band (1520–1570 nm), and L band (1565–1610 nm). Therefore, selecting an appropriate fiber amplifier and integrating it with the QEPAS system is an effective strategy for achieving the highly sensitive detection of dissolved C2H2 in transformer oil.
In this study, we present a high-power QEPAS sensor based on EDFA for C2H2 detection. An EDFA boosted the laser power to 150 mW, enabling a detection sensitivity for acetylene as low as 469 ppb. Dissolved C2H2 in transformer oil was extracted using dynamic headspace degassing and monitored in real time with the developed power-enhanced QEPAS system.

2. Materials and Methods

In QEPAS technology, gas molecules absorb laser energy and transition to an excited state, subsequently releasing the energy as heat through the vibration-to-translation (V-T) relaxation process. The thermal power density generated by the gas molecules upon absorbing the laser energy can be expressed as [40]
H ( r , t ) = k V - T N 2 ( r , t ) h v
where kV-T is the V-T relaxation rate and hv is the energy of the absorbed photon. N2(r,t) is the number of molecules in the excited state. H(r,t) denotes the thermal power density as a function of the position vector r and time t.
The absorption of light at constant power leads to gas heating but does not produce an acoustic signal. Only temporal variations in the generated thermal power density can induce pressure fluctuations, which manifest as sound waves. Therefore, the fundamental equation of photoacoustic effect can be expressed by the inhomogeneous wave equation
2 p t 2 c 2 2 ( p ) = S P A r , t = γ 1 H r , t t
where p is pressure, t is time, c is the speed of sound, and γ is the gas adiabatic coefficient. The source term SPA(r,t) is proportional to the time derivative of the thermal power density within the medium. Therefore, the generation of a photoacoustic signal requires modulation of the laser, either through intensity modulation (IM) or wavelength modulation (WM), to induce a time-dependent variation in the thermal power density.
Typically, the output wavelength of a diode laser can be modulated by adjusting the injection current. Assuming the laser current I(r,t) follows a periodic modulation, it can be expressed as follows:
I ( r , t ) = I D C ( r ) + I A C e j w t
The source term SPA(r,t) in the case of WM can be written as
S P A ( r , t ) = j ω ( γ 1 ) k V - T k s p + k r + j ω N ( r ) I D C ( r ) σ λ λ i I A C e j ω t
where ksp represents the rate constant of spontaneous radiation. The effects of all relaxation processes are represented by the rate constant kr. w represents the modulation frequency of the laser. The acoustic source term is linearly proportional to the concentration N(r) of the absorbing gas molecules, the absorption cross section of the molecular transition, and the intensity of the excitation laser.

3. Results

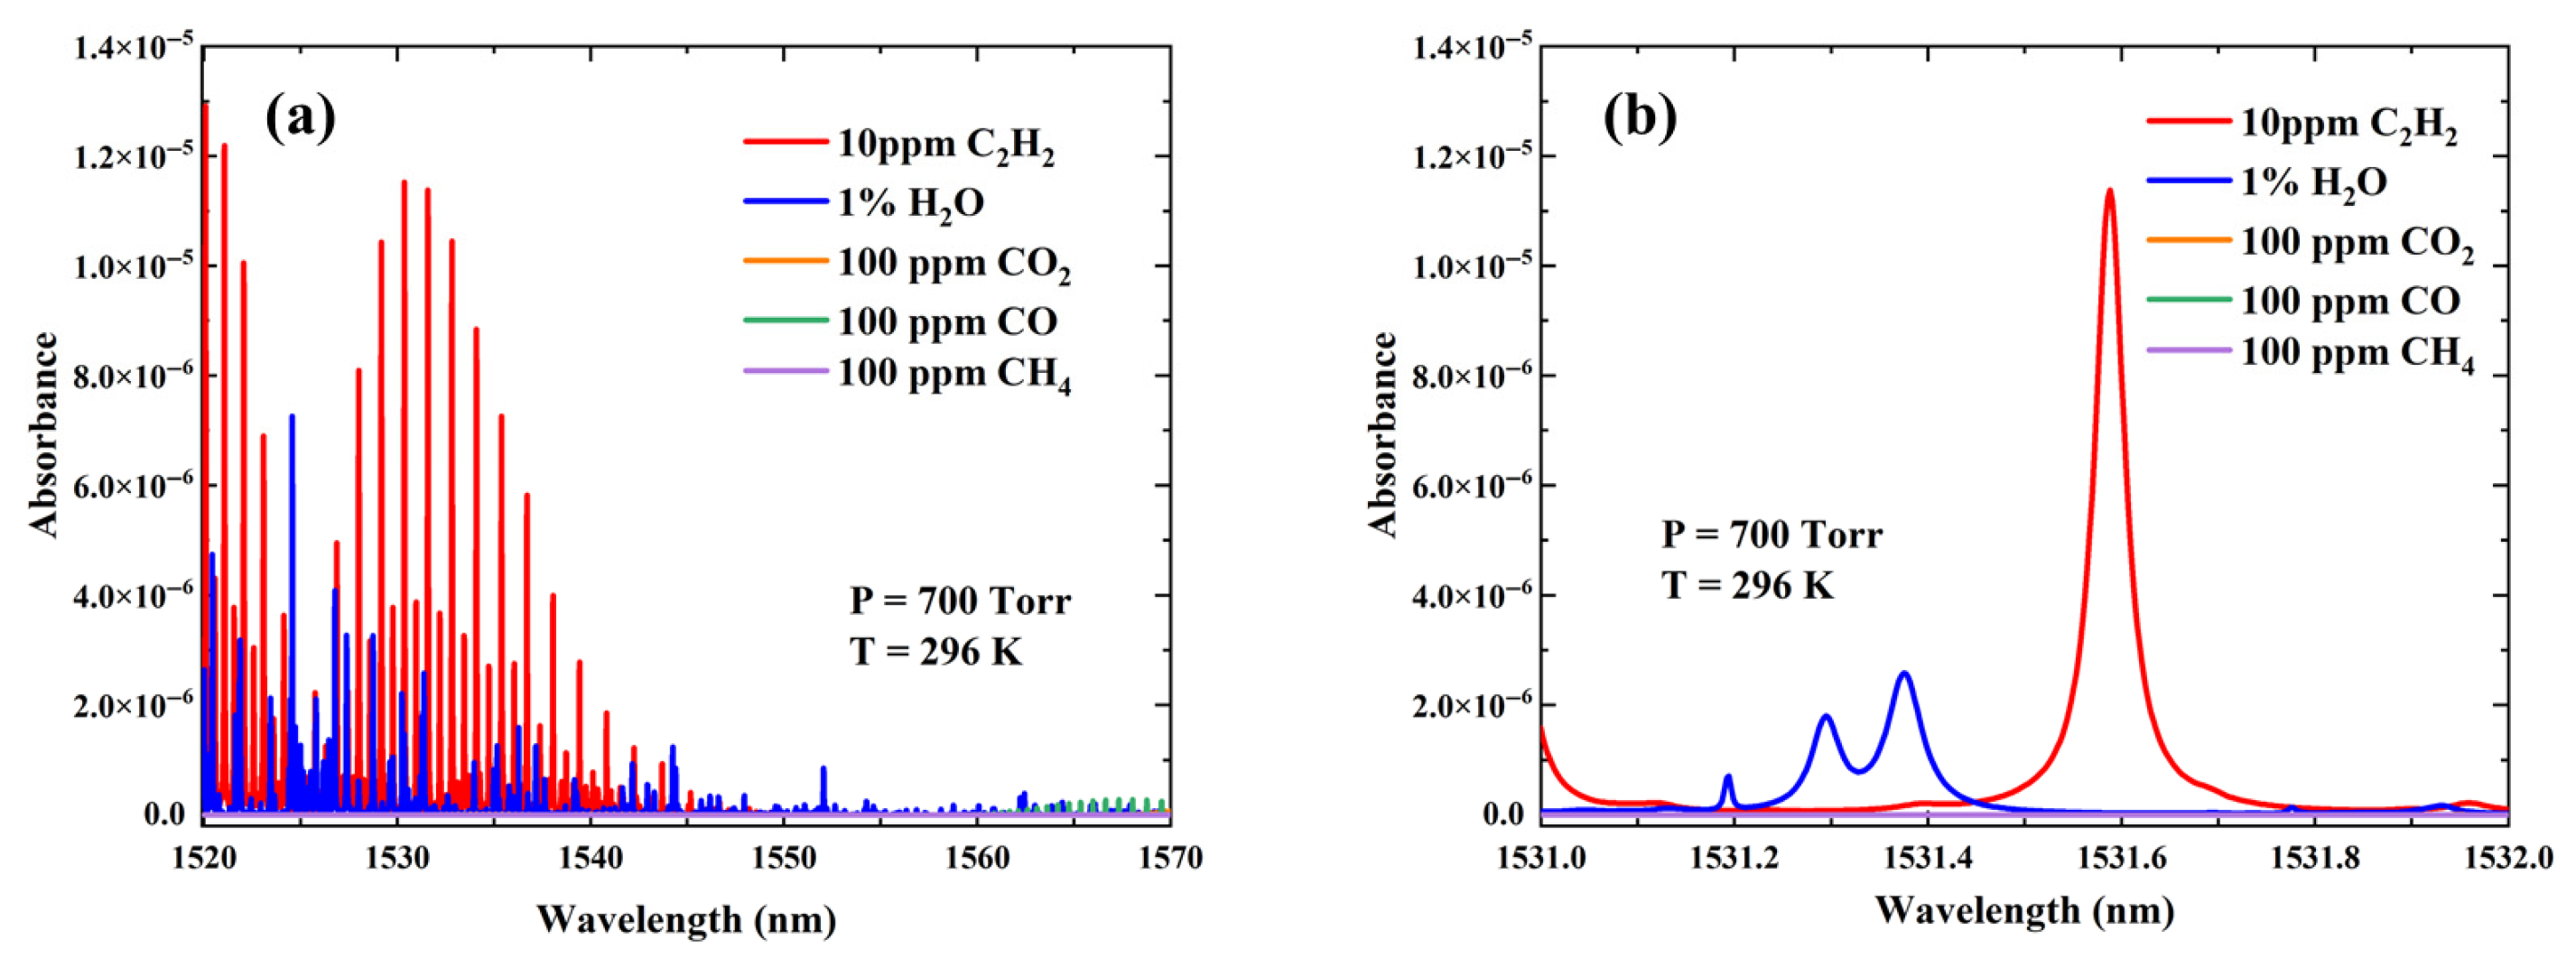
3.1. Selection of the Laser Wavelength

Currently, commercial fiber amplifier technology in the C-band is well-developed, and is capable of delivering watt-level excitation laser power within a compact footprint. Accordingly, the characteristic absorption lines of C2H2 within the range of 1520 nm—1570 nm are selected as the basis for detection. The selection of C2H2 absorption line requires consideration of both line strength and potential spectral interference from other gases, such as water vapor (H2O) and CO2 in ambient air, as well as CH4 and CO produced from transformer oil degradation. Based on the HITRAN database, absorption spectrums for 10 ppm C2H2, 1% H2O, 100 ppm CO2, 100 ppm CO, and 100 ppm CH4 were simulated at 700 Torr and 296 K, as shown in Figure 1a. The effective optical path length in the simulation is set to 1 cm. The strong C2H2 absorption lines were observed in the 1520–1540 nm range; however, this region also exhibited significant H2O absorption. To minimize interference from water vapor, the spectrum of the 1531–1532 nm range was examined in detail, as shown in Figure 1b. The absorption line at 6529.17 cm−1 demonstrated a strong absorption line strength of 1.165 × 10⁻²⁰ cm/molecule and no overlap with H2O absorption features. Therefore, this line was ultimately selected as the detection wavelength for dissolved C2H2 in transformer oil.

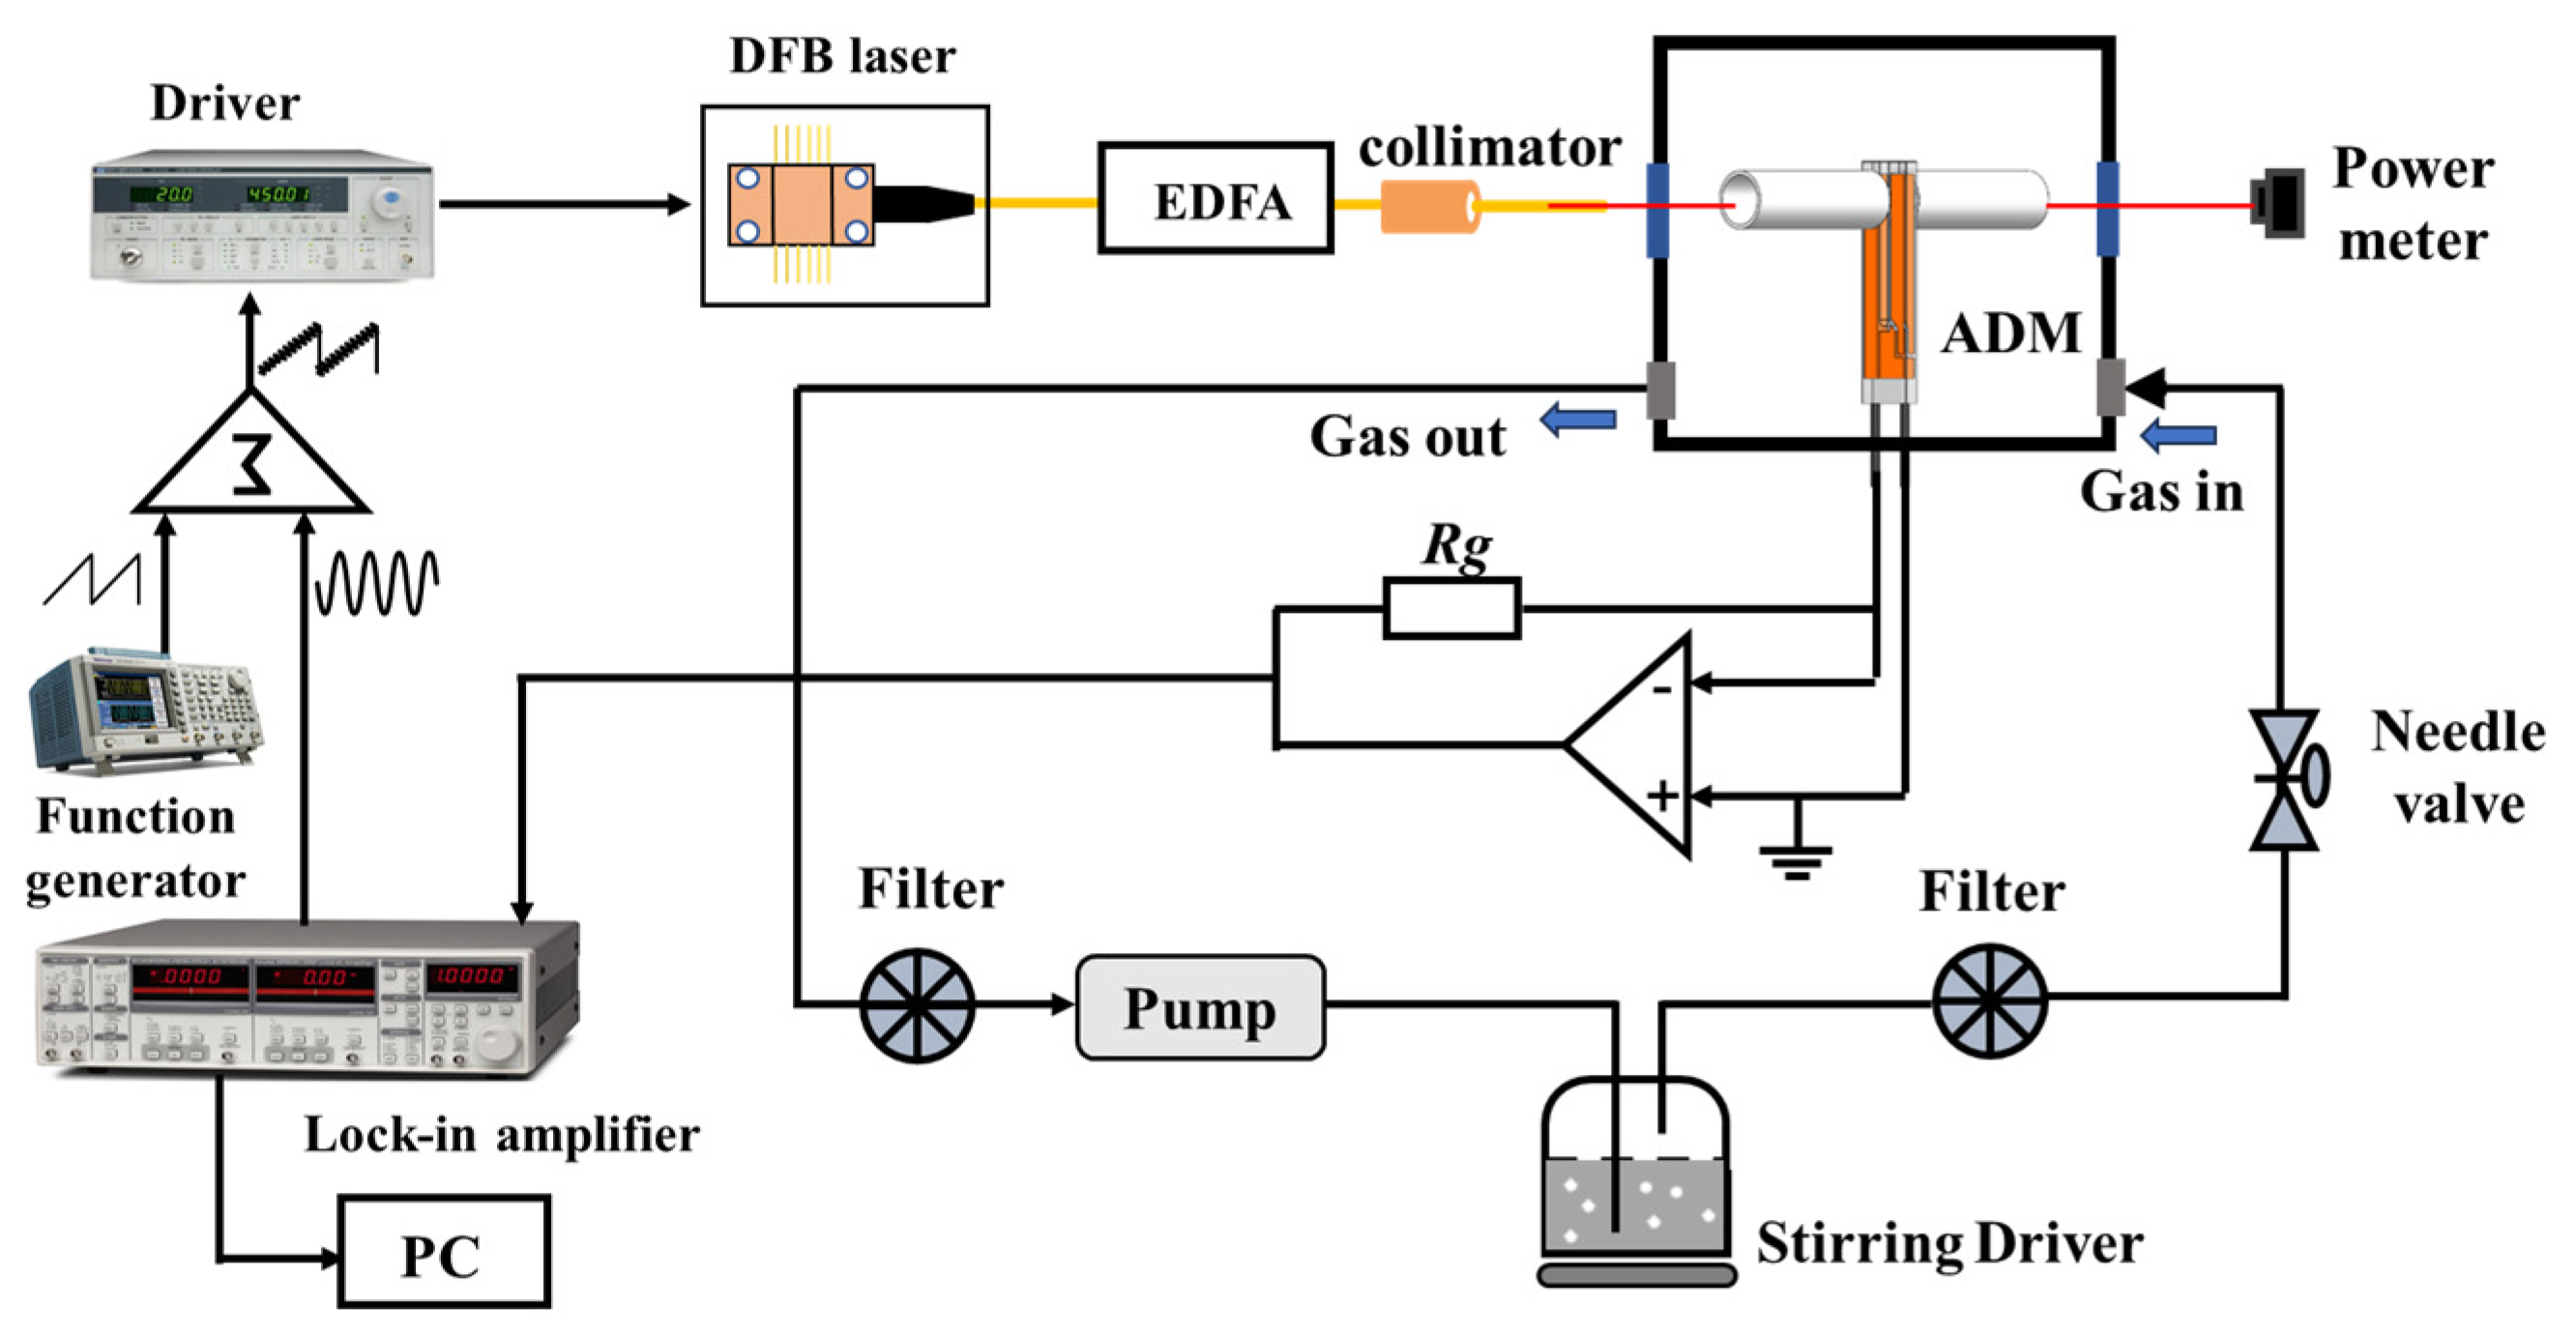
3.2. Experimental Setup

The experimental setup is shown in Figure 2. A distributed feedback (DFB) semiconductor laser with an output wavelength of 1531.6 nm was used as the excitation light source. The output laser power was amplified to 150 mW using an EDFA, which has an output power stability of <2%. The laser driver was operated at 30 °C with a drive current of 90.5 mA. A ramp scanning signal with a frequency of 50 mHz, generated by a function generator, was used to scan the target C2H2 absorption line from 6528 cm−1 to 6530 cm−1. A sinusoidal signal with a frequency of 16.384 kHz was generated by a lock-in amplifier (Stanford Research Systems, Model SR830, Sunnyvale, CA, USA), providing high-frequency modulation of the laser. The acoustic detection module (ADM), with a 70-cm3 inner volume, consists of a commercial QTF and an optimized acoustic resonator. The optimal acoustic resonator position is 0.7 mm from the top of the QTF prong. The resonant frequency and quality factor of commercial QTF are 32.76 kHz and 12,035, respectively. The photoacoustic signal generated by the QTF was converted into a voltage signal through a transimpedance amplifier and demodulated by a lock-in amplifier. The integration time of the lock-in amplifier was set to 1 s, with a filter slope of 12 dB/oct.
An oil and gas separation device was designed based on the dynamic headspace degassing method. It comprises an oil sample bottle, a magnetic stirrer, and an internal circulation gas path. A magnetic rotor was placed inside the oil sample bottle and driven by an electromagnetic stirrer located beneath it, enabling continuous agitation of the oil. This promotes the release of dissolved gases into the gas phase above the oil. The separated C2H2 gas first passed through a filter to remove oil mist, and then entered the ADM for concentration analysis. The gas flow rate was deliberately maintained at a constant 100 mL/min to minimize flow-induced noise.

3.3. Optimization of the Laser Power

In the high-power QEPAS system, two identical AmRs with an inner diameter of 0.6 mm and an individual length of 4.4 mm were applied to amplify the acoustic wave energy in the form of the standing wave. The commercial QTF was positioned at the acoustic antinode of the AmR, forming an on-beam configuration. The distance between the QTF and the resonator was set to 50 μm to maximize acoustic coupling efficiency. A certified mixture of 500 ppm C2H2 in nitrogen (N2) was filled in the ADM for experimental parameter optimization. Compared to the bare QTF, the addition of the AmR resulted in a 20-fold enhancement, as illustrated in Figure 3. To further enhance the QEPAS signal, a commercial EDFA (BKtel THPOA-SP400ac-FCAPC) with a two-stage amplifier was employed to boost the laser output power from 5 mW to 150 mW. The corresponding spectrum is also shown in Figure 3. As a result, a total gain factor of 200 was achieved in the peak QEPAS signal compared to the bare QTF. This power amplification contributed an additional 10-fold increase relative to the unamplified AmR-QEPAS setup.

3.4. Optimization of the Modulation and Pressure

In QEPAS-based sensors, the signal amplitude is highly dependent on the gas pressure and laser modulation depth. Gas pressure influences the vibration-to-translation (V-T) relaxation rate, the molecular absorption cross section, the absorption line shape, and the molecular number density. The optimal modulation depth depends on the full width at half maximum (FWHM) of the absorption line shape, which broadens with increasing pressure. To maximize the QEPAS signal, both gas pressure and laser current modulation depth were systematically optimized. Figure 4 shows the 2f signal amplitudes for a 500 ppm C2H2: N2 mixture as a function of the modulation depth at different pressures. The experimental results indicate that at pressures below 300 Torr reduced the molecular absorption cross section and slowed V-T relaxation rate limit signal enhancement, even with increased modulation depth. The maximum photoacoustic signal was observed at 600 Torr with a modulation depth of 25mA. Therefore, the atmospheric pressure was selected as the optimal working pressure, with a laser modulation depth of 25 mA for high-power QEPAS sensor applications.

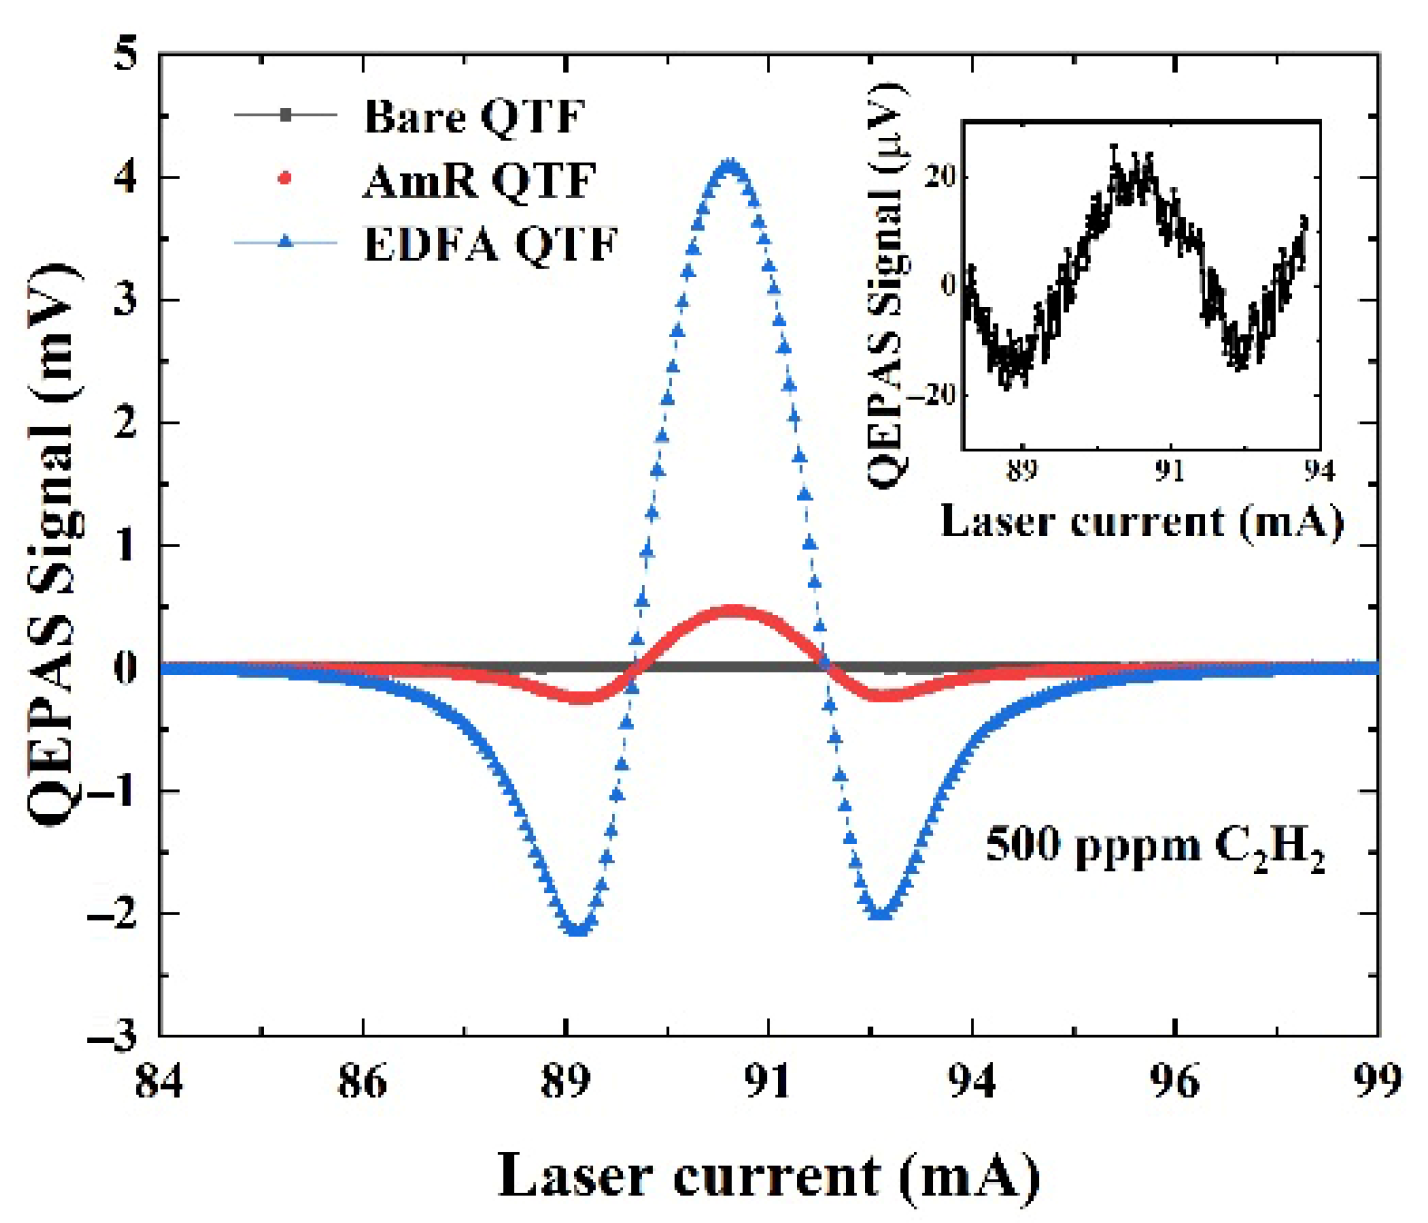
3.5. High-Power QEPAS System Performance Evaluation

The response of the QEPAS signal for various C2H2 concentrations is illustrated in Figure 5a. The output wavelength of the DFB laser was fixed at the target absorption line of 1531.6 nm. The C2H2 concentration varied from 0 to 1000 ppm, and the signal for each concentration was measured over a 5 min period. After each concentration measurement, the gas chamber was flushed with N2 for 3 min. The average signal values for each concentration are plotted in Figure 5b. A linear fitting procedure was performed, yielding an R-squared value of 0.999, which confirms the excellent linearity of the high-power QEPAS sensor in response to C2H2 concentration. For a 200 ppm C2H2/N2 mixture, a signal-to-noise ratio (SNR) of 426.3 was calculated, based on a signal amplitude of 1.62 mV and a noise level of 3.8 μV. Consequently, the minimum detection limit (MDL) was determined to be 469 ppb.

3.6. Detection of the Dissolved Acetylene Gas in Oil

To evaluate the performance of the high-power QEPAS sensor in detecting C2H2 in transformer oil, 900 mL of blank oil sample was spiked with 1% C2H2 gas at a flow rate of 100 mL/min for 15 min. Based on the headspace degassing method, the oil sample was continuously stirred on an electromagnetic stirring device. QEPAS signals were recorded at 1 min intervals, as illustrated in Figure 6. The results show that the detected C2H2 concentration increased with degassing time, attributed to the higher C2H2 concentration in the liquid phase compared to the gas phase. The signal eventually stabilized after approximately 110 min, indicating equilibrium between the liquid and gas phases. The relatively long equilibration time was mainly attributed to the high dissolved C2H2 concentration and a low gas flow rate of 100 mL/min in the internal circulation pathway.

4. Discussion

In summary, we presented a high-power QEPAS sensor for dissolved C2H2 monitoring in transformer oil. A 1531.6 nm DFB laser and a C-band EDFA were employed to align with the strong C2H2 absorption line and deliver up to 150 mW of excitation power. By increasing the laser power and optimizing the gas pressure and modulation depth, a minimum detection limit of 469 ppb was achieved at an integration time of 1 s. The sensor demonstrated effective detection of C2H2 concentration ranging from 0 to 1000 ppm. The degassing process of dissolved C2H2 in oil was monitored using the headspace degassing method, wherein the blank oil sample was spiked with 1% C2H2 gas for 15 min. The liquid–gas phase equilibrium time required was 110 min at an internal circulation flow rate of 100 mL/min. The developed high-power QEPAS sensing system enables the real-time monitoring of dissolved C2H2 in transformer oil, offering reliable technical support for fault diagnosis in power transformers. In contrast to conventional GC spectrometers and FTIR spectrometers, which typically occupy volumes in the order of cubic meters, the photoacoustic detection module of the designed high-power QEPAS system features a compact size of only 70 cm3. Additionally, by employing high-power laser excitation, the system enhances detection sensitivity by up to two orders of magnitude compared to traditional photoacoustic spectroscopy techniques. By integrating multiple lasers at different wavelengths with time-division multiplexing, the sensor system can be extended for the simultaneous detection of multiple fault gases, enabling more comprehensive transformer diagnostics.

Author Contributions

Conceptualization, Z.S. and Y.W. (Yuxiang Wu); methodology, T.M.; software, C.L. (Chenhua Liu); validation, S.S., S.G. and Y.W. (Yu Wang); formal analysis, Y.F. and X.X.; investigation, G.G.; resources, X.Q.; data curation, C.L. (Chenhua Liu); writing—original draft preparation, Y.W. (Yuxiang Wu); writing—review and editing, Z.S.; supervision, C.L. (Chuanliang Li); funding acquisition, T.M. All authors have read and agreed to the published version of the manuscript.

Funding

National Key Research and Development Program of China (Number: 2023YFF0718100), National Natural Science Foundation of China (Grant/Award Numbers: 62475182, 52076145, and 12304403); the special fund for Science and Technology Innovation Teams of Shanxi Province (202304051001034); Key Research and Development Program of Shanxi Province of China (202302150101006); Fund Program for the Scientific Activities of Selected Returned Overseas Professionals in Shanxi Province (Number: 20230031); Shanxi Scholarship Council of China (Number: 2023-151); Fundamental Research Program of Shanxi Province (Numbers: 202303021221147, 202203021222204, 202303021211157, and 202303021212224); Taiyuan University of Science and Technology Scientific Research Initial Funding (20242150), Shanxi Province Scientific Research Initial Funding (20252012); The Science and Technology Achievement Transformation Guiding Special Project of Shanxi Province (Number: 202104021301060).

Institutional Review Board Statement

Not applicable.

Informed Consent Statement

Not applicable.

Data Availability Statement

The original contributions presented in this study are included in the article. Further inquiries can be directed to the corresponding author.

Conflicts of Interest

The authors declare no conflicts of interest.

Abbreviations

The following abbreviations are used in this manuscript:
QEPASQuartz-enhanced photoacoustic spectroscopy
EDFAErbium-doped fiber amplifier
DGADissolved gas analysis
GCGas chromatography
FTIRFourier transform infrared spectroscopy
TDLASTunable diode laser absorption spectroscopy
PASPhotoacoustic spectroscopy
QTFQuartz tuning fork
AmRAcoustic micro-resonator
DFBDistributed feedback
FWHMFull width at half maximum
MDLMinimum detection limit

References

  1. Bakar, N.A.; Siada, A.A.; Islam, S. A review of dissolved gas analysis measurement and interpretation techniques. IEEE Electr. Insul. Mag. 2014, 30, 39–49. [Google Scholar] [CrossRef]
  2. Ma, G.; Wang, Y.; Qin, W.; Zhou, H.; Yan, C.; Jiang, J.; Ju, Y. Optical sensors for power transformer monitoring: A review. High Volt. 2021, 6, 367–386. [Google Scholar] [CrossRef]
  3. Susilo; Suwarno; Khayam, U.; Tsuchie, M.; Thein, M.; Hikita, M.; Saito, T. Study on Dissolved Gas Due Tue Thermally Degraded Insulating Paper in Transformer Oil. Procedia Technol. 2013, 11, 257–262. [Google Scholar]
  4. Sun, H.; Huang, Y.; Huang, C. A Review of Dissolved Gas Analysis in Power Transformers. Energy Procedia 2012, 14, 1220–1225. [Google Scholar] [CrossRef]
  5. Bustamante, S.; Manana, M.; Arroyo, A.; Castro, P.; Laso, A.; Martinez, R. Dissolved Gas Analysis Equipment for Online Monitoring of Transformer Oil: A Review. Sensors 2019, 19, 4057. [Google Scholar] [CrossRef]
  6. Zhou, S.; Iannuzzi, D. Immersion photoacoustic spectrometer (iPAS) for arcing fault detection in power transformers. Opt. Lett. 2019, 44, 3741–3744. [Google Scholar] [CrossRef] [PubMed]
  7. Fan, J.; Liu, Z.; Meng, A.; Yin, H.; Sun, Q.; Bin, F.; Jiang, Q. Characteristics of Tin Oxide Chromatographic Detector for Dissolved Gases Analysis of Transformer Oil. IEEE Access 2019, 7, 94012–94020. [Google Scholar] [CrossRef]
  8. Liu, N.; Xu, L.; Zhou, S.; Zhang, L.; Li, J. Simultaneous Detection of Multiple Atmospheric Components Using an NIR and MIR Laser Hybrid Gas Sensing System. ACS Sens. 2020, 5, 3607–3616. [Google Scholar] [CrossRef]
  9. Sun, H.; Ma, Y.; He, Y.; Qiao, S.; Yang, X.; Tittel, F.K. Highly sensitive acetylene detection based on a compact multi-pass gas cell and optimized wavelength modulation technique. Infrared Phys. Technol. 2019, 102, 103012. [Google Scholar] [CrossRef]
  10. Ma, G.; Zhao, S.; Jiang, J.; Song, H.; Li, C.; Luo, Y.; Wu, H. Tracing acetylene dissolved in transformer oil by tunable diode laser absorption spectrum. Sci. Rep. 2017, 7, 14961. [Google Scholar] [CrossRef]
  11. Jiang, J.; Wang, Z.; Han, X.; Zhang, C.; Ma, G.; Li, C.; Luo, Y. Multi-gas detection in power transformer oil based on tunable diode laser absorption spectrum. IEEE Trans. Dielectr. Electr. Insul. 2019, 26, 153–161. [Google Scholar] [CrossRef]
  12. Zhang, C.; He, Y.; Qiao, S.; Liu, Y.; Ma, Y. High-sensitivity trace gas detection based on differential Helmholtz photoacoustic cell with dense spot pattern. Photoacoustics 2024, 38, 100634. [Google Scholar] [CrossRef] [PubMed]
  13. Chen, K.; Guo, M.; Yang, B.; Jin, F.; Wang, G.; Ma, F.; Li, C.; Zhang, B.; Deng, H.; Gong, Z. Highly Sensitive Optical Fiber Photoacoustic Sensor for In Situ Detection of Dissolved Gas in Oil. IEEE Trans. Instrum. Meas. 2021, 70, 1–8. [Google Scholar] [CrossRef]
  14. Tang, X.; Wang, W.; Zhang, X.; Wang, E.; Li, X. On-line analysis of oil-dissolved gas in power transformers using Fourier trans form infrared spectrometry. Energies 2018, 11, 3192. [Google Scholar] [CrossRef]
  15. Munajad, A.; Subroto, C.; Suwarno. Fourier transform infrared (FTIR) spectroscopy analysis of transformer paper in mineral oil-paper composite insulation under accelerated thermal aging. Energies 2018, 11, 364. [Google Scholar] [CrossRef]
  16. Wang, J.; Wu, H.; Sampaolo, A.; Patimisco, P.; Spahnolo, V.; Jia, S.; Dong, L. Quartz-enhanced multiheterodyne resonant photoacoustic spectroscopy. Light Sci. Appl. 2024, 13, 77. [Google Scholar] [CrossRef]
  17. Shang, Z.; Wu, H.; Li, S.; Wang, G.; Sampaolo, A.; Patimisco, P.; Spahnolo, V.; Dong, L. Ppb-level mid-IR quartz-enhanced photoacoustic sensor for sarin simulant detection using a T-shaped tuning fork. Sens. Actuators B Chem. 2023, 390, 133937. [Google Scholar] [CrossRef]
  18. Xia, J.; Xia, Y.; Xiao, D.; Zhang, R.; Yu, N.; Liu, C. LAS-on-edge: A real-time laser absorption spectroscopic water vapor sensor on edge computing platforms. Sens. Actuators B Chem. 2024, 418, 136258. [Google Scholar] [CrossRef]
  19. Wang, H.; Zhang, J.; Sun, C.; Zhao, X.; Qi, H.; Chen, K. Miniaturized Fiber-Optic Photoacoustic Gas Sensor for Sub-ppb-Level Detection of Carbon Monoxide Based on Quantum Cascade Laser and Multipass Cell. Anal. Chem. 2025, 97, 8120–8128. [Google Scholar] [CrossRef]
  20. Wang, Q.; Wang, Z.; Kamimoto, T.; Deguchi, Y.; Wen, D.; Takahara, D. Applications of TDLAS based multi-species hydrocarbon measurement using a wide scanning range DFG laser. Results Eng. 2021, 12, 100297. [Google Scholar] [CrossRef]
  21. Wang, G.; Zhang, T.; Jiang, Y.; He, S. Compact photoacoustic spectrophone for simultaneously monitoring the concentrations of dichloromethane and trichloromethane with a single acoustic resonator. Opt. Express 2022, 20, 7053–7067. [Google Scholar] [CrossRef] [PubMed]
  22. Wang, G.; Meng, L.; Gou, Q.; Hanoune, B.; Crumeyrolle, S.; Fagniez, T.; Coeur, C.; Akiki, R.; Chen, W. Novel Broadband Cavity-Enhanced Absorption Spectrometer for Simultaneous Measurements of NO2 and Particulate Matter. Anal. Chem. 2023, 95, 3460–3467. [Google Scholar] [CrossRef]
  23. Zheng, H.; Liu, Y.; Lin, H.; Kan, R.; Patimisco, P.; Sampaolo, A.; Giglio, M.; Zhu, W.; Yu, J.; Tittel, F.; et al. Sub-ppb-level CH4 detection by exploiting a low-noise differential photoacoustic resonator with a room-temperature interband cascade laser. Opt. Express 2020, 28, 19446–19456. [Google Scholar] [CrossRef]
  24. Zheng, H.; Dong, L.; Sampaolo, A.; Wu, H.; Patimisco, P.; Yin, X.; Ma, W.; Zhang, L.; Yin, W.; Spahnolo, V.; et al. Single-tube on-beam quartz-enhanced photoacoustic spectroscopy. Opt. Lett. 2016, 41, 978–981. [Google Scholar] [CrossRef]
  25. Lv, H.; Zheng, H.; Liu, Y.; Yang, Z.; Wu, Q.; Lin, H.; Montano, B.; Zhu, W.; Yu, J.; Kan, R.; et al. Radial-cavity quartz-enhanced photoacoustic spectroscopy. Opt. Lett. 2021, 46, 3917–3920. [Google Scholar] [CrossRef]
  26. Xu, L.; Zhou, S.; Liu, N.; Zhang, M.; Liang, J.; Li, J. Multigas Sensing Technique Based on Quartz Crystal Tuning Fork-Enhanced Laser Spectroscopy. Anal. Chem. 2020, 92, 14153–14163. [Google Scholar] [CrossRef] [PubMed]
  27. Zhao, X.; Wang, H.; Xu, Y.; Li, C.; Qi, H.; Guo, M.; Peng, W.; Chen, K. Fiber-optic photoacoustic sensor with SF6 purity correction for decomposition derivative H2S based on 1f and 2f dual-modes. Appl. Phy. Lett. 2025, 126, 174101. [Google Scholar] [CrossRef]
  28. Wang, J.; Sun, C.; Wang, G.; Zou, M.; Tan, T.; Liu, K.; Chen, W.; Gao, X. A fibered near-infrared laser heterodyne radiometer for simultaneous remote sensing of atmospheric CO2 and CH4. Opt. Lasers Eng. 2020, 129, 106083. [Google Scholar] [CrossRef]
  29. Wu, H.; Dong, L.; Zheng, H.; Yu, Y.; Ma, W.; Zhang, L.; Yin, W.; Xiao, L.; Jia, S.; Tittel, F.K. Beat frequency quartz-enhanced photoacoustic spectroscopy for fast and calibration-free continuous trace-gas monitoring. Nat. Commun. 2017, 8, 15331. [Google Scholar] [CrossRef]
  30. Raza, M.; Xu, K.; Lu, Z.; Ren, W. Simultaneous methane and acetylene detection using frequency-division multiplexed laser absorption spectroscopy. Optics. Technol. 2022, 154, 10828. [Google Scholar] [CrossRef]
  31. Kosterev, A.A.; Bakhirkin, Y.A.; Curl, R.F.; Tittel, F.K. Quartz-enhanced photoacoustic spectroscopy. Opt. Lett. 2002, 27, 1902–1904. [Google Scholar] [CrossRef] [PubMed]
  32. Dong, L.; Kosterev, A.A.; Thomazy, D.; Tittel, F.K. QEPAS spectrophones: Design, optimization, and performance. Appl. Phys. B 2010, 100, 627–635. [Google Scholar] [CrossRef]
  33. Luo, H.; Wang, C.; Lin, H.; Wu, Q.; Yang, Z.; Zhu, W.; Zhong, Y.; Kan, R.; Yu, J.; Zheng, H. Helmholtz-resonator quartz-enhanced photoacoustic spectroscopy. Opt. Lett. 2023, 48, 1678–1681. [Google Scholar] [CrossRef] [PubMed]
  34. Ma, Y.; Hong, Y.; Qiao, S.; Lang, Z.; Liu, X. H-shaped acoustic micro-resonator-based quartz-enhanced photoacoustic spectroscopy. Opt. Lett. 2022, 47, 601–604. [Google Scholar] [CrossRef] [PubMed]
  35. Wei, T.; Zifarelli, A.; Russo, S.D.; Wu, H.; Menduni, G.; Patimisco, P.; Sampaolo, A.; Spagnolo, V.; Dong, L. High and flat spectral responsivity of quartz tuning fork used as infrared photodetector in tunable diode laser spectroscopy. Appl. Phys. Rev. 2021, 8, 041409. [Google Scholar] [CrossRef]
  36. Shang, Z.; Wu, H.; Wang, G.; Cui, R.; Li, B.; Gong, T.; Guo, G.; Qiu, X.; Li, C.; Dong, L. Robust and compact light-induced thermoelastic sensor for atmospheric methane detection based on a vacuum-sealed subminiature tuning fork. Photoacoustics 2025, 42, 100691. [Google Scholar] [CrossRef]
  37. Li, C.; Chen, K.; Zhao, J.; Qi, H.; Zhao, X.; Ma, F.; Han, X.; Guo, M.; An, R. High-sensitivity dynamic analysis of dissolved gas in oil based on differential photoacoustic cell. Opt. Lasers Eng. 2023, 161, 107394. [Google Scholar] [CrossRef]
  38. Shang, Z.; Li, S.; Li, B.; Wu, H.; Sampaolo, A.; Patimisco, P.; Spagnolo, V.; Dong, L. Quartz-enhanced photoacoustic NH3 sensor exploiting a large-prong-spacing quartz tuning fork and an optical fiber amplifier for biomedical applications. Photoacoustics 2022, 26, 100363. [Google Scholar] [CrossRef]
  39. Qiao, S.; He, Y.; Sun, H.; Patimisco, P.; Sampaolo, A.; Spagnolo, V.; Ma, Y. Ultra-highly sensitive dual gases detection based on photoacoustic spectroscopy by exploiting a long-wave, high-power, wide-tunable, single-longitudinal-mode solid-state laser. Light Sci. Appl. 2024, 13, 100. [Google Scholar] [CrossRef]
  40. Miklos, A. Acoustic Aspects of Photoacoustic Signal Generation and Detection in Gases. Int. J. Thermophys. 2015, 36, 2285–2317. [Google Scholar] [CrossRef]
Figure 1. Absorption spectrums of C2H2, H2O, CO2, CO, and CH4 in the range of 1520 nm to 1570 nm (a) and 1531 nm to 1532 nm (b), respectively.
Photonics 12 00713 g001
Figure 2. Schematic structure of the design high-power QEPAS system for dissolved gas in oil.
Photonics 12 00713 g002
Figure 3. The 2f signal measured using the QEPAS system with a bare QTF, a QTF coupled with an AmR, and a QTF with an AmR and EDFA.
Photonics 12 00713 g003
Figure 4. Relationship between the QEPAS signal of a 500 ppm C2H2/N2 mixture and the laser modulation depth at pressures ranging from 100 Torr to 600 Torr.
Photonics 12 00713 g004
Figure 5. (a) QEPAS signal amplitude as a function of time for C2H2 concentration ranging from 0 to 1000 ppm. (b) Same data averaged and plotted as a function of C2H2 concentration.
Photonics 12 00713 g005
Figure 6. Variation in measured C2H2 concentration with degassing time.
Photonics 12 00713 g006
Disclaimer/Publisher’s Note: The statements, opinions and data contained in all publications are solely those of the individual author(s) and contributor(s) and not of MDPI and/or the editor(s). MDPI and/or the editor(s) disclaim responsibility for any injury to people or property resulting from any ideas, methods, instructions or products referred to in the content.

