Article

Raman Hyperspectroscopy and Chemometric Analysis of Blood Serum for Diagnosing Celiac Disease in Adults

by
Entesar Al-Hetlani
1,*,
Lamyaa M. Almehmadi
2,3 and
Igor K. Lednev
2,3,*
1
Chemistry Department, Faculty of Science, Kuwait University, P.O. Box 5969, Safat 13060, Kuwait
2
Chemistry Department, University at Albany, State University of New York, 1400 Washington Ave, Albany, NY 12222, USA
3
The RNA Institute, College of Arts and Science, University at Albany, State University of New York, 1400 Washington Avenue, Albany, NY 12222, USA
*
Authors to whom correspondence should be addressed.
Photonics 2025, 12(6), 553; https://doi.org/10.3390/photonics12060553
Submission received: 20 March 2025 / Revised: 21 May 2025 / Accepted: 21 May 2025 / Published: 30 May 2025
(This article belongs to the Special Issue Biomedical Photonics)

Abstract

:
Celiac disease (CD) is a chronic autoimmune disorder triggered by an abnormal immune response to gluten, a protein found in wheat, barley, and rye. Current diagnostic methods, including serological assessments and biopsies, can be challenging due to the disease’s heterogeneous nature, creating a need for a reliable, noninvasive diagnostic approach. Here, in this study, we aimed to extend the Raman peak area ratios approach to the adult population. However, our findings indicate no significant differences in Raman peak area ratios between healthy and diseased adults based on blood serum samples. Nevertheless, genetic algorithm combined with partial least squares discriminant analysis (GA-PLS-DA) allowed differentiation with 92% sensitivity and 96% specificity at the spectral level in external validation. Receiver operating characteristic (ROC) analysis showed 100% classification at the donor level in external validation. These results demonstrate further that Raman spectroscopy, combined with chemometrics, is a promising, noninvasive tool for CD diagnosis.

1. Introduction

Celiac disease (CD) is a lifelong leading autoimmune disorder characterized by food intolerance triggered by gluten, a protein present in wheat, barley, and rye [1]. About 1 in 70 to 1 in 300 individuals are affected by this disease, and the only treatment is a strict lifelong gluten-free diet [2]. CD is marked by damage to the villi in the small intestine, leading to conditions such as osteoporosis, small intestine cancers, ulcerative jejunitis, and enteritis, which can result in severe malnutrition [3].
Although CD has been recognized for more than 70 years [4], diagnosis remains a challenge for physicians. Some patients experience symptoms such as diarrhea, iron deficiency, irritable bowel syndrome, and weight loss due to malabsorption, while others lack such symptoms [4,5]. Current diagnosis of CD relies on initial screening using serological assessments to detect elevated levels of Immunoglobulin A tissue transglutaminase antibodies (IgA tTGs) and positive results for Immunoglobulin A endomysial antibodies (IgA EMAs) [6]. The most sensitive tests are IgA class antibodies, including those for anti-tissue transglutaminase, antiendomysial antibodies, and antigliadin antibodies, though the last is now considered less reliable, except for children under 18 months. Endomysial IgA antibodies are the gold standard due to their high specificity, with over 90% sensitivity for both endomysial and tissue transglutaminase antibodies [7,8]. Total IgA levels should be assessed, and if necessary, IgG anti-tissue transglutaminase antibody testing should be conducted, as selective IgA deficiency, which is more prevalent in patients with CD, can lead to negative IgA antibody test results [9]. A new rapid test utilizing fingertip blood samples shows promise for both screening and ongoing nutritional monitoring, although these tests may not perform as effectively in clinical settings as they do in research environments [10]. Additionally, heightened screening for CD in individuals with a family history of the disorder, as well as in those with Down syndrome, Turner syndrome, or type 1 diabetes (conditions associated with CD), has led to the identification of several cases [11]. Individuals with CD are also at an increased risk of developing autoimmune conditions compared to the general population [12]. Biopsy confirmation is crucial due to the lifelong implications of CD and the necessity for a strict gluten-free diet. Small intestine biopsy is the standard diagnostic method for CD and should be performed when there is significant clinical doubt, regardless of serologic test results [6,13]. To address the heterogeneous nature of the disease and the challenges in assessing villous morphology, at least four to six endoscopic biopsy specimens should be obtained from the duodenum. Diagnostic challenges include the overinterpretation of villous atrophy in poorly oriented biopsy samples and inadequate sampling in patients with patchy lesions [14]. Accurate interpretation of biopsy results relies on skilled and experienced endoscopists and pathologists [13]. Thus, there is a pressing need for a single, reliable, and noninvasive test for unequivocal screening of CD. Prompt and effective differentiation between healthy individuals and those with celiac disease is crucial for early diagnosis and timely treatment.
Raman spectroscopy, particularly Raman hyperspectroscopy, is a powerful and nondestructive analytical technique that relies on inelastic light scattering by molecules when exposed to monochromatic radiation. This method has been employed in disease diagnosis through the analysis of various tissue and body fluid samples, demonstrating significant flexibility and versatility [15,16,17,18,19,20]. Raman hyperspectroscopy, combined with statistical analysis, is a method that captures a series of Raman spectra from a sample to evaluate their variability. This approach generates a three-dimensional data cube (x, y, λ) that integrates both spectral and spatial information. In this data cube, the x and y dimensions represent spatial coordinates, while λ corresponds to the Raman spectrum collected at each specific coordinate [21]. By examining small regions within a sample, it is possible to detect biochemical components that may exist in low overall concentrations but are more abundant at specific locations. The detection of these components can help differentiate various conditions and serve as potential spectroscopic biomarkers [21,22]. A significant advantage of Raman hyperspectroscopy is its ability to simultaneously detect the contribution from multiple biomarkers, which can be instrumental in diagnostic and classification applications [16,20]. Numerous studies have underscored the effectiveness of this innovative approach for medical diagnostics [16,21].
The diagnosis of adult CD based on blood plasma samples using Raman spectroscopy combined with deep learning has recently been reported with a maximum of 95% accuracy [23]. Additionally, a Raman peak area ratios technique has been shown to effectively distinguish blood serum samples collected from pediatric CD patients versus pediatric healthy controls, employing a straightforward method while achieving 98% accuracy [24]. Here, we investigated the applicability of the Raman peak area ratio as a marker for CD in blood serum samples collected from the adult population. However, our results show no significant differences in peak area ratios between healthy and diseased adults, preventing the establishment of a diagnostic threshold. Therefore, we analyzed the Raman spectra using the chemometric approach. Specifically, genetic algorithm combined with partial least squares discriminant analysis (GA-PLS-DA) allowed accurate differentiation between healthy and diseased adults based on our dataset. The developed model achieved 92% sensitivity and 96% specificity in external validation, as well as 93% sensitivity and 93% specificity in internal cross-validation. Receiver operating characteristic (ROC) analysis showed 100% classification at the donor level in external validation. These results suggest that the combination of Raman spectroscopy and chemometrics offers an efficient and noninvasive approach for diagnosing CD.

2. Materials and Methods

2.1. Blood Serum Samples

Blood serum samples used in this work were collected from subjects of different genders, age groups (22–75 years), races (Caucasian and African), and ethnicities (Native American, African American, and Hispanic). A total of 10 healthy controls (n = 10) and 7 celiac patients (n = 7) were utilized in this study without serum samples filtration (Bioreclamation, Inc., Hicksville, NY, USA). The samples were stored at −80 °C.

2.2. Sample Preparation and Raman Spectral Collection Method

Prior to Raman measurements, the samples were brought to room temperature and vortexed, and then 10 µL of each sample was deposited on a microscope slide covered with aluminum adhesive tape (Nashua tape, Home Depot). The samples were left to dry overnight at room temperature before the analysis to ensure consistency with our previous works [25].
Blood serum samples were analyzed using a Renishaw inVia confocal Raman spectrometer equipped with a research-grade Leica microscope; all measurements were collected using a 50× long-range objective. The spectra were recorded in the range of 400–1800 cm−1 using 785 nm excitation wavelengths with a diode laser using WiRe 3.2 software. The 785 nm laser power was 50% with a 30 s accumulation time. All measurements were carried out via automatic mapping with the aid of an automatic stage. An area of 3 × 3 mm was scanned from 50 adjacent spots to account for the inhomogeneity of the samples. The wavenumber calibration was set by reference to the 520 cm−1 vibrational band of a silicon wafer. The collected spectra were processed with MATLAB R2022b; preprocessing included elimination of spectra with low signal-to-noise ratios and cosmic rays. All spectra were baseline corrected, normalized by total area, and smoothed.

2.3. Statistical Analysis

Partial least squares discriminant analysis (PLS-DA), a supervised statistical method, was used for Raman spectral analysis using the PLS_Toolbox (Eigenvector Research, Inc., Manson, WA, USA). PLS-DA was used to differentiate healthy from diseased classes. The PLS-DA model developed in this study was built using blood serum spectra collected from ten donors (five healthy and five CD). Six latent variables (LVs) were used, which accounted for maximum covariance. The sensitivity and specificity rates of the model were tested using cross-validation based on the venetian blind method. The model prediction performance was then tested using samples from donors not previously used for calibrating the model in a process called external validation.
Genetic algorithm (GA) was implemented to optimize the selection of key spectral regions that contribute most significantly to distinguishing between two data classes (Healthy and CD). Through an iterative learning process, GA identifies spectral variables that yield the lowest prediction error rates, ensuring that only the most informative features are retained while removing irrelevant data and noise. These selected spectral features were then mapped to their corresponding vibrational modes based on the literature references, providing insights into the biochemical basis responsible for spectral differentiation.

3. Results and Discussion

Invasive and time-consuming testing for celiac disease (CD), along with common symptoms, necessitates the development of a noninvasive test for CD diagnostics. It is often the case that celiac disease is diagnosed or begins during childhood. However, celiac disease patients are also being diagnosed with this disease during their adulthood. The use of Raman spectroscopy for celiac disease diagnostics in children has been reported, but not for adults. To close this gap, in this proof-of-concept study, blood serum samples of healthy and CD adult donors were analyzed using Raman hyperspectral analysis combined with statistical analysis. Blood serum is one of the most common body fluids collected for medical testing. It is a common biological sample used for medical testing in clinics and has been used for medical diagnostic purposes using Raman spectroscopy [26,27,28,29].

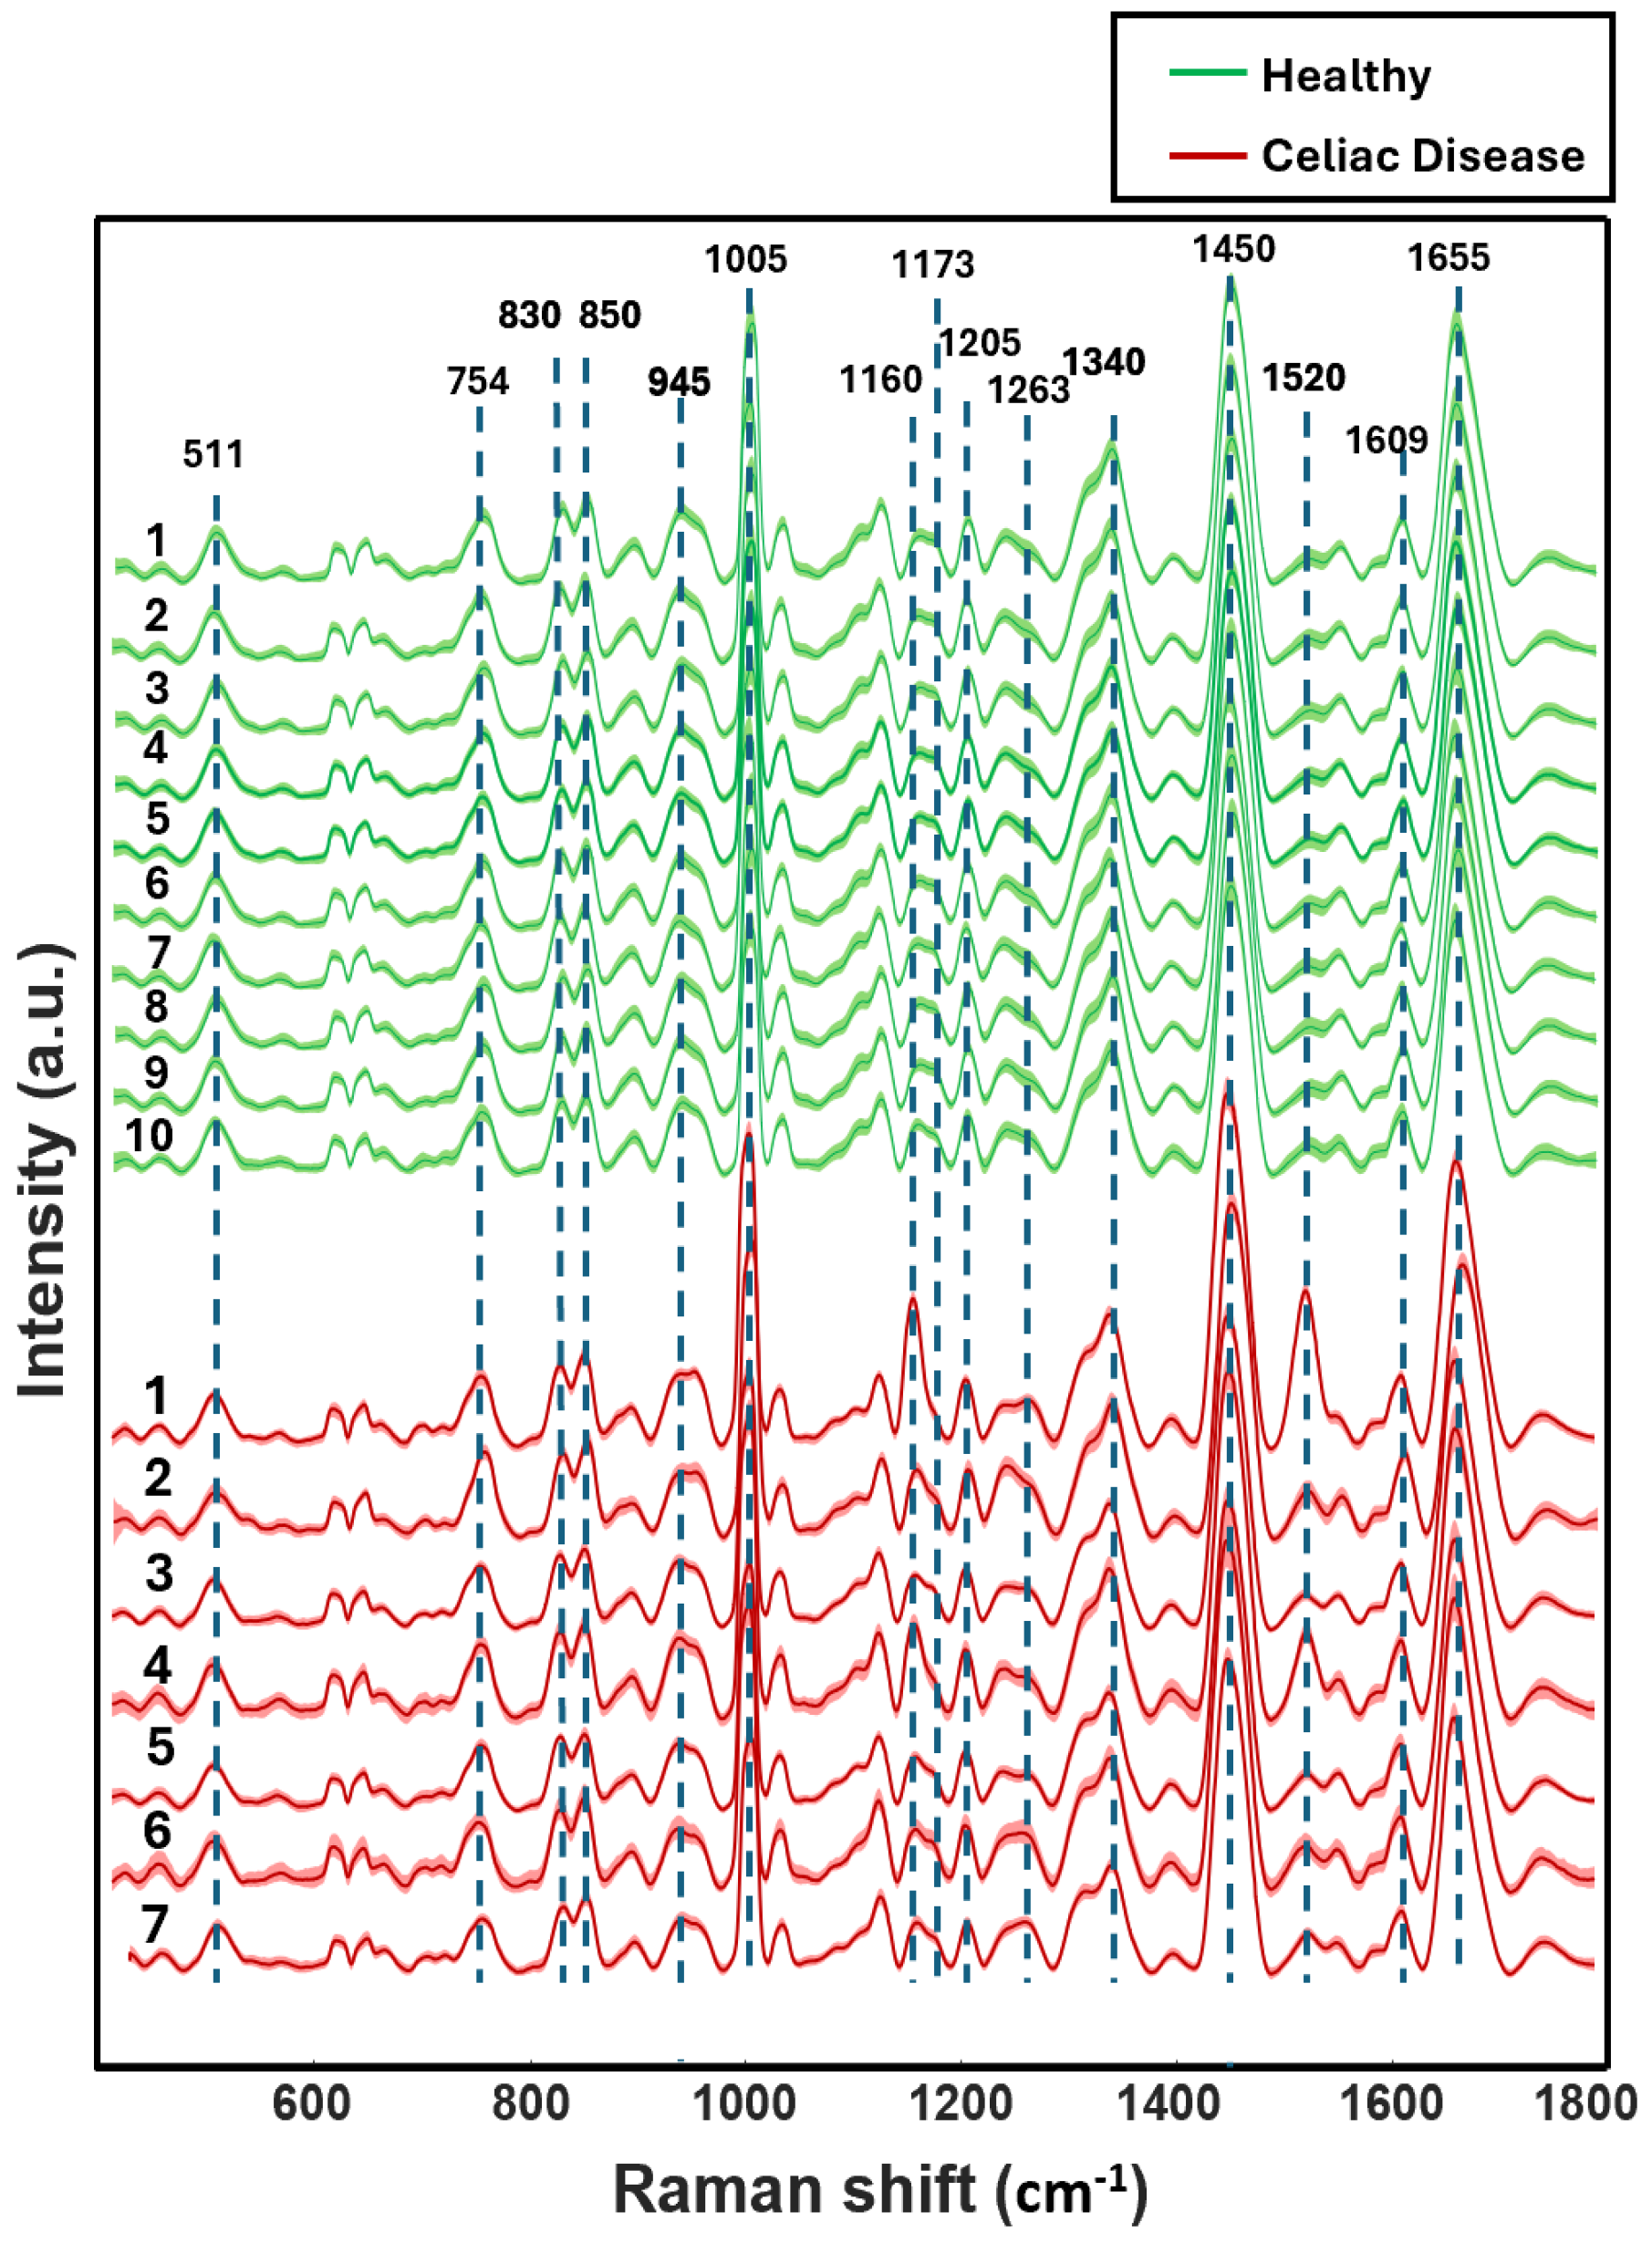
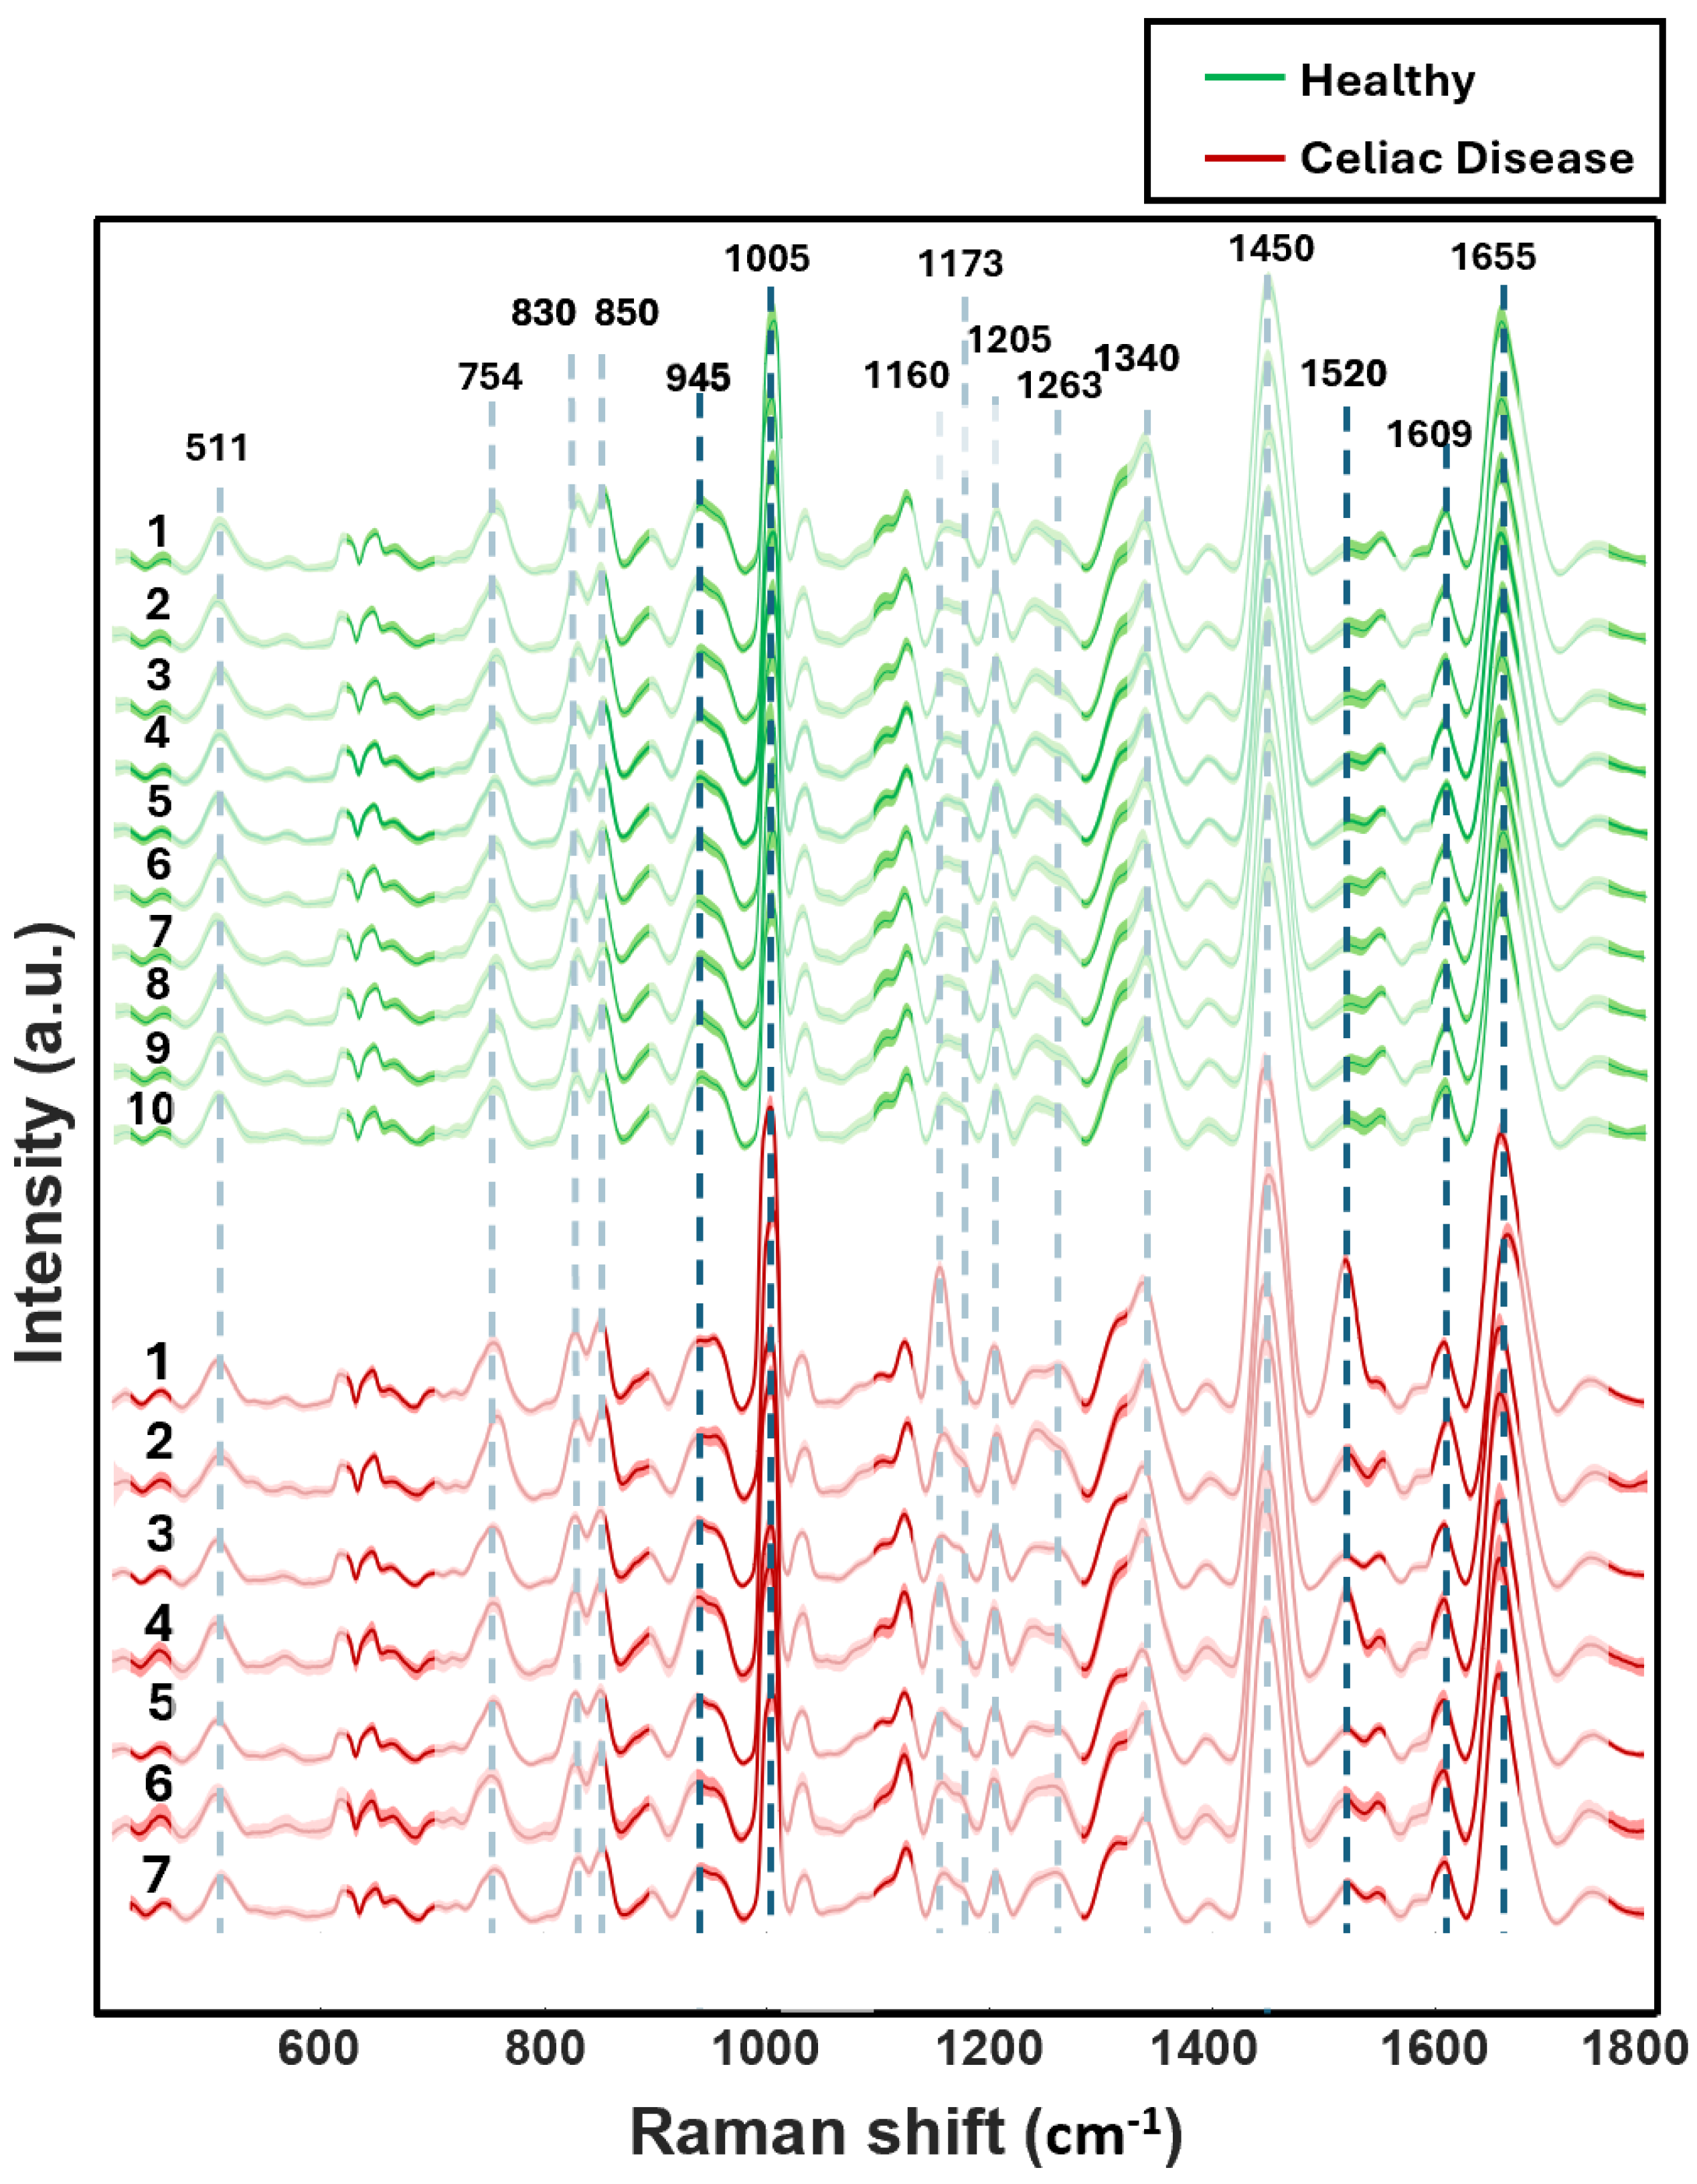
3.1. Visual Analysis of Blood Serum Samples of Healthy and Celiac Disease Donors

Initially, Raman spectra of serum samples were collected from 17 donors via automatic mapping. In total, 38–50 spectra were collected from each donor’s serum sample to obtain representative information on the whole biochemical composition to determine spectral biomarkers distinguishing healthy versus diseased donors. Raman spectra of 10 healthy donors and seven celiac disease donors were collected, and averaged spectra of individual donors of both classes are shown in Figure 1. Tentative band assignment of the blood serum samples is in Table 1.
A visual inspection of the Raman spectra reveals greater heterogeneity among CD patients compared to healthy donors. Notably, Raman bands at 1520 cm⁻1 and 1160 cm⁻1, corresponding to carotenoids [35], exhibit markedly higher intensity in certain CD donors, such as CD donor 1 and CD donor 4, while others display spectral features at the same wavenumbers similar to healthy individuals (CD Donor 3). This variability, which has not been extensively explored in previous Raman spectroscopy studies of serum samples, suggests underlying biochemical differences among CD patients. Given that blood serum composition dynamically reflects dietary intake and gastrointestinal health, the metabolic disruptions characteristic of CD, such as impaired digestion, absorption, and nutrient metabolism, may contribute to these spectral variations [36,37]. Studies have shown that individuals with CD often have lower levels of ferritin, hemoglobin, cobalamin, and folic acid and higher levels of transferrin, alanine transaminase (ALAT), and alkaline phosphate [38]. These deficiencies are indicative of malabsorption, a hallmark of CD [38]. In addition, studies on blood serum samples of CD patients utilizing Raman spectroscopy, HPLC, and mass spectrometry have identified differences in lipid concentrations, including cholesterol [39], suggesting abnormal lipid metabolism in CD patients [5,24,37]. This is linked to malabsorption of fats in the intestines [23]. Changes in the expression of proteins and nucleic acids have been observed in the blood serum of CD patients, which can be detected through Raman spectroscopy [23].
The observed heterogeneity may stem from multiple factors, including differences in gluten exposure, dietary adherence to a gluten-free diet, and disease progression [5]. Variability in gluten consumption influences metabolic pathways, leading to fluctuations in specific metabolites detectable in serum [5]. Moreover, adherence to a gluten-free diet can partially restore metabolic functions, though residual effects of the disease, including alterations in gut microbiota, persist and further impact biochemical profiles [5,40]. These findings underscore the complexity of CD and highlight the potential of Raman spectroscopy as a tool for assessing patient-specific biochemical changes rather than focusing on a single metabolite, such as carotenoids. Due to this heterogeneity and complexity, chemometrics was exploited to generate a statistical model to differentiate between healthy and celiac donors. Chemometrics combines data from multiple biomarkers to create a spectral ‘fingerprint’ of the disease using complex Raman hyperspectral datasets.

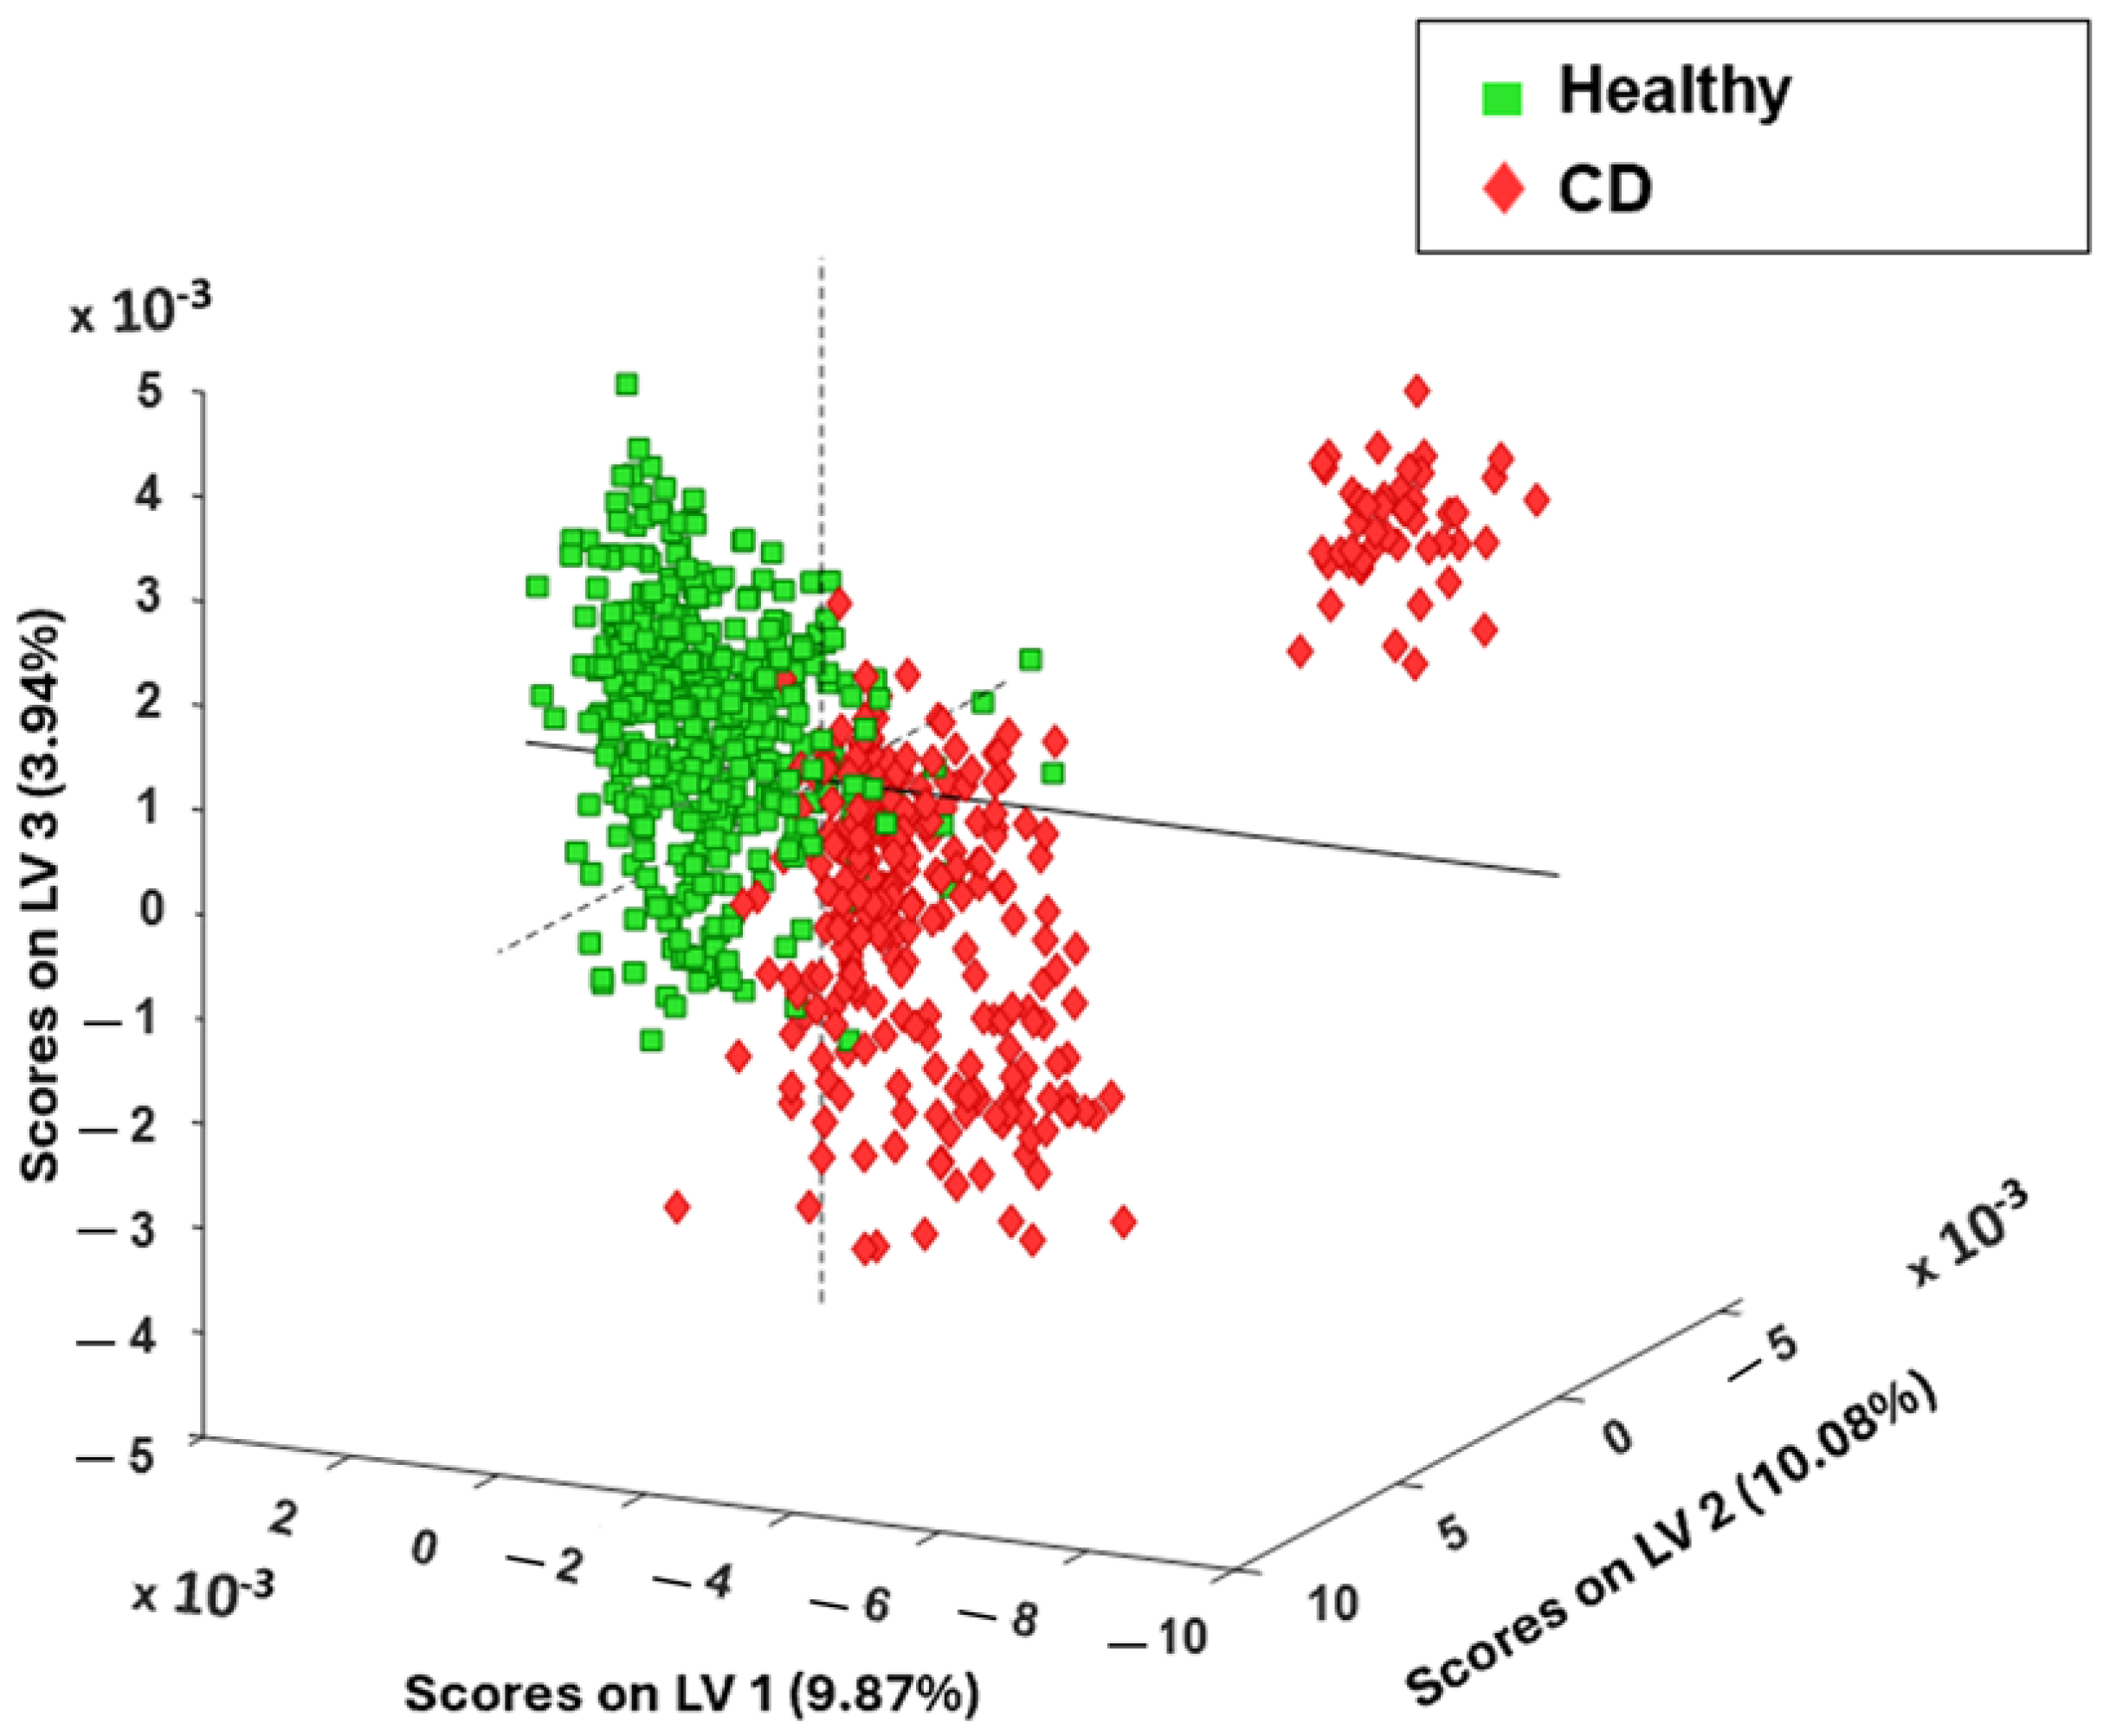
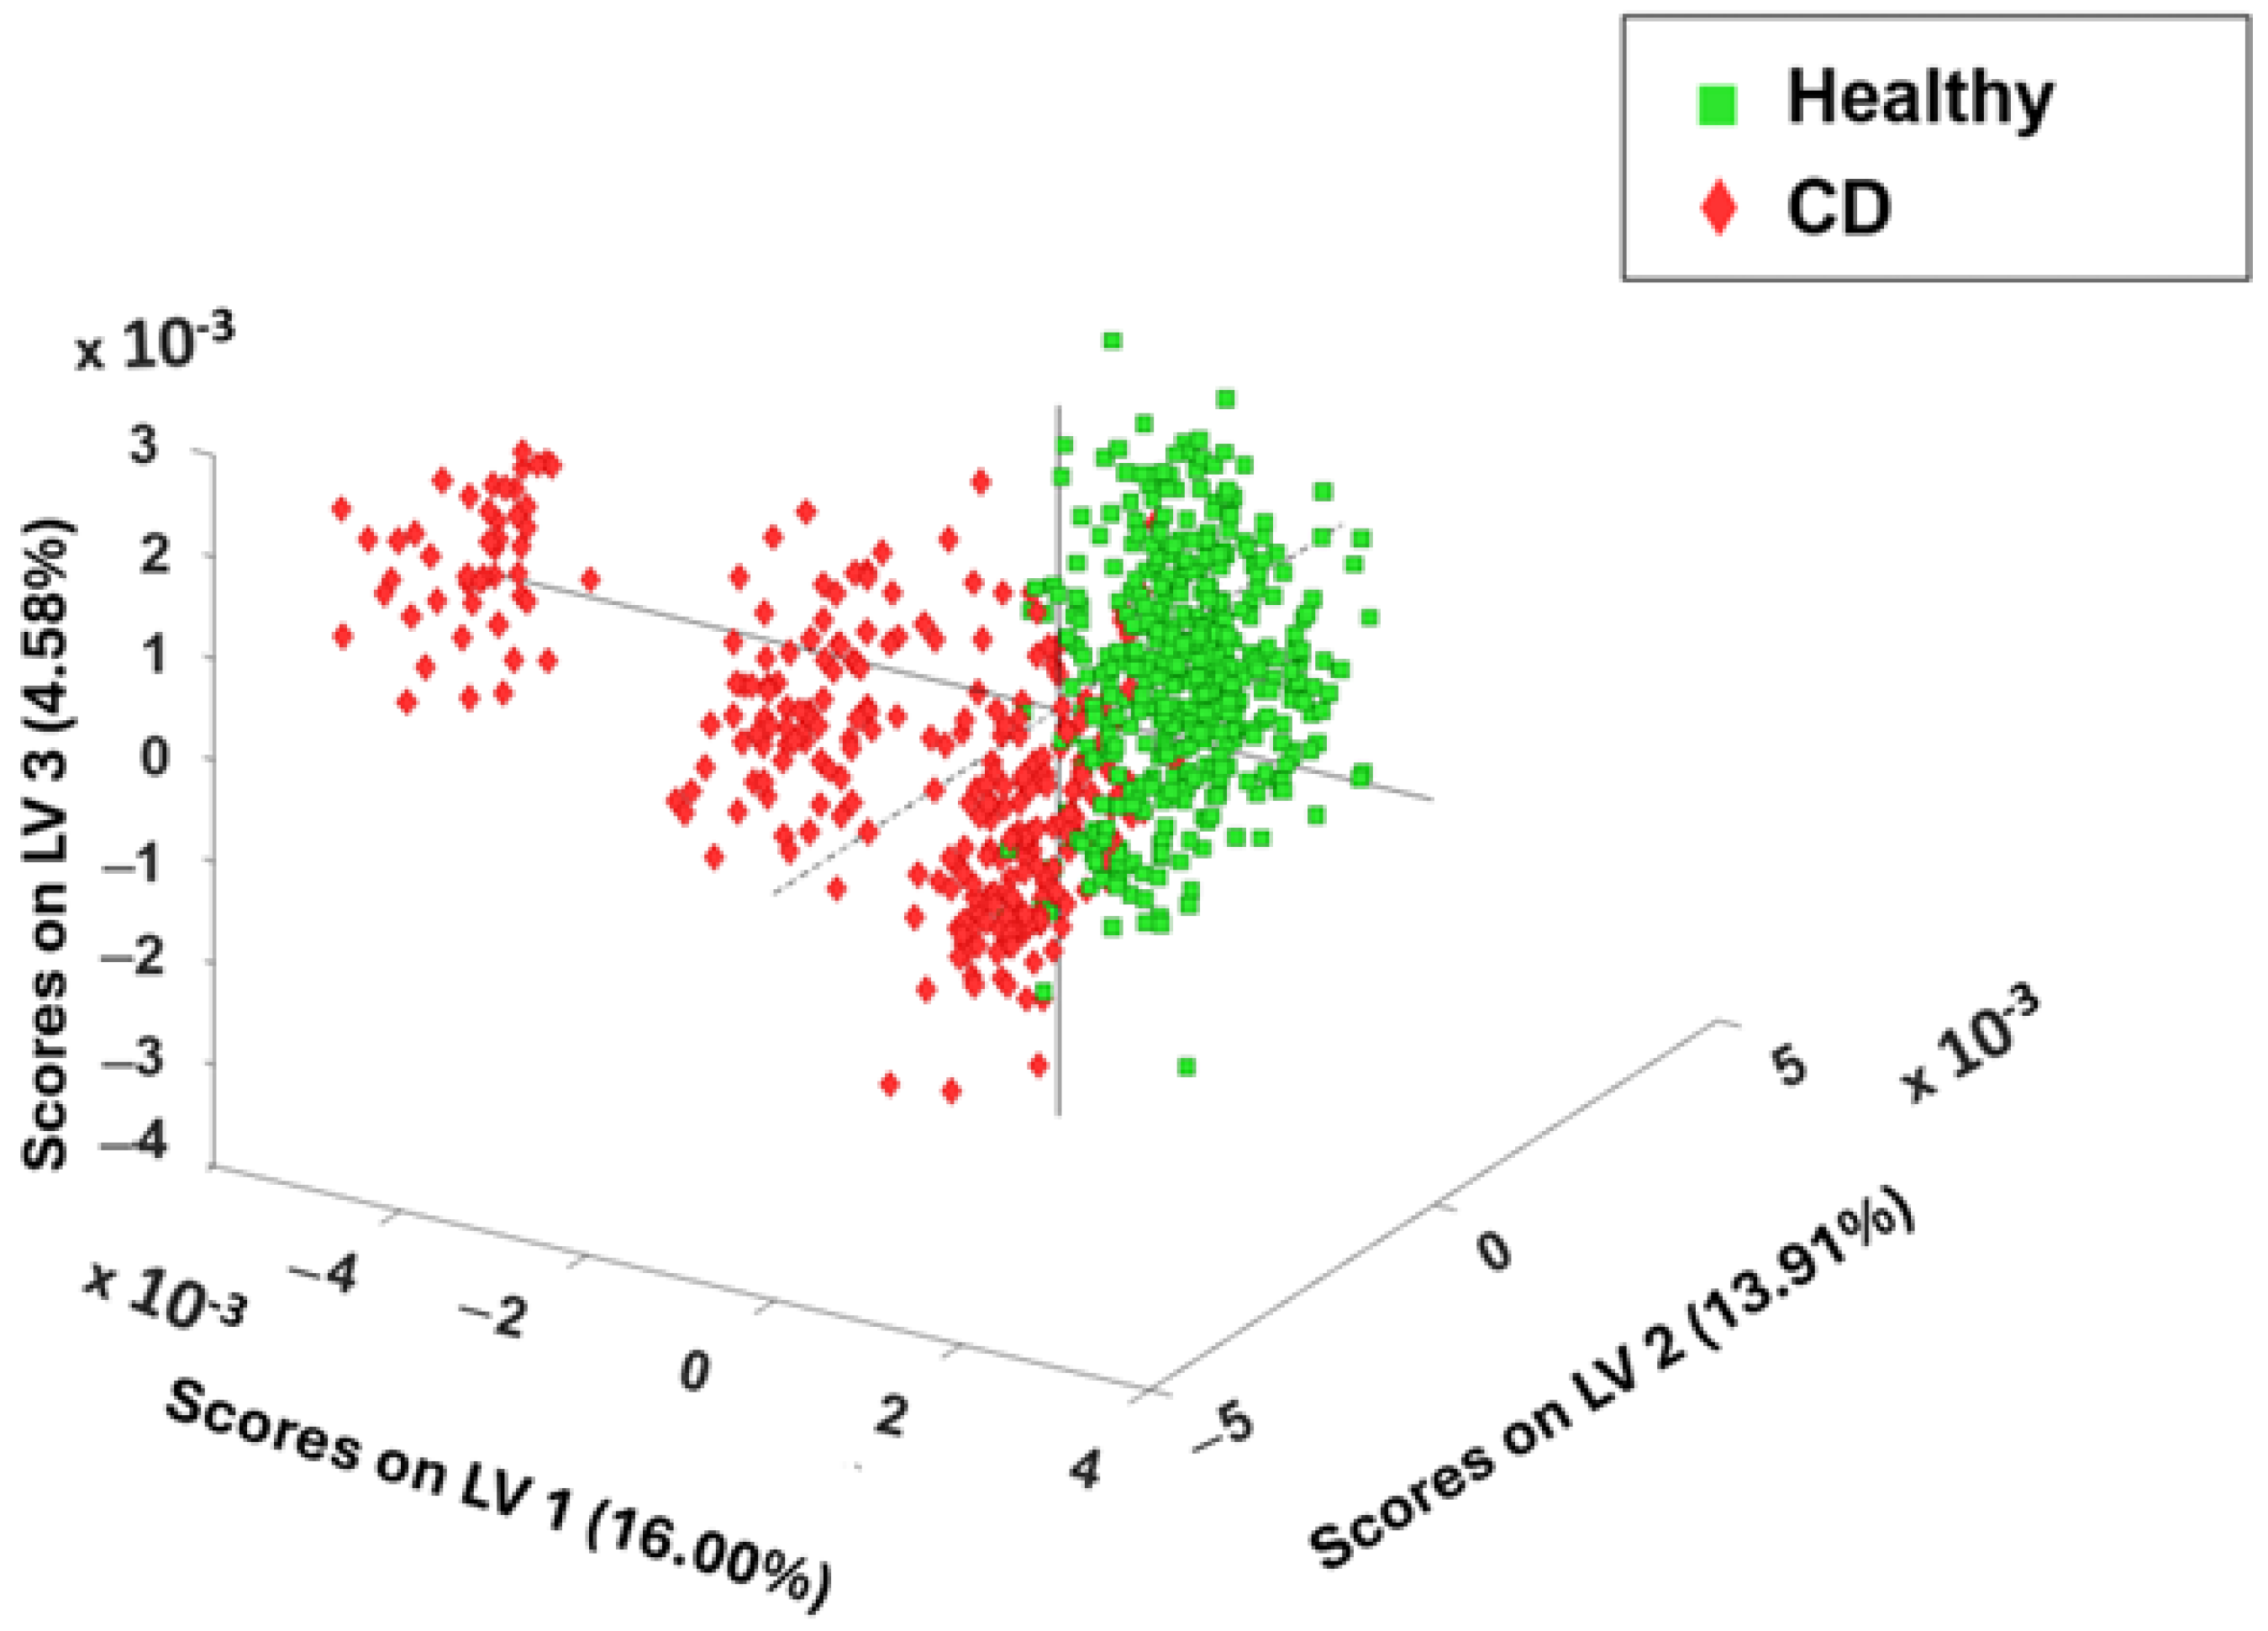
3.2. Chemometric Spectral Analysis of Blood Serum Samples Collected from Healthy and Celiac Disease Samples

We investigated the Raman peak area ratios reported by Acri, et al. of A1450/A1003 and A1650/A1003 as potential markers for CD [24] to differentiate CD from healthy adult donors. However, our results revealed no significant differences in peak area ratios between healthy and diseased individuals (Figure S1), preventing the establishment of a definitive diagnostic threshold. In addition, the ratios between Raman bands associated with lipids to proteins and carotenoids to proteins were investigated (Figure S2), which showed overlapping values between groups and thus cannot be used alone for diagnosis. To further explore potential chemometric approaches to diagnose CD in adults, we utilized a different approach.
Serum samples collected from ten donors (five healthy and five celiac disease) were used as a calibration set to construct a partial least squares discriminant analysis (PLS-DA) prediction model. An external validation dataset based on the spectra of the remaining donors (five healthy and two celiac disease) were used for validating the accuracy of the PLS-DA model. The dataset of both groups included donors of different genders, ages, races, and ethnicities.
The mean healthy spectrum was compared to the mean CD spectrum, and the difference was assessed using ±2 standard deviations for each group. The resultant difference spectrum was within the standard deviations (Figure S3), indicating that the observed spectral changes are smaller than the existing variability within each group and are not statistically significant. To identify meaningful spectral features that vary between the two classes at the individual spectrum level but are hidden in the mean spectra, advanced statistical analysis is required. These meaningful spectral features that discriminate between both classes are crucial for differentiating between the two data classes.
Six latent variables (LVs) were selected to capture the highest covariance between the spectral data and their assigned classes. Figure 2 is a scores plot, which provides a visual representation of how well the two classes are separated. Each spectrum is assigned a set of scores that determine its classification. The model developed using PLS-DA shows a clear separation between the healthy and celiac disease classes, as depicted in the figure. It is observed that CD Donor 1 spectra are clustered together with the CD donors spectra yet appear distinct. From visual inspection of the averaged CD donor 1 spectra in Figure 1, it appears that Raman bands associated with some metabolic components, such as carotenoids, are more intense compared to other donors. This difference could be due to inter-individual metabolic or nutritional differences. Nonetheless, the CD 1 donor spectra were not closeted with healthy donors spectra. Further statistical analysis conducted for the classification of all donors based on their Raman spectra are discussed below.
The prediction results at the individual spectral levels of all donors in the calibration dataset are presented in the confusion matrix in Table 2, in which each spectrum is classified as either healthy or diseased. The assignments of the spectra are then compared to their actual classification. The result of the cross-validation of the PLS-DA model using the venetian blinds method resulted in 95% sensitivity and 95% specificity for training the algorithm using the calibration dataset. External validation was conducted using spectral data obtained from seven donors in the validation dataset. External validation is conducted to test the classification model performance using blood serum Raman spectra of new donors not used for training the model. A total of 282 spectra from these seven samples were analyzed using the PLS-DA algorithm for external validation, with class assignments predicted for each spectrum (Table 2). The sensitivity and specificity of the classification were also evaluated, yielding 79% sensitivity and 94% specificity for spectral-level predictions in the external validation process.
To enhance the prediction accuracy of the PLS-DA model, genetic algorithm (GA) was applied to the Raman spectral dataset. To identify spectral regions distinguishing the healthy from the CD spectral dataset, GA was used to select the most meaningful spectral regions of the blood serum spectra for differentiating the two classes. In GA, spectral features of each dataset that contribute to the most discrimination power toward separating classes of data are identified. Plots of latent variable 1 and latent variable 2 loadings used for the GA-PLS-DA prediction model, based on the most influential Raman spectral regions for discriminating between healthy and CD donors spectra, are shown in Figure S4. As a result, this method also provides insights into the biochemical changes that serve as spectral biomarkers. Figure 3 shows spectral regions selected by genetic algorithm that highlight contributions from several biochemical components, including phenylalanine/Carotenoids, and protein (Amide I a-helix), and phospholipids.
The GA-PLS-DA scores plot also shows separation between the two classes (Figure 4). However, the GA-PLS-DA model built using only the spectral regions identified through GA analysis shows improved performance, with 93% sensitivity and 93% specificity for internal validation and 92% sensitivity and 96% specificity for external validation based on two LVs, as indicated in Table 2.

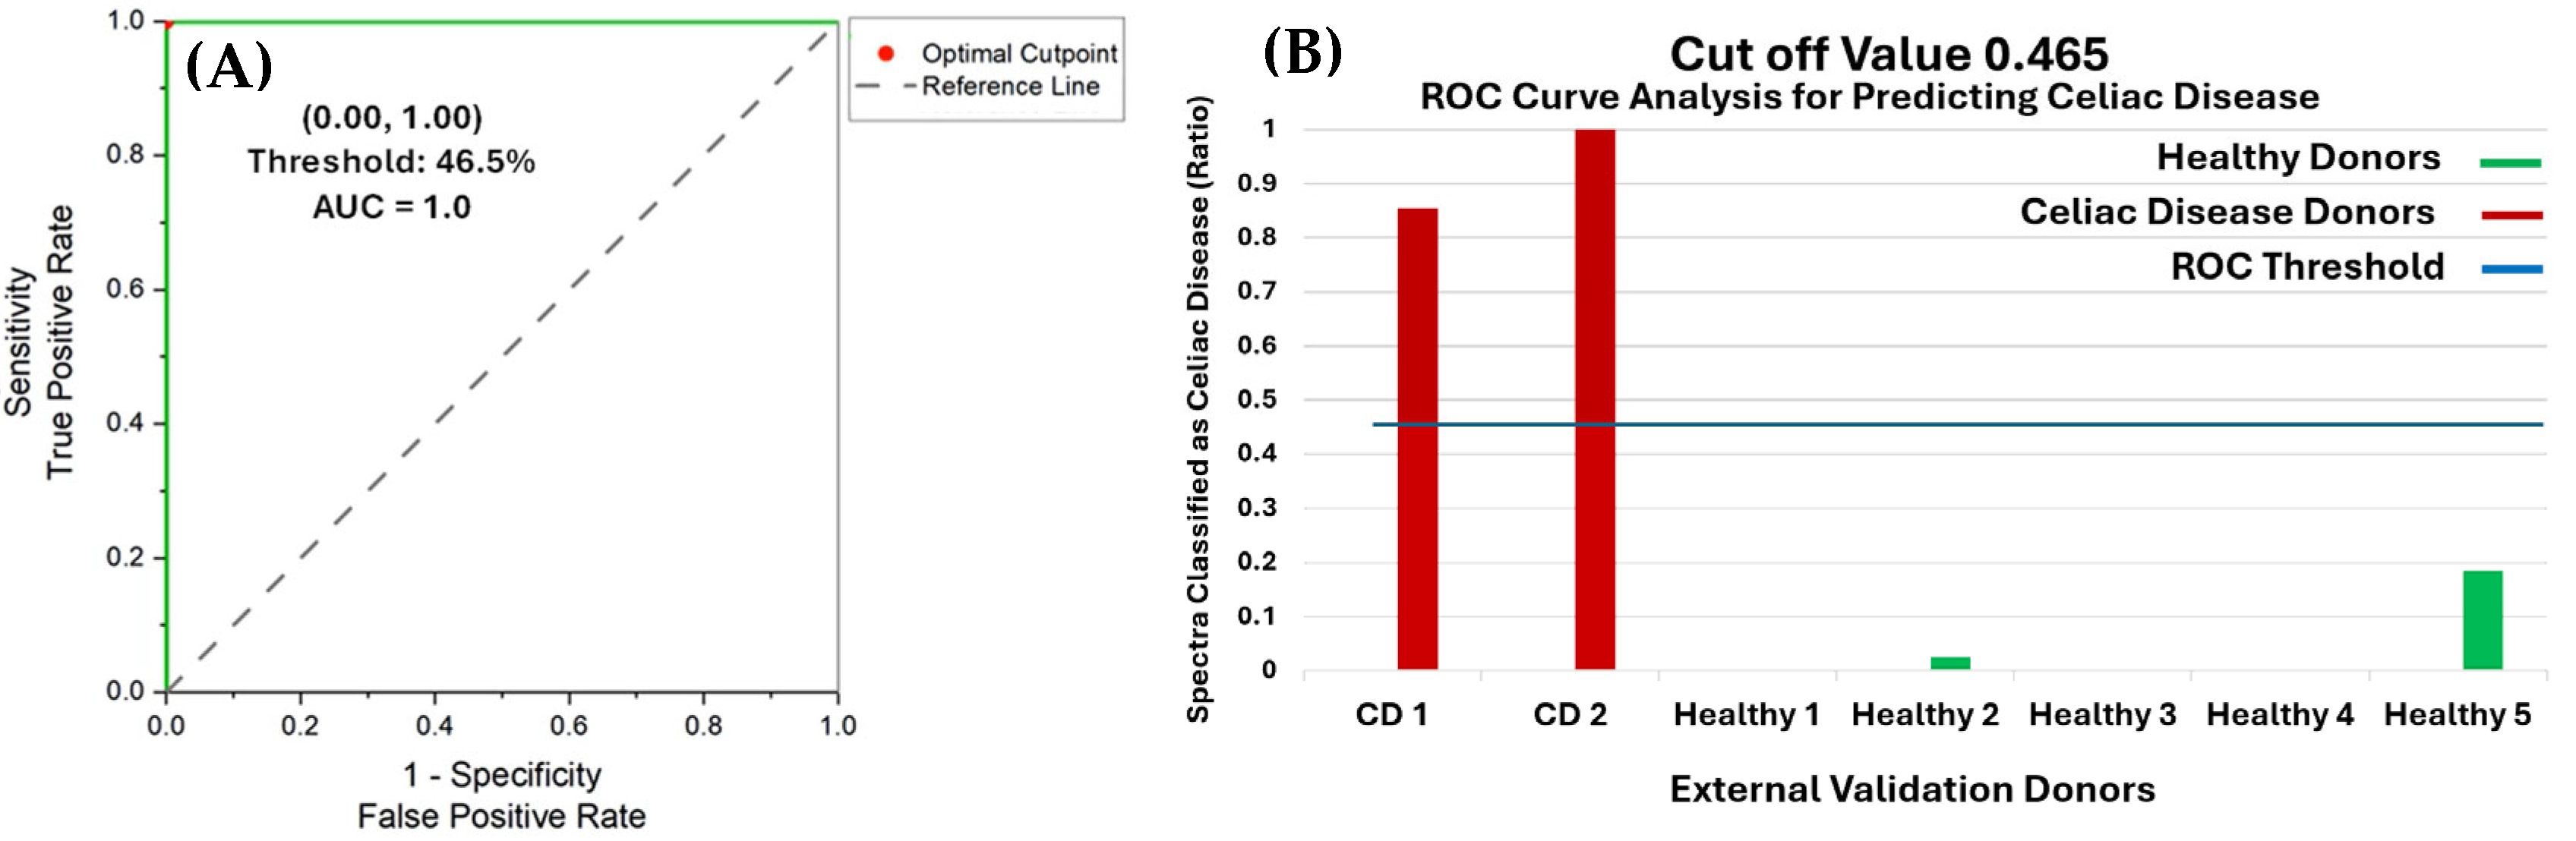
3.3. Receiver Operating Characteristic Curve Analysis of External Validation Results

The GA-PLS-DA algorithm produced classification predictions for each individual spectrum obtained from the seven donors. Given the inherent heterogeneity of dried blood serum traces, each spectrum is expected to exhibit some deviation from the mean [41]. Additionally, certain blood serum components are shared between healthy and CD donors. Consequently, some spectra from one class may be misclassified as belonging to the other due to the natural overlap in biochemical composition.
To determine the optimal threshold for classifying donors based on spectral-level predictions, a receiver operating characteristic (ROC) curve was used. ROC curves evaluate binary classifier performance by plotting the true positive rate (sensitivity) against the false positive rate (1-specificity), with each point representing a potential discrimination threshold. In this study, cross-validation (the training dataset) was used to generate the ROC curve for the GA-PLS-DA model, shown in Figure 5A. The optimal threshold for donor classification occurs at the point (0.00, 1.00), which corresponds to a cutoff value of 0.465 (Table S1). This means that if the ratio of 0.465 or more of an individual donor’s spectra are classified as CD, the overall prediction for that donor will be as a member of the CD class.
The ROC curve-derived threshold of 0.465 was applied to spectral-level predictions to generate donor-level classifications for the external validation, as illustrated in Figure 5B. The ratio of spectra classified as belonging to the CD class is represented by the bar height, with the 0.465 cutoff applied to each of the seven donors. CD donors 1 and 2 exceeded this threshold, leading to their classification as CD, whereas all healthy donors 1–5 fell below the threshold and were classified as healthy. The ratio of spectra classified as CD for each donor is in Table S2 and shows no spectra were classified as CD for Healthy donors 1, 3, and 4. Comparing these donor-level predictions to the true diagnosis confirmed that all seven donors were correctly identified, achieving 100% accuracy in external validation. These results demonstrate the model’s robustness and its potential for accurate diagnoses of new data that are not used in training the original GA-PLS-DA model.
In our previous study, we investigated the analysis of individual red blood cells (RBCs) [42] using Raman spectroscopy followed by chemometric analysis for diagnosing CD. For RBC analysis, the PLS-DA model was used to establish an optimal cutoff threshold of 70%. Results from internal cross-validation demonstrated 87.5% sensitivity and specificity, with an overall area under the curve (AUC) of 0.93. Using this threshold, all donors in the external validation set were accurately classified, achieving 100% classification accuracy. In this study, we utilized blood serum samples as a matrix for CD diagnosis; the GA-PLS-DA model achieved 92% sensitivity and 96% specificity in external validation, along with 93% sensitivity and 93% specificity during internal cross-validation, resulting in an overall AUC of 1.00. Thus, utilizing blood serum as a matrix for CD diagnosis demonstrated higher specificity compared to RBC analysis. Both matrices are of medical importance: serum would be preferred for metabolic panels, while RBCs would be necessary for hematological evaluations. Each has its distinct role and advantages in medical diagnostics.

4. Conclusions

Celiac disease (CD) is a chronic autoimmune disorder affecting approximately 1 in 70 to 1 in 300 individuals. Current diagnostic methods face challenges due to the disease’s heterogenous nature, emphasizing the need for a reliable and noninvasive diagnostic approach. Raman spectroscopy presents a complementary tool for diagnosing CD in a simple and noninvasive manner. Here, we developed a simple binary classification model based on genetic algorithm and partial least squares discriminant analysis (GA-PLS-DA), which successfully discriminated between healthy and diseased samples. The model achieved 92% sensitivity and 96% specificity in external validation, as well as 93% sensitivity and 93% specificity in internal cross-validation. Receiver operating characteristic (ROC) curve analysis was conducted to assess the model’s performance in diagnosing CD at the donor level, achieving 100% accuracy on external validation datasets. Compared to the current standard testing methods, the proof-of-concept study presented here offers a more efficient, accurate, noninvasive way to diagnose celiac disease in adults, potentially facilitating prompt clinical decision-making.

Supplementary Materials

The following supporting information can be downloaded at: https://www.mdpi.com/article/10.3390/photonics12060553/s1.

Author Contributions

L.M.A.: Writing—review and editing, Formal analysis. E.A.-H.: Data curation, Data acquisition, Writing—original draft, Funding acquisition. I.K.L.: Project administration, Methodology, Writing—review and editing, Funding acquisition. All authors have read and agreed to the published version of the manuscript.

Funding

Kuwait Foundation for the Advancement of Sciences for funding (KFAS, Grant No. CR19-12SC-01).

Data Availability Statement

Data will be made available on request.

Conflicts of Interest

The authors declare that they have no known competing financial interests or personal relationships that could have appeared to influence the work reported in this paper.

References

  1. Van der Windt, D.A.W.M.; Jellema, P.; Mulder, C.J.; Kneepkens, C.M.F.; van der Horst, H.E. Diagnostic Testing for Celiac Disease Among Patients with Abdominal Symptoms: A Systematic Review. JAMA 2010, 303, 1738–1746. [Google Scholar] [CrossRef] [PubMed]
  2. Shah, S.; Akbari, M.; Vanga, R.; Kelly, C.P.; Hansen, J.; Theethira, T.; Tariq, S.; Dennis, M.; Leffler, D.A. Patient perception of treatment burden is high in celiac disease compared with other common conditions. Am. J. Gastroenterol. 2014, 109, 1304–1311. [Google Scholar] [CrossRef] [PubMed]
  3. Fraser, J.S.; Ciclitira, P.J. Pathogenesis of coeliac disease: Implications for treatment. World J. Gastroenterol. 2001, 7, 772–776. [Google Scholar] [CrossRef]
  4. Kaswala, D.H.; Veeraraghavan, G.; Kelly, C.P.; Leffler, D.A. Celiac Disease: Diagnostic Standards and Dilemmas. Diseases 2015, 3, 86–101. [Google Scholar] [CrossRef]
  5. Vacca, M.; Porrelli, A.; Calabrese, F.M.; Lippolis, T.; Iacobellis, I.; Celano, G.; Pinto, D.; Russo, F.; Giannelli, G.; De Angelis, M. How Metabolomics Provides Novel Insights on Celiac Disease and Gluten-Free Diet: A Narrative Review. Front. Microbiol. 2022, 13, 859467. [Google Scholar] [CrossRef] [PubMed]
  6. Rashid, M.; Lee, J. Serologic testing in celiac disease: Practical guide for clinicians. Can. Fam. Physician 2016, 62, 38–43. [Google Scholar]
  7. Rostom, A.; Dubé, C.; Cranney, A.; Saloojee, N.; Sy, R.; Garritty, C.; Sampson, M.; Zhang, L.; Yazdi, F.; Mamaladze, V. The diagnostic accuracy of serologic tests for celiac disease: A systematic review. Gastroenterology 2005, 128, S38–S46. [Google Scholar] [CrossRef]
  8. Dieterich, W.; Ehnis, T.; Bauer, M.; Donner, P.; Volta, U.; Riecken, E.O.; Schuppan, D. Identification of tissue transglutaminase as the autoantigen of celiac disease. Nat. Med. 1997, 3, 797–801. [Google Scholar] [CrossRef]
  9. Lenhardt, A.; Plebani, A.; Marchetti, F.; Gerarduzzi, T.; Not, T.; Meini, A.; Villanacci, V.; Martelossi, S.; Ventura, A. Role of human-tissue transglutaminase IgG and anti-gliadin IgG antibodies in the diagnosis of coeliac disease in patients with selective immunoglobulin A deficiency. Dig. Liver Dis. 2004, 36, 730–734. [Google Scholar] [CrossRef]
  10. Raivio, T.; Kaukinen, K.; Nemes, E.; Laurila, K.; Collin, P.; Kovács, J.; Mäki, M.; Korponay-Szabó, I.R. Self transglutaminase-based rapid coeliac disease antibody detection by a lateral flow method. Aliment. Pharmacol. Ther. 2006, 24, 147–154. [Google Scholar] [CrossRef]
  11. Fasano, A.; Berti, I.; Gerarduzzi, T.; Not, T.; Colletti, R.B.; Drago, S.; Elitsur, Y.; Green, P.H.; Guandalini, S.; Hill, I.D. Prevalence of celiac disease in at-risk and not-at-risk groups in the United States: A large multicenter study. Arch. Intern. Med. 2003, 163, 286–292. [Google Scholar] [CrossRef] [PubMed]
  12. Bai, D.; Brar, P.; Holleran, S.; Ramakrishnan, R.; Green, P.H. Effect of gender on the manifestations of celiac disease: Evidence for greater malabsorption in men. Scand. J. Gastroenterol. 2005, 40, 183–187. [Google Scholar] [CrossRef]
  13. Green, P.H.R. The Role of Endoscopy in the Diagnosis of Celiac Disease. Gastroenterol. Hepatol. 2014, 10, 522–524. [Google Scholar]
  14. Bonamico, M.; Mariani, P.; Thanasi, E.; Ferri, M.; Nenna, R.; Tiberti, C.; Mora, B.; Mazzilli, M.C.; Magliocca, F.M. Patchy villous atrophy of the duodenum in childhood celiac disease. J. Pediatr. Gastroenterol. Nutr. 2004, 38, 204–207. [Google Scholar] [CrossRef]
  15. Khristoforova, Y.; Bratchenko, L.; Bratchenko, I. Raman-Based Techniques in Medical Applications for Diagnostic Tasks: A Review. Int. J. Mol. Sci. 2023, 24, 15605. [Google Scholar] [CrossRef]
  16. Vyas, B.; Khatiashvili, A.; Galati, L.; Ngo, K.; Gildener-Leapman, N.; Larsen, M.; Lednev, I.K. Raman hyperspectroscopy of saliva and machine learning for Sjögren’s disease diagnostics. Sci. Rep. 2024, 14, 11135. [Google Scholar] [CrossRef]
  17. Hanna, K.; Krzoska, E.; Shaaban, A.M.; Muirhead, D.; Abu-Eid, R.; Speirs, V. Raman spectroscopy: Current applications in breast cancer diagnosis, challenges and future prospects. Br. J. Cancer 2022, 126, 1125–1139. [Google Scholar] [CrossRef] [PubMed]
  18. Yang, W.; Knorr, F.; Latka, I.; Vogt, M.; Hofmann, G.O.; Popp, J.; Schie, I.W. Real-time molecular imaging of near-surface tissue using Raman spectroscopy. Light Sci. Appl. 2022, 11, 90. [Google Scholar] [CrossRef] [PubMed]
  19. Ryzhikova, E.; Ralbovsky, N.M.; Sikirzhytski, V.; Kazakov, O.; Halamkova, L.; Quinn, J.; Zimmerman, E.A.; Lednev, I.K. Raman spectroscopy and machine learning for biomedical applications: Alzheimer’s disease diagnosis based on the analysis of cerebrospinal fluid. Spectrochim. Acta Part A Mol. Biomol. Spectrosc. 2021, 248, 119188. [Google Scholar] [CrossRef]
  20. Ralbovsky, N.M.; Lednev, I.K. Towards development of a novel universal medical diagnostic method: Raman spectroscopy and machine learning. Chem. Soc. Rev. 2020, 49, 7428–7453. [Google Scholar] [CrossRef]
  21. Ralbovsky, N.M.; Dey, P.; Galfano, A.; Dey, B.K.; Lednev, I.K. Diagnosis of a model of Duchenne muscular dystrophy in blood serum of mdx mice using Raman hyperspectroscopy. Sci. Rep. 2020, 10, 11734. [Google Scholar] [CrossRef]
  22. Ryzhikova, E.; Ralbovsky, N.M.; Halámková, L.; Celmins, D.; Malone, P.; Molho, E.; Quinn, J.; Zimmerman, E.A.; Lednev, I.K. Multivariate Statistical Analysis of Surface Enhanced Raman Spectra of Human Serum for Alzheimer’s Disease Diagnosis. Appl. Sci. 2019, 9, 3256. [Google Scholar] [CrossRef]
  23. Shi, T.; Li, J.; Li, N.; Chen, C.; Chen, C.; Chang, C.; Xue, S.; Liu, W.; Reyim, A.M.; Gao, F.; et al. Rapid diagnosis of celiac disease based on plasma Raman spectroscopy combined with deep learning. Sci. Rep. 2024, 14, 15056. [Google Scholar] [CrossRef] [PubMed]
  24. Acri, G.; Romano, C.; Costa, S.; Pellegrino, S.; Testagrossa, B. Raman Spectroscopy Technique: A Non-Invasive Tool in Celiac Disease Diagnosis. Diagnostics 2021, 11, 1277. [Google Scholar] [CrossRef] [PubMed]
  25. Ralbovsky, N.M.; Fitzgerald, G.S.; McNay, E.C.; Lednev, I.K. Towards development of a novel screening method for identifying Alzheimer’s disease risk: Raman spectroscopy of blood serum and machine learning. Spectrochim. Acta Part A Mol. Biomol. Spectrosc. 2021, 254, 119603. [Google Scholar] [CrossRef] [PubMed]
  26. Ryzhikova, E.; Kazakov, O.; Halamkova, L.; Celmins, D.; Malone, P.; Molho, E.; Zimmerman, E.A.; Lednev, I.K. Raman spectroscopy of blood serum for Alzheimer’s disease diagnostics: Specificity relative to other types of dementia. J. Biophotonics 2015, 8, 584–596. [Google Scholar] [CrossRef]
  27. Zhang, A.; Sun, H.; Wang, X. Serum metabolomics as a novel diagnostic approach for disease: A systematic review. Anal. Bioanal. Chem. 2012, 404, 1239–1245. [Google Scholar] [CrossRef]
  28. Vanmassenhove, J.; Vanholder, R.; Nagler, E.; Van Biesen, W. Urinary and serum biomarkers for the diagnosis of acute kidney injury: An in-depth review of the literature. Nephrol. Dial. Transplant. 2013, 28, 254–273. [Google Scholar] [CrossRef]
  29. Schöler, N.; Langer, C.; Döhner, H.; Buske, C.; Kuchenbauer, F. Serum microRNAs as a novel class of biomarkers: A comprehensive review of the literature. Exp. Hematol. 2010, 38, 1126–1130. [Google Scholar] [CrossRef]
  30. Ogruc Ildiz, G.; Bayari, S.; Aksoy, U.M.; Yorguner, N.; Bulut, H.; Yilmaz, S.S.; Halimoglu, G.; Kabuk, H.N.; Yavuz, G.; Fausto, R. Auxiliary differential diagnosis of schizophrenia and phases of bipolar disorder based on the blood serum Raman spectra. J. Raman Spectrosc. 2020, 51, 2233–2244. [Google Scholar] [CrossRef]
  31. Shao, L.; Zhang, A.; Rong, Z.; Wang, C.; Jia, X.; Zhang, K.; Xiao, R.; Wang, S. Fast and non-invasive serum detection technology based on surface-enhanced Raman spectroscopy and multivariate statistical analysis for liver disease. Nanomed. Nanotechnol. Biol. Med. 2018, 14, 451–459. [Google Scholar] [CrossRef] [PubMed]
  32. Atkins, C.G.; Buckley, K.; Blades, M.W.; Turner, R.F.B. Raman Spectroscopy of Blood and Blood Components. Appl. Spectrosc. 2017, 71, 767–793. [Google Scholar] [CrossRef]
  33. Nargis, H.F.; Nawaz, H.; Ditta, A.; Mahmood, T.; Majeed, M.I.; Rashid, N.; Muddassar, M.; Bhatti, H.N.; Saleem, M.; Jilani, K.; et al. Raman spectroscopy of blood plasma samples from breast cancer patients at different stages. Spectrochim. Acta Part A Mol. Biomol. Spectrosc. 2019, 222, 117210. [Google Scholar] [CrossRef]
  34. Saade, J.; Silva, J.d.N.; de Farias, P.M.A.; Lopes, D.F.; Santos, C.T.d.; Farias, B.d.A.; Rodrigues, K.C.; Martin, A.A. Glicemical Analysis of Human Blood Serum Using FT-Raman: A New Approach. Photomed. Laser Surg. 2012, 30, 388–392. [Google Scholar] [CrossRef]
  35. Udensi, J.; Loughman, J.; Loskutova, E.; Byrne, H.J. Raman Spectroscopy of Carotenoid Compounds for Clinical Applications—A Review. Molecules 2022, 27, 9017. [Google Scholar] [CrossRef]
  36. Mędza, A.; Szlagatys-Sidorkiewicz, A. Nutritional Status and Metabolism in Celiac Disease: Narrative Review. J. Clin. Med. 2023, 12, 5107. [Google Scholar] [CrossRef] [PubMed]
  37. Agarwal, A.; Singh, A.; Mehtab, W.; Gupta, V.; Chauhan, A.; Rajput, M.S.; Singh, N.; Ahuja, V.; Makharia, G.K. Patients with celiac disease are at high risk of developing metabolic syndrome and fatty liver. Intest. Res. 2021, 19, 106–114. [Google Scholar] [CrossRef]
  38. Kårhus, L.L.; Kriegbaum, M.; Grand, M.K.; Lind, B.S.; Møllehave, L.T.; Rumessen, J.J.; Andersen, C.L.; Linneberg, A. Biochemical abnormalities among patients referred for celiac disease antibody blood testing in a primary health care setting. Sci. Rep. 2022, 12, 6407. [Google Scholar] [CrossRef] [PubMed]
  39. Mediene, S.; Hakem, S.; Bard, J.; Medjaoui, I.; Benhamamouch, S.; Lebel, P.; Fruchart, J.; Clavey, V. Serum lipoprotein profile in Algerian patients with celiac disease. Clin. Chim. Acta 1995, 235, 189–196. [Google Scholar] [CrossRef]
  40. Leffler, D.A.; Edwards-George, J.; Dennis, M.; Schuppan, D.; Cook, F.; Franko, D.L.; Blom-Hoffman, J.; Kelly, C.P. Factors that influence adherence to a gluten-free diet in adults with celiac disease. Dig. Dis. Sci. 2008, 53, 1573–1581. [Google Scholar] [CrossRef]
  41. Uribe, B.; González, O.; Blanco, M.E.; Albóniga, O.E.; Alonso, M.L.; Alonso, R.M. Analysis of the Heterogeneous Distribution of Amiloride and Propranolol in Dried Blood Spot by UHPLC-FLD and MALDI-IMS. Molecules 2019, 24, 4320. [Google Scholar] [CrossRef] [PubMed]
  42. Ralbovsky, N.M.; Lednev, I.K. Analysis of individual red blood cells for Celiac disease diagnosis. Talanta 2021, 221, 121642. [Google Scholar] [CrossRef] [PubMed]
Figure 1. Averaged preprocessed Raman spectra collected from healthy and celiac disease donors blood serum samples.
Photonics 12 00553 g001
Figure 2. PLS-DA scores plot. The PLS-DA scores plot using the first 3 LVs shows separation between the two classes. Each symbol in the scores plot represents an individual spectrum.
Photonics 12 00553 g002
Figure 3. Genetic Algorithm analysis. Mean preprocessed dried blood serum spectra of the two classes, including the spectral ranges selected by Genetic Algorithm: Healthy (red) and Celiac disease (green). Areas selected by Genetic Algorithm are marked by bolded lines. Spectral regions not chosen by Genetic Algorithm due to being uninformative for discrimination are seen as unfilled lines.
Photonics 12 00553 g003
Figure 4. GA-PLS-DA scores plot. The GA-PLS-DA scores plot using the first three LVs shows separation between the two classes. Each symbol in the scores plot represents an individual spectrum.
Photonics 12 00553 g004
Figure 5. Receiver operating characteristic (ROC) curve and external validation results for the GA-PLS-DA model. (A) ROC curve for the cross-validation GA-PLS-DA model trained to distinguish between blood serum spectra of disease and healthy donors. The true positive rate (sensitivity) is plotted against the false positive rate (1-specificity) for various discrimination thresholds. The optimal threshold is marked at (0.00, 1.00), corresponding to a value of 0.465 (B) The proportion of spectra classified as CD for each donor is represented by bar height. The classification cutoff of 0.465 is indicated by the blue dashed line.
Photonics 12 00553 g005
Table 1. Tentative assignments of Raman bands of blood serum based on the literature [30,31,32,33,34,35].
Raman Bands (cm−1)Tentative Assignment
1655Protein (Amide I a-helix) phospholipids
1609Phenylalanine ν(C=C)/Carotenoids
1520Carotenoids
1450Lipoproteins, phospholipids, δ(CH2), δ(CH3)
1340Proteins (tryptophan)
1263Phospholipids δ(CH)
1205Amino acids ν(C=C)
1173Cytosine, guanine
1160Carotenoids
1005Phenylalanine ν(C–H)
945Phenylalanine ν(C–C)
850Tyrosine
830Tyrosine
754Guanine, thymine
511Cystine ν(S–S)
Table 2. Cross-validated (CV) and external validation of the PLS-DA and GA-PLS-DA prediction results for differentiating between healthy and CD blood serum spectra.
Internal Validation (PLS-DA) Based on 6 LVs
Prediction: Most ProbableActual Class CDActual Class Healthy
Predicted as CD21211
Predicted as Healthy11210
Predicted as Unassigned00
CD Prediction Sensitivity % 95 CD Prediction Specificity % 95
External Validation (PLS-DA)
Prediction: Most ProbableActual Class CDActual Class Healthy
Predicted as CD6213
Predicted as Healthy17190
Predicted as Unassigned00
CD Prediction Sensitivity % 79 CD Prediction Specificity % 94
External Validation (PLS-DA)
External Validation (PLS-DA)External Validation (PLS-DA)External Validation (PLS-DA)
Prediction: % 50 ThresholdPrediction: % 50 ThresholdPrediction: % 50 Threshold
Actual Class CDActual Class CDActual Class CD
Actual Class HealthyActual Class HealthyActual Class Healthy
CD Prediction Sensitivity % 79 CD Prediction Specificity % 94
Internal Validation (GA-PLS-DA) Based on 2 LVs
Prediction: Most ProbableActual Class CDActual Class Healthy
Predicted as CD20815
Predicted as Healthy15206
Predicted as Unassigned00
CD Prediction Sensitivity % 93 CD Prediction Specificity % 93
External Validation (GA-PLS-DA)
Prediction: Most ProbableActual Class CDActual Class Healthy
Predicted as CD739
Predicted as Healthy6194
Predicted as Unassigned00
CD Prediction Sensitivity % 92 CD Prediction Specificity % 96
External Validation (GA-PLS-DA)
Prediction: % 50 ThresholdActual Class CDActual Class Healthy
Predicted as CD739
Predicted as Healthy6194
Predicted as Unassigned00
CD Prediction Sensitivity % 92 CD Prediction Specificity % 96
Disclaimer/Publisher’s Note: The statements, opinions and data contained in all publications are solely those of the individual author(s) and contributor(s) and not of MDPI and/or the editor(s). MDPI and/or the editor(s) disclaim responsibility for any injury to people or property resulting from any ideas, methods, instructions or products referred to in the content.

