1. Problem Retrospect
The detector array method has witnessed increasingly extensive application in the realm of laser parameter measurement technology. This is primarily attributed to its ability to directly measure the light spot, the wide dynamic range of the detector, the high sampling frequency of the system, and the favorable real-time performance. It can also fulfill various test environment requirements [
1,
2,
3]. The hardware architecture is illustrated in
Figure 1. In the detector array method, photodetectors are utilized to convert optical signals into electrical signals. Subsequently, the laser spot parameters at the target end are computed by the data processing system, thereby facilitating the evaluation of the performance of the laser emission system. Alternatively, the measured spot parameters can be employed to investigate the characteristics of high-energy laser atmospheric transmission [
4,
5,
6]. With the incessant advancement of laser technology, there is a growing demand for laser beams with high output power and excellent beam quality, which are achieved through the modular synthesis of multiple lasers [
7,
8,
9]. Generally, laser beam combining methods can be categorized into two types: coherent combining technology and incoherent combining technology. The incoherent beam combining technology mainly encompasses laser fiber combining, spatial array combining, spectral combining, and polarization combining [
10,
11]. With the development of key technologies such as heat resistance and high diffraction efficiency in core devices like multilayer dielectric gratings, spectral synthesis technology has manifested its substantial development potential [
12,
13]. The basic structure of the spectral synthesis method of the laser beam is presented in
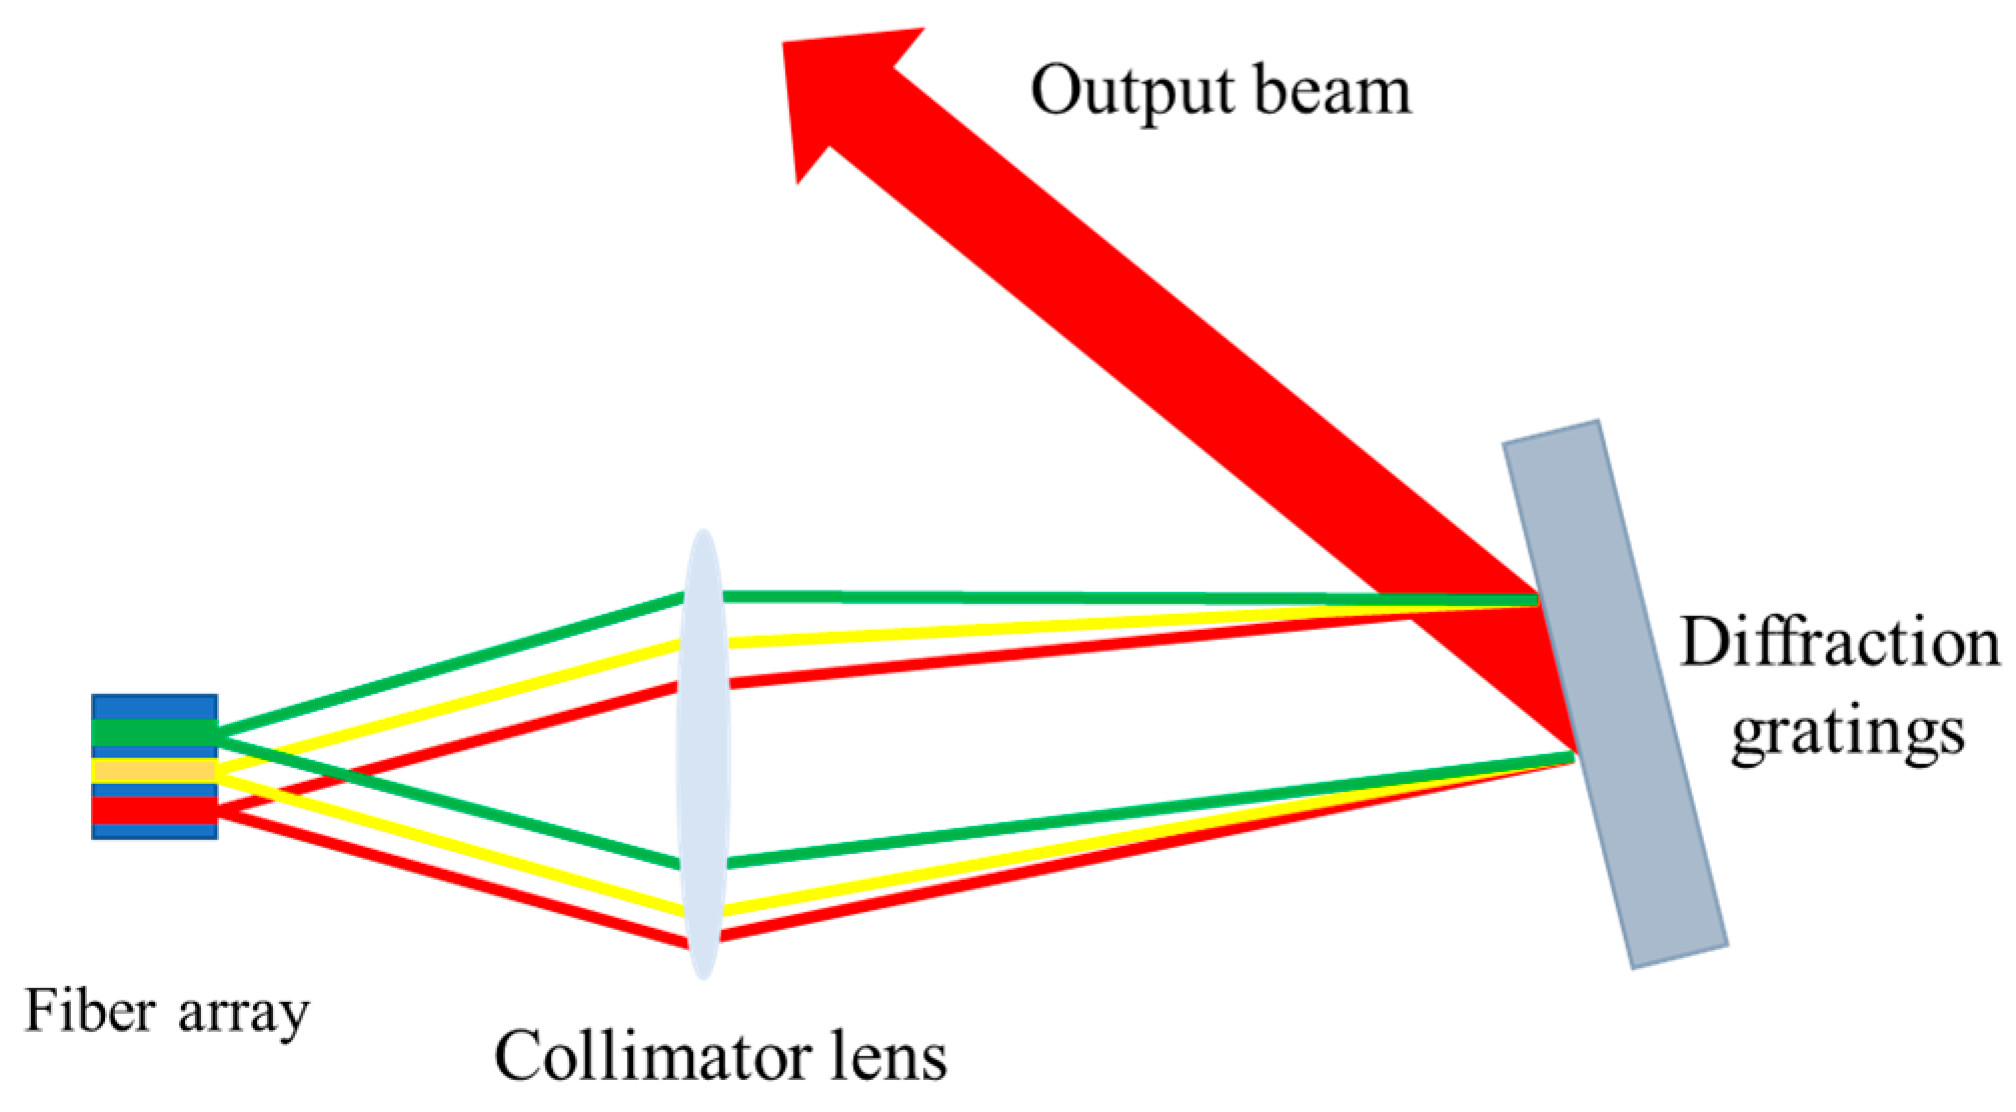
Figure 2, the curves of different colors in the diffraction grattings and fiber array represent light beams of different wavelengths, and the out beam represents the laser after the combination. Owing to the extensive spectral range of the synthesized spectrum, photodetectors exhibit varying spectral responsivity across different bands, which inevitably gives rise to significant errors in the measurement data [
14,
15]. Hence, in this study, the impact of differences in the detector’s spectral responsivity on the measurement accuracy is analyzed. Based on this analysis, a method for correcting the spectral response differences in the large-scale detector array measurement system using single-channel data is proposed.
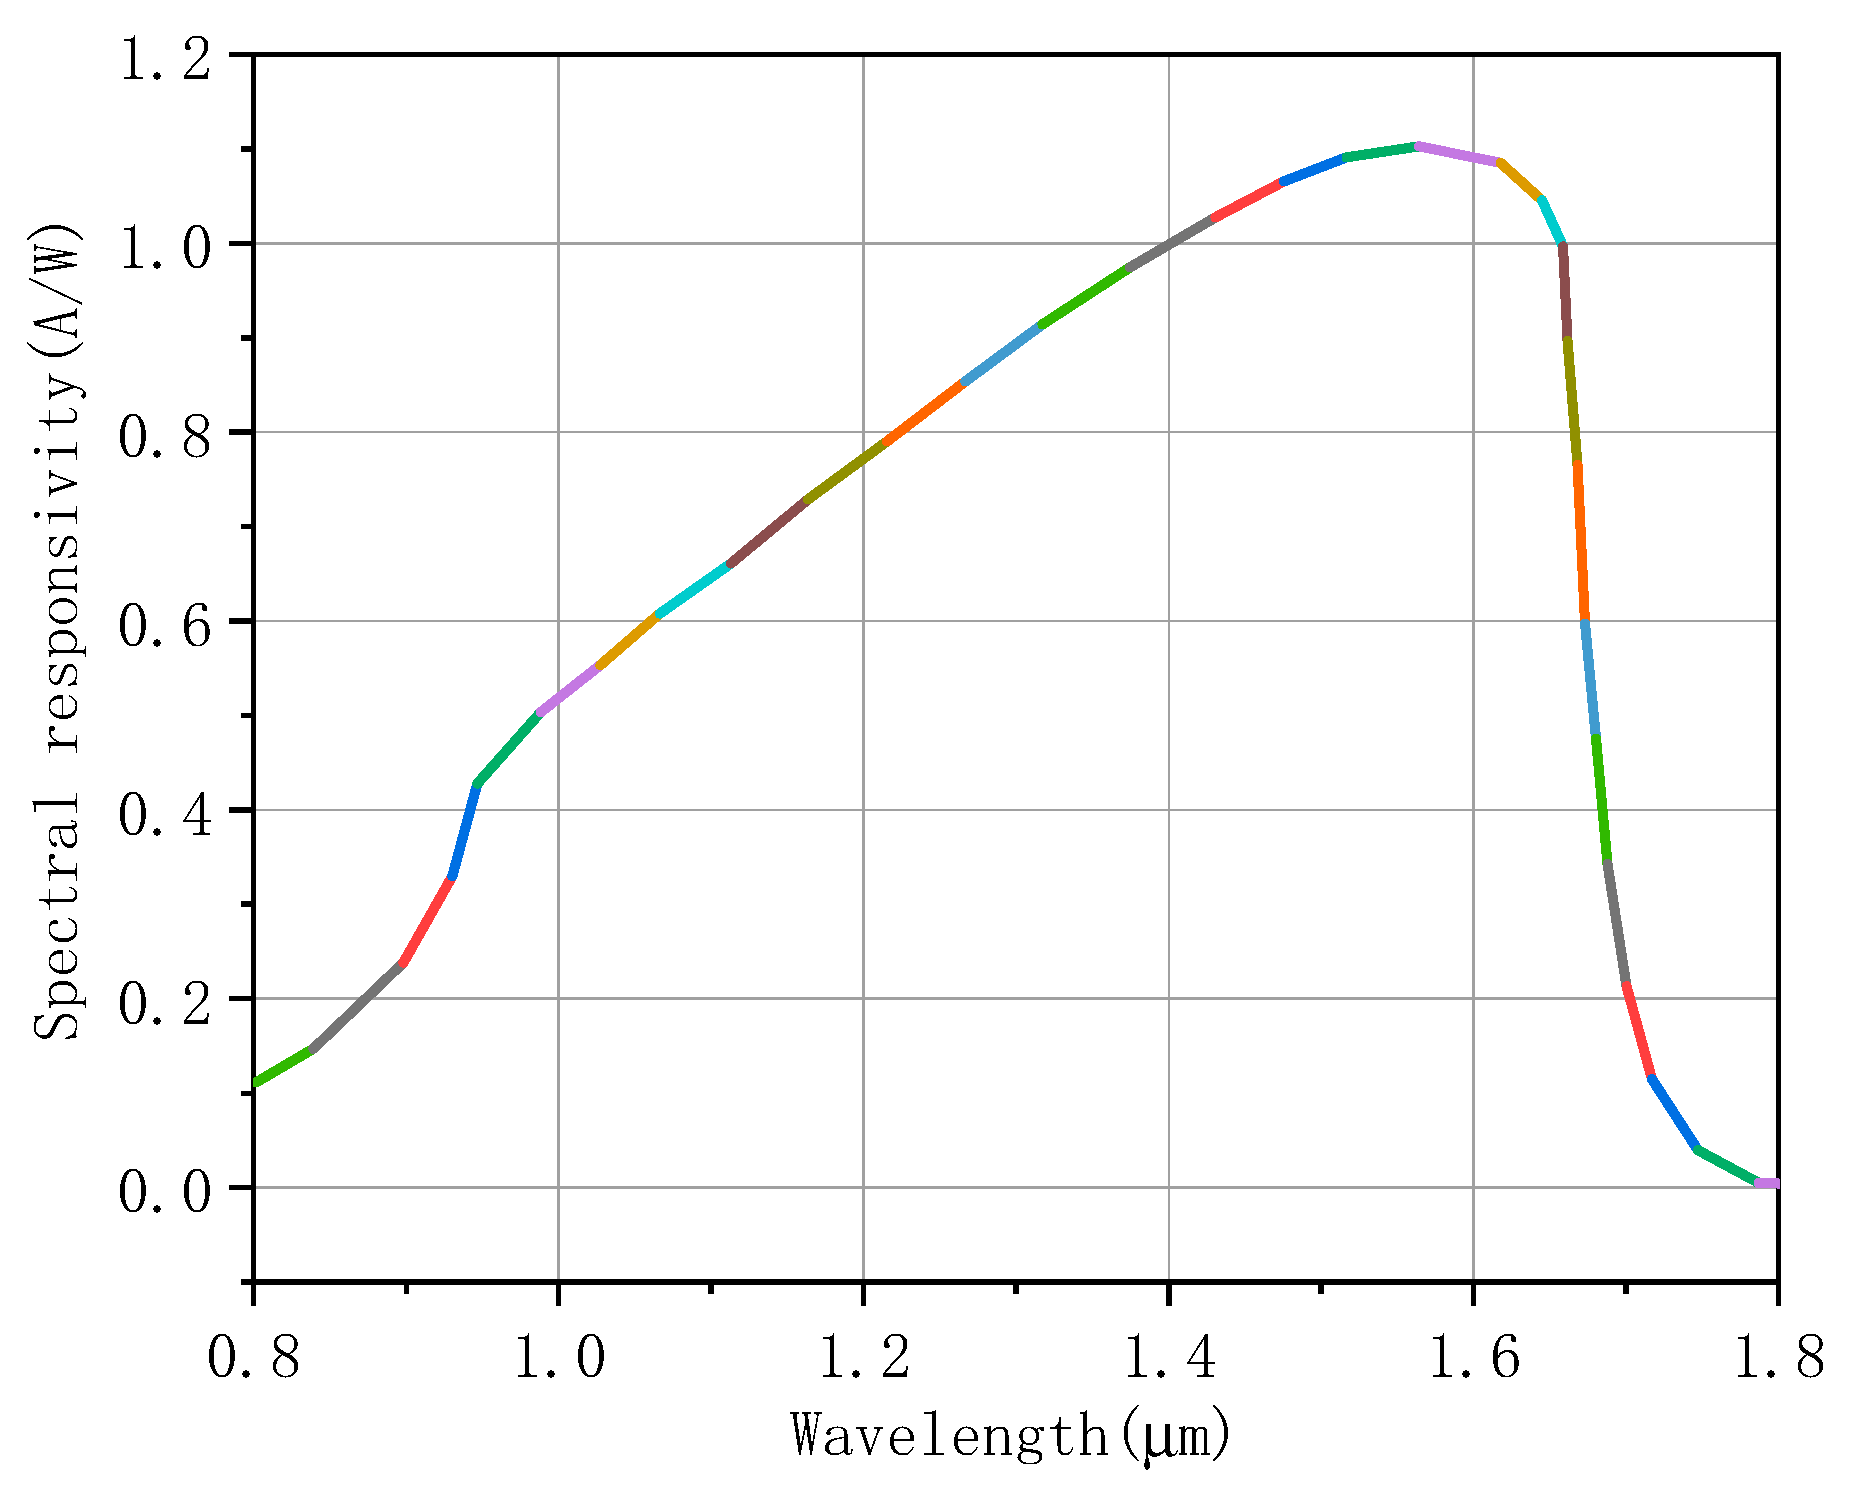
The InGaAs near-infrared detector G12180-010A, manufactured by Hamamatsu Optoelectronics Co., Ltd. in Hamamatsu, Japan, is taken as a reference. Its responsivity curve is depicted in
Figure 3. As illustrated in
Figure 3, within the wavelength range from 1030 nm to 1080 nm of the incident laser, the spectral responsivity of the detector exhibits a variation of approximately 6%. This implies that when the measurement system employs a single-wavelength laser for power density calibration, the maximum error of the system can reach around 6%. Hence, in the process of measuring the parameters of the intense laser spot in conjunction with the spectral synthesis method, it is imperative to rectify the differences in the spectral response of the detector across different wavelengths.
In the measurement system based on the detector array method, it is initially a requisite to quantitatively calibrate the system using a laser with a stable working mode and steady output power [
16,
17]. The laser with stable output is directed onto each channel of the detector array, and the correlation between the output current value of each channel of the detector and the power density of the detector sampling hole is computed. Nevertheless, the traditional measurement system fails to take into account the issues stemming from the expansion of the wavelength range of the incident beam. This primarily arises from two factors. Firstly, the wavelength range of the laser beam emitted by the conventional laser emission system is relatively narrow, exerting minimal impact on the measurement system. Secondly, it is challenging to identify a laser possessing a suitable wavelength, stable working mode, and steady output power for calibrating the measurement system. With regard to the error induced by the difference in the spectral response of the detector [
18,
19], the quantum efficiency of the detector can be pre-measured by a quantum efficiency measuring instrument, and the spectral intensity of the incident laser can be monitored in real-time by a spectrometer. Subsequently, the quantum efficiency response values and the spectral intensities of each band are weighted and aggregated to derive the power conversion coefficient, which is capable of nullifying the difference in quantum efficiency. However, several significant problems emerge when employing a spectrometer to measure the incident laser spectrum in real-time for correcting the total power of the laser. Firstly, the installation location of the spectrometer dictates whether it can ensure the reception of laser irradiation and furnish the spectral response data of the incident laser. Consequently, it might be necessary to augment the number of spectrometer probes on the target surface. Additionally, under different laser power irradiations, it remains to be ascertained whether the dynamic range of the spectrometer can guarantee that its output response falls within its operational limits. Thirdly, since the spectrometer is an independent product, the data output therefrom require secondary development to be seamlessly integrated with the data processing module of the measurement system.
In summary, in accordance with the research findings presented above, this study employs the window mirror coating technique with the aim of mitigating the spectral response variation of the detector, thereby achieving precise quantification of the spectral synthesis laser spot parameters.
2. Methods
The underlying principle of the window mirror coating methodology hinges upon the design of a filter possessing varying transmittance within a specific spectral band, which is predicated on the spectral response curve of the photodetector. Through the efficacious modulation of the light intensity across diverse bands, the output response of the photodetector can ultimately be rendered consistent under laser irradiation of disparate wavelengths. In response to the issue of utilizing coated window mirrors to nullify the spectral responsivity disparity, our research cohort carried out an exhaustive investigation. The film simulation devised for InGaAs photodetectors is illustrated in
Figure 3. As depicted in
Figure 4, it is evident that in the wavelength range spanning from 1000 nm to 1100 nm, in the absence of the coated window mirror, the quantum efficiency difference approximates 19.6%. Nevertheless, upon the introduction of the coated window mirror into the system, the spectral responsivity difference of the detector within this band is diminished by over 2%. Hence, the aforementioned data comprehensively substantiate that the coating methodology can efficaciously mitigate the spectral response disparity of the detector.
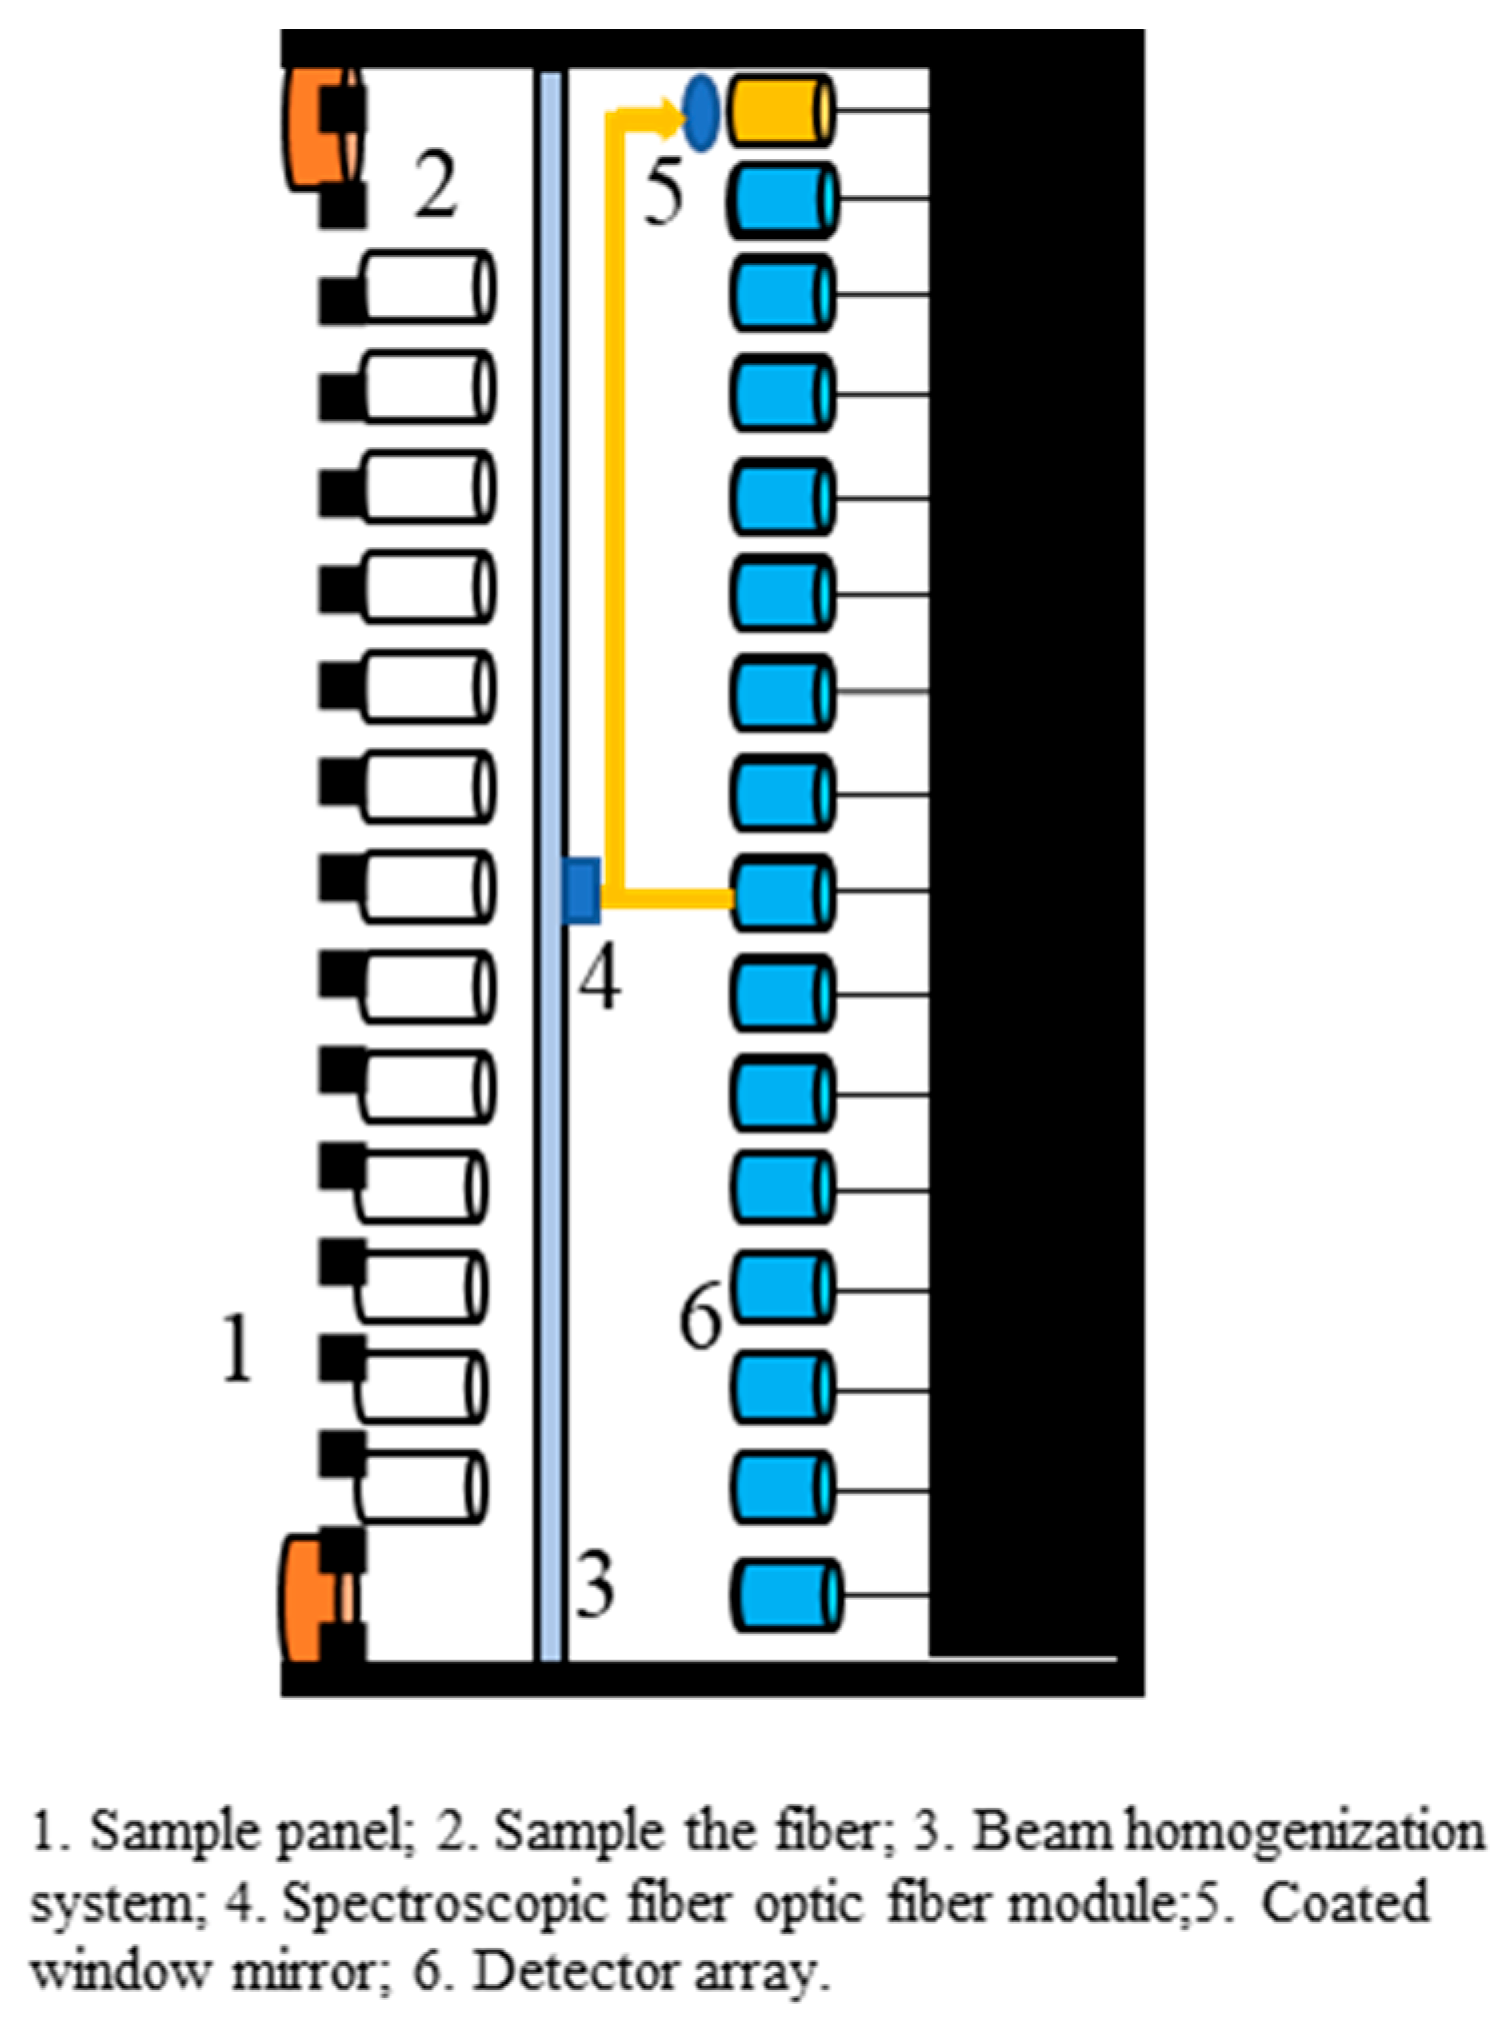
Upon the application of the aforementioned method within the detector array measurement system, it is observed that the quantity of detectors present on the target surface is notably large. Under long-distance transmission scenarios, the target size of the detector array typically exceeds 30 cm × 30 cm. Consequently, in an attempt to nullify the spectral response difference of the detectors by installing a coated window mirror at the front end of the detectors, either a considerably large window mirror is necessitated or a substantial number of small-sized lenses are required. This invariably leads to a significant escalation in both the development cost of the measurement system and the intricacy of its structural configuration. Hence, this research proposes a methodology to mitigate the quantum efficiency difference by exploiting the single channel of the detector. The schematic diagram illustrating the structure of eliminating the quantum efficiency difference within the detector array measurement system via a single channel and a coated window mirror is presented in
Figure 5. Within the central region of the detector array measurement system, a single-channel detector is chosen, and a beam splitter fiber module is installed at the rear end of the attenuation homogenization system. In this manner, one laser beam is directed towards the detector at its original corresponding position, while the other laser beam is irradiated onto the coated window mirror and subsequently impinges upon the detector after traversing the window mirror.
Essential Macleod software was used to simulate the design of the window mirror film layer. The characteristics of the film layer depended on the base material, the number of film layers, the thickness of the film layer, and the material of the film layer. The quantum efficiency difference was reduced by constantly changing the properties of the optical film layer in the Essential Macleod simulation software. The specific process is as follows:
Firstly, the quantum efficiency of the detector is measured by the quantum efficiency measuring instrument, and the spectral response data of the detector in the whole band are obtained.
Second, the initial reference wavelength, film thickness, film layer number, substrate material, and film layer material are set to obtain the corresponding film layer.
Finally, through analysis and comparison, the reference wavelength, film thickness, film layer number, substrate material, and film layer material are adjusted until the required film layer is suitable for the detector’s working requirements.
In addition, the coating used in the simulation in this paper contains three parts, namely Na3AlF6, ZnS, and Al2O3.
3. Results
Within a specific wavelength range, the quantum efficiency of the detector spans from
SR1 to
SRn. Upon the installation of a coated window mirror at the front end of the detector, the quantum efficiency within this wavelength range alters to
SRm. Given that the measurement system is required to quantitatively compute the laser power parameters based on the incident optical signal, calibration against a standard light source is imperative during the development of the measurement system. This facilitates the acquisition of the power conversion coefficient
Kbd, which represents the relationship between the output current value of the measurement system and the incident laser power. A single-wavelength narrow-linewidth light source, characterized by a stable laser working mode and stable power, is selected for this calibration purpose. The output wavelength of the calibrated light source is denoted as
λbd, its power as
Pbd, and the quantum efficiency of the detector at this wavelength is recorded as
QEbd. Subsequently, the laser power conversion coefficient of the channel devoid of the window mirror detector is computed as
K00 = 1/
SRbd, while that of the channel equipped with the coated window mirror is calculated as
K01 = 1/
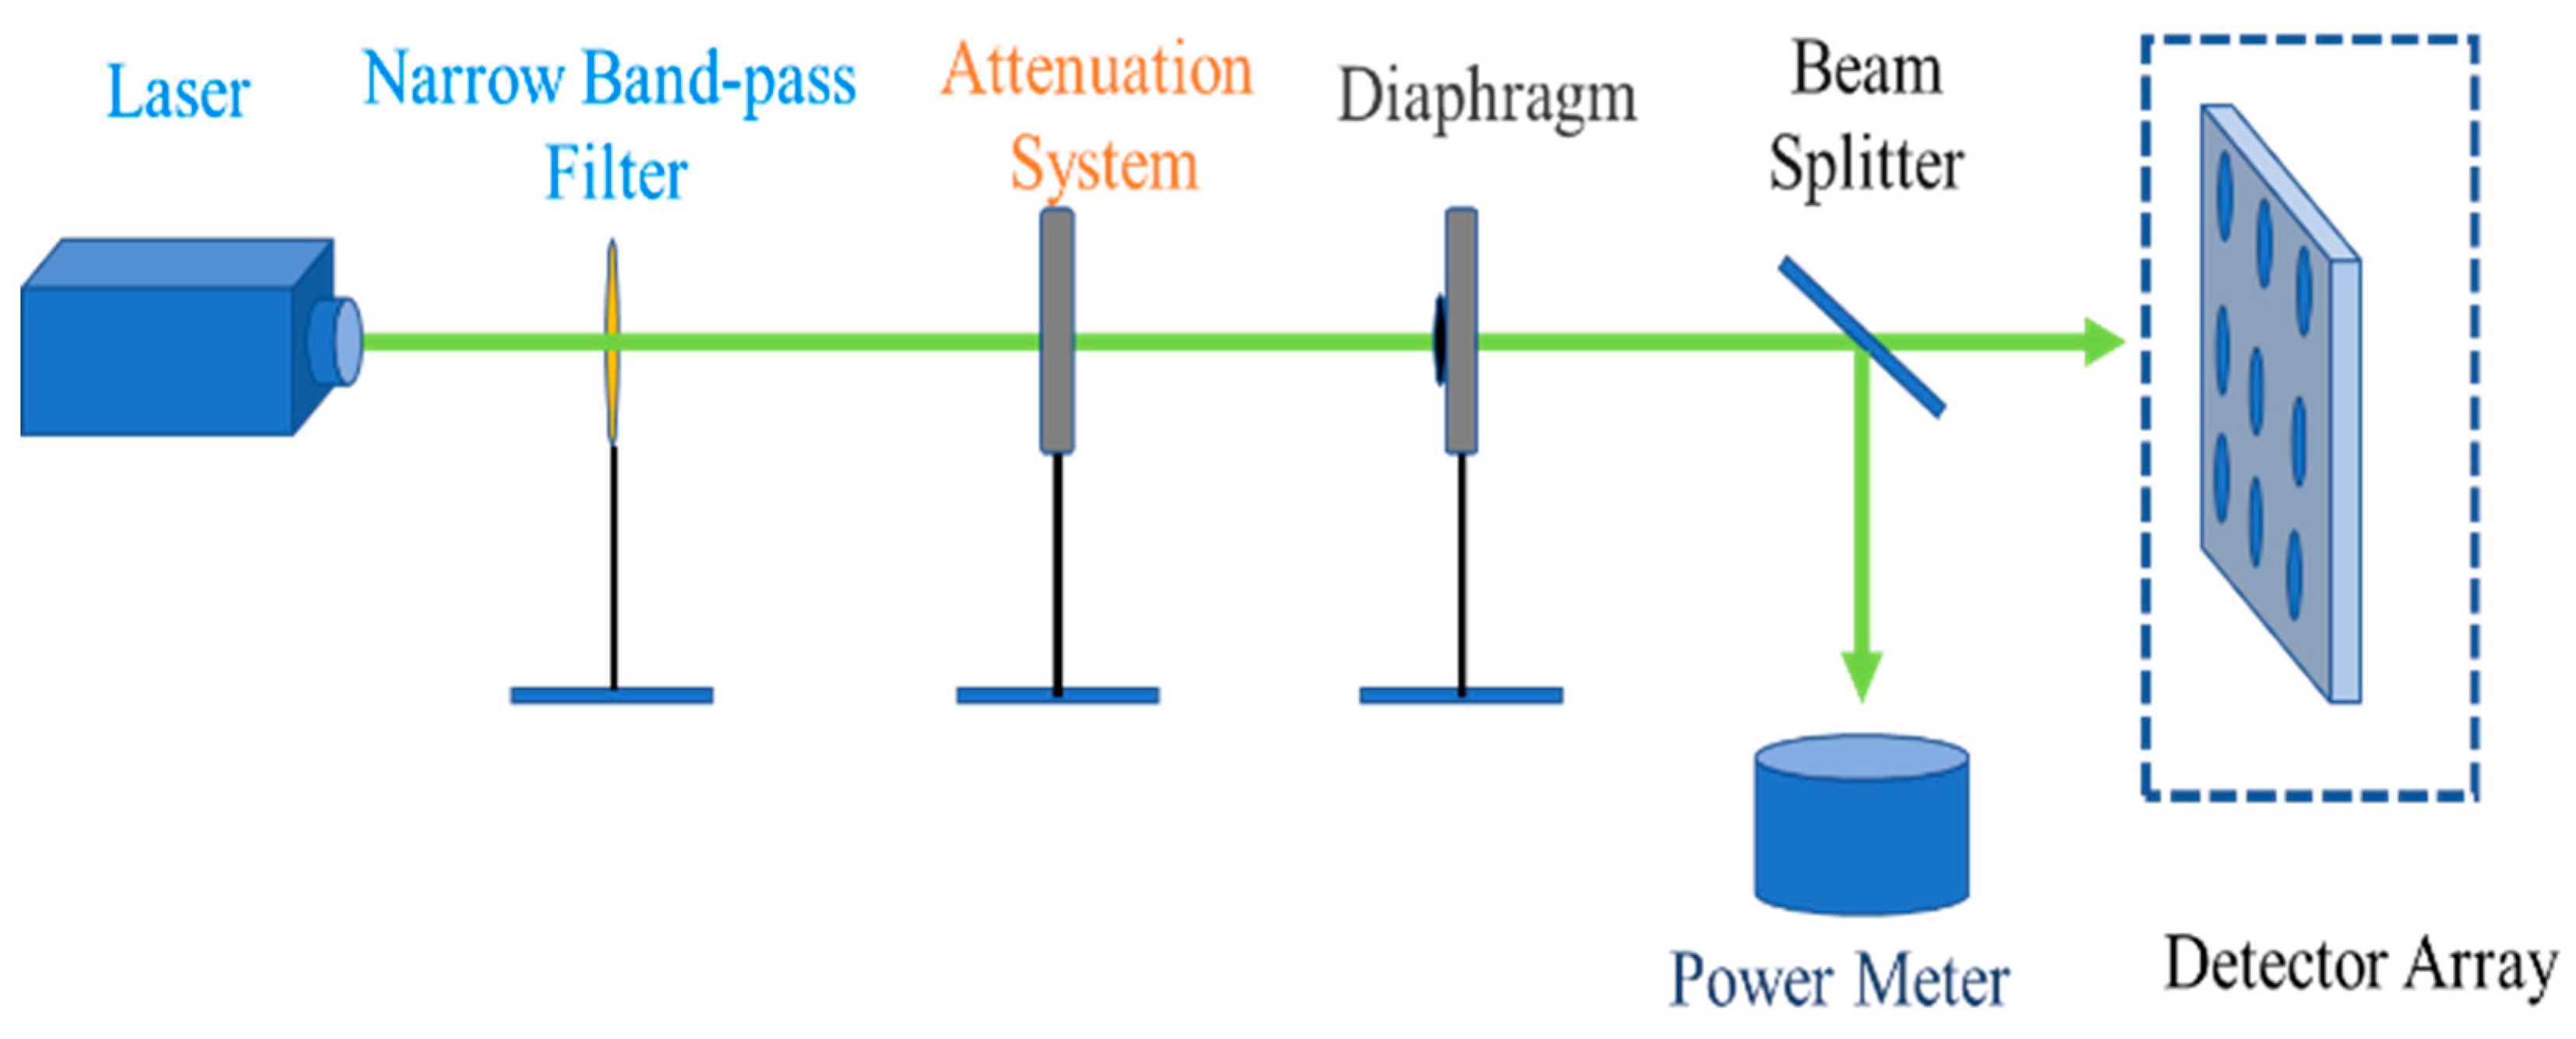
SRm. Generally speaking, the wavelength range of the light source employed for calibration ought to align with that of the actual measured laser emission system. However, for certain specific wavelengths, a stable calibration light source is notably absent. Consequently, in the actual calibration process, single-wavelength calibration is typically adopted, and the calibration process after traversing a narrowband filter is illustrated in
Figure 6; due to the attenuation system and diaphragm, the laser light impinges upon the beam splitter. Here, 50% of the laser is directed towards the detector array target, while the remaining 50% is incident upon the power meter. On the one hand, the power conversion coefficient of the detector can be derived from the measured value of the power meter and the output current value of the single channel of the detector array, namely the aforementioned
Kbd. On the other hand, by stabilizing the illumination of the light source, the uniformity of all detector units on the target surface can be calibrated, thereby ensuring a consistent output response.
During the measurement of the laser spot pertaining to spectral synthesis, the incident laser, upon traversing the sampling hole, is bifurcated into two beams. These two beams are then directed towards the detector equipped with a coated window mirror and the detector devoid of such a coating, respectively. Suppose the spectral range of the incident laser spans from λ
1 to λ
n; the original spectral responsivity of the detector within this band is denoted as
SR1 to
SRn, and the intensity within each band is
P1 to
Pn. Subsequently, the output power
P00 of the detector corresponding to position 4 in
Figure 4 can be computed in accordance with Formula (1).
The detector output power
P01 at position 5 of
Figure 4 can be calculated by Formula (2).
Divide
P00 and
P01 to obtain the ratio
KP of the output power of the single-channel detector before and after eliminating the spectral responsivity.
where
SR and
SRbd are fixed constants for the same type of detector. The modified spectral responsivity
SRm of the detector after the coating window is added is also a constant.
is recorded as the total power
Ptotal of the incident laser, and the power
Pi (
i = 1~
n) at each wavelength is recorded as the proportion
Ki ×
Ptotal relative to the total power. Therefore, Formula (3) can be further written as
Therefore, the ratio
Kp of the output power before and after the single-channel detector eliminates the quantum difference is a fixed coefficient, and the output response value of the detector when a coated window mirror is installed at the front end of the detector can be seen as the real laser power at this point. This means that the laser power of each detector channel can be corrected by
Kp, so as to solve the problem of expanding the incident laser wavelength range of the detector array target. The calculation method is shown in Formula (5).
where
m represents the number of rows of the detector array,
n represents the number of columns of the detector array,
Aij represents the area (unit is cm
2) represented by the detection unit with rows and columns (
i,
j),
Iij(
f) is the light intensity output value of the point, and
A00 and
I00(
f) are the area and light intensity output values of the detector at the corresponding position of the coated window mirror.
With regard to the issue of mitigating the spectral response difference of the detector through the application of the coating method, the most crucial influencing factor lies in the design of the film layer. For the detector mentioned above, within the spectral band ranging from 1 μm to 1.1 μm, the coating layer designed by our research group has managed to reduce the spectral response difference from 4% to approximately 1.7%. Nevertheless, there remains substantial room for further optimization in the design of this layer.
