Article

Underwater Sphere Classification Using AOTF-Based Multispectral LiDAR

1
College of Electronic Engineering, National University of Defense Technology, Hefei 230037, China
2
Advanced Laser Technology Laboratory of Anhui Province, Hefei 230000, China
*
Authors to whom correspondence should be addressed.
Photonics 2025, 12(10), 998; https://doi.org/10.3390/photonics12100998
Submission received: 9 July 2025 / Revised: 27 August 2025 / Accepted: 9 October 2025 / Published: 10 October 2025
(This article belongs to the Special Issue Technologies and Applications of Optical Imaging)

Abstract

Multispectral LiDAR (MSL) systems offer a significant advantage by actively capturing both spatial and spectral information. These systems offer significant promise in supporting the comprehensive analysis and precise classification of underwater targets. In this study, we build an MSL system based on an acousto-optic tunable filter (AOTF) to investigate the feasibility of underwater sphere classification. The MSL prototype features a spectral resolution of 20 nm and 13 spectral channels, covering a range from 560 to 800 nm. Laboratory-based experiments were conducted to evaluate the accuracy of range measurements and the classification performance of the system. The spectral curves of nine distinct spheres acquired by the MSL were utilized for classification using a support vector machine (SVM). The experimental results indicate that classification using multispectral data yields a higher accuracy and Kappa coefficient. Finally, the point cloud acquired from scanning experiments further validated the MSL system’s performance. This finding preliminarily validates the feasibility of multispectral LiDAR for classifying submerged spherical targets.

1. Introduction

Salvaging underwater golf balls offers significant economic and environmental benefits. Golf is a widely popular sport, and replacing lost golf balls constitutes one of its major expenses [1]. Currently, the recovery of golf balls from water hazards on golf courses is an industry valued at over USD 200 million [2]. Conventional human-led salvage operations rely on professional divers. However, these prolonged underwater activities expose divers to various hazards, including waterborne bacteria, venomous snakes, crocodiles, other reptiles, and hypothermia. Therefore, developing methods for underwater golf ball detection through their spectral characteristics and positional information could substantially mitigate the risks encountered by divers.
With continuous advancements in underwater and marine research, underwater sensing technologies include, but are not limited to, acoustic signals, light signals, and electromagnetic signals [3]. While sonar systems offer distinct benefits in terms of coverage range and signal propagation, their resolution capabilities remain limited [4]. Electromagnetic signals, however, are susceptible to interference from the Earth’s magnetic field. Underwater optical remote sensing suffers from challenges including signal attenuation and inconsistent return echoes, but it enables high-resolution and high-accuracy detection over shorter ranges and facilitates target classification through differential spectral signatures. Consequently, for the application scenario of salvaging submerged golf balls, optical detection methods prove to be the most suitable approach [5,6,7,8].
Although capable of acquiring high-accuracy ranging data, LiDAR’s monochromatic illumination fails to deliver comprehensive spectral data, thereby constraining classification performance. Hyperspectral imaging, as a passive detection technique, can capture the physical properties and color information of targets [9,10], outdoor athletics [11], medical diagnostics [12], urban ecology [13] and plant science [13]. Recently, driven by developments in Autonomous Underwater Vehicles (AUVs) and Remotely Operated Vehicles (ROVs), hyperspectral imaging instruments mounted on AUVs have been utilized for marine mineral detection [14]. Researchers first implemented underwater hyperspectral imaging for marine archeology, demonstrating that ROV-mounted hyperspectral equipment can classify common underwater materials, which confirmed the viability of hyperspectral methods in underwater archeological investigations [15]. Nevertheless, passive optical imaging also has drawbacks, including reliance on ambient illumination and constrained spatial information acquisition capabilities [16,17].
Multispectral LiDAR (MSL) offers an advantage by actively capturing both spatial and spectral information, enabling simultaneous acquisition of precise positional data and spectral information [18], which has been extensively utilized in domains such as mineral prospecting, forestry vegetation monitoring, and remote sensing [19,20,21]. In recent years, there have been studies exploring underwater applications of multispectral LiDAR. Researchers have applied multispectral LiDAR to classify underwater minerals, compared the accuracy of different classification methods [22], proposed an underwater hyperspectral LiDAR system, tested its underwater performance, and validated its capability to simultaneously acquire spectral and topographic data [23]. Existing multispectral LiDAR systems designed for underwater applications primarily utilize laser beam combining [24] and optical parametric oscillation (OPO) [25] to achieve multispectral illumination. Laser beam combining integrates multiple laser sources to achieve broad spectral coverage, addressing limitations inherent to single-wavelength detection. However, increasing spectral channels exacerbate system integration difficulties and elevate architectural complexity. Using a β-Ba2BO4 (BBO) OPO pumped by an ultraviolet laser, researchers produced laser emissions covering 410–630 nm, which would be applicable to water body sensing [25]. However, this approach suffers from low conversion efficiency, and the requirement for high-precision angular adjustment restricts tuning speed. The advent of the acoustic–optically tunable filter (AOTF) has introduced a new paradigm for multispectral LiDAR system development, functioning via the acousto-optic effect. AOTF employs radiofrequency signals to make the incident light spectrally tunable, permitting rapid wavelength selection from white-light sources. When coupled with supercontinuum laser sources, they enable direct emission of selected wavelength bands, achieving microsecond-scale rapid tuning. Furthermore, AOTFs can simultaneously emit multiple laser wavelengths, representing a significant advantage for multispectral LiDAR applications [26]. This study employs a supercontinuum AOTF-based multispectral LiDAR system for underwater sphere classification, where a single avalanche photodiode (APD) unit receives signals across multiple spectral bands, reducing system complexity. Moreover, its high-speed, high-resolution tuning capability provides advantages for identifying optimal spectral bands for underwater object detection. Although multispectral LiDAR faces many limitations in underwater applications such as attenuation effects during laser propagation in water and radiometric correction of laser echoes under different water conditions, its capabilities in active sensing, high spatial resolution, and acquiring spectral information of targets make it highly promising for underwater target detection and identification.
This study demonstrates a prototype of AOTF-based multispectral LiDAR and validate the capability of the system to acquire spectral and point clouds, verifying its feasibility of underwater sphere classification. Initially, the paper introduces the system configuration: a multispectral LiDAR system implemented with a supercontinuum laser source and an acoustic–optically tunable filter (AOTF), achieving a spectral resolution of 20 nm across a wavelength range of 560–800 nm. Spectral data are subsequently collected for nine submerged spheres. Data processing yielded underwater spectral reflectance profiles for each sphere type. The support vector machine (SVM) method is then employed to classify the experimentally obtained spectral samples, with the classification results demonstrating that multispectral LiDAR can reliably differentiate among diverse underwater spheres. Moreover, the system is capable of generating multispectral point clouds, which suggests its use for further studies on point cloud classification, enabling potential studies in subsequent classification research.

2. Materials and Methods

2.1. MSL System

As illustrated in Figure 1, the multispectral LiDAR system developed in this work comprises an emission unit, a receiving unit, and a scanning system. The emission unit incorporates a supercontinuum laser (NKT SuperK COMPACT, NKT Photonics, Birkerød, Denmark) and an acousto-optic tunable filter (AOTF; SuperK SELECT). The receiving unit is composed of an off-axis parabolic (OAP) mirror, an avalanche photodiode (Thorlabs APD210, Thorlabs, Newton, NJ, USA), and an oscilloscope. Both motor control and subsequent data processing are executed by a computer. The supercontinuum laser emits broadband radiation spanning 450 nm to 2400 nm, with a pulse width of approximately 1 ns and adjustable repetition rates from 1 to 20 kHz. Figure 2a shows the variation in pulse energy density with wavelength. Following AOTF filtering, tunable output across 500–900 nm is achieved, with a spectral resolution of 3.5–13.4 nm. Figure 2b shows the response curve of APD. Given the diminished laser energy and response of APD below 560 nm and aquatic absorption effects, the operational spectral range employed in this study was 560–800 nm, with a spectral resolution of 20 nm. Eleven spectral channels were measured in total in the laboratory experiments. Post-filtering collimation was performed with a reflective collimator (RC08FC-P01, Thorlabs, Newton, NJ, USA), producing an 8.5 mm beam diameter with <1 mrad divergence. The collimated beam passes through a 10 mm diameter central aperture in a 90° OAP to a scanning mirror. The echoes of the target are also collected and focused to the APD active area by OAP. Finally, waveforms are visualized and stored by the oscilloscope. The laser’s output pulse serves as the trigger signal, which is the start of the time of flight (TOF). The oscilloscope utilizes dual channels for simultaneous trigger and echo signal acquisition, operating at a 50 GHz sampling rate, which corresponds to a range resolution of 0.3 cm theoretically. Mirror rotation range and angular resolution are computer-controlled.

2.2. Laboratory Experiments

To verify the underwater sphere classification performance of the MSL, diverse spherical targets are required. The spherical samples are shown in Figure 3b, and the various balls are labeled in the figure, with differently colored golf balls depicted using their respective colors. Overall, these experimental samples comprise readily available spherical objects, with diverse material compositions.
Following emission from the system, the laser enters the underwater test environment, with the overall laboratory underwater configuration shown schematically in Figure 3a. The water tank dimensions are 310 mm (width) × 350 mm (length) × 650 mm (height). Considering cost factors, the reflector on the water tank uses ordinary mirrors, which are oriented at 45° to the horizontal plane, serving to minimize water surface reflections and prevent spurious reflections from direct laser illumination of the tank walls, sized at 120 cm (length) × 40 cm (width). Through reflection, the incident angle of the laser on the water surface is approximately 0°, as governed by the Fresnel equations, under which conditions water exhibits minimal reflectance. The water tank dimensions are 310 mm (width) × 350 mm (length) × 650 mm (height). Additionally, the data collection experiments are conducted under a controlled laboratory environment.

2.3. Methods

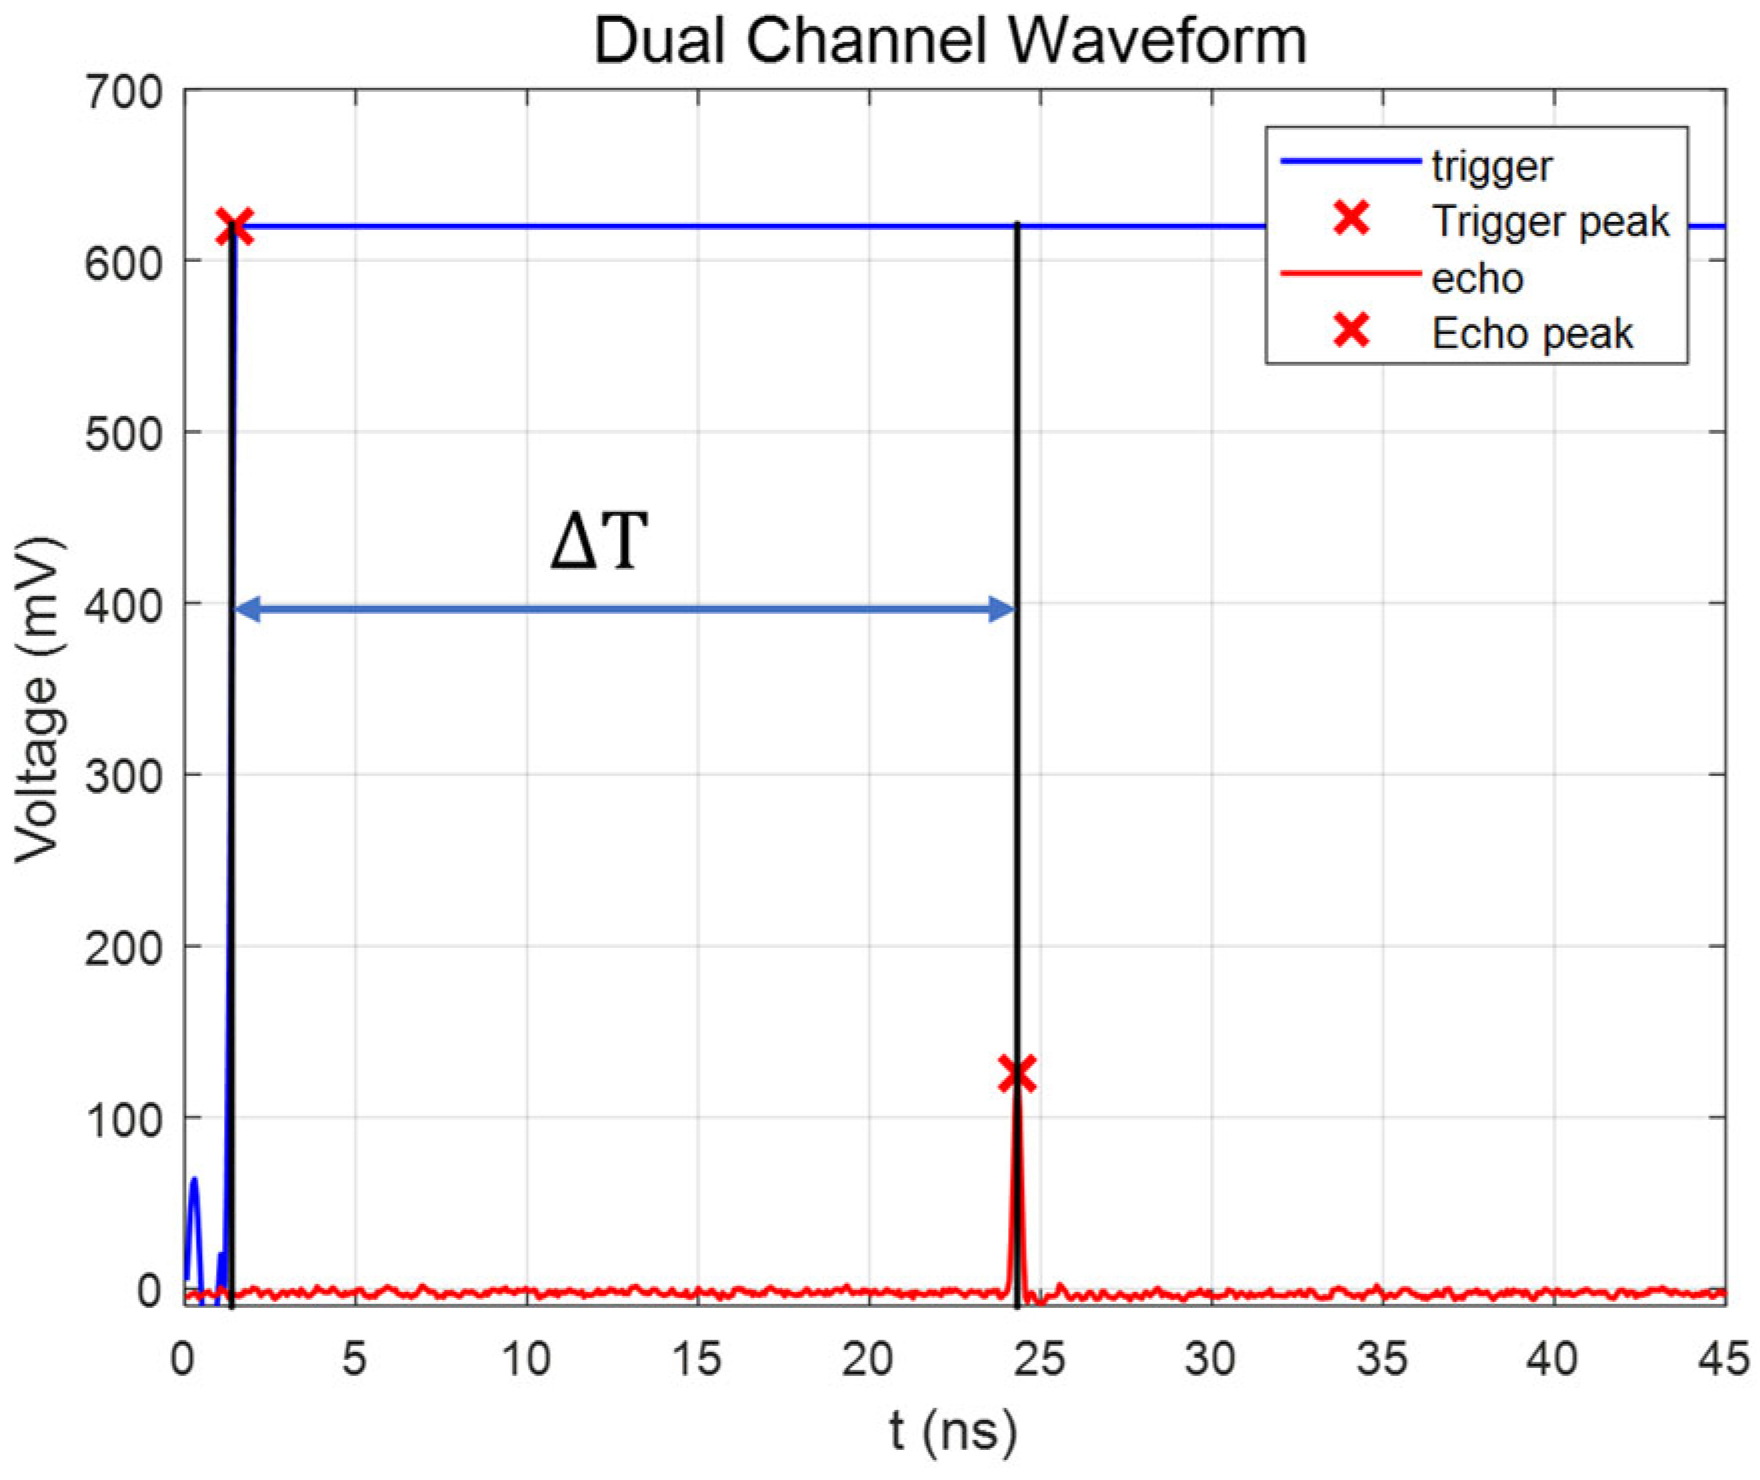
Distance measurement is based on the time-of-flight (TOF) method. We employed simple maximum amplitude detection due to its computational efficiency and observed robustness in our multispectral LiDAR system. The maximum value point of the trigger signal peak defines the start time, the maximum of the echo signal peak marks the end time, and their temporal difference yields the TOF. Target distance is calculated via Equation (1):
D =   1 2 c T
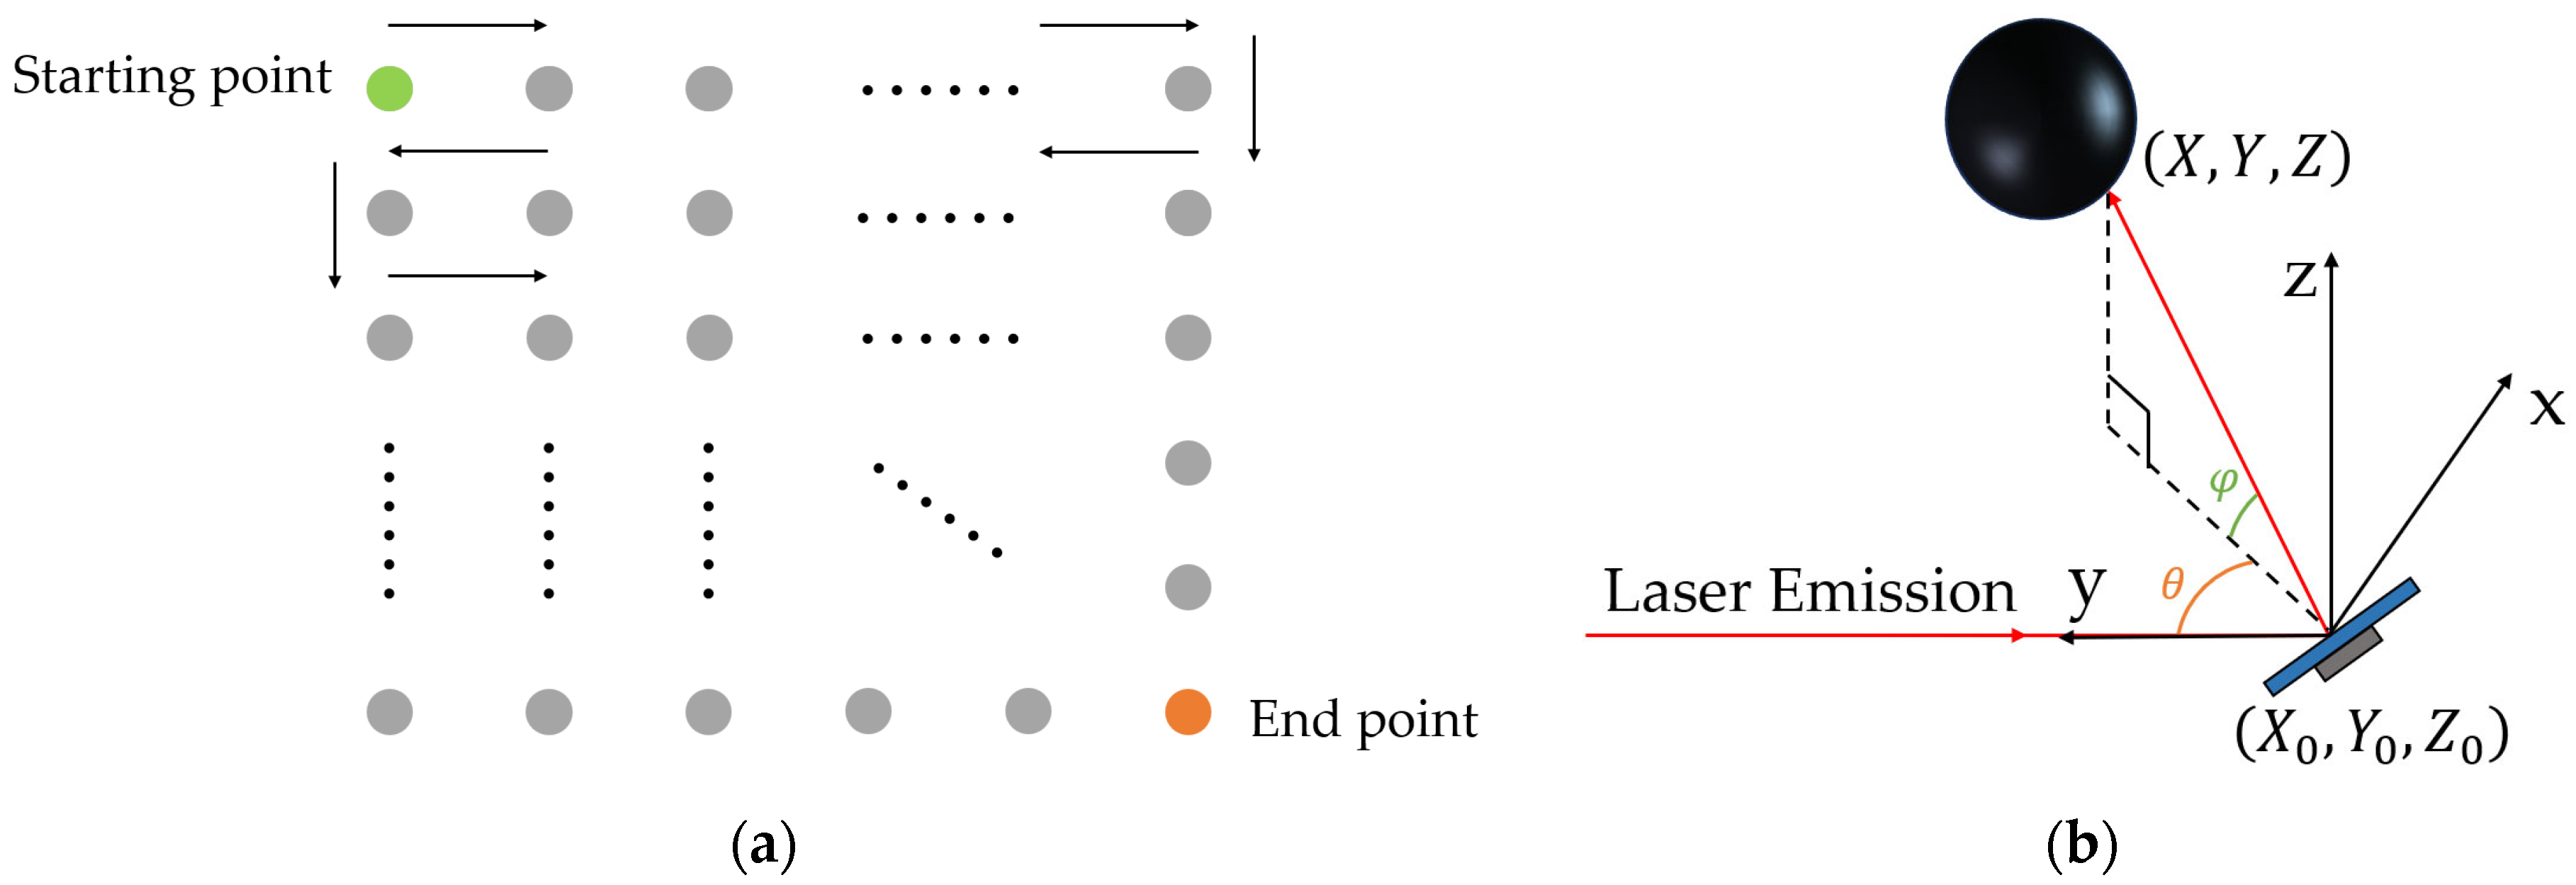
Here, D represents the target distance, c is the speed of light, and ΔT is the temporal separation between the trigger and echo signal peaks. The laser emission position of the MSL system is taken as the origin, denoted as  X 0 , Y 0 , Z 0 . The system’s scanning mechanism and a schematic diagram of the three-dimensional imaging experiment are illustrated in Figure 4b. The 3D coordinates X , Y , Z  of the laser-illuminated point can be calculated based on the distance and angular information, using the following equation:
X =   X 0 + R cos φ sin θ Y =   Y 0 + R cos φ cos θ Z =   Z 0 + R sin φ                            
SVM is a machine learning method based on statistical learning theory that is used to solve classification problems and has been widely applied in remote sensing research [19,20]. By extracting echo peak data, the sample echo intensity at specific wavelengths is obtained. Post-calibration processing computes sample reflectance at each wavelength, which serves as input features for classification. To investigate sphere classification in an underwater environment based on MSL intensities, an SVM classifier is implemented. Multispectral LiDAR can provide rich spectral information, and a high accuracy can be achieved with only a limited training set during classification. Therefore, we selected 10% of the data as the training set to highlight the advantages of multispectral LiDAR. The classification outcomes are graphically visualized.
As illustrated in Figure 4a, once the scanning range and resolution are set and the scan starts, the system performs a zigzag scan on objects within the designated range. The echo data from the scanned points is stored by the oscilloscope and saved to the computer. As depicted in Figure 4b, processing the stored echo information along with angle information through Equations (1) and (2) allows for determining the 3D coordinates of target points. After processing all scanning points, target point clouds can be generated and visualized.

3. Results and Discussion

3.1. Range Measurements

To assess the system’s ranging performance, conducting distance measurement experiments is essential. To improve the signal-to-noise ratio (SNR), this study selects the softball with the highest reflectivity in the water tank as the target for the ranging experiment. The shot put is located 4 m from the system. The system-acquired sample echo waveforms are shown in Figure 5. For each wavelength, 10 echo signals are collected to calculate the average range and standard deviation. AOTF is used to change the system’s emitted light wavelength to evaluate ranging performance across different spectral bands.
Table 1 presents the ranging results for different spectral channels, starting from 560 nm to 800 nm with an interval of 20 nm. The results show that the measured distances across all spectral bands range from 3.986 m to 4.014 m, with a variation of 2.8 cm. Possible reasons for the presence of measurement errors may include the following:
  • Measurement is affected by the ranging environment, and with the water itself being liquid, it may exhibit slight fluctuations, leading to ranging errors;
  • Different wavelengths have varying laser energies. Higher laser energy leads to higher SNR, stronger anti-interference capability, and relatively better signal stability;
  • Jitter in both the trigger signal and the laser itself can introduce measurement errors related to the stability of the laser.

3.2. Data Processing and Classification Performance

It is essential to calibrate the multispectral LiDAR system in order to accurately obtain the target reflectance and reveal its physical nature [26,27]. To calibrate each channel of the multispectral LiDAR, the system first acquires the echo intensity of a standard diffuse reflection whiteboard with 50% reflectivity within the wavelength range of 560 nm to 800 nm, using the peak value of the echo as the reference, denoted as V ref ( λ ) . Subsequently, the spectral data of different samples are collected, and the peak values of their reflected echoes are recorded as   V s ( λ ) . Given that the reflectance of the standard white reference at each wavelength is known as ρ ref ( λ ) , the sample’s reflectance at different wavelengths, ρ s λ , can be calculated via Equation (3):
ρ s ( λ ) = V s ( λ ) V ref ( λ ) ρ ref ( λ )
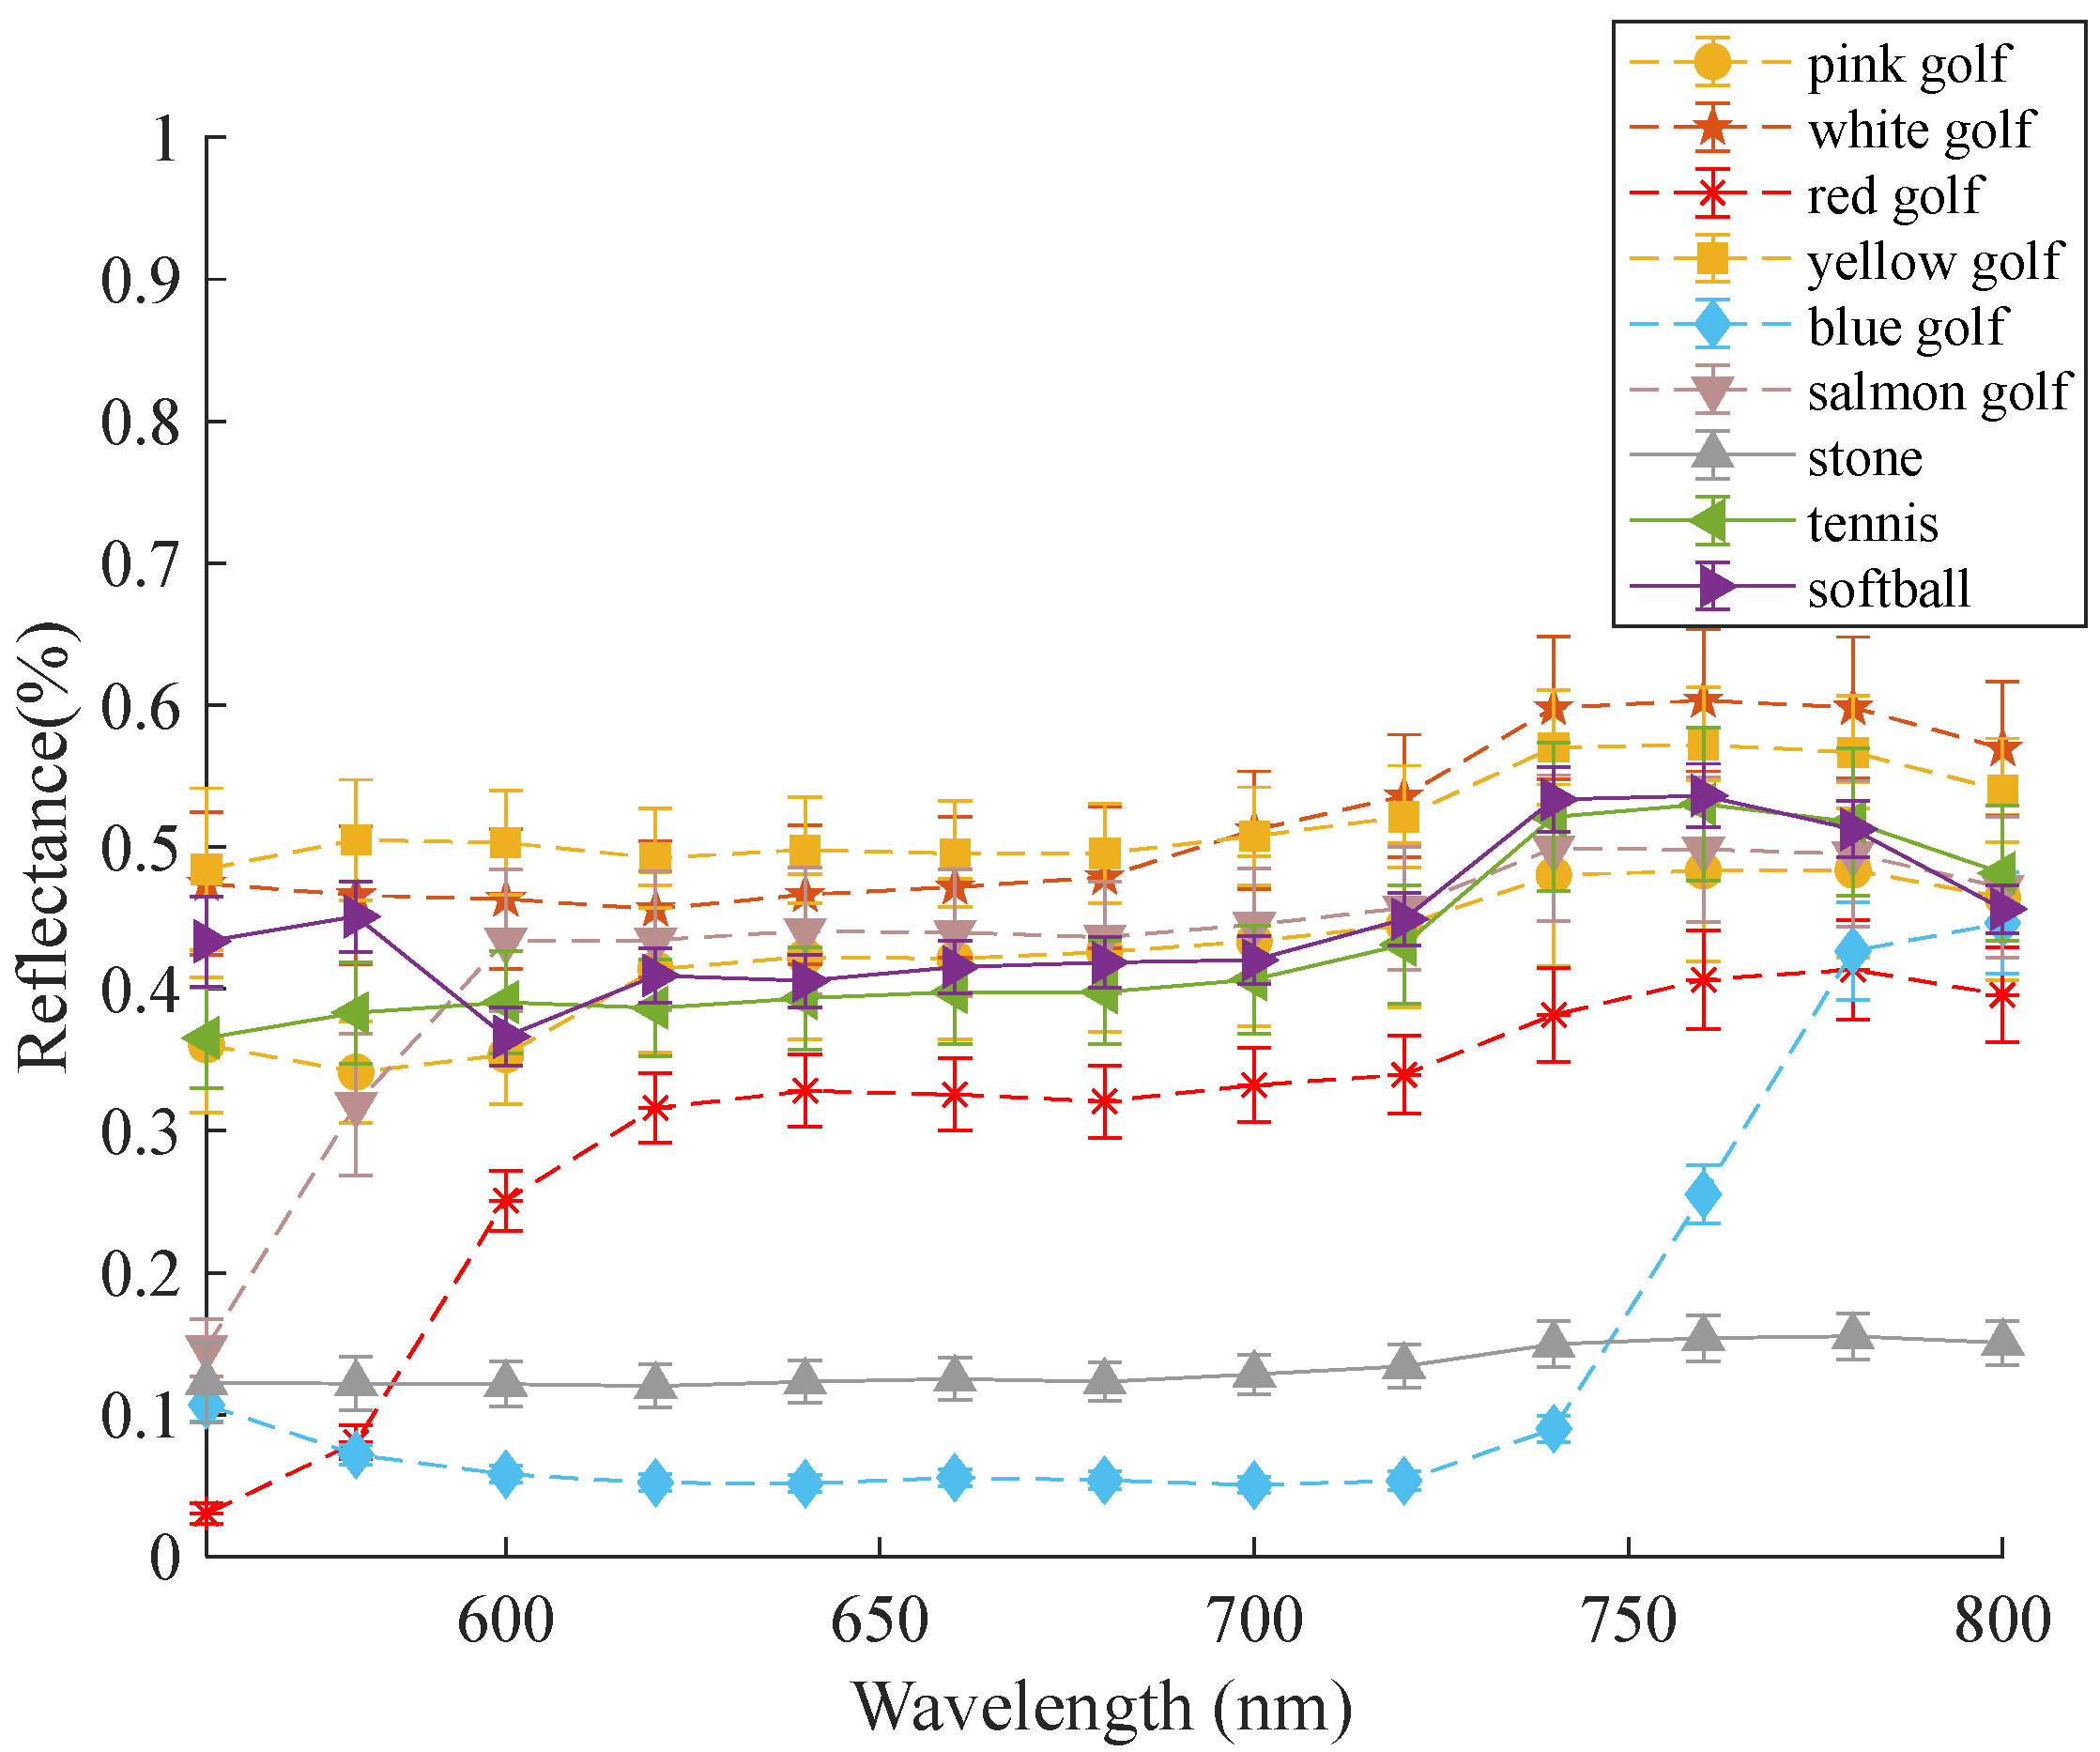
The reflectance of five different spheres is calculated through Equation (3). Figure 6 presents the spectral curves of the nine samples, and each spectral curve is generated from the average of sixteen measurements. Different colors represent different types of spheres. The spectral curves of several golf balls of different colors are depicted with dashed lines, while the remaining spheres are shown with solid lines, and error bars at each point indicate the corresponding variance. It can be observed from Figure 6 that, apart from the blue golf ball exhibiting low reflectance between 560 and 760 nm, the reflectance curves of the remaining golf balls are generally high. The reflectance profiles of the tennis ball and softball are similar and exhibit higher reflectance than both the red and blue golf balls. The spectral curves of the stone ball and golf balls can be readily distinguished. However, the curves of the remaining spheres exhibit overlap, posing a greater challenge for identification. Therefore, this may lead to classification errors and increased inaccuracies when relying solely on single-wavelength spectral reflectance information. To further investigate the classification performance of the multispectral LiDAR system, the reflectance will be used as input features, followed by an analysis of the classification results.
Before evaluating the classification performance of underwater spherical samples, a dataset based on the reflectance features of different spheres is constructed, with labels added to distinguish between the various types of spheres. SVM is utilized for the classification task, and its accuracy is tested by calculating the overall accuracy and Kappa coefficient of the classification results. In addition, this study reduces the amount of spectral information by decreasing the number of spectral bands and compares the classification performance across different spectral bands. The improvement in classification accuracy attributable to the use of multispectral data is further verified.
The classification accuracy and Kappa coefficient serve as key evaluation indicators for assessing the SVM’s classification performance. Accuracy is defined as the ratio of correctly predicted instances to the total number of samples, ranging between 0 and 1. A higher value indicates better predictive performance. While classification accuracy is simple and intuitive for model evaluation, it has limitations, such as being insensitive to class distribution and unable to reflect error types. The Kappa coefficient is a statistical measure used to evaluate classification model performance. It quantifies the agreement between predicted and actual classifications beyond what would be expected by chance, thereby accounting for random guessing. The Kappa coefficient offers more robustness in model evaluation compared to simple accuracy.
The confusion matrices in Figure 7 illustrate classification results using both the full set of spectral bands and several individual wavelengths. In these matrices, blue cells denote the number of correctly classified samples, whereas orange cells represent misclassifications, with the color intensity corresponding to the magnitude. According to Figure 7, when all spectral reflectance information is employed, there are few misclassification cases, resulting in an accuracy close to 100%. Using only a single wavelength as the basis for classification leads to a noticeable increase in misclassifications and a substantial drop in accuracy. The classification accuracy and Kappa coefficient for each spectral band are presented in Table 2. It can be seen that using a single band alone results in much lower accuracy and Kappa values compared to using the full spectrum. Compared to using only a single channel for classification, utilizing multiple spectral channels can indeed improve classification accuracy.

3.3. Scanning Experiments

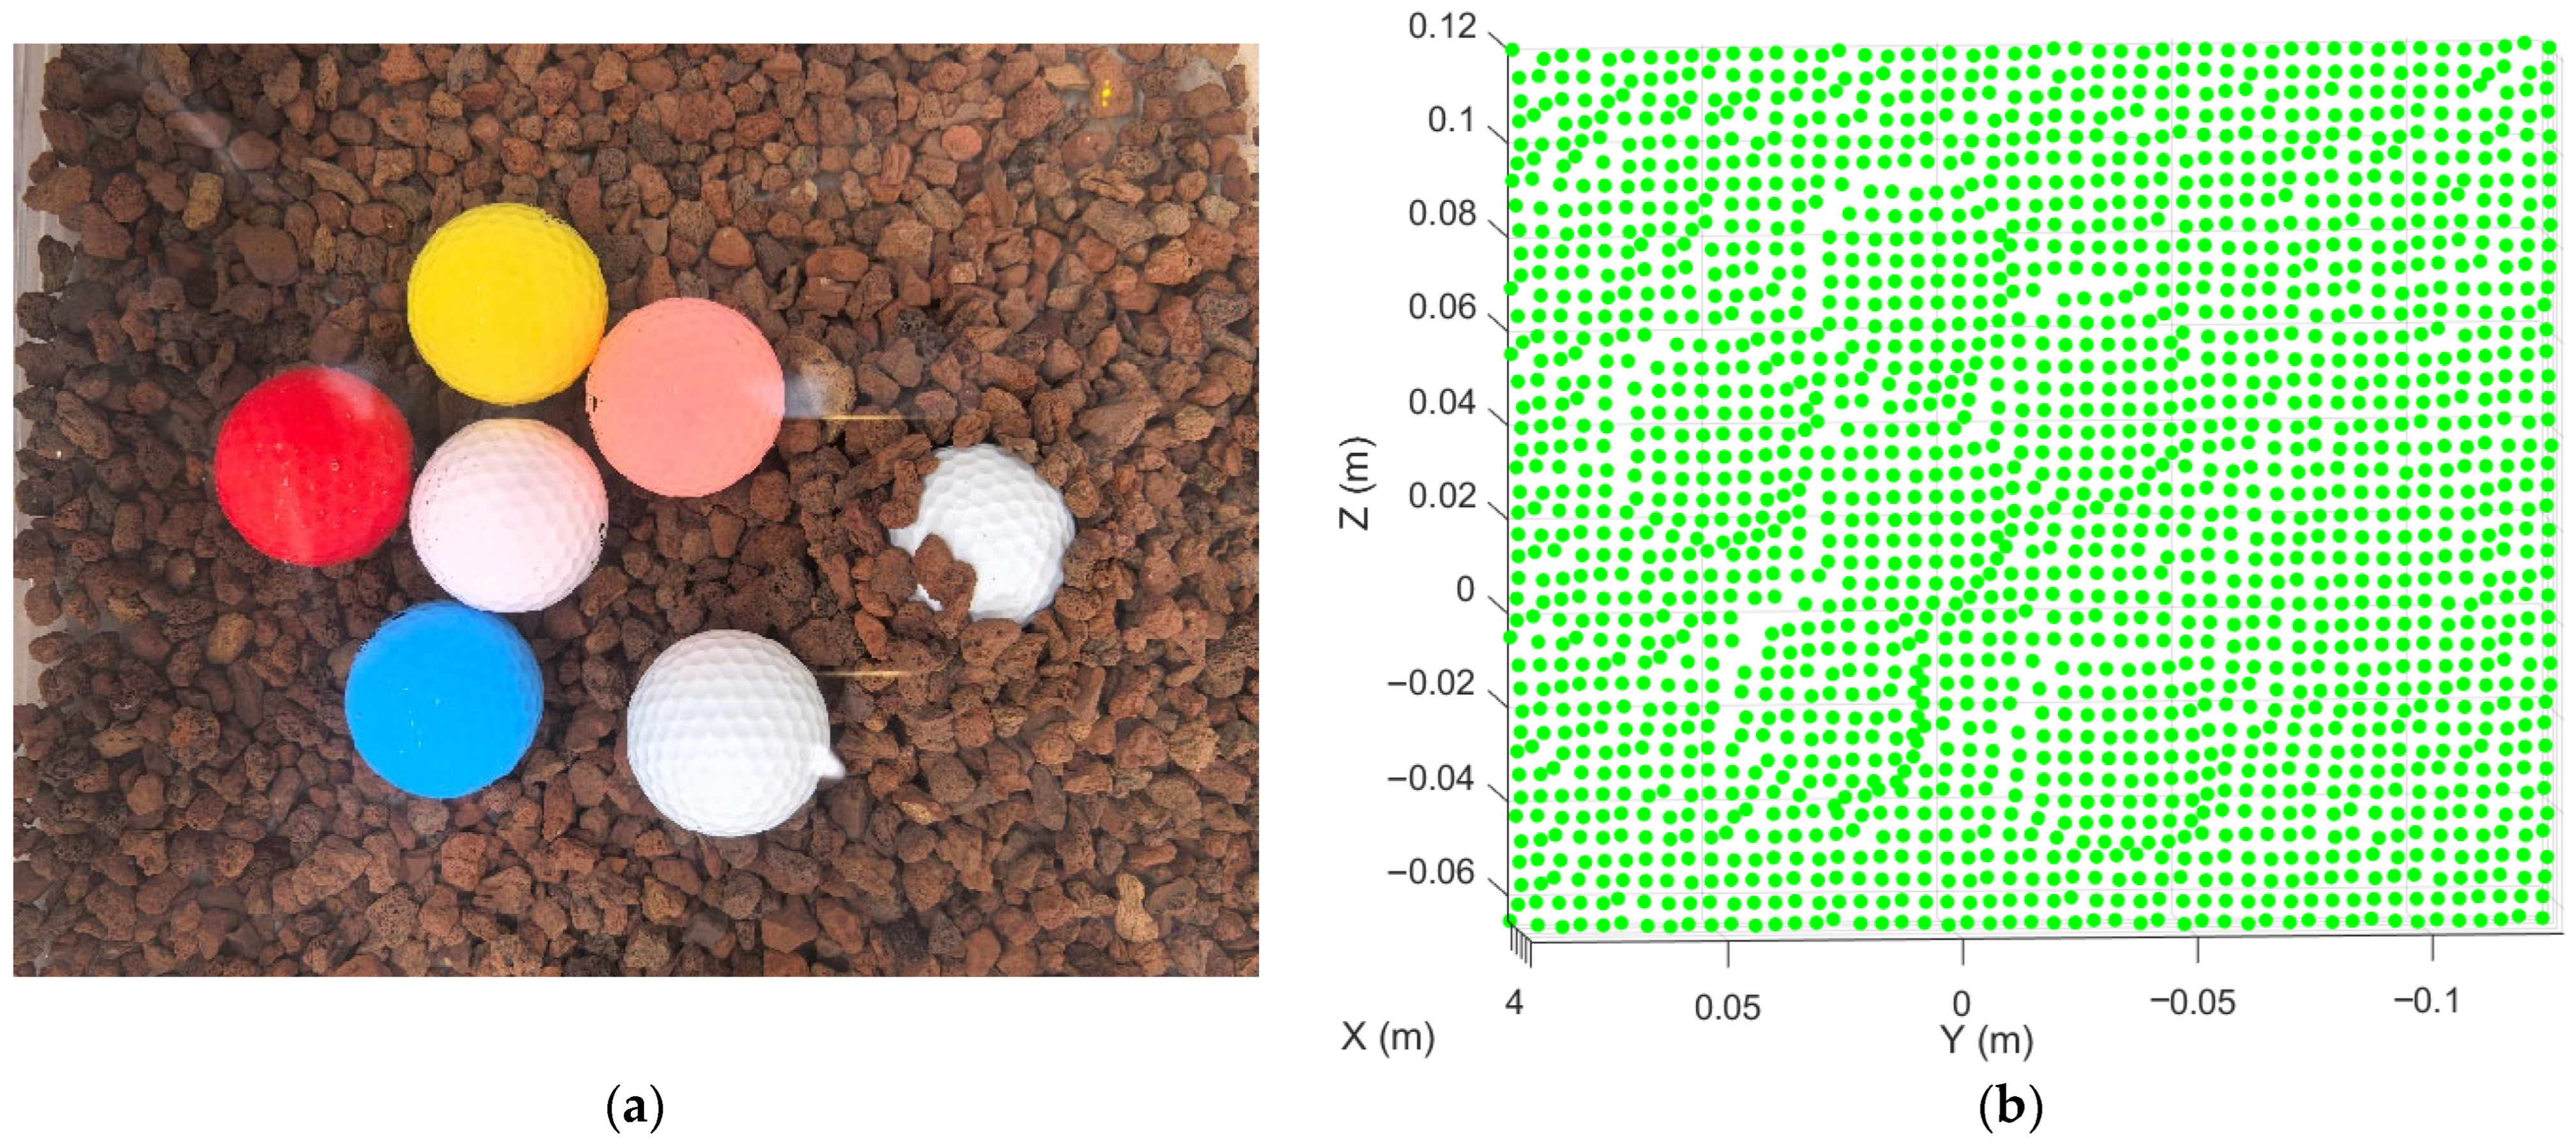
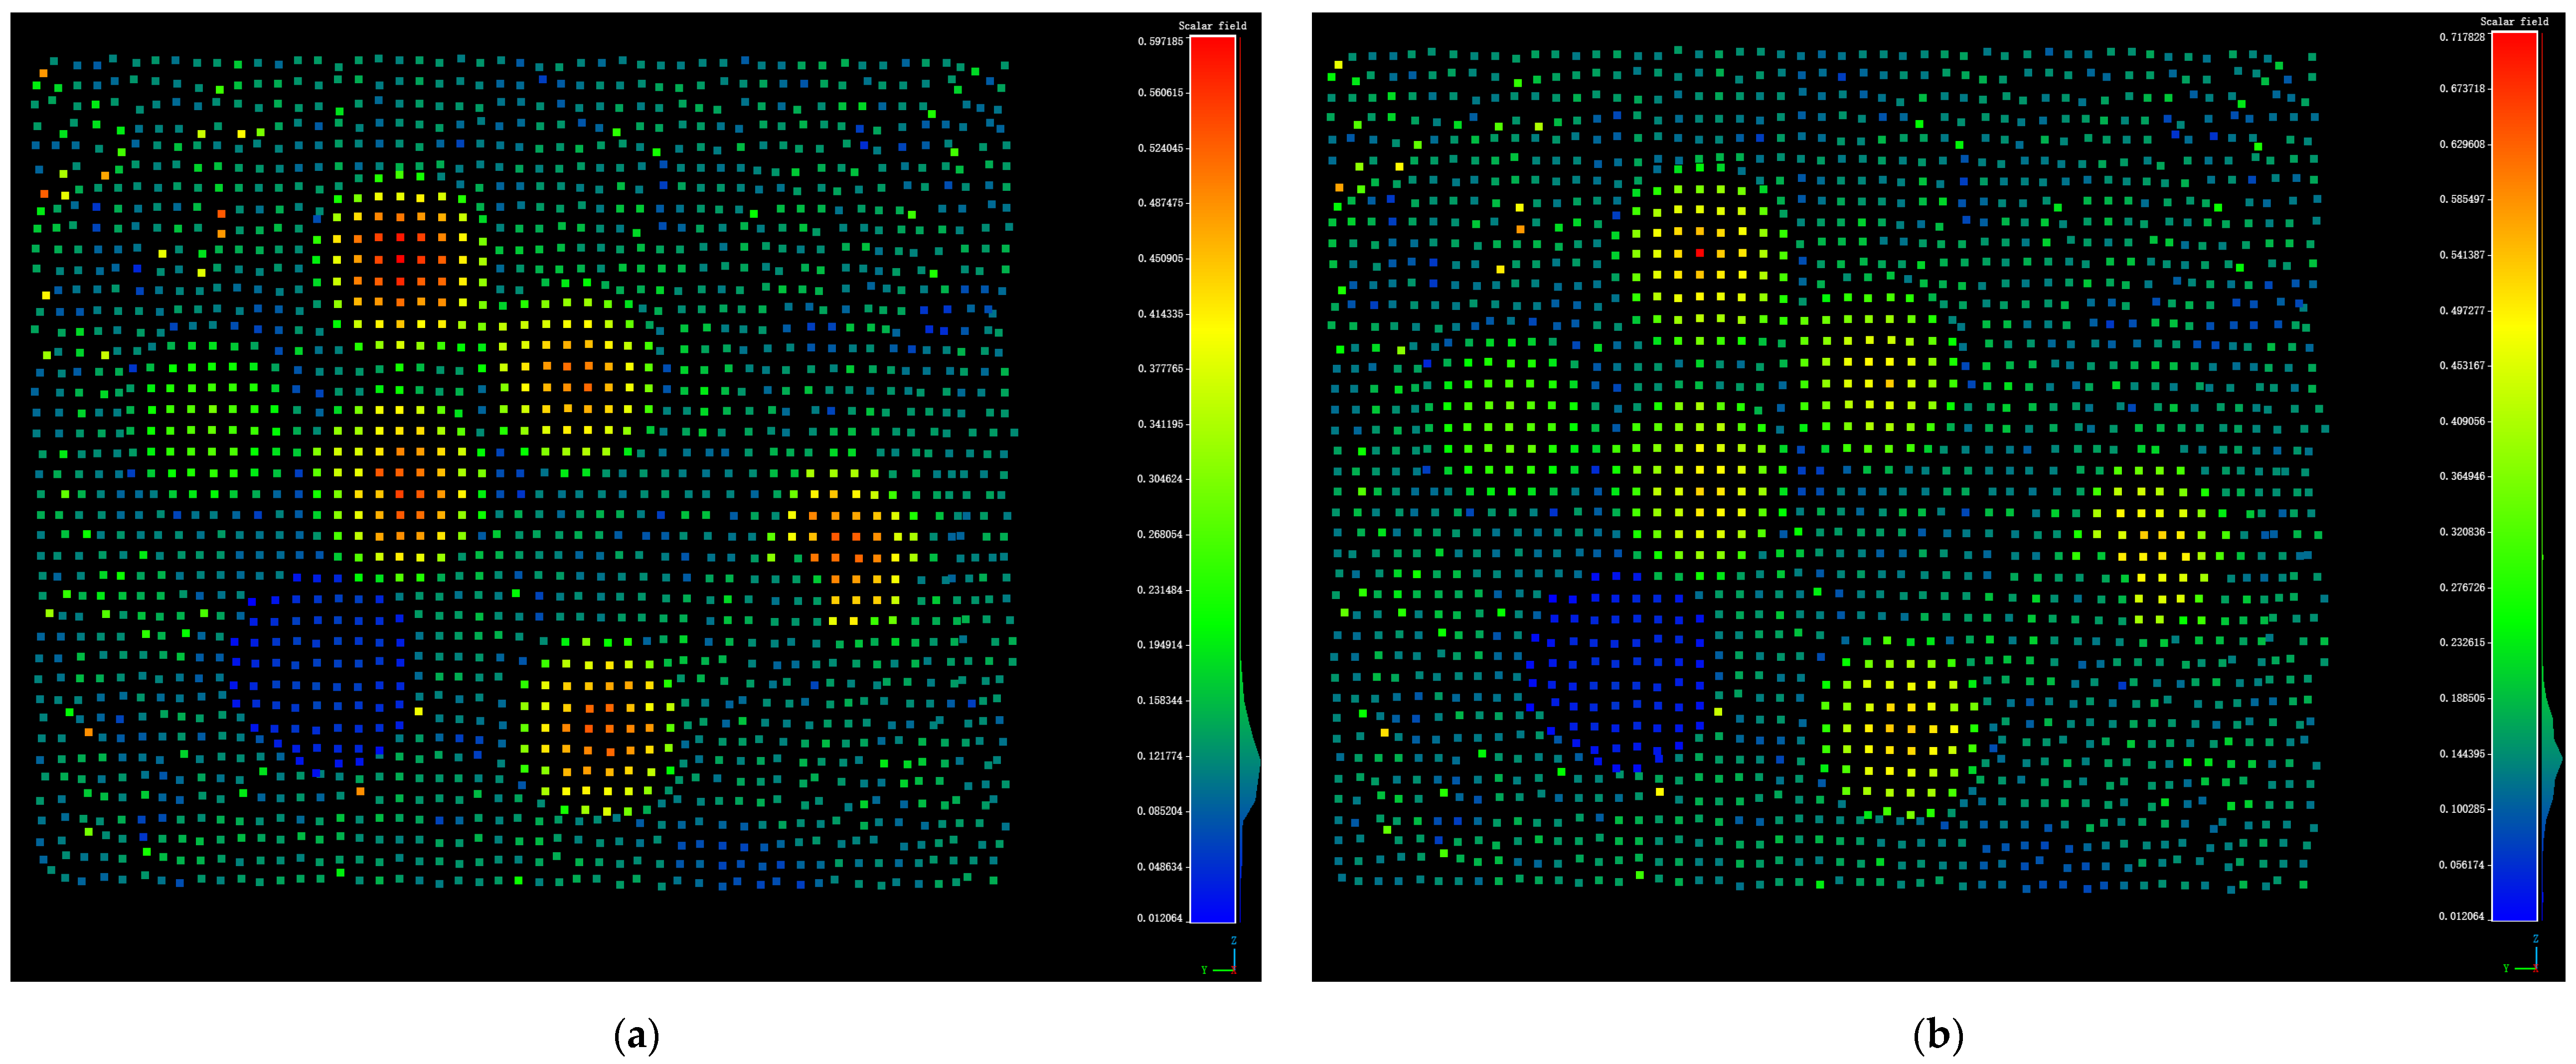
As illustrated in Figure 8a, various irregularly shaped volcanic rocks were arranged at the bottom of the water tank to serve as a background, along with differently colored golf balls stacked together, simulating realistic environmental conditions. Additionally, a white golf ball was partially embedded within the volcanic rocks to simulate a scenario where a golf ball is partially buried. After adjusting the scanning parameters, the constructed MSL system is utilized to scan the scene. The 3D coordinates of experimental materials are calculated through Equations (1) and (2) in MATLAB 2024a, and the obtained point cloud information is illustrated in Figure 8b.
Following calibration of the point cloud reflectance at each wavelength using Equation (3), reflectance images corresponding to different wavelengths are generated. Figure 9 presents the reflectance images at wavelengths of 600 nm, 680 nm, 720 nm, and 780 nm. The color of the point cloud in the image transitions from blue to red with increasing reflectance. It can be observed from Figure 9 that the blue ball has lower reflectance at 600 nm, 680 nm, and 720 nm wavelengths, while its reflectance increases at 780 nm, which is consistent with the changes in the reflectance curve presented in Figure 6. Differences in reflectance exist between the other balls and the background, making it possible to identify the contours of golf balls based on their reflectance values. The reflectance of the partially buried white golf ball within the volcanic stones significantly differs from its surrounding background. Spectral characteristics derived from the scanned multispectral point cloud are valuable for further studies on point cloud classification.

4. Conclusions

In this paper, a multispectral LiDAR system was built based on an AOTF to collect spectral data for underwater spheres in the 560–800 nm range with a 20 nm spectral interval and precise range measurements with a 0.75 cm range resolution, and we demonstrate the viability of using multispectral LiDAR for classifying underwater spheres, showing high accuracy in controlled laboratory settings. Furthermore, spectral reflectance curves of different spheres were plotted, allowing for a visual comparison of their reflectance values across various wavelengths. The data were classified using an SVM. When the full set of reflectance data across all wavelengths was utilized, the accuracy reached nearly 100%, with the Kappa coefficient approaching 1. Classification performance deteriorated when relying on single-wavelength reflectance, as evidenced by reduced accuracy and Kappa values, which reveals enhanced discrimination and improved classification performance by utilizing multiple spectral channels. In the final step, scanning experiments further validated the MSL system’s performance. Differences in reflectance exist between the other balls and the background, making it possible to identify the contours of golf balls based on their reflectance values, which will be informative for further studies on point cloud classification.
Nevertheless, this work is limited by the absence of field experiments and investigation into target reflectance and classification results across water with different inherent optical properties (IOPs), which significantly influence the backscattered signals at various wavelengths [28]. Investigating practical applications will be a primary direction for future research, which would help further validate the feasibility of using multispectral LiDAR for retrieving underwater golf balls.

Author Contributions

Conceptualization, H.Z.; Methodology, H.Z.; Software, Y.M.; Validation, Y.M.; Formal analysis, Y.M., B.L. and F.H.; Investigation, Y.M.; Resources, Y.M. and F.H.; Data curation, H.Z., B.L. and F.H.; Writing—original draft, Y.M.; Visualization, R.W. and F.H.; Supervision, T.H., Y.W. and F.H.; Project administration, F.L. and T.H.; Funding acquisition, F.L. and F.H. All authors have read and agreed to the published version of the manuscript.

Funding

National University of Defense Technology Youth Independent Innovation Science Fund (ZK23-49), National Natural Science Foundation of China Projects under Grant (62205372), Independent Innovation Fund of State Key Laboratory of Pulsed Power Laser Technology (KY23C609).

Data Availability Statement

The data presented in this study are available on request from the corresponding authors.

Conflicts of Interest

The authors declare no conflict of interest.

References

  1. Raffel, T.R.; Long, P.R. Retention of golf ball performance following up to one-year submergence in ponds. Int. J. Golf. Sci. 2023. [Google Scholar]
  2. Karins, J. Up to Par: Guaranteeing the Right of Quality Control in the Golf Ball Refurbishment Industry. J. Int’l Bus. L. 2019, 19, 105. [Google Scholar]
  3. Cong, Y.; Gu, C.; Zhang, T.; Gao, Y. Underwater robot sensing technology: A survey. Fundam. Res. 2021, 1, 337–345. [Google Scholar] [CrossRef]
  4. Bleier, M.; Nüchter, A. Low-Cost 3d Laser Scanning in Air Orwater Using Self-Calibrating Structured Light. The International Archives of the Photogrammetry. Remote Sens. Spat. Inf. Sci. 2017, 42, 105–112. [Google Scholar]
  5. Zhen, Z.; Quackenbush, L.J.; Zhang, L. Trends in Automatic Individual Tree Crown Detection and Delineation—Evolution of LiDAR Data. Remote Sens. 2016, 8, 333. [Google Scholar] [CrossRef]
  6. Taubert, F.; Fischer, R.; Knapp, N.; Huth, A. Deriving tree size distributions of tropical forests from Lidar. Remote Sens. 2021, 13, 131. [Google Scholar] [CrossRef]
  7. Caspari, G. The potential of new LiDAR datasets for archaeology in Switzerland. Remote Sens. 2023, 15, 1569. [Google Scholar] [CrossRef]
  8. Jones, L.; Hobbs, P. The application of terrestrial LiDAR for geohazard mapping, monitoring and modelling in the British Geological Survey. Remote Sens. 2021, 13, 395. [Google Scholar] [CrossRef]
  9. Lu, B.; Dao, P.; Liu, J.; He, Y.; Shang, J. Recent Advances of Hyperspectral Imaging Technology and Applications in Agriculture. Remote Sens. 2020, 12, 2659. [Google Scholar] [CrossRef]
  10. Mirzaie, M.; Darvishzadeh, R.; Shakiba, A.; Matkan, A.A.; Atzberger, C.; Skidmore, A. Comparative analysis of different uni- and multi-variate methods for estimation of vegetation water content using hyper-spectral measurements. Int. J. Appl. Earth Obs. Geoinf. 2014, 26, 1–11. [Google Scholar] [CrossRef]
  11. Diatmiko, G.P.K. Design and Verification of a Hyperspectral Imaging System for Outdoor Sports Lighting Measurements. Master’s Thesis, Itä-Suomen Yliopisto, Kuopio, Finland, 2023. [Google Scholar]
  12. Calin, M.A.; Parasca, S.V.; Savastru, D.; Manea, D. Hyperspectral imaging in the medical field: Present and future. Appl. Spectrosc. Rev. 2014, 49, 435–447. [Google Scholar] [CrossRef]
  13. Sun, G.; Jiao, Z.; Zhang, A.; Li, F.; Fu, H.; Li, Z. Hyperspectral image-based vegetation index (HSVI): A new vegetation index for urban ecological research. Int. J. Appl. Earth Obs. Geoinf. 2021, 103, 102529. [Google Scholar] [CrossRef]
  14. Sture, Ø.; Ludvigsen, M.; Aas, L.M.S. Autonomous underwater vehicles as a platform for underwater hyperspectral imaging. In Proceedings of the OCEANS 2017—Aberdeen, Aberdeen, UK, 19–22 June 2017; pp. 1–8. [Google Scholar]
  15. Ødegård, Ø.; Mogstad, A.A.; Johnsen, G.; Sørensen, A.J.; Ludvigsen, M. Underwater hyperspectral imaging: A new tool for marine archaeology. Appl. Opt. 2018, 57, 3214–3223. [Google Scholar] [CrossRef]
  16. Chen, Y.; Lin, Z.; Zhao, X.; Wang, G.; Gu, Y. Deep Learning-Based Classification of Hyperspectral Data. IEEE J. Sel. Top. Appl. Earth Obs. Remote Sens. 2014, 7, 2094–2107. [Google Scholar] [CrossRef]
  17. Yoon, J. Hyperspectral Imaging for Clinical Applications. BioChip J. 2022, 16, 1–12. [Google Scholar] [CrossRef]
  18. Hakala, T.; Suomalainen, J.; Kaasalainen, S.; Chen, Y. Full waveform hyperspectral LiDAR for terrestrial laser scanning. Opt. Express 2012, 20, 7119–7127. [Google Scholar] [CrossRef]
  19. Chen, Y.; Jiang, C.; Hyyppa, J.; Qiu, S.; Wang, Z.; Tian, M.; Li, W. Feasibility Study of Ore Classification Using Active Hyperspectral LiDAR. IEEE Geosci. Remote Sens. Lett. 2018, 15, 1785–1789. [Google Scholar] [CrossRef]
  20. Ray, P.; Salido-Monzú, D.; Camenzind, S.L.; Wieser, A. Supercontinuum-based hyperspectral LiDAR for precision laser scanning. Opt. Express 2023, 31, 33486–33499. [Google Scholar] [CrossRef]
  21. Morsdorf, F.; Nichol, C.; Malthus, T.; Woodhouse, I.H. Assessing forest structural and physiological information content of multi-spectral LiDAR waveforms by radiative transfer modelling. Remote Sens. Environ. 2009, 113, 2152–2163. [Google Scholar] [CrossRef]
  22. Chen, Y.; Luo, Q.; Guo, S.; Chen, W.; Hu, S.; Ma, J.; He, Y.; Huang, Y. Multispectral LiDAR-based underwater ore classification using a tunable laser source. Opt. Commun. 2024, 551, 129903. [Google Scholar] [CrossRef]
  23. Zhang, H.; Chen, L.; Wu, H.; Zhou, M.; Chen, J.; Chen, Z.; Hu, J.; Chen, Y.; Wang, J.; Niu, Y.; et al. Hyperspectral LiDAR for Subsea Exploration: System Design and Performance Evaluation. Electronics 2025, 14, 1539. [Google Scholar] [CrossRef]
  24. Liu, Q.; Liu, B.; Wu, S.; Liu, J.; Zhang, K.; Song, X.; Chen, X.; Zhu, P. Design of the ship-borne multi-wavelength polarization ocean lidar system and measurement of seawater optical properties. EPJ Web Conf. 2020, 237, 7007. [Google Scholar] [CrossRef]
  25. Chen, Y.; Li, W.; Hyyppä, J.; Wang, N.; Jiang, C.; Meng, F.; Tang, L.; Puttonen, E.; Li, C. A 10-nm Spectral Resolution Hyperspectral LiDAR System Based on an Acousto-Optic Tunable Filter. Sensors 2019, 19, 1620. [Google Scholar] [CrossRef]
  26. Chen, B.; Shi, S.; Gong, W.; Zhang, Q.; Yang, J.; Du, L.; Sun, J.; Zhang, Z.; Song, S. Multispectral LiDAR Point Cloud Classification: A Two-Step Approach. Remote Sens. 2017, 9, 373. [Google Scholar] [CrossRef]
  27. Gong, W.; Sun, J.; Shi, S.; Yang, J.; Du, L.; Zhu, B.; Song, S. Investigating the potential of using the spatial and spectral information of multispectral LiDAR for object classification. Sensors 2015, 15, 21989–22002. [Google Scholar] [CrossRef]
  28. Solonenko, M.G.; Mobley, C.D. Inherent optical properties of Jerlov water types. Appl. Opt. 2015, 54, 5392–5401. [Google Scholar] [CrossRef]
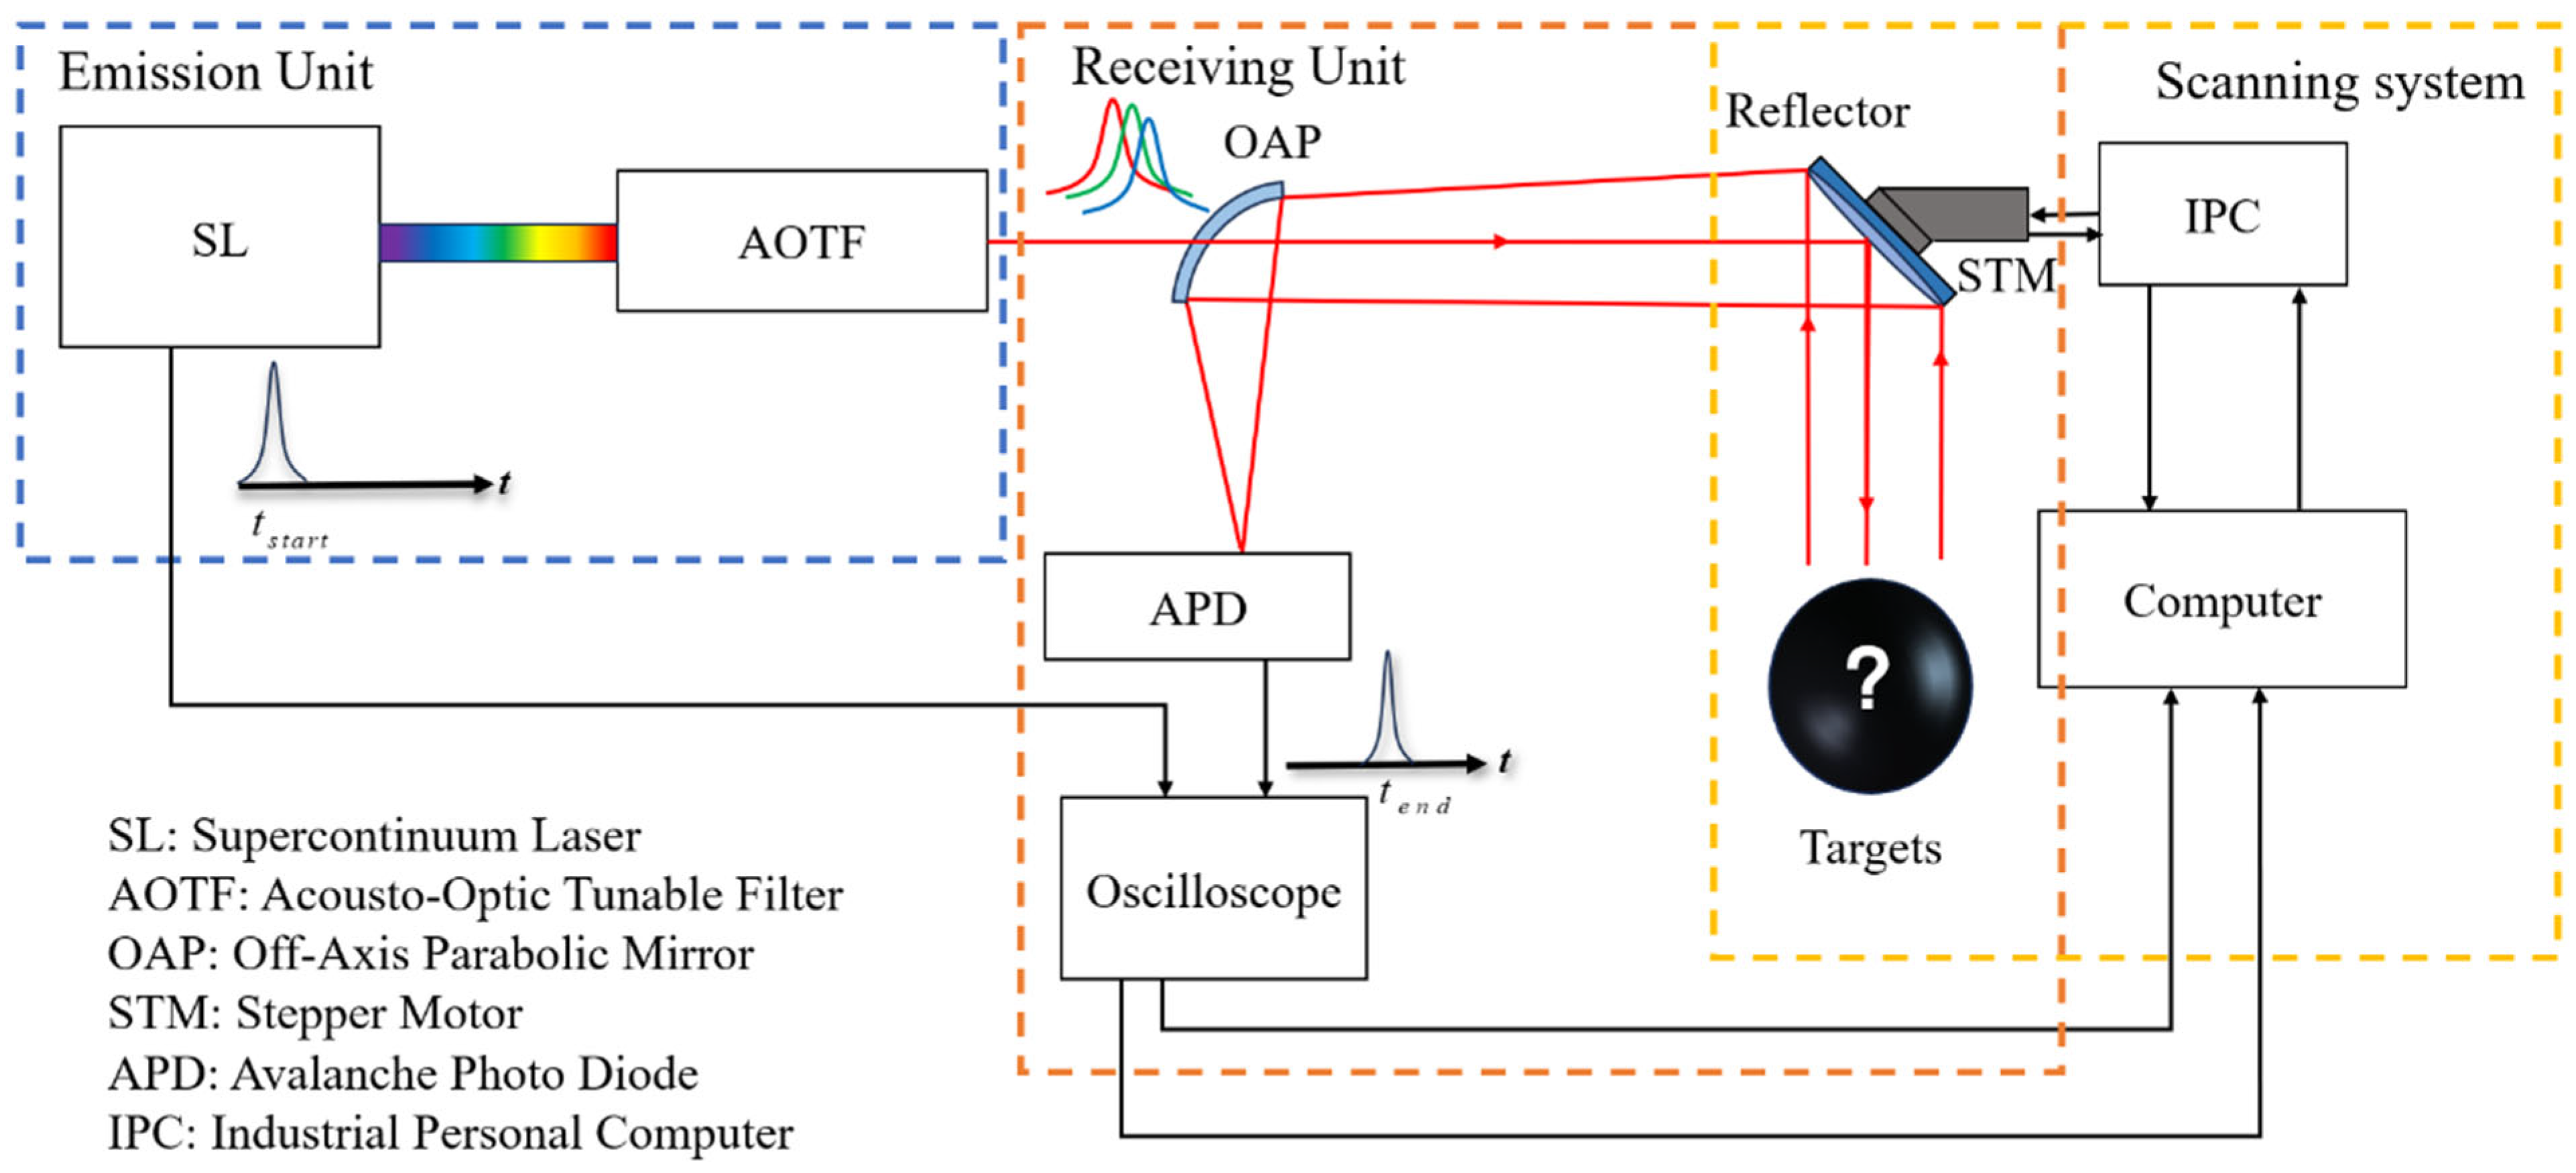
Figure 1. Schematic of the MSL.
Photonics 12 00998 g001
Figure 2. (a) Output spectrum of SuperK laser and (b) spectral response of APD210.
Photonics 12 00998 g002
Figure 3. MSL experimental setup and sphere samples. (a) MSL experimental setup (top right). The experiment was conducted in a low-light environment. (b) Standard sphere samples.
Photonics 12 00998 g003
Figure 4. The system’s scanning mechanism and a schematic diagram of the three-dimensional imaging experiment. (a) The zigzag scanning pattern of MSL. (b) The schematic diagram of a three-dimensional imaging experiment.
Photonics 12 00998 g004
Figure 5. Trigger signal and echo signal waveforms.
Photonics 12 00998 g005
Figure 6. Reflectance spectral profiles of the nine samples.
Photonics 12 00998 g006
Figure 7. Confusion matrices of sphere classification using different spectral bands. (a) All bands; (b) 560 nm; (c) 640 nm; (d) 700 nm.
Photonics 12 00998 g007
Figure 8. (a) Photograph of the scanning scene; (b) Point cloud of the experimental materials.
Photonics 12 00998 g008
Figure 9. Point cloud (Y-Z plane) of the scanning scene at different wavelengths: (a) 600 nm; (b) 680 nm; (c) 720 nm; (d) 780 nm.
Photonics 12 00998 g009aPhotonics 12 00998 g009b
Table 1. Measurement ranges of each spectral channel.
Wavelength (nm)Average Range (m)Standard Deviation (cm)Error (cm)
5604.0141.311.4
5803.9910.770.9
6003.9950.620.5
6204.0020.870.2
6403.9980.470.2
6603.9950.510.5
6804.0040.640.4
7003.9990.550.1
7203.9910.590.9
7403.9980.690.2
7603.9960.810.4
7804.0080.610.8
8003.9850.941.5
Table 2. Classification accuracy (%) and Kappa coefficient of different classifiers.
Spectral Bands (nm)Accuracy (%)Kappa Coefficient
All Spectral Bands98.70.986
56060.10.553
58063.30.588
60065.00.607
62058.00.529
64056.20.509
66056.30.511
68057.70.526
70057.60.527
72058.160.530
74057.00.518
76056.00.508
78045.60.391
80046.30.401
Disclaimer/Publisher’s Note: The statements, opinions and data contained in all publications are solely those of the individual author(s) and contributor(s) and not of MDPI and/or the editor(s). MDPI and/or the editor(s) disclaim responsibility for any injury to people or property resulting from any ideas, methods, instructions or products referred to in the content.