Article

Dual-Wavelength Confocal Laser Speckle Contrast Imaging Using a Deep Learning Approach

1
School of Microelectronics, Shenzhen Institute of Information Technology, Shenzhen 518172, China
2
Tsinghua Shenzhen International Graduate School, Tsinghua University, Shenzhen 518055, China
3
Guangzhou Institute of Technology, Xidian University, Guangzhou 510555, China
4
Shenzhen Stomatological Hospital, Southern Medical University, Shenzhen 518005, China
*
Authors to whom correspondence should be addressed.
Photonics 2024, 11(11), 1085; https://doi.org/10.3390/photonics11111085
Submission received: 28 October 2024 / Revised: 14 November 2024 / Accepted: 17 November 2024 / Published: 18 November 2024
(This article belongs to the Special Issue New Perspectives in Biomedical Optics and Optical Imaging)

Abstract

:
This study developed a novel dual-wavelength confocal laser speckle imaging platform. The system includes both visible and near-infrared lasers and two imaging modes: confocal and wide-field laser speckle contrast imaging. The experimental results confirm that the proposed system can be used to measure not only blood flow but also blood oxygen saturation. Additionally, we proposed a blood flow perfusion imaging method called BlingNet (a blood flow imaging CNN) based on the laser speckle contrast imaging technique and deep learning approach. Compared to the traditional nonlinear fitting method, this method has superior accuracy and robustness with higher imaging speed, making real-time blood flow imaging possible.

1. Introduction

Blood flow is an important hemodynamic parameter for measuring vital signs. Hemodynamic parameters reflect the functional indices of the microcirculatory system of organs such as the skin, brain, heart, liver and kidneys [1,2]. The real-time in vivo quantitative measurement of blood flow plays an important role in basic research in life sciences, clinical diagnosis, disease treatment and drug development [3]. In the past few decades, with the advancement of laser and related photonics technologies, new optical imaging and microscopy technologies have made many breakthroughs in the quantitative measurement of blood flow in vivo, and their resolution is usually beyond that of other angiography methods [4]. These blood flow measurement technologies mainly include laser speckle contrast imaging [5], laser Doppler flowmetry [6], optical coherence tomography [7], multiphoton microscopy [8] and diffusion correlation spectroscopy [9].
Laser speckle contrast imaging has the advantages of non-labeling, non-contact measurement, fast imaging speed and high resolution. Laser speckle contrast imaging technology can measure microcirculatory blood flow parameters such as the blood vessel diameter, blood flow velocity, blood perfusion and blood flow density of biological tissues, providing an effective technical means for analyzing the structure, function and metabolism of tissues and organs, and then realizing disease diagnosis, intraoperative monitoring and pathogenic mechanism research. Laser speckle contrast imaging technology can provide clear and accurate blood flow data to help doctors locate lesions accurately. It is also an important tool in clinical diagnosis and basic life sciences research, such as on fundus diseases, skin diseases, brain cognition and behavioral sciences [10]. Laser speckle imaging methods have been widely used in clinical practice, such as in the non-invasive surface blood flow imaging of the human retina [11], gums [12], epidermis [13] and limbs [14], as well as in the minimally invasive endoscopic and intraoperative imaging of the cerebral cortex [15], liver [16], gastrointestinal tract [17] and joints [18].
Currently, the type of laser speckle contrast imaging available on the market and used in scientific research is mostly based on wide-field optical imaging, in which the sample is uniformly illuminated with a laser beam and a camera is used to capture the two-dimensional laser speckle pattern. However, when the sample has a certain optical thickness, wide-field imaging will reduce the spatial resolution and contrast. Similarly, in laser speckle imaging, multiple scattered light from different depths in the sample makes it difficult to realize high-resolution blood flow imaging and quantification. In order to overcome this limitation, our research group adopted a line-scanning method and successfully developed a multifunctional laser speckle imaging system that carries out both wide-field laser speckle contrast imaging and confocal line-scanning laser speckle contrast imaging. A chicken embryo experiment was conducted to show that confocal laser speckle imaging can provide better blood flow quantification, spatial resolution and imaging depth than traditional blood flow imaging [19,20,21,22]. However, this system is based on single-wavelength imaging at 640 nm and can measure only blood flow; it cannot obtain blood oxygen saturation information. Dual-wavelength laser speckle contrast imaging (DW-LSCI) has been demonstrated to obtain superficial blood oxygenation and flow changes [23]. Therefore, a near-infrared laser light source can be introduced, allowing the system to measure blood flow and blood oxygen saturation simultaneously.
In addition to improving measurement accuracy by changing the optical path design in the laser speckle imaging system hardware, some research groups have also used machine learning algorithms to improve the accuracy of flow velocity measurements via laser speckle contrast imaging. Traditional laser speckle contrast imaging extracts information on blood perfusion in biological tissues using a nonlinear fitting method [10]. The temporal resolution of this computationally intensive method cannot meet the needs of in vivo real-time imaging in clinical practice. Recently, deep learning technology has continued to improve [24,25] and has been increasingly used in fundamental biomedical research, diagnosis and treatment [26]. Convolutional neural networks (CNNs) [27] have received widespread attention in the field of image processing because they can automatically extract locally related features in images. Using this method instead of the nonlinear fitting method in traditional laser speckle contrast imaging can greatly improve the accuracy of blood flow imaging and effectively promote the application of this technology in clinical practice. Ivan Stebakov et al. combined speckle contrast imaging and deep learning methods to recognize the flow rate of physiological fluids. They demonstrated that the application of mean spatial speckle contrast imaging with an artificial neural network increased the fluid flow rate recognition accuracy from about 65% to 89% [28]. Moreover, Yu et al. used a model-free machine learning approach based on a convolutional neural network and demonstrated the potential of convolutional networks to provide relative blood flow maps from speckle data in real time [29].
In order to enable the confocal laser speckle contrast imaging system to simultaneously obtain blood flow and blood oxygen saturation information of deep tissues and improve the accuracy of flow velocity measurements, we developed a novel dual-wavelength confocal laser speckle imaging setup and combined it with a deep learning algorithm. Using this setup, we conducted blood flow and blood oxygen saturation measurements and processed blood flow imaging with deep learning methods. The rest of this paper is structured as follows: The instrumentation, theoretical models and data-processing details are disclosed in the Material and Method section. Images obtained from chicken embryos are presented in the Results section. The performance results of various operation modes are compared and fully discussed in the Results and Discussion and Conclusions sections.

2. Materials and Methods

2.1. DW-LSCI Imaging Setup

Shown in Figure 1 is a physical configuration and optical path diagram of the dual-wavelength confocal laser speckle contrast imaging system (DW-LSCI). The light sources are two solid-state single-frequency lasers with a wavelength of 640 nm (DL640-100-S0, CrystaLaser, Reno, NV, USA) and 785 nm (DL785-300-S0, CrystaLaser, Reno, NV, USA), respectively. A dichroic mirror (DM) (DMLP605, Thorlabs, Newton, NJ, USA) is used to merge the two laser beams to the same optical path. A half-wave plate (AHWP05M-600, Thorlabs, Newton, NJ, USA) is used to rotate the polarization direction of the laser so that most of the laser beam can pass through a polarization beam splitter (CCM1-PBS252/M, Thorlabs, NJ, USA). A beam expander (GCO-2506, Daheng Optics, Beijing, China) is used to expand the collimated laser beam to cover a larger illumination area. A cylindrical lens (ACY254-050-A, Thorlabs, Newton, NJ, USA) is used to converge the light into one dimension and form a line illumination. A one-dimensional galvanometer (GVS011/M, Thorlabs, Newton, NJ, USA) is used to scan the sample surface. The backscattered photons from the sample are collected by the lens, passed through the galvanometer and returned along the detection light path. The image sensor (Zyla 5.5 scientific CMOS, Andor, Oxford, UK) has two working modes: line-scanning imaging and area image acquisition (the cylindrical lens needs to be removed). In order to minimize the specular reflection of the optical surface along the illumination light path, a linear polarizer (LPNIRE100-B, Thorlabs) is placed after the beam splitter and its direction is set perpendicular to the polarization direction of the illumination beam. A data acquisition card (USB-6212, National Instruments, Austin, TX, USA) and a homemade LabVIEW program are used to synchronize the Galvo mirror and the camera. The confocal laser speckle imaging system includes two imaging modes: traditional wide-field laser speckle imaging and novel high-resolution confocal laser speckle imaging. When in confocal mode, confocal detection line imaging conjugated with the illumination line beam or deviating from the confocal line can be used. In the LabVIEW program, the exposure time of the camera, the detection line, the number of scanning lines and the line-scanning region can all be adjusted.

2.2. Principle of Speckle Contrast Imaging

Laser speckle contrast imaging is an optical imaging method based on laser speckle statistics. When the laser irradiates biological tissue, the incident coherent light is scattered by the scattering particles in the tissue, and the scattered light forms a random interference pattern. This pattern is called speckle. The movement of scattering particles in the tissue (red blood cells in blood vessels, etc.) will cause a phase change in the scattered light intensity signal, which will blur the speckle pattern. Speckle contrast is used to quantify the blur degree of this speckle pattern. It can qualitatively or semi-quantitatively characterize the blood flow velocity. The definition of K is as follows [5]:
K = σ I
where K is the speckle contrast, σ is the standard deviation of the scattered light intensity and <I> is the average intensity of the scattered light. In analyzing the speckle contrast, information about blood perfusion in the tissue can be obtained. A 7 × 7-pixel square matrix is usually used to calculate spatial speckle contrast images. Then, a speckle contrast image can be converted into a velocity image using the following equations:
K = τ c 2 T [ 2 τ c T ( 1 e 2 T / τ c ) ] 1 / 2
υ = w τ c
where T is the camera exposure time, τC is the correlation time, w is the characteristic width of the Airy function and v is the flow velocity. According to Equations (2) and (3), the speckle contrast K can be used to characterize the flow velocity. Therefore, the speckle contrast image visualizes blood vessels carrying blood flow as darker areas against a brighter background. For faster speeds, K is smaller, and vice versa.

2.3. Principle of Blood Oxygenation Imaging

In optical measurements of hemoglobin concentration and oxygenation, we assume that the blood deoxygenated hemoglobin (Hb) and oxygenated hemoglobin (HbO2) are the dominant absorbing compounds at two wavelengths. Then, the hemoglobin oxygen saturation (SO2), which refers to the percentage amount of oxygen in the blood, can be calculated using the detected optical absorptions at the two applied wavelengths as follows [30]:
C H b O 2 C H b = ε H b O 2 λ 1 ε H b λ 1 ε H b O 2 λ 2 ε H b λ 2 1 μ a λ 1 μ a λ 2
S O 2 = C H b O 2 C H b O 2 + C H b = μ a λ 2 ε H b λ 1 μ a λ 1 ε H b λ 2 μ a λ 1 ( ε H b O 2 λ 2 ε H b λ 2 ) μ a λ 2 ( ε H b O 2 λ 1 ε H b λ 1 )
where SO2 is the hemoglobin oxygen saturation; μa is the absorption coefficient; ξHb and ξHbO2 are the known molar extinction coefficient of Hb and HbO2, respectively; and CHb and CHbO2 are the concentrations of the two forms of hemoglobin, respectively. In this paper, 640 nm and 785 nm are the two measured wavelengths.

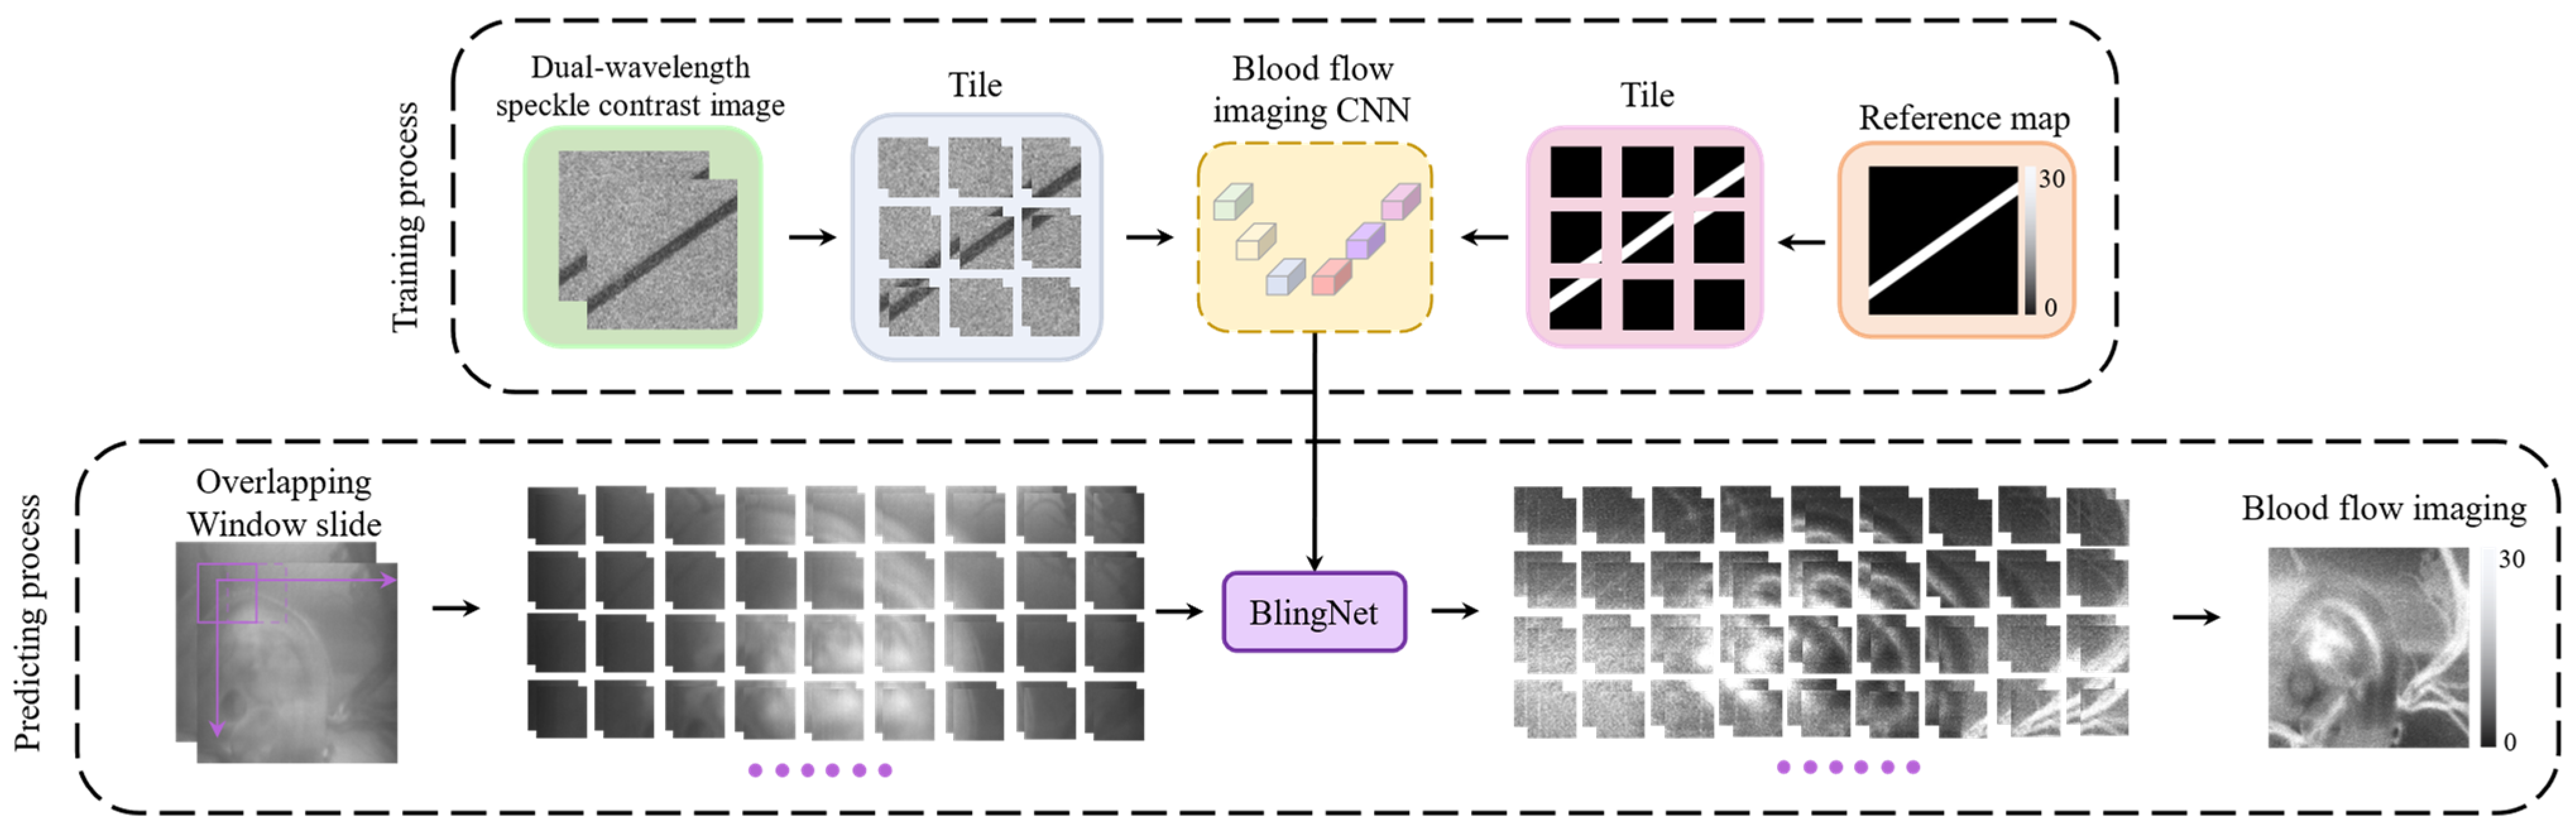
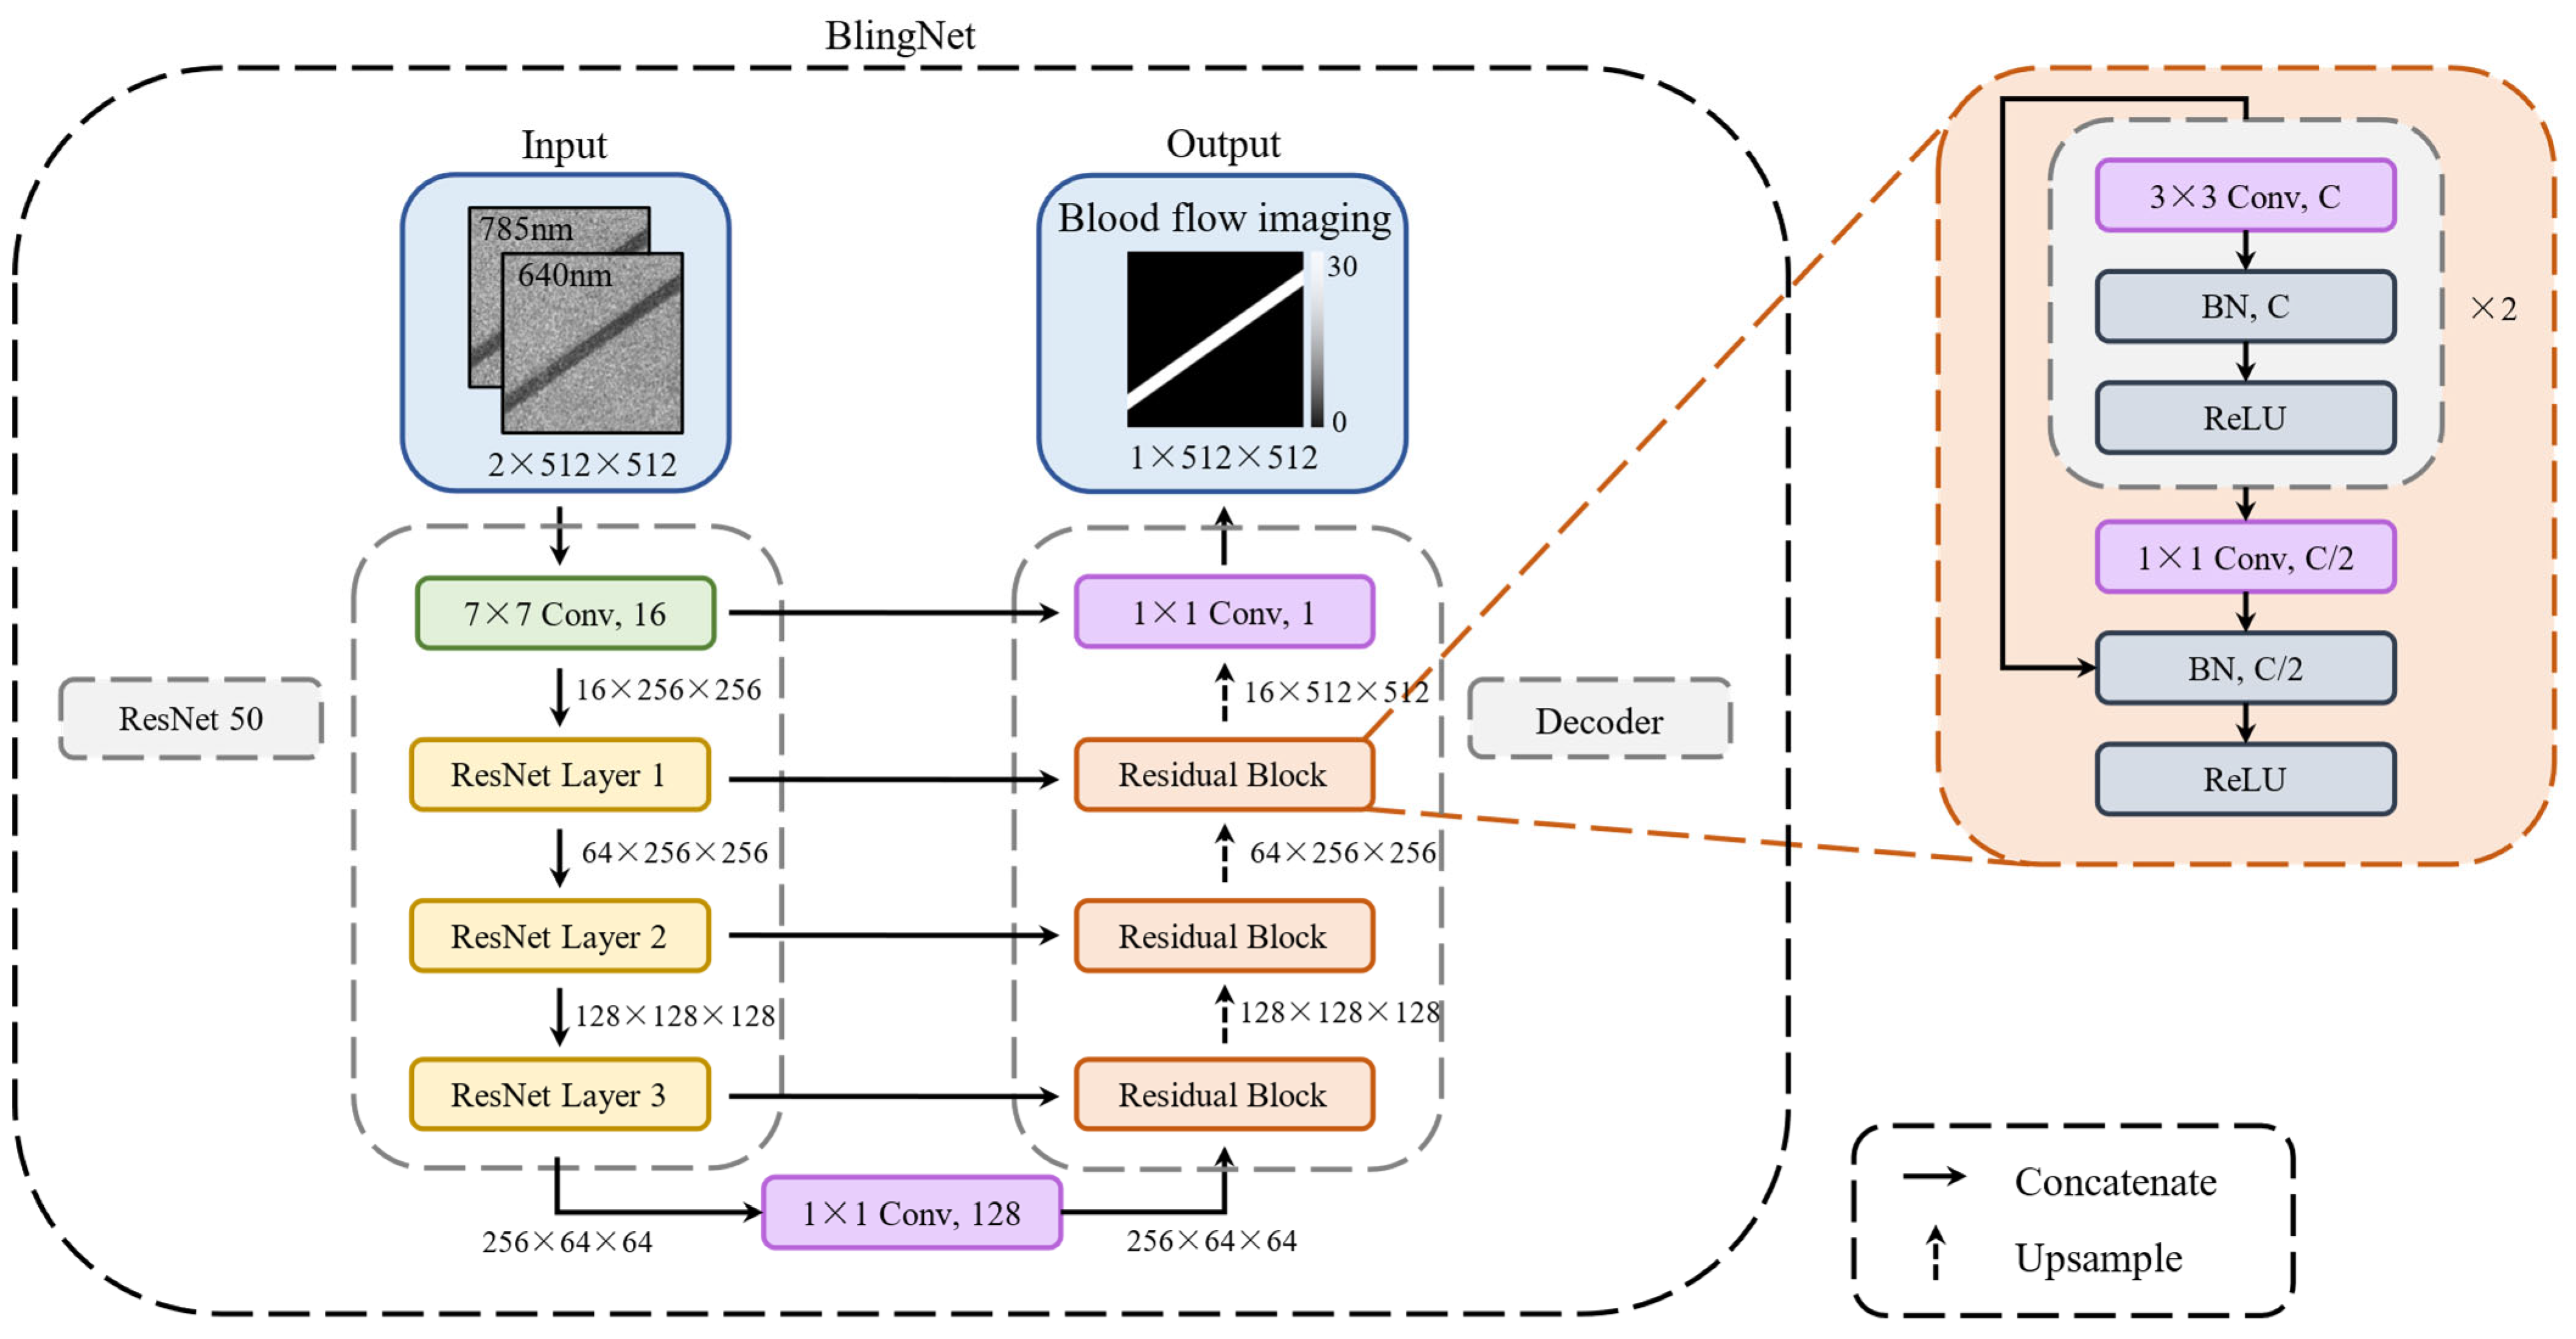
2.4. Deep Learning Framework of Blood Flow Imaging CNN (BlingNet)

The workflow of the proposed deep learning method for real-time laser speckle blood flow imaging is shown in Figure 2. The laser speckle contrast image and the reference perfusion velocity are collected with the help of a microfluidic chip to train the proposed convolutional neural network for real-time blood flow imaging. We acquired a total of 93 sets of samples containing data from 31 different flow rates (0 to 30 microliters per minute, with an interval of 1) and 3 different tube diameters (100, 300 and 500 μm), with the exposure time set to 2 ms. Since the active pixels of the sCMOS used in the dual-wavelength confocal laser speckle contrast imaging system is 2560 × 2160, high-resolution images require more memory and computing resources, which may lead to memory overflow during training. This can be circumvented using the window sliding technique.
Inspired by U-Net [24] and ResNet [31], we present a deep learning framework for dual-wavelength speckle contrast blood flow imaging. The architecture of our proposed blood flow imaging CNN (BlingNet) is shown in Figure 3, consisting of three down-sampling layers (Encoder) and three up-sampling layers (Decoder). We chose ResNet-50 pre-trained on ImageNet as our Encoder. Also, we constructed a Decoder consisting of multiple Residual Blocks, as shown in Figure 3. The choice of two loops of 3 × 3 convolutional layers (Conv) in a Residual Block can effectively increase the receptive field of the network without significantly increasing the computational complexity, thus better capturing the local feature information in the speckle contrast image. We employed max pooling and bilinear interpolation as our up-sampling and down-sampling methods, respectively. The application of a batch normalization (BN) layer and skip connection helps to speed up the convergence and improves the stability. The Rectified Linear Unit (ReLU) activation function is able to introduce nonlinearities and enhance the expressive power of BlingNet. It effectively avoids the gradient vanishing problem while maintaining computational efficiency, enabling the network to better learn complex nonlinear relationships.
During training, we adopted a simple strategy to crop the images into 2560 × 2048. Then, speckle contrast images and corresponding blood flow velocity reference maps were divided into 512 × 512 non-overlapping patches, and BlingNet was trained in a supervised manner. The speckle contrast images of two wavelengths were concatenated along the channel dimension, and we used a hybrid loss function consisting of a cross-entropy loss function [32] and a Dice loss function [33]. The Adaptive Moment Estimation (ADAM) optimizer was used for optimizing weights and biases, with an initial learning rate of 1 × 10⁻⁴ and a weight decay of 1 × 10⁻⁵. Early stopping with a patience of 20 epochs and a maximum of 200 epochs was used to monitor the validation loss. The batch size was set to 8. In the prediction stage, we separated the laser speckle contrast images of chicken embryos into 512 × 512 overlapping patches using the window sliding method with a step of 256, which were predicted separately and then synthesized into 2560 × 2048 blood perfusion maps. It is worth emphasizing that numerous areas were predicted more than once with this approach. We resolved this conflict by majority rule. All experiments were conducted on a GeForce RTX 4090 (NVIDIA Santa Clara, CA, USA).

2.5. Sample Preparation

All experiments with chicken embryos in this article have been reviewed and approved by the Institutional Animal Care and Use Committee of the Shenzhen Institute of Information Technology. Fertilized eggs were obtained from a local poultry farm. Chicken embryos were incubated at a temperature of 38.5 °C and a humidity of 75%. On embryonic day 4, a hole was punctured at the top where the air pocket was located using blunt forceps. The shell membrane was then removed with sharp forceps until the entire embryo could be seen, and the processed chicken embryo was placed on the sample stage. The chicken embryo was then illuminated and imaged using a confocal laser speckle imaging system.

3. Results

3.1. Flow Phantom Experiment

Lipofundin MCT/LCT (4%) solutions (B.Braun Melsungen AG, Melsungen, Germany) were poured into a polyethylene tube (5 mm inner diameter) from 0 to 18 mm/s using a digital syringe pump (FluidicLab, Shanghai, China). As shown in Figure 4, the speed set by the syringe pump was changed, and the experimental results of the laser speckle contrast in the confocal mode at different speeds were measured. It can be seen from Figure 4 that when the flow rate is 0, due to the Brownian motion of the scattering particles, the measured speckle contrast K is about 0.4 under the camera exposure time of 1 ms. When the speed of the scattering particles increases, the K value also decreases, and when the speed exceeds 10 mm/s, the change in K is not obvious. Therefore, if a higher measurement speed is expected, exposure time needs to be reduced. This phantom experiment result also confirms that laser speckle contrast K can be used to characterize the flow speed.

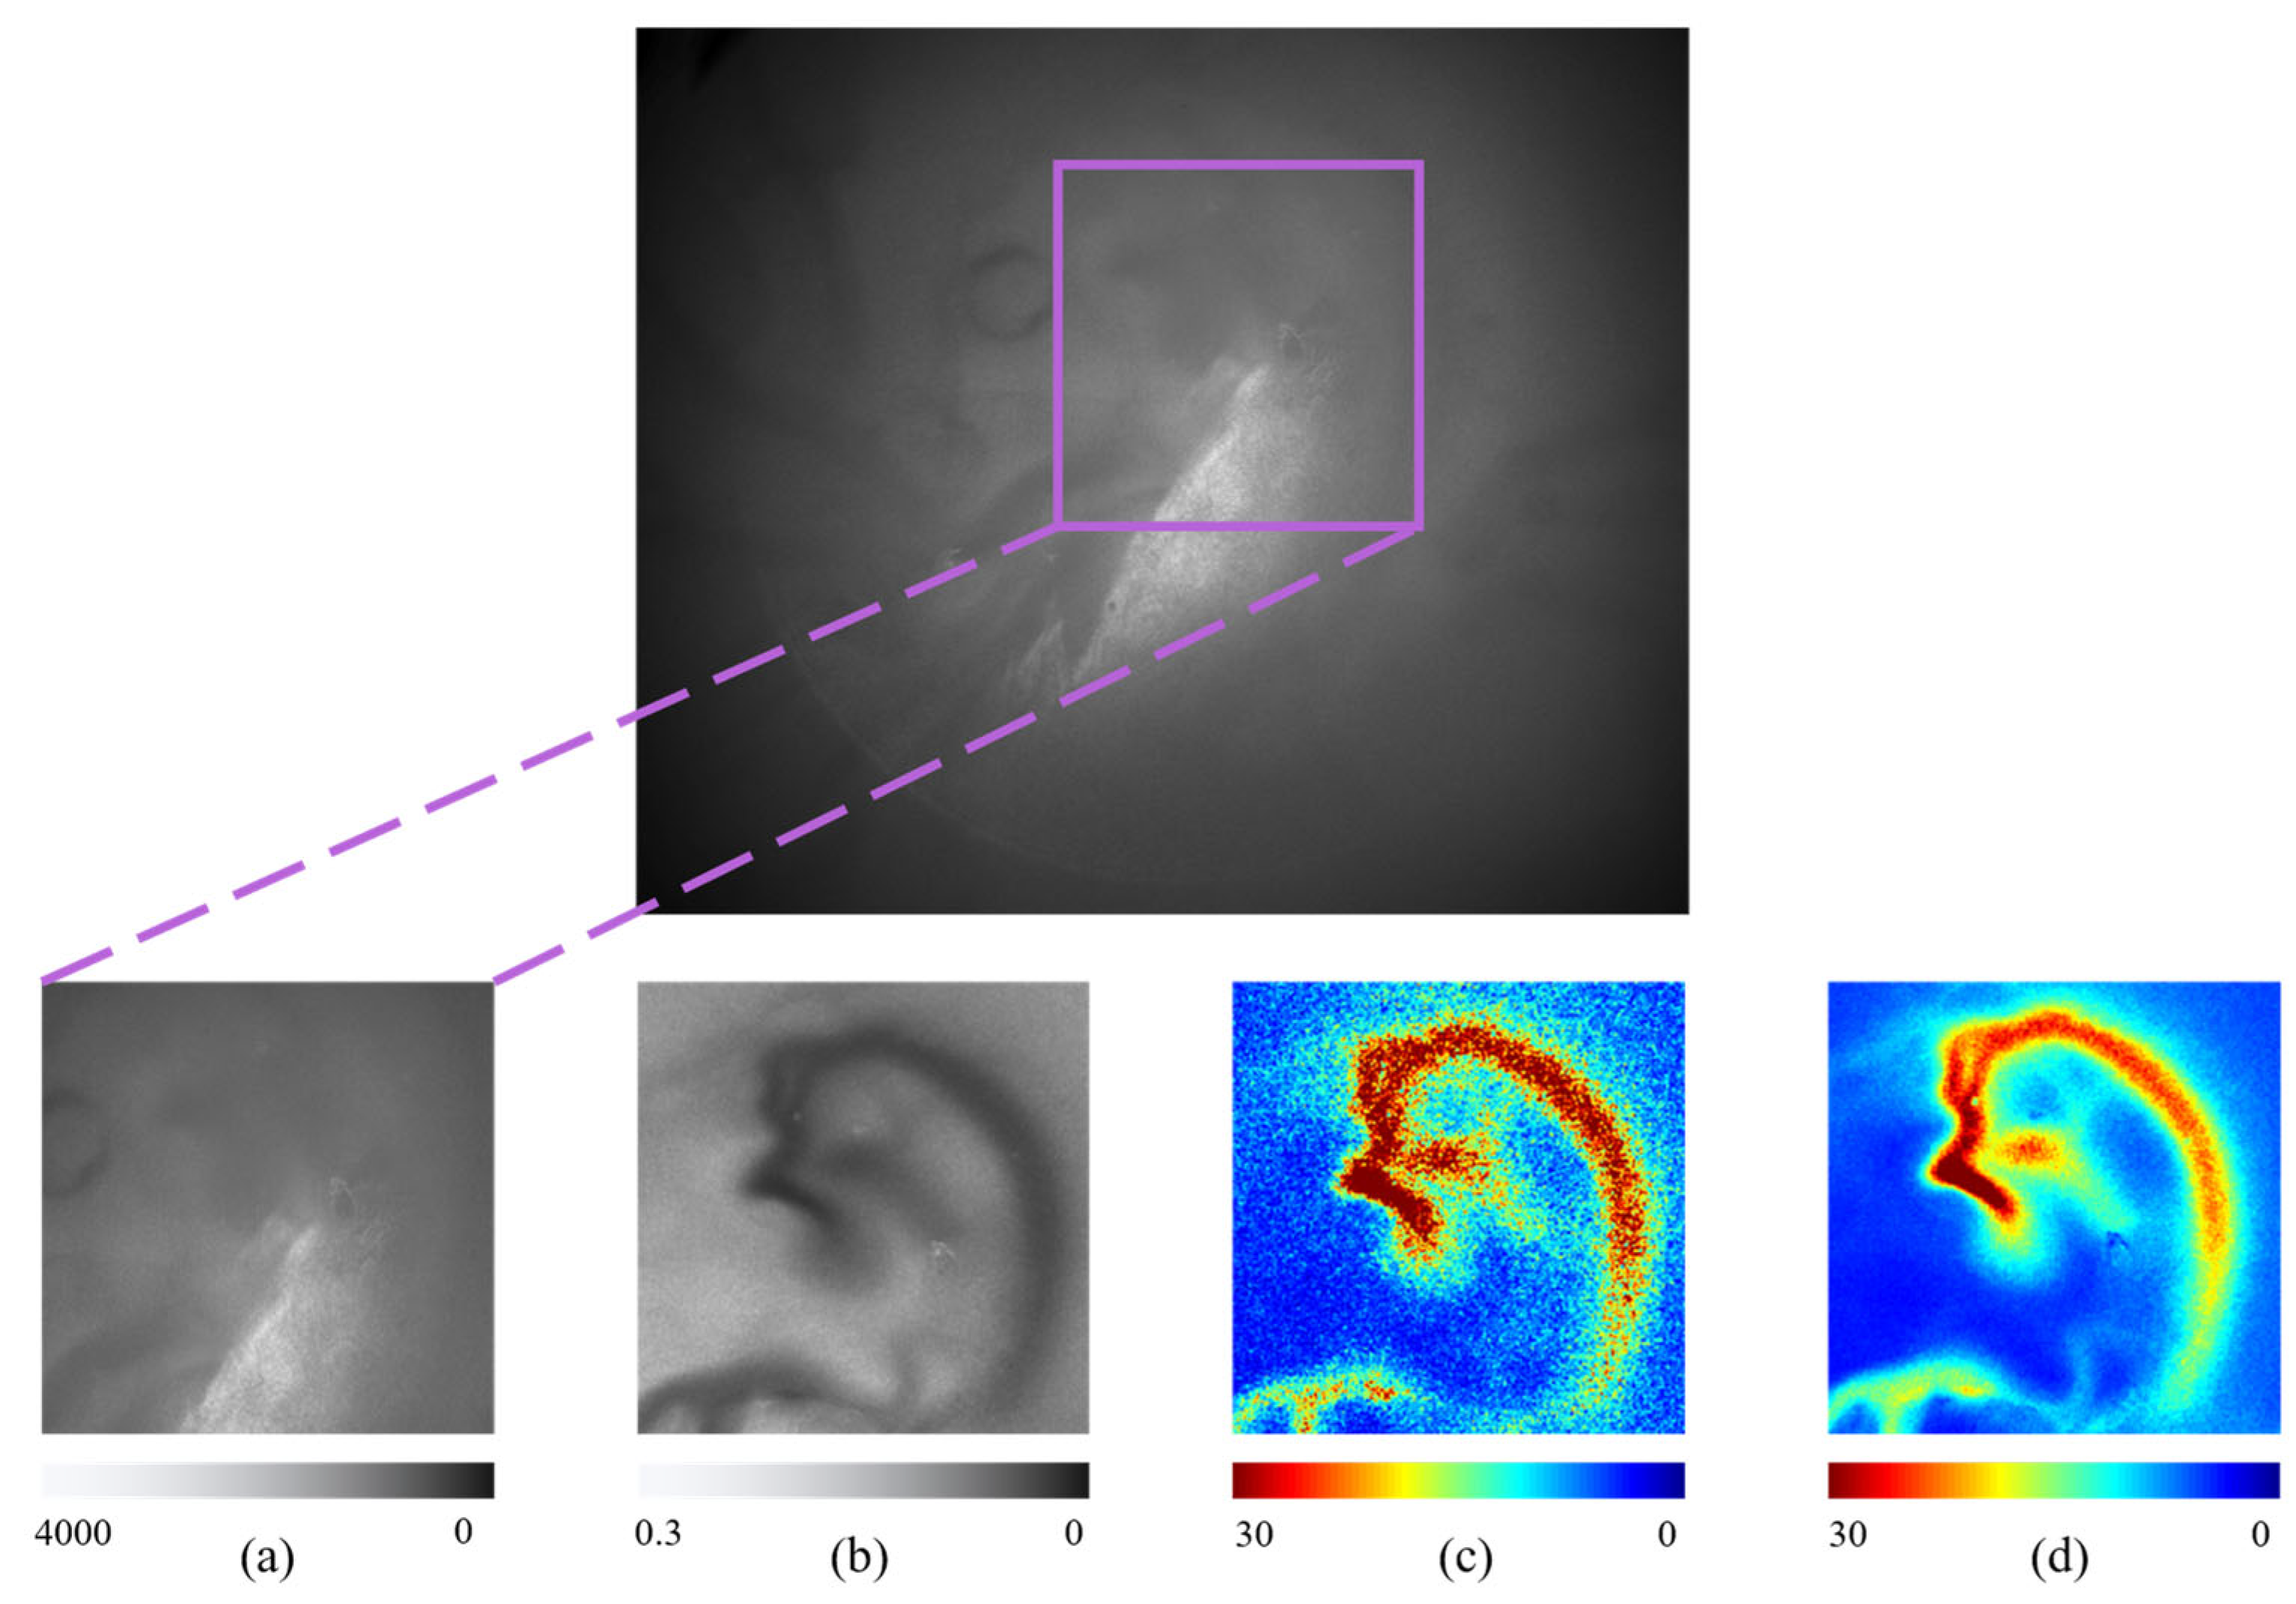
3.2. Blood Flow Imaging of the Deep Tissue

Figure 5a,b are a light intensity image and blood flow velocity image of the chicken embryo (day 4) in wide-field mode, respectively, and Figure 5c,d are a light intensity image and blood flow velocity image with an offset of 0.4 mm in confocal mode, respectively. The black dots in Figure 5b are due to the overexposure of the raw speckle images. This is because high exposure was utilized to ensure the other small vessel areas were visible. The source-detector separation offset distance of 0.4 mm was chosen empirically to compromise between imaging depth and spatial resolution. In comparing Figure 5b,d, it can be seen that the heart of the chicken embryo (circled by the red region) is not displayed in the wide-field mode; however, in the confocal mode, with an offset of 0.4 mm, the heart of the chicken embryo can be measured, and this area is also the area with the largest blood flow. This is because, in the traditional wide-field mode, the heart is located deeper in the chicken embryo, where it cannot be detected. However, in the confocal mode, the blood flow information of deep tissue can be observed by changing the deviation distance between the light source and the detector. The experimental results also verify that the confocal mode has a deeper imaging depth than the traditional wide-field mode and can image the tissue morphology.

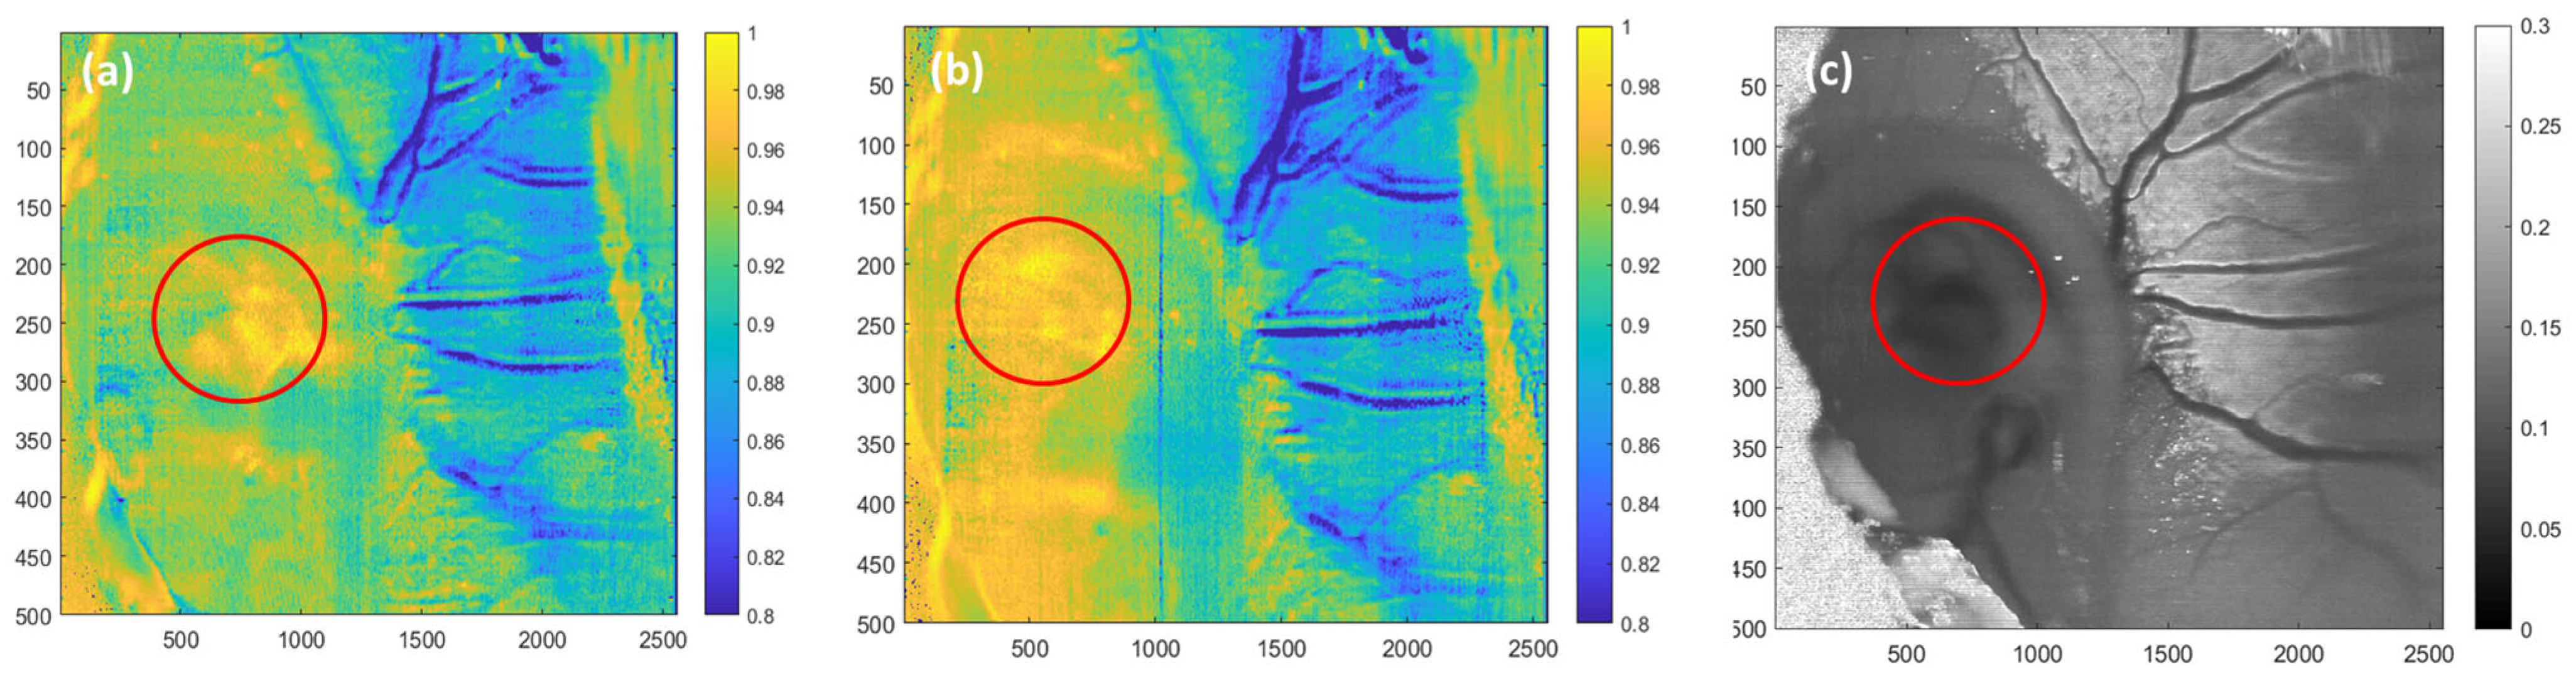
3.3. Hemoglobin Oxygen Saturation SO2 Imaging of the Deep Tissue

The dual-wavelength confocal laser speckle blood flow imaging system was used to acquire light intensity images under 640 nm and 785 nm. The distribution map of the blood oxygen saturation can be obtained using the blood oxygen saturation formula. Figure 6a,b are hemoglobin oxygen saturation SO2 images of chicken embryos (day 4) using an offset line detection of 0.8 mm and 1.6 mm, respectively; Figure 6c is the corresponding speckle contrast image. The red area circled in Figure 6 is the heart of the chicken embryo. A comparison of Figure 6a,b shows that increasing the deviation between the detector and the light source can obtain blood oxygen information from deeper tissue. It can be seen from Figure 6 that the blood oxygen saturation in the heart area of the chicken embryo is relatively high, close to 1, while the blood oxygen saturation in other areas is relatively low, approximately below 80%. This is because the blood oxygen saturation of arteries is greater than 90%, while the blood oxygen saturation of veins is around 60% to 70%. Therefore, the results are consistent with the blood oxygen saturation characteristics of arterial and venous blood.

3.4. Speckle Contrast Imaging Combined with Deep Learning Approach

To make a quantitative comparison between the traditional nonlinear fitting method and the deep learning approach, BlingNet, we conducted comprehensive experiments. It is important to note that the traditional nonlinear fitting method can only perform relative velocity measurements of blood flow. With the help of a microfluidic chip, we tested the traditional nonlinear fitting method and the deep learning approach at seven different flow rates (0 to 30 µL per minute, with an interval of 5), and then fit the measurements to a linear function with a slope of 45 degrees. The results demonstrate that BlingNet has a better linear correlation. The R-square value of BlingNet is 0.91, while the traditional nonlinear fitting method’s is 0.67.
Furthermore, we also designed a series of qualitative experiments to demonstrate the advantages of BlingNet more clearly. The heart area of the chicken embryo was selected as the region of interest and, as shown in Figure 7, we acquired a light intensity image of the chicken embryo (day 4) in con-focal line-scanning mode. Figure 7a demonstrates the light intensity of the area in the confocal line-scanning mode, and Figure 7b indicates the corresponding laser speckle contrast imaging. Figure 7c,d are blood flow images obtained based on the traditional nonlinear fitting method and the deep learning approach, respectively. It is evident that the vessel boundaries in Figure 7c lack clear definition, and the distribution of blood flow appears highly sparse. In comparison, Figure 7d has better contrast and the blood flow is centrally distributed in the heart of the chick embryo. Since the representation ability of the traditional nonlinear fitting method is affected by the data quality and the preset mathematical model, there is room for improvement in the robustness and accuracy of the overall performance. By comparison, it can be seen that the blood flow image predicted by the deep learning approach is smoother and has higher contrast than the traditional nonlinear fitting methods. This phenomenon may be attributed to the fact that traditional nonlinear fitting methods necessitate crucial hypotheses regarding the size of the scatterers in biological tissues, the range of the motion speed of the scatterers and the exposure time of the imaging, which significantly impacts their generalization performance and stability. Blood flow imaging based on the deep learning approach has shown certain advantages. The nonlinear correlation between laser speckle contrast and the blood flow velocity value is learned through a neural network, and the implicit expression between them is adaptively mined. Our imaging results show that the combination of the deep learning approach and laser speckle imaging technology has great application prospects.

4. Discussion and Conclusions

This study introduces a significant advancement in the field of biomedical imaging with the development of a dual-wavelength confocal laser speckle contrast imaging system (DW-LSCI), which integrates visible and near-infrared laser sources to measure both blood flow and blood oxygen saturation in real time. The DW-LSCI addresses a major limitation of traditional single-wavelength systems, which are typically restricted to measuring only blood flow. By expanding the range of measurable parameters, the DW-LSCI enables more comprehensive assessments of tissue health and function. A key strength of the system is its ability to achieve improved spatial resolution and greater imaging depth through the incorporation of a confocal line-scanning mode. This enhancement is critical for deep tissue imaging, as it allows for higher resolution blood flow quantification compared to conventional wide-field imaging methods, which suffer from lower resolution and less accurate depth penetration. By enabling deeper tissue visualization, the DW-LSCI system opens new possibilities for monitoring physiological processes in more challenging environments, such as within deeper tissues or during dynamic changes in blood flow.
The experimental validation in chicken embryo models further demonstrates the DW-LSCI system’s superior performance compared to conventional techniques. Not only did the system produce higher contrast images with smoother results, but it also successfully captured detailed blood flow dynamics and oxygen saturation data, offering valuable insights into tissue perfusion and metabolic activity. These capabilities underscore the system’s potential for a variety of applications, from disease diagnosis to intraoperative monitoring and basic physiological studies.
The integration of deep learning, particularly the use of the convolutional neural network (CNN) BlingNet, represents another transformative aspect of this work. Traditional laser speckle contrast imaging methods often rely on nonlinear fitting algorithms that are computationally expensive and prone to inaccuracies, particularly in dynamic or heterogeneous tissue environments. The BlingNet model addresses these issues by offering a faster, more accurate and more robust approach to blood flow imaging. The deep learning model’s ability to process complex datasets and provide real-time analysis significantly enhances the system’s practical applicability, making it feasible for clinical environments where time-sensitive data are crucial. The DW-LSCI platform, powered by deep learning algorithms, represents a significant leap forward in the real-time, high-resolution imaging of blood flow and oxygen saturation. Its ability to simultaneously measure multiple parameters in deep tissues has vast implications for clinical diagnostics, surgical guidance and physiological research. In particular, the system’s capability to monitor blood flow dynamics and oxygenation provides a more complete picture of tissue health, which could lead to earlier detection of pathological conditions and more informed decision-making during surgical procedures.
Despite its promising capabilities, there are several limitations and areas for future development. First, while the system has been validated in chicken embryo models, further studies in human tissues are required to assess its performance in clinical settings. The BlingNet model, although highly effective, may need additional optimization for processing larger datasets, which will be essential as the system is applied to more complex and diverse patient populations. Moreover, while the DW-LSCI system shows promise for non-invasive monitoring, challenges remain in standardizing imaging protocols for different tissues and conditions, as well as in ensuring the robustness of the system across a wide range of clinical scenarios.
Future research will focus on expanding the application of the DW-LSCI platform to larger and more varied datasets, particularly in human tissues, to further refine its clinical utility. Additionally, exploring the integration of other physiological biomarkers, such as tissue pH or temperature, could provide a more holistic view of tissue health. Ultimately, the ongoing development and refinement of the DW-LSCI system, combined with advances in artificial intelligence and machine learning, hold the potential to revolutionize the way blood flow and tissue oxygenation are monitored in both clinical and research settings, enhancing the precision and effectiveness of medical interventions.

Author Contributions

E.D. and S.S. designed the studies. E.D. designed the line-scanning speckle contrast imaging system. E.D., S.L., C.Q., W.Z., G.W. and X.L. set up and configured the laser speckle imaging system. E.D. and H.Z. prepared samples and performed imaging experiments. H.Z. and H.H. analyzed the images. E.D., L.M., S.S., H.Z. and Y.Z. wrote the manuscript. All authors have read and agreed to the published version of the manuscript.

Funding

This work was supported by the Shenzhen Science and Technology Program (Grant No. GJHZ20210705141805015) and the Guangdong Provincial General Colleges and Universities Young Innovative Talents Research Project (Grant No. 2024KQNCX172), and in part by the Guangdong Province General Colleges and Universities Key Field Project (Grant No. 2024ZDZX1055), the Shenzhen University Stability Support Program (No. 20231127160720001, 20231127144045001), the Scientific Research Foundation for High-Level Talents in Shenzhen (RC2023-008, RC2023-005), the Educational Commission of Guangdong Province, China (2022KTSCX019) and the Medical Scientific Research Foundation of Guangdong Province, China (A2023118).

Institutional Review Board Statement

Not applicable.

Informed Consent Statement

Not applicable.

Data Availability Statement

Data underlying the results presented in this paper could be obtained from the authors upon reasonable request.

Conflicts of Interest

The authors declare that there are no conflicts of interest related to this article.

References

  1. Pijls, N.H.; de Vos, A.M.; Keulards, D.C. Measurement ofabsolute coronary blood flow and microvascular resistance: A new window to coronary microcirculation. J. Am. Coll. Cardiol. 2021, 77, 742–744. [Google Scholar] [CrossRef] [PubMed]
  2. Awuah, A.; Moore, J.S.; Nesbit, M.A.; Ruddock, M.W.; Brennan, P.F.; Mailey, J.A.; McNeil, A.J.; Jing, M.; Finlay, D.D.; Trucco, E.; et al. A novel algorithm for cardiovascular screening using conjunctival microcirculatory parameters and blood biomarkers. Sci. Rep. 2022, 12, 6545. [Google Scholar] [CrossRef] [PubMed]
  3. Carmeliet, P.; Jain, R.K. Angiogenesis in cancer and other diseases. Nature 2000, 407, 249–257. [Google Scholar] [CrossRef] [PubMed]
  4. Upputuri, P.K.; Sivasubramanian, K.; Mark, C.S.; Pramanik, M. Recent developments in vascular imaging techniques in tissue engineering and regenerative medicine. BioMed Res. Int. 2015, 2015, 783983. [Google Scholar] [CrossRef] [PubMed]
  5. Senarathna, J.; Rege, A.; Li, N.; Thakor, N.V. Laser speckle contrast imaging: Theory, instrumentation and applications. IEEE Rev. Biomed. Eng. 2013, 6, 99–110. [Google Scholar] [CrossRef]
  6. Rajan, V.; Varghese, B.; Van Leeuwen, T.G.; Steenbergen, W. Review of methodological developments in laser Doppler flowmetry. Lasers Med. Sci. 2009, 24, 269–283. [Google Scholar] [CrossRef]
  7. Allam, N.; Zabel, W.J.; Demidov, V.; Jones, B.; Flueraru, C.; Taylor, E.; Vitkin, I.A. Longitudinal in-vivo quantification of tumour microvascular heterogeneity by optical coherence angiography in pre-clinical radiation therapy. Sci. Rep. 2022, 12, 6140. [Google Scholar] [CrossRef]
  8. Sakadžić, S.; Roussakis, E.; Yaseen, M.A.; Mandeville, E.T.; Srinivasan, V.J.; Arai, K.; Ruvinskaya, S.; Devor, A.; Lo, E.H.; Vinogradov, S.A.; et al. Two-photon high-resolution measurement of partial pressure of oxygen in cerebral vasculature and tissue. Nat. Methods 2010, 7, 755–759. [Google Scholar] [CrossRef]
  9. Durduran, T.; Yodh, A.G. Diffuse correlation spectroscopy for non-invasive, micro-vascular cerebral blood flow measurement. Neuroimage 2014, 85, 51–63. [Google Scholar] [CrossRef]
  10. Qureshi, M.M.; Allam, N.; Im, J.; Kwon, H.S.; Chung, E.; Vitkin, I.A. Advances in laser speckle imaging: From qualitative to quantitative hemodynamic assessment. J. Biophotonics 2024, 17, e202300126. [Google Scholar] [CrossRef]
  11. Nitta, F.; Kunikata, H.; Aizawa, N.; Omodaka, K.; Shiga, Y.; Yasuda, M.; Nakazawa, T. The effect of intravitreal bevacizumab on ocular blood flow in diabetic retinopathy and branch retinal vein occlusion as measured by laser speckle flowgraphy. Clin. Ophthalmol. 2014, 8, 1119–1127. [Google Scholar]
  12. Molnár, E.; Molnár, B.; Lohinai, Z.; Tóth, Z.; Benyó, Z.; Hricisák, L.; Windisch, P.; Vág, J. Evaluation of laser speckle contrast imaging for the assessment of oral mucosal blood flow following periodontal plastic surgery: An exploratory study. BioMed Res. Int. 2017, 1, 4042902. [Google Scholar] [CrossRef] [PubMed]
  13. White, S.M.; Valdebran, M.; Kelly, K.M.; Choi, B. Simultaneous blood flow measurement and dermoscopy of skin lesions using Dual-Mode dermascope. Sci. Rep. 2018, 8, 16941. [Google Scholar] [CrossRef] [PubMed]
  14. Farraro, R.; Fathi, O.; Choi, B. Handheld, point-of-care laser speckle imaging. J. Biomed. Opt. 2016, 21, 094001. [Google Scholar] [CrossRef] [PubMed]
  15. Hecht, N.; Woitzik, J.; König, S.; Horn, P.; Vajkoczy, P. Laser speckle imaging allows real-time intraoperative blood flow assessment during neurosurgical procedures. J. Cereb. Blood Flow Metab. 2013, 33, 1000–1007. [Google Scholar] [CrossRef]
  16. Eriksson, S.; Nilsson, J.; Lindell, G.; Sturesson, C. Laser speckle contrast imaging for intraoperative assessment of liver microcirculation: A clinical pilot study. Med. Devices Evid. Res. 2014, 7, 257–261. [Google Scholar] [CrossRef]
  17. Ambrus, R.; Svendsen, L.B.; Secher, N.H.; Rünitz, K.; Frederiksen, H.J.; Svendsen, M.B.; Siemsen, M.; Kofoed, S.C.; Achiam, M.P. A reduced gastric corpus microvascular blood flow during Ivor-Lewis esophagectomy detected by laser speckle contrast imaging technique. Scand. J. Gastroenterol. 2017, 52, 455–461. [Google Scholar] [CrossRef]
  18. Bray, R.C.; Forrester, K.R.; Reed, J.; Leonard, C.; Tulip, J. Endoscopic laser speckle imaging of tissue blood flow: Applications in the human knee. J. Orthop. Res. 2006, 24, 1650–1659. [Google Scholar] [CrossRef]
  19. Du, E.; Shen, S.; Chong, S.P.; Chen, N. Multifunctional laser speckle imaging. Biomed. Opt. Express 2020, 11, 2007–2016. [Google Scholar] [CrossRef]
  20. Du, E.; Shen, S.; Qiu, A.; Chen, N. Line scan spatial speckle contrast imaging and its application in blood flow imaging. Appl. Sci. 2021, 11, 10969. [Google Scholar] [CrossRef]
  21. Du, E.; Shen, S.; Qiu, A.; Chen, N. Depth-dependent microscopic flow imaging with line scan laser speckle acquisition and analysis. In Proceedings of the Optics in Health Care and Biomedical Optics XI, Nantong, China, 10–20 October 2021; SPIE: Washington, WA, USA, 2021; Volume 11900, pp. 20–26. [Google Scholar]
  22. Du, E.; Shen, S.; Qiu, A.; Chen, N. Confocal laser speckle autocorrelation imaging of dynamic flow in microvasculature. Opto-Electron. Adv. 2022, 5, 210045-1. [Google Scholar] [CrossRef]
  23. Luo, Z.; Yuan, Z.; Pan, Y.; Du, C. Simultaneous imaging of cortical hemodynamics and blood oxygenation change during cerebral ischemia using dual-wavelength laser speckle contrast imaging. Opt. Lett. 2009, 34, 1480–1482. [Google Scholar] [CrossRef] [PubMed]
  24. He, K.; Zhang, X.; Ren, S.; Sun, J. Deep residual learning for image recognition. In Proceedings of the IEEE Conference on Computer Vision and Pattern Recognition, Las Vegas, NV, USA, 27–30 June 2016; pp. 770–778. [Google Scholar]
  25. Dosovitskiy, A. An image is worth 16x16 words: Transformers for image recognition at scale. arXiv 2020, arXiv:2010.11929. [Google Scholar]
  26. Coudray, N.; Ocampo, P.S.; Sakellaropoulos, T.; Narula, N.; Snuderl, M.; Fenyö, D.; Moreira, A.L.; Razavian, N.; Tsirigos, A. Classification and mutation prediction from non–small cell lung cancer histopathology images using deep learning. Nat. Med. 2018, 24, 1559–1567. [Google Scholar] [CrossRef]
  27. Gu, J.; Wang, Z.; Kuen, J.; Ma, L.; Shahroudy, A.; Shuai, B.; Liu, T.; Wang, X.; Wang, G.; Cai, J.; et al. Recent advances in convolutional neural networks. Pattern Recognit. 2018, 77, 354–377. [Google Scholar] [CrossRef]
  28. Stebakov, I.; Kornaeva, E.; Stavtsev, D.; Potapova, E.; Dremin, V. Laser speckle contrast imaging and machine learning in application to physiological fluids flow rate recognition. Vibroeng. Procedia 2021, 38, 50–55. [Google Scholar] [CrossRef]
  29. Yu, C.-Y.; Chammas, M.; Gurden, H.; Lin, H.-H.; Pain, F. Design and validation of a convolutional neural network for fast, model-free blood flow imaging with multiple exposure speckle imaging. Biomed. Opt. Express 2023, 14, 4439–4454. [Google Scholar] [CrossRef]
  30. Wang, X.; Xie, X.; Ku, G.; Wang, L.V.; Stoica, G. Noninvasive imaging of hemoglobin concentration and oxygenation in the rat brain using high-resolution photoacoustic tomography. J. Biomed. Opt. 2006, 11, 024015. [Google Scholar] [CrossRef]
  31. Ronneberger, O.; Fischer, P.; Brox, T. U-net: Convolutional networks for biomedical image segmentation. In Medical Image Computing and Computer-Assisted Intervention–MICCAI 2015, Proceedings of the 18th International Conference, Munich, Germany, 5–9 October 2015; Proceedings, Part III 18; Springer International Publishing: Cham, Switzerland, 2015; pp. 234–241. [Google Scholar]
  32. Mao, A.; Mohri, M.; Zhong, Y. Cross-entropy loss functions: Theoretical analysis and applications. In Proceedings of the International Conference on Machine Learning, Honolulu, HI, USA, 23–29 July 2023; pp. 23803–23828. [Google Scholar]
  33. Zhao, R.; Qian, B.; Zhang, X.; Li, Y.; Wei, R.; Liu, Y.; Pan, Y. Rethinking dice loss for medical image segmentation. In Proceedings of the 2020 IEEE International Conference on Data Mining (ICDM), Sorrento, Italy, 17–20 November 2020; IEEE: Piscataway, NJ, USA, 2020; pp. 851–860. [Google Scholar]
Figure 1. Dual-wavelength confocal laser speckle contrast imaging system: (a) physical imaging configuration; (b) schematic. DM, dichroic mirror; M, mirror; HWP, half-wave plate; BE, beam expander; CL, cylindrical lens; PBS, polarizing beam splitter; GV, 1-D Galvo mirror; P, polarizer. The focal length of the CL was 50 mm. The focal lengths of lenses L1, L2, L3 and L4 were 50, 75, 40 and 100 mm, respectively.
Photonics 11 01085 g001
Figure 2. Workflow of real-time laser speckle blood flow imaging based on deep learning approach.
Photonics 11 01085 g002
Figure 3. Overview of BlingNet proposed for blood flow prediction from dual-wavelength speckle contrast images.
Photonics 11 01085 g003
Figure 4. Measurement results of laser speckle contrast at different flow rates.
Photonics 11 01085 g004
Figure 5. Laser speckle contrast imaging of chicken embryo (day 4). Wide-field mode: (a) intensity image and (b) blood flow image. Confocal mode using offset line detection of 0.4 mm: (c) intensity image and (d) blood flow image. The chicken heart (circled by the red region) is more visible in (d) compared to (b). The camera exposure time was set to 2 ms. The number of scanning lines is 500. The image size is 2560 pixels × 500 pixels, which corresponds to the field of view of 10.24 mm × 8.64 mm.
Photonics 11 01085 g005
Figure 6. Chicken embryo (day 4) (a) SO2 image using offset line detection of 0.8 mm; (b) SO2 image using offset line detection of 1.6 mm; (c) speckle contrast image. The camera exposure time was set to 2 ms. The number of scanning lines is 500. The image size is 2560 pixels × 500 pixels, which corresponds to the field of view of 10.24 mm × 8.64 mm. The red area circled in Figure 6 is the heart of the chicken embryo. The color bar values in (a,b) represent the oxygen saturation (SO2), while in (c) the color bar represents speckle contrast.
Photonics 11 01085 g006
Figure 7. Comparison results of laser speckle blood flow imaging of the chicken embryo (day 4). (a) light intensity of the region of interest, (b) laser speckle contrast image, (c) blood flow image using the traditional nonlinear fitting method, (d) blood flow image using the deep learning method. The region of interest is 2.048 mm × 2.048 mm.
Photonics 11 01085 g007
Disclaimer/Publisher’s Note: The statements, opinions and data contained in all publications are solely those of the individual author(s) and contributor(s) and not of MDPI and/or the editor(s). MDPI and/or the editor(s) disclaim responsibility for any injury to people or property resulting from any ideas, methods, instructions or products referred to in the content.

