Abstract
Luminescent thermometers based on the luminescence intensity ratio between two thermally coupled levels have a strong appeal in the biomedical area due to the possibility of monitoring the temperature of deep tissues. In such procedures, it is necessary that the excitation and emission wavelengths are within the biological windows. Probes based on neodymium luminescence, with excitation and emission around 800 and 880 nm, are frequently proposed but have low relative sensitivity (0.2%.K−1) due to the small energy separation between the explored Stark sublevels. By changing the excitation wavelength to around 750 nm, it is possible to explore the thermal coupling between the 4F5/2 and 4F3/2 levels. However, lasers in this wavelength range are not common. An alternative is to use LEDs as an excitation source. As a proof of concept, we investigated the thermometric performance of three distinct Nd-doped luminescent probes under 730 nm LED excitation and 532 nm laser excitation: nanocrystalline Y2O3, LiBaPO4 microcrystals, and lithium-boron-aluminum (LBA) glass. The results indicated that the use of LEDs as an excitation source can be applied in nano-, micro- and macro-structured probes, as it does not compromise the thermometric performance of the systems, which exhibited relative sensitivities of approximately 2%.K−1.
1. Introduction
Temperature is a fundamental property in different areas of science and its monitoring through reliable thermometers is often required [1,2]. In this sense, it is essential to develop effective thermometers that can provide temperature readings even in hostile environments, whether due to the aggressive composition of the medium, electromagnetic interference on devices, difficult access or reduced size [3,4]. To achieve these requirements, thermometers based on luminescent probes have gained prominence, as they do not require direct contact with the probe, support different chemical media and can be made with micro- and nanometric dimensions, with different morphologies [2,3].
Currently, several materials have been used for luminescence thermometry: organic dyes, polymers, quantum dots, carbon nanostructures and inorganic micro- and nanomaterials doped with trivalent lanthanides (Ln3+). Of these, Ln3+ doped materials are amongst the most promising candidates for thermal sensing due to their biocompatibility and non-toxicity [5,6], high thermal and chemical stability and high threshold of optical damage [7,8]. This is mainly because the electronic transitions 4f–4f presented by Ln3+ exhibit narrow emission lines from ultraviolet to infrared, with long lifetimes [8,9].
Different methodologies have been developed to use the variation of the luminescence of Ln3+ ions as a thermal probe: band widening [10,11], line offset [12,13], lifetime [14,15] and luminescent intensity ratio (LIR) [16,17,18,19,20,21], making use of downward conversions (DC) [8] and/or upward conversions (UC) [22]. Of those, the LIR stands out for being a simple, cheap and self-referenced method [8,9,23] and, for these reasons, it is often used. This technique considers the luminescence of a pair of thermally coupled energy levels, separated by an energy difference of less than 2000 cm−1, so that there is a high probability of non-radiative transitions between the two levels of the pair. Moreover, the most energetic level must exhibit an emission intensity considerably higher than the noise, within the temperature range of interest.
One of the main applications of these temperature sensors is the possibility of monitoring the temperature of deep tissues, during hyperthermia treatments, for example, where a region of interest (tumor) is heated to cytotoxic levels. In this type of procedure, monitoring the temperature of the region being treated must be accurate and in real time in order to maximize damage to tumor cells without compromising healthy cells. Thus, biological applications of this nature require that the luminescent probe meet three requirements: (a) it should present a high emission intensity with low excitation power to avoid damage to biological tissue, maintaining a temporal resolution for less than 1s in order to obtain readings in real time; (b) it must provide a luminescence strongly dependent on the temperature within the physiological temperature range (15 to 45 °C), in order to exhibit high thermal sensitivity; and (c) the excitation and emission wavelengths need to lie within the I (650 to 950 nm), II (1000 to 1350 nm) or III (1550 to 1870 nm) biological windows (BW), where the dispersion and absorption of biological tissue for these wavelength ranges are minimized [24,25].
Several lanthanides ions can meet these requirements: Pr3+, Nd3+, Ho3+, Er3+, Tm3+ and Yb3+ [9]. However, unlike Nd3+, the trivalent ions of Pr, Ho, Er and Tm show some emission bands inside BWs, and they generally have most of their main emission bands (the most intense) outside of BWs. The following are examples of this: Pr3+ (3P0,1→3H4,5,6) in 475, 485, 525, 535, 580 and 600 nm; Ho3+ (5F3,4→5I8) in 475 and 550 nm; Er3+ (2H11/2,4S3/2→4I15/2) in 525 and 550 nm; Tm3+ (1G4→3H6) in 475 nm. Such emissions can be strongly absorbed by biological tissue and produce unnecessary heating. In addition, these emissions can be spread, producing backlight and high fluorescence of the tissue, impairing its application [26].
Yb3+ has just one useful excited level (2F5/2), with very close emission and absorption bands, and therefore its application as the only active doping element in thermal sensing is difficult. However, Yb3+ has a strong absorption at around 980 nm and, for this reason, it is often used as a sensitizer [27] in a co-doping with another Ln3+. After the excitation at 980 nm, the Yb3+ ions need to transfer energy to the activating ions. This effect strongly depends on the distance between the ions [28,29,30] and, therefore, higher levels of doping are required, increasing the likelihood of non-radioactive transitions, which can reduce the efficiency of the system and produce heating. In addition, the 980 nm absorption band superposes a water absorption band, and this can severely compromise the biological application of Yb3+ doped materials [31,32].
On the other hand, Nd3+ has all the main emission bands from DC (4F7/2,5/2,3/2→4I9/2 and 4F3/2→4I11/2,13/2,15/2) within the BWs [12,33,34,35], not producing backlight or high tissue fluorescence. It has several absorption bands, allowing it to be excited efficiently at different wavelengths [36,37]. It displays a set of excited levels (4F3/2, 4F5/2 and 4F7/2) separated from each other by an ΔE of approximately 1000 cm−1, which provides a ladder-type thermal coupling that guarantees a substantial emission of the upper level 4F7/2, even though it is separated by an energy difference of about 2000 cm−1 from the lower excited level (4F3/2) [38]. In addition, Nd3+ presents one of the highest sensitivities ever recorded for Ln3+ within BWs [17,38], which makes it a promising candidate for biological applications.
For all these reasons, there has been a growing interest in micro- and nanostructured materials doped with Nd3+ for biological applications in the last decade [38,39]. One of the first studies reported with these characteristics [19] used nanoparticles of NaYF4:Nd3+ excited with 830 nm continuous laser and explored the LIR between the Stark sublevels of transition 4F3/2—4I9/2. Subsequently, similar works were developed using excitation around 800 nm to exploit the Stark sublevels of the 4F3/2—4I9/2, 4I11/2 transitions [12,18,37,40,41,42,43] but, due to the small energy separation between the sublevels, low sensitivities were obtained (0.2 %.K−1).
Other works conducted by Tian et al. [38] and Balabhadra et al. [17] recognized the potential of the 4F7/2, 4F5/2, 4F3/2—4I9/2 transitions for thermal sensing [44,45,46,47] and obtained sensitivity of up to 3.24%.K−1. However, the source of laser excitation in these works is outside the biological windows, which makes biological application difficult. Orlova et al. [48] proposed luminescence thermometers based on coordination compounds doped with Yb-Nd and explored the LIR between Nd (~880 nm) and Yb (~980 nm) emissions and obtained high sensitivity (1.8%.K−1). However, this system is not suitable for temperature detection in deep tissues because the Yb emission is outside the BWs, being severely attenuated by the strong absorption of water in this spectral region.
In 2017, Rakov and Maciel [36] offered an important contribution by studying SrF2: Nd3+ crystal powder. They performed a comparison between a 532 nm pulsed and continuous (CW) excitation sources and a 750 nm pulsed source, demonstrating that 750 nm radiation can excite Nd3+ ions through transition 4I9/2—4F7/2, within the first biological window, and still allow the use of FIR between 4F5/2—4I9/2 and 4F3/2—4I9/2 transitions to achieve high sensitivity (1.32%.K−1). Very recently, Gschwend et al. [49] excited BiVO4 nanoparticles, under different conditions, with a 750 nm CW laser source, obtaining a sensitivity of 1.7%.K−1.
However, a negative aspect of using 750 nm lasers to excite materials doped with neodymium is its availability in the market, since it is not commonly used, which increases its cost. A strategy to overcome this obstacle is the use of an infrared LED (emitting at 750 or 800 nm) as a source of excitation. Although it seems like a strange proposal, this procedure was already used in the 80 s and 90 s to excite optical fibers doped with Nd3+, aiming thermal sensing via the lifetime variation [50,51,52].
The present work investigated the use of 730 nm LEDs as sources of excitation for materials doped with neodymium. As a proof of concept, different Nd-doped materials, presenting bulk-, micro- and nanostructure, had their luminescence used for thermal sensing. The studied samples were nanoparticles of Y2O3, micro particles of LiBaPO4 and Lithium-Boron-Aluminum (LBA) glass doped with neodymium. It was demonstrated that this system allows the use of the LIR method between 4F5/2—4I9/2 and 4F3/2—4I9/2 transitions, obtaining high sensitivity and maintaining excitation and emission within the first biological window. These results have a direct impact on the applicability of temperature sensors for biological systems, since the cost of equipment can be significantly reduced without compromising the performance of the sensor.
2. Materials and Methods
2.1. Structural Synthesis and Characterization
Y2O3 doped with Nd3+ was synthesized via a modified sol-gel route, in which coconut water was employed in the polymerization process of the initial nitrate solution [53]. This method was also used in the fabrication of Y2O3:Eu3+ with fine control of particle size [54]. For the synthesis, the precursor materials Y(NO3)3 and Nd(NO3)3·6H2O were mixed in filtered coconut water according to the stoichiometric formula (Y0.98Nd0.02)2O3 at a molar concentration of 0.0088 mol/L. To adjust the pH, ammonium, NH4OH (Vetec, P.A.), was added dropwise to the solution and the pH value was monitored using a pH meter, since the pH of the initial sols affects the final particle size [54]. The mixture was kept under magnetic stirring for 30 min in order to polymerize the metal ions and was then dried at 100 °C. Subsequently, the resulting material was heat treated at 200 °C for 5 h to produce the dry amorphous powder. Finally, the powder sample was calcined at 1000 °C for 5 h [53]. The sample was characterized by X-ray powder diffraction (XRD) using a Rigaku RINT 2000/PC diffractometer with secondary radiation of Cu Kα. XRD data were acquired in a 2θ range from 10–80°, with a step width of 0.02° and a count time of 10 s. Scanning electron microscopy (SEM) images obtained with the Jeol JSM5500F equipment and analyzed with the Image-Pro Plus® software helped to determine the size and morphology of the particles.
Barium lithium orthophosphate doped with Nd3+, with the general formula LiBa0.99PO4:Nd0.01, was synthesized by a modified sol-gel process using PVA. Stoichiometric amounts of lithium nitrate LiNO3 (99.99%) (Sigma-Aldrich), barium nitrate Ba(NO3)2 (99%) (Sigma-Aldrich), dibasic ammonium phosphate (NH4)2HPO4 (98%) and Nd(NO3)3 (99.9%) (Sigma-Aldrich) were weighed and dissolved in 20 mL of distilled water and 10 mL of an aqueous PVA solution (0.1 g/mL) under magnetic stirring. The solution was continuously stirred and heated to about 100 °C until it became a gel. Then, the gel was thermally treated at 1100 °C for 2 h to obtain a powder sample. A similar procedure was used in our previous work [7]. The crystalline structure and morphology of the produced powder were characterized by X-ray diffraction (XRD diffractometer—Bruker D8-Advance, Cu Kα radiation at 40 kV and 40 mA) and scanning electron microscopy by field emission (SEM—JEOL 7100 F).
The vitreous system with nominal composition 50Li2O·45B2O3·5Al2O3 (mol%) doped with 2% Nd2O3 was prepared by the traditional melting method. High purity starting materials (Li2CO3, B2O3, Al2O3 and Nd2O3) were used in the synthesis, following a process similar to that described in the literature [55]. The starting materials were mixed, placed in porcelain crucibles and heated at 1000 °C for 15 min. The resulting flux was splat cooled between two flat pieces of brass held at 0 °C, producing sheet samples approximately 2 mm thick [56].
2.2. Optical Characterization
The excitation spectra of all samples were measured on an FP-8600 Jasco spectrofluorimeter equipped with a 150 W Xe lamp as an excitation source. All measurements were made at room temperature with a spectral resolution of 1 nm.
For temperature dependent luminescence measurements, the powder samples (Y2O3 and LiBaPO4) were compacted in an aluminum sample holder, occupying a circular area of 3 mm in diameter, maintained under controlled temperature between 294 K and 423 K using a heating plate and a k-type thermocouple with a resolution of 1 °C, while the LBA glass was placed over the same heating system. As a source of excitation, a 730 nm LED (3 W electric power LED and FWHM of 27 nm, CHTPON brand) or a 532 nm laser (Torus 532 model of the manufacturer Laser Quantum) were used, and emission spectra were obtained using a compact CCD spectrometer from Ocean Optics (QE65000). The 730 nm LED was adapted into an ordinary LED flashlight with adjustable focus, replacing the white light LED with the infrared LED. The flashlight’s 1.5 cm (focal length) lens was adjusted to obtain maximum focus from the emitted light, which resulted in an almost collimated beam with a diameter of 2.5 cm. A power supply (Instrutherm, mod. FA-3003) was used with a current of 0.23 A and a voltage of 0.21 V. A resistance of 0.33 Ω was also introduced into the circuit. Under these conditions, the LED provided a relatively stable light output of 35 mW. At about 10 cm from the flashlight, a 5 cm focal length lens was positioned to concentrate the LED emission on the sample, obtaining in the focus an illuminated area of approximately 4 mm2. The light beam was focused on the sample surface at an angle of incidence of 60° for the laser and 30° for the LED, in relation to normal.
The LED excitation light was filtered through a 45° Hot Mirror (M254H45, Thorlabs) placed on an inclination of approximately 30°, and the sample emission was filtered through a 45° Cod Mirror (M254C45, Thorlabs) placed on 0° and two 780 nm long-pass filters (FGL780M, Thorlabs). In laser excitation, the beam was focused with a 12 cm lens, illuminating an area of approximately 20 µm. Two Thorlabs FGL550 filters were used in the collection. The experimental setup is presented in Figure 1.
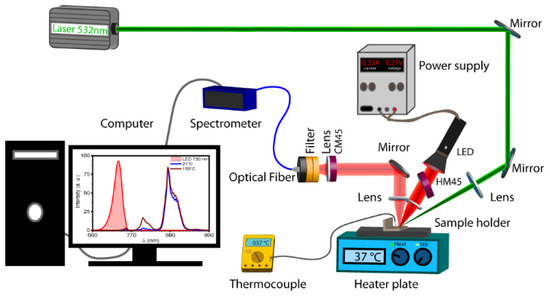
Figure 1.
Experimental setup.
2.3. Luminescence Intensity Ratio (LIR)
It has long been known that the luminescent intensity of a phosphor can show a dependence on temperature, being generally related to non-radioactive transitions [57]. Considering an ideal situation, in which a given luminescent material presents only two energy levels above the fundamental state and that these are separated by an energy difference of less than 2000 cm−1, these levels will be thermally coupled at room temperature and the ratio between their excited levels, more energetic N2 and less energetic N1, will follow a Maxwell–Boltzmann distribution [23,43].
where g1, g2, ∆E and kB are the degenerations of levels 1 and 2, the energy difference between the levels and the Boltzmann constant, respectively.
In this case, an increasing amount of electrons from the lowest energy level will be expected to be promoted to the most energetic level as the temperature increases [17,58]. This effect is verified by monitoring the luminescent intensities ratio I1 and I2 from excited levels.
where Ai0, hνi are the Einstein emission coefficient and the energy of level i.
Relating Expressions (1) and (2) we have
and
where B = Ln [C] is an experimental constant dependent on the experimental system and the characteristics of the sample [59].
2.4. Sensitivity
Luminescence temperature monitoring consists of a direct relationship between the LIR and the temperature obtained with the probe calibration [23,60]. In luminescent thermometry, the rate of change of LIR with temperature is called absolute sensitivity () and is expressed by
Although this parameter is important, it does not allow a direct comparison between different luminescent thermometers. For this, the relative sensitivity () is employed, which is obtained dividing by LIR
3. Results
3.1. Structural and Morphological Properties
Figure 2a shows the XRD patterns of the samples. The Y2O3 sample corresponds to a cubic structure belonging to the space group Ia3 according to the JCPDS card No. 41-1105. The diffraction pattern of the LiBaPO4 sample was correlated to a tridymitic structure with hexagonal unit cell and space group P63 corresponding to the JCPDS card No 14-0270. In both samples no secondary phases were identified. The LBA glass diffraction pattern revealed the amorphous character of the sample.
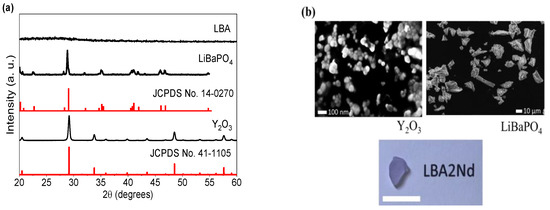
Figure 2.
X-ray diffraction pattern (a) and SEM images and photography (b) of the studied samples.
Figure 2b shows the SEM images of the crystalline samples. It was found that the Y2O3 sample has an average particle size of 40 nm and that the LiBaPO4 sample has a broad size distribution spanning a range of <1 to 30 µm. In addition, a photograph of the bulk LBA sample with a scale of 1 cm is presented. More results on the structural and microstructural characterization of these materials can be found in previous publications [53,61,62]. In particular, atomic force microscopy (AFM) images of the LBA glass can be found in ref. [55], where the crystallization process of these samples is presented and discussed.
3.2. Optical Properties
Figure 3 shows the excitation spectra (curve in black) for each sample along with the emission curves of the samples (curve in blue), of the 730 nm LED used (curve in red) and of the 532 nm laser (green line). The spectra reveal that, for the investigated samples, the absorption cross section of the band around 750 nm (4F7/2 + 4S3/2) is much more promising than the band around 525 nm (4G7/2 + 4G9/2 + 2K13/2) owing to the larger overlap between the LED emission and the (4F7/2 + 4S3/2) transition band observed in the sample’s excitation spectra. Thus, the excitation of the material through this band tends to be more effective because a larger fraction of the radiation is absorbed by the material directly or aided by phonons. In addition, the excitation of the 4F7/2 + 4S3/2 levels requires a smaller number of non-radiative decays to reach the 4F5/2 and 4F3/2 emitter levels, which decreases the number of phonons released to the matrix, reducing the probability of optical heating.
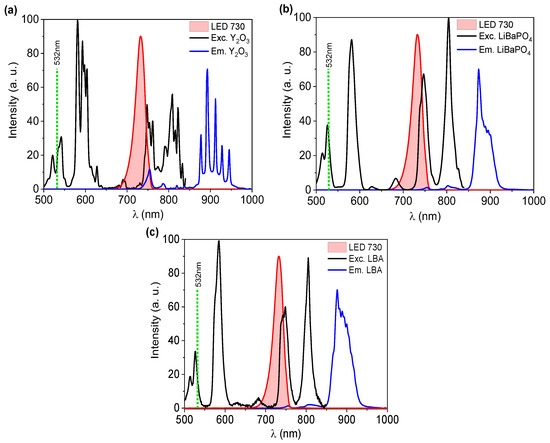
Figure 3.
Excitation spectra for emission around 890 nm (black curves), sample of the emission (blue curve), infrared LED emission (red curve) and 532 nm laser emission (green line) for samples Y2O3:Nd3+ (a), LiBaPO4:Nd3+ (b) and LBA2Nd (c) at room temperature.
Although the samples have the same dopant, and the action of the crystalline field is partially shielded by the 4f sublayer, the crystalline field is still capable of producing slight splits that produce the energy sublevels, with separations of the order of 102 cm−1, depending on the symmetry place. Therefore, the absorption and emission spectra may have slightly different line shapes, also shown in Figure 3.
The absorption and emission process of the samples is represented through a simplified level diagram presented in Figure 4. The samples doped with neodymium, initially in the ground state (4F9/2), absorb the infrared LED radiation (λem = 730 nm) through the levels (4F7/2 + 4S3/2), then, the electron decays non-radiatively to the levels 4F5/2 and 4F3/2, from where they decay radiatively to the ground state, emitting around 810 nm and 890 nm, respectively. In the case of laser excitation at 532 nm, after absorption the electron is promoted to levels 4G7/2 + 4G9/2 + 2K13/2. Then, the electron undergoes successive non-radiative decays until it reaches the 4F5/2 and 4F3/2 levels and finally performs the same radiative transitions described above.
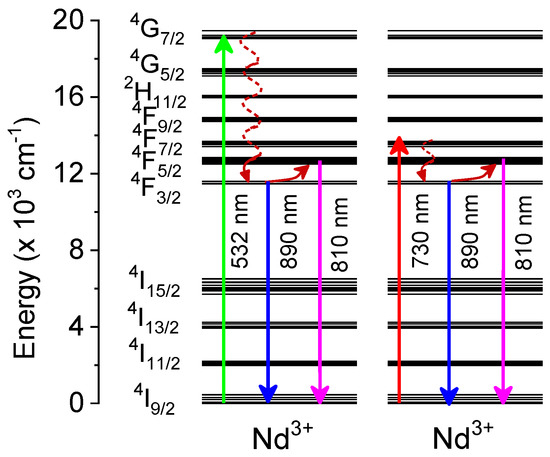
Figure 4.
Diagram of energy levels for neodymium. The upward green and red arrows correspond to the absorption of one photon with 532 nm or 730 nm of wavelength respectively. The downward blue and magenta arrows represent the radiative emission of photons with 890 and 810 nm respectively.
3.3. Temperature Sensing Properties
One of the biggest advantages of thermal sensing by the LIR method is that it does not require a very stable excitation source as a luminescence band of the material is always used as a reference for the other, that is, what is evaluated is the relative evolution of one band in relation to another. This characteristic is fundamental for the proposed system since the LED does not have great stability in its emission intensity.
Since the LED power has a small oscillation, we chose to normalize the spectra obtained in relation to the peak around 890 nm and then use the LIR method. Although this does not bring changes to the calibration slope, it prevents us from having deviation bars altered by small power variations. Therefore, after normalization, the points that showed the greatest relative variation with temperature between the bands referring to the transitions 4F5/2—4I9/2 and 4F3/2—4I9/2 in each material were identified. The intensities chosen for analysis were points 820 nm and 945 nm for Y2O3: Nd3+, 811 nm and 872 nm for LiBaPO4: Nd3+, and 816 nm and 877 nm for LBA2Nd3+. As each of these pairs corresponds to the emission intensities of the most energetic and least energetic levels, we chose to represent them simply by I2 and I1, respectively.
Figure 5a shows the emission spectra of the LiBaPO4:Nd3+ sample obtained at temperatures of 294 K and 423 K, for LED excitation at 730 nm and for laser excitation at 532 nm. As can be observed, the obtained values of LIRs for the Y2O3 samples do not change with the choice of excitation wavelength. Nevertheless, this is not the case for the other two materials. This difference is related to the change of optical filters with the change of excitation wavelengths. As the sample emission was filtered through a 45° Cod Mirror (M254C45, Thorlabs) placed on 0° and two 780 nm long-pass filters (FGL780M, Thorlabs) to eliminate the 730 nm LED excitation signal, there was a change in the collected spectrum. This alteration more strongly affected the wavelengths closer to the cut-off wavelength of the filters. Changing the optical filters according to the excitation wavelength adopted affected the transmission of the optical signal and changed the relationship between the intensities of the bands around 810 and 880 nm, which slightly shifted the curves of the LIRs. Hence, for the LBA and Y2O3 samples, where the peaks at 816 and 820 nm were used for making their respective LIRs, there was practically no change, whereas for LiBaPO4 there was a more expressive variation because we used the peak at 811 nm, which is closer to the set of the filters’ cut-off wavelength. Other factors that may be contributing to this alteration are the change in the optical alignment adopted and the slight fluctuations in the luminescent signal, with variations of around 5% being expected in this case in the repeatability of the LIRs [9]. However, this should not compromise the probe’s performance, instead, it only requires that the system be calibrated in both cases. In Figure 5b, the LIRs using intensities of I2 and I1 of each sample were plotted for the spectra obtained under 532 nm laser excitation and for those obtained under 730 nm infrared LED excitation. Fitting curves were plotted considering Equation (4).
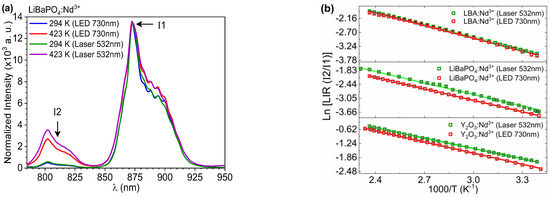
Figure 5.
Emission spectra of the LiBaPO4:Nd3+ sample at temperatures of 294 K and 423 K for 532 nm laser excitation and 730 nm LED excitation (a). Log of LIRs as a function of the inverse temperature for samples under 532 nm laser excitation and 730 nm LED excitation (b).
Table 1 presents the adjustment parameters obtained in each case. The direct comparison of the thermometric performance of each sample under the two investigated excitation wavelengths proves that the excitation by the 730 nm infrared LED is a viable way, since the slopes of the lines obtained for the LIRs present similar values for both excitation sources. The greatest discrepancy occurs in the case of the Y2O3:Nd3+ sample, however, the variation is less than 7%, an acceptable deviation for an experimental procedure.

Table 1.
LIRs fitting parameters.
Using the data from Table 1 in Equation (6), it is possible to determine the relative sensitivities presented by the samples analyzed under the two wavelengths used, as shown in Figure 6a. The relative sensitivities obtained are approximately 2%.K−1; these sensitivities are an order of magnitude higher than the sensitivities obtained using the Starks sublevels of level 4F3/2 and are even greater than the sensitivities obtained by Gschwend et al. [49] using BiVO4: Nd3+ nanoparticles and those obtained by Rakov and Maciel [36] with nanoparticles of SrF2:Nd3+ both excited with laser of 750 nm. Therefore, the sensitivities obtained in this article are amongst the highest recorded for neodymium-doped systems that operate entirely within biological windows. To demonstrate this more clearly, Table 2 was elaborated listing the main works that used materials doped with neodymium operating within biological windows.
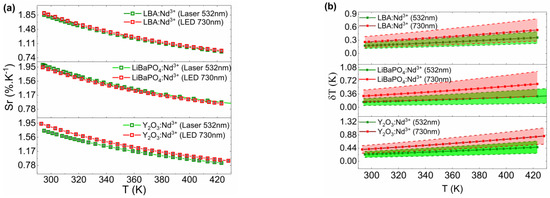
Figure 6.
Relative sensitivity (a). Temperature uncertainties (b) were obtained for each sample using the 532 nm laser and the 730 nm LED.
Table 2.
List of the main temperature sensing works with neodymium-doped materials.
Another important piece of information for the thermometric characterization of a luminescent probe is the temperature uncertainty, defined as . This quantity quantifies the resolution of the measurement method and depends on both the relative sensitivity () and the signal-to-noise ratio of the experimental system () [9]. Figure 6b presents the temperature uncertainties obtained for the three samples investigated under 532 nm laser excitation and 730 nm LED excitation as a function of temperature. In all cases, the temperature uncertainty was less than 1 K across the investigated temperature range (294–423 K). These values are considerably low and are within the desired standard.
In Table 2 we can see that the highest sensitivity obtained using the stark sublevels was 0.34%.K−1, which is small compared to systems that use the ratio between levels 4F5/2 and 4F3/2. The highest sensitivity ever recorded for materials doped with neodymium was 3.24%.K−1; however, in this work the excitation wavelength is outside the biological window (574.8 nm). The only two studies that used 750 nm excitation and evaluated the performance of thermal probes in relation to levels 4F5/2 and 4F3/2 obtained sensitivities of 1.32 and 1.7%.K−1. Using the 730 nm LED we find sensitivities between 1.92 and 1.94%.K−1 for the analyzed materials.
Another important point is that the difference in the results obtained under excitation at 532 nm and at 730 nm are considerably small compared to those obtained by Rakov and Maciel [36]. This indicates the stability of the samples and validates the experimental procedures performed, showing that excitation by LED of 730 nm is a promising way to obtain temperature measurement systems in biological media with thermal probes based on materials doped with neodymium, allowing us to obtain high sensitivity through an extremely cheap excitation source. Another important point is that the operating spectrum is considerably small (730–950 nm), allowing data to be obtained through a single compact and cheaper spectrometer.
4. Discussions
Luminescent thermometry using thermally coupled two-level luminescent intensity ratio (LIR) is a formidable technique for temperature detection in environments or situations where conventional thermometers cannot perform. One of the areas where this technique has great prominence is in medicine; specifically, in the detection of temperature in deep tissues, allowing thermal monitoring, in real time, in a non-invasive way, with high thermal and spatial resolution [1,2]. However, some points need to be highlighted so that we can more effectively assess the potential application of these probes for temperature monitoring of deep tissues [24,25].
As highlighted in the introduction to this work, such probes must present: (a) strong luminescence with low excitation power in order to avoid damage to biological tissues due to overheating and to maintain a temporal resolution of less than 1 s; (b) high variation of the LIR with the variation between 15 and 45 °C (physiological temperature), thus exhibiting high thermal sensitivity and consequently high thermal resolution, allowing greater precision in measurements; (c) excitation and emission wavelengths (used in LIR) within biological windows (BWs) in order to avoid the absorption of these wavelengths by the biological tissue, thus reducing the chances of overheating the tissue and increasing the power of light penetration [17].
Given these requirements, many works have already demonstrated that inorganic materials doped with Nd3+ are excellent options as thermal probes, as can be seen in the works by Rocha et al. (2013) [12] and Wawrzynczyk et al. (2012) [19]. To keep the system operating entirely within the BWs, many authors chose to excite the material with lasers around 800 nm to assemble the LIR with the Stark sublevels of the transition 4F3/2 → 4I9/2 [12,18,19,43] or 4F3/2 → 4I11/2 [41]. This strategy allowed us to obtain sensitivities around 0.2%.K−1. In this work, by exciting the material at 730 nm and using the LIR between the 4F5/2 → 4I9/2 and 4F3/2 → 4I9/2 transitions, we kept the system completely within the BWs and still managed to increase the relative sensitivity to approximately 2%.K−1. Other researchers such as Balabhadra et al. (2015) [17], Tian et al. (2014) [38] and Orlova et al. (2022) [48] have already used the LIR between these and other transitions, such as 4F7/2 → 4I9/2 and 4F3/2 → 4I9/2, or between other transitions, such as 4F3/2 → 4I9/2 (Nd) and 2F5/2 → 2F7/2 (Yb ), and obtained sensitivities between 1.6%.K−1 and 3.24%.K−1; however, such systems do not operate fully within the biological windows because they either use excitation outside the BWs (532 nm, 580 nm and 980 nm) or one of the proposed LIR waveforms is outside the BWs (980 nm).
Rakov and Maciel (2017) [36] and Gschwend et al. (2019) [49] already proved that it is possible to excite materials doped with Nd3+ with pulsed and continuous 750 nm lasers by exciting the 4F7/2 level of Nd3+ and thereby obtaining sensitivities between 1.32 and 1.7%.K−1. The big problem in this case is the availability and financial cost of laser sources at this wavelength. In contrast, we show in this work that it is possible to use 730 nm infrared LEDs as excitation sources. In addition to reducing the costs of implementing temperature detection systems using these mechanisms, it is also possible to reduce the size of this system. Another important factor is that, in the three materials investigated, the sensitivities obtained were greater than those reported by Rakov and Maciel or by Gschwend et al.
Finally, we can say that the strategy presented in this work opens a promising path for obtaining simple temperature detection systems (without the need for co-doping) with operation completely within the BWs, a high relative sensitivity and making use of a simpler and cheaper operating apparatus.
5. Conclusions
In summary, we present an alternative for temperature sensing in deep tissues, adopting a 730 nm infrared LED as an excitation source and exploring the LIR between the emissions of levels 4F5/2 and 4F3/2. To prove its viability, the probes were characterized as temperature luminescent probes using an infrared LED or a 532 nm laser as the excitation source. We investigated the thermometric performance of three distinct Nd-doped luminescent probes: Y2O3 nanoparticles, LiBaPO4 microparticles, and lithium boron aluminum (LBA) glass. The results of all systems presented a good agreement with both excitation sources. Relative sensitivities of approximately 2%.K−1 were obtained at room temperature, and the temperature uncertainty was less than 1 K for the entire temperature range investigated. Finally, the results indicate that 730 nm infrared LEDs can be a good alternative for neodymium-doped luminescent thermometric systems intended for deep tissue temperature detection, allowing us to obtain high relative sensitivity and low temperature uncertainty, using an extremely inexpensive excitation source. In addition, concentrating the system’s operational spectrum (excitation and emission) in the first biological window allows data collection using a single compact spectrometer, which is considerably cheaper than systems that operate in the second and the third biological windows.
Author Contributions
Writing—original draft preparation, conceptualization, investigation, data curation, writing—review and editing, A.S.L.; methodology, supervision, writing—review and editing, project administration and funding acquisition, M.A.R.C.A. and Z.S.M.; resources, funding acquisition, visualization and formal analysis, M.V.d.S.R., M.A.G., M.A.C.d.S., N.O.D., A.C.A.S., J.J.R.J., M.E.G.V. and Z.S.M.; formal analysis, D.A.H. and A.C.B.-S. All authors have read and agreed to the published version of the manuscript.
Funding
Financial support from Conselho Nacional de Desenvolvimento Científico e Tecnológico and Fundação de Apoio à Pesquisa e à Inovação Tecnológica do Estado de Sergipe) (FAPITEC/SE) are acknowledged. This work was financed in part by the Coordenação de Aperfeiçoamento de Pessoal de Nível Superior (CAPES, Brasil) Finance Code 001, and was performed in the framework of the National Institute of Photonics (INCT de Fotônica), grant number 465763/2014-6, MCTI/CNPq/FACEPE.
Institutional Review Board Statement
Not applicable.
Informed Consent Statement
Not applicable.
Data Availability Statement
Not applicable.
Conflicts of Interest
The authors declare no conflict of interest.
References
- Qiu, X.; Zhou, Q.; Zhu, X.; Wu, Z.; Feng, W.; Li, F. Ratiometric Upconversion Nanothermometry with Dual Emission at the Same Wavelength Decoded via a Time-Resolved Technique. Nat. Commun. 2020, 11, 4. [Google Scholar] [CrossRef]
- Bradac, C.; Lim, S.F.; Chang, H.C.; Aharonovich, I. Optical Nanoscale Thermometry: From Fundamental Mechanisms to Emerging Practical Applications. Adv. Opt. Mater. 2020, 8, 2000183. [Google Scholar] [CrossRef]
- Del Rosal, B.; Jaque, D. Upconversion Nanoparticles for In Vivo Applications: Limitations and Future Perspectives. Methods Appl. Fluoresc. 2019, 7, 22001–22023. [Google Scholar] [CrossRef] [PubMed]
- Liu, Y.; Zhu, X.; Wei, Z.; Feng, W.; Li, L.; Ma, L.; Li, F.; Zhou, J. Customized Photothermal Therapy of Subcutaneous Orthotopic Cancer by Multichannel Luminescent Nanocomposites. Adv. Mater. 2021, 33, 2008615. [Google Scholar] [CrossRef]
- Hemmer, E.; Vetrone, F.; Soga, K. Lanthanide-Based Nanostructures for Optical Bioimaging: Small Particles with Large Promise. MRS Bull. 2014, 39, 960–964. [Google Scholar] [CrossRef]
- Ahmad, M.Z.; Abdel-Wahab, B.A.; Alam, A.; Zafar, S.; Ahmad, J.; Ahmad, F.J.; Midoux, P.; Pichon, C.; Akhter, S. Toxicity of Inorganic Nanoparticles Used in Targeted Drug Delivery and Other Biomedical Application: An Updated Account on Concern of Biomedical Nanotoxicology. J. Nanosci. Nanotechnol. 2016, 16, 7873–7897. [Google Scholar] [CrossRef]
- Hora, D.A.; Silva, A.J.S.; Nascimento, P.A.M.; Sampaio, D.V.; Moulton, B.J.A.; Silva, R.S.; Rezende, M.V.d.S. Effect of the Amounts of Li+ Additive on the Luminescence Properties of LiBaPO4:Eu Phosphor. Opt. Mater. 2019, 89, 329–333. [Google Scholar] [CrossRef]
- Dramićanin, M.D. Sensing Temperature via Downshifting Emissions of Lanthanide-Doped Metal Oxides and Salts. A Review. Methods Appl. Fluoresc. 2016, 4, 042001–0420024. [Google Scholar] [CrossRef]
- Brites, C.D.S.; Millán, A.; Carlos, L.D. Lanthanides in Luminescent Thermometry. In Handbook on the Physics and Chemistry of Rare Earths; Elsevier: Amsterdam, The Netherlands, 2016; Volume 49, pp. 339–427. [Google Scholar]
- Lu, H.; Yang, J.; Huang, D.; Zou, Q.; Yang, M.; Zhang, X.; Wang, Y.; Zhu, H. Ultranarrow NIR Bandwidth and Temperature Sensing of YOF:Yb3+/Tm3+ Phosphor in Low Temperature Range. J. Lumin. 2019, 206, 613–617. [Google Scholar] [CrossRef]
- Peng, H.; Song, H.; Chen, B.; Wang, J.; Lu, S.; Kong, X.; Zhang, J. Temperature Dependence of Luminescent Spectra and Dynamics in Nanocrystalline Y2O3: Eu3+. J. Chem. Phys. 2003, 118, 3277–3282. [Google Scholar] [CrossRef]
- Rocha, U.; Jacinto da Silva, C.; Ferreira Silva, W.; Guedes, I.; Benayas, A.; Martinez Maestro, L.; Acosta Elias, M.; Bovero, E.; van Veggel, F.C.; Garcia Solé, J.A.; et al. Subtissue Thermal Sensing Based on Neodymium-Doped LaF3 Nanoparticles. ACS Nano 2013, 7, 1188–1199. [Google Scholar] [CrossRef] [PubMed]
- Braun, T.; Schneider, C.; Maier, S.; Igusa, R.; Iwamoto, S.; Forchel, A.; Höfling, S.; Arakawa, Y.; Kamp, M. Temperature Dependency of the Emission Properties from Positioned In(Ga)As/GaAs Quantum Dots. AIP Adv. 2014, 4, 097128. [Google Scholar] [CrossRef]
- Lojpur, V.; Antić, Ž.; Dramićanin, M.D. Temperature Sensing from the Emission Rise Times of Eu3+ in SrY2O4. Phys. Chem. Chem. Phys. 2014, 16, 25636–25641. [Google Scholar] [CrossRef]
- Allison, S.; Goedeke, S.; Cates, M.; Bonsett, T.; Smith, D.; Brewington, A.; Bencic, T. Phosphor Thermometry in an Operating Turbine Engine; American Institute of Aeronautics and Astronautics: Reston, VA, USA, 2012; pp. 1–7. [Google Scholar] [CrossRef]
- Brandão-Silva, A.C.; Gomes, M.A.; Macedo, Z.S.; Avila, J.F.M.; Rodrigues, J.J.; Alencar, M.A.R.C. Multiwavelength Fluorescence Intensity Ratio Nanothermometry: High Sensitivity over a Broad Temperature Range. J. Phys. Chem. C 2018, 122, 20459–20468. [Google Scholar] [CrossRef]
- Balabhadra, S.; Debasu, M.L.; Brites, C.D.S.; Nunes, L.A.O.; Malta, O.L.; Rocha, J.; Bettinelli, M.; Carlos, L.D. Boosting the Sensitivity of Nd3+ -Based Luminescent Nanothermometers. Nanoscale 2015, 7, 17261–17267. [Google Scholar] [CrossRef] [PubMed]
- Benayas, A.; Del Rosal, B.; Pérez-Delgado, A.; Santacruz-Gómez, K.; Jaque, D.; Hirata, G.A.; Vetrone, F. Nd:YAG Near-Infrared Luminescent Nanothermometers. Adv. Opt. Mater. 2015, 3, 687–694. [Google Scholar] [CrossRef]
- Wawrzynczyk, D.; Bednarkiewicz, A.; Nyk, M.; Strek, W.; Samoc, M. Neodymium(Iii) Doped Fluoride Nanoparticles as Non-Contact Optical Temperature Sensors. Nanoscale 2012, 4, 6959–6961. [Google Scholar] [CrossRef]
- Kolesnikov, I.E.; Golyeva, E.V.; Kurochkin, M.A.; Lähderanta, E.; Mikhailov, M.D. Nd3+-Doped YVO4 Nanoparticles for Luminescence Nanothermometry in the First and Second Biological Windows. Sensors Actuators B Chem. 2016, 235, 287–293. [Google Scholar] [CrossRef]
- Zairov, R.R.; Dovzhenko, A.P.; Podyachev, S.N.; Sudakova, S.N.; Kornev, T.A.; Shvedova, A.E.; Masliy, A.N.; Syakaev, V.V.; Alekseev, I.S.; Vatsouro, I.M.; et al. Role of PSS-Based Assemblies in Stabilization of Eu and Sm Luminescent Complexes and Their Thermoresponsive Luminescence. Colloids Surf. B Biointerfaces 2022, 217, 112664. [Google Scholar] [CrossRef]
- González-Béjar, M.; Pérez-Prieto, J. Upconversion Luminescent Nanoparticles in Physical Sensing and in Monitoring Physical Processes in Biological Samples. Methods Appl. Fluoresc. 2015, 3, 042002. [Google Scholar] [CrossRef]
- Wade, S.A.; Collins, S.F.; Baxter, G.W. Fluorescence Intensity Ratio Technique for Optical Fiber Point Temperature Sensing. J. Appl. Phys. 2003, 94, 4743–4756. [Google Scholar] [CrossRef]
- Wang, X.D.; Wolfbeis, O.S.; Meier, R.J. Luminescent Probes and Sensors for Temperature. Chem. Soc. Rev. 2013, 42, 7834–7869. [Google Scholar] [CrossRef] [PubMed]
- Hemmer, E.; Acosta-Mora, P.; Méndez-Ramos, J.; Fischer, S. Optical Nanoprobes for Biomedical Applications: Shining a Light on Upconverting and near-Infrared Emitting Nanoparticles for Imaging, Thermal Sensing, and Photodynamic Therapy. J. Mater. Chem. B 2017, 5, 4365–4392. [Google Scholar] [CrossRef] [PubMed]
- Hemmer, E.; Benayas, A.; Légaré, F.; Vetrone, F. Exploiting the Biological Windows: Current Perspectives on Fluorescent Bioprobes Emitting above 1000 Nm. Nanoscale Horiz. 2016, 1, 168–184. [Google Scholar] [CrossRef]
- Brites, C.D.S.; Lima, P.P.; Silva, N.J.O.; Millán, A.; Amaral, V.S.; Palacio, F.; Carlos, L.D. Thermometry at the Nanoscale. Nanoscale 2012, 4, 4799–4829. [Google Scholar] [CrossRef]
- Nadort, A.; Zhao, J.; Goldys, E.M. Lanthanide Upconversion Luminescence at the Nanoscale: Fundamentals and Optical Properties. Nanoscale 2016, 8, 13099–13130. [Google Scholar] [CrossRef]
- Liu, G. Advances in Theoretical Understanding of Photon Upconversion in Rare—Earth Activated Nanophopshors. Chem. Soc. Rev. 2015, 44, 1635–1652. [Google Scholar] [CrossRef]
- Zhou, J.; Liu, Q.; Feng, W.; Sun, Y.; Li, F. Upconversion Luminescent Materials: Advances and Applications. Chem. Rev. 2015, 115, 395–465. [Google Scholar] [CrossRef]
- Wang, R.; Li, X.; Zhou, L.; Zhang, F. Epitaxial Seeded Growth of Rare-Earth Nanocrystals with Efficient 800 Nm Near-Infrared to 1525 Nm Short-Wavelength Infrared Downconversion Photoluminescence for In Vivo Bioimaging ** Angewandte. Angew. Chem. Int. Ed. 2014, 53, 12086–12090. [Google Scholar] [CrossRef]
- Marciniak, L.; Pilch, A.; Arabasz, S.; Jin, D.; Bednarkiewicz, A. Heterogeneously Nd3+ Doped Single Nanoparticles for NIR-Induced Heat Conversion, Luminescence, and Thermometry. Nanoscale 2017, 9, 8288–8297. [Google Scholar] [CrossRef]
- Quintanilla, M.; Zhang, Y.; Liz-Marzán, L.M. Subtissue Plasmonic Heating Monitored with CaF2:Nd3+,Y3+ Nanothermometers in the Second Biological Window. Chem. Mater. 2018, 30, 2819–2828. [Google Scholar] [CrossRef]
- Xu, W.; Qi, H.; Zheng, L.; Zhang, Z.; Cao, W. Multifunctional Nanoparticles Based on the Nd3+ /Yb3+ Codoped NaYF4. Opt. Lett. 2015, 40, 5678–5681. [Google Scholar] [CrossRef] [PubMed]
- Aoki, T.; Koughia, K.; Fujimoto, K.; Fujihashi, C.; Decorby, R.; Haugen, C.; Hewak, D.W.; Tonchev, D.; Kasap, S. Observation of 4F3/2→4I15/2 Radiative Current Topics in Solid State Physics Transition in Nd3+ Ions in GaLaS Glass Using Frequency-Resolved PL Spectroscopy. Phys. Status Solidi 2009, 6, 54–58. [Google Scholar] [CrossRef]
- Rakov, N.; Maciel, G.S. Near-Infrared Emission and Optical Temperature Sensing Performance of Nd3+:SrF2 Crystal Powder Prepared by Combustion Synthesis. J. Appl. Phys. 2017, 121, 113103. [Google Scholar] [CrossRef]
- Dantelle, G.; Matulionyte, M.; Testemale, D.; Cantarano, A.; Ibanez, A.; Vetrone, F. Nd3+ Doped Gd3Sc2Al3O12 Nanoparticles: Towards Efficient Nanoprobes for Temperature Sensing. Phys. Chem. Chem. Phys. 2019, 21, 11132–11141. [Google Scholar] [CrossRef]
- Tian, X.; Wei, X.; Chen, Y.; Duan, C.; Yin, M. Temperature Sensor Based on Ladder-Level Assisted Thermal Coupling and Thermal-Enhanced Luminescence in NaYF4: Nd3+. Opt. Express 2014, 22, 30333–30345. [Google Scholar] [CrossRef] [PubMed]
- Runowski, M.; Martín, I.R.; Sigaev, V.N.; Savinkov, V.I.; Shakhgildyan, G.Y.; Lis, S. Luminescent-Plasmonic Core–Shell Microspheres, Doped with Nd3+ and Modified with Gold Nanoparticles, Exhibiting Whispering Gallery Modes and SERS Activity. J. Rare Earths 2019, 37, 1152–1156. [Google Scholar] [CrossRef]
- Marciniak, L.; Prorok, K.; Bednarkiewicz, A.; Kowalczyk, A.; Hreniak, D.; Strek, W. Water Dispersible LiNdP4O12 Nanocrystals: New Multifunctional NIR-NIR Luminescent Materials for Bio-Applications. J. Lumin. 2016, 176, 144–148. [Google Scholar] [CrossRef]
- Kolesnikov, I.E.; Golyeva, E.V.; Kalinichev, A.A.; Kurochkin, M.A.; Lähderanta, E.; Mikhailov, M.D. Nd3+ Single Doped YVO4 Nanoparticles for Sub-Tissue Heating and Thermal Sensing in the Second Biological Window. Sens. Actuators B Chem. 2016, 243, 338–345. [Google Scholar] [CrossRef]
- Tejeda, E.M.; Arámburo, M.; Vargas, E.; Contreras, O.E.; Hirata1, G.A. Novel Bifunctional Nd:YAG/Fe3O4 Nanocomposite as Nanothermometer/Nanoheater for Potential Biomedical Applications. J. Phys. D Appl. Phys. Lett. 2018, 51, 1361–6463. [Google Scholar] [CrossRef]
- Gomes, M.A.; Carvalho, I.S.; Domingos, L.F.A.; Brandão-Silva, A.C.; Avila, J.F.M.; Rodrigues, J.J.; Alencar, M.A.R.C.; Valerio, M.E.G.; Macedo, Z.S. Temperature-Sensitive Luminescence of Y2O3:Nd3+ Nanocrystals Produced by an Eco-Friendly Route. Opt. Mater. 2019, 89, 536–542. [Google Scholar] [CrossRef]
- Nunes, L.A.O.; Souza, A.S.; Carlos, L.D.; Malta, O.L. Neodymium Doped Fluoroindogallate Glasses as Highly-Sensitive Luminescent Non-Contact Thermometers. Opt. Mater. 2017, 63, 42–45. [Google Scholar] [CrossRef]
- Kalinichev, A.A.; Kurochkin, M.A.; Golyeva, E.V.; Kurochkin, A.V.; Lähderanta, E.; Mikhailov, M.D.; Kolesnikov, I.E. Near-Infrared Emitting YVO4: Nd3+ Nanoparticles for High Sensitive Fluorescence Thermometry. J. Lumin. 2018, 195, 61–66. [Google Scholar] [CrossRef]
- Hernández-Rodríguez, M.A.; Lozano-Gorrín, A.D.; Martín, I.R.; Rodríguez-Mendoza, U.R.; Lavín, V. Comparison of the Sensitivity as Optical Temperature Sensor of Nano-Perovskite Doped with Nd3+ Ions in the First and Second Biological Windows. Sens. Actuators B Chem. 2018, 255, 970–976. [Google Scholar] [CrossRef]
- Kolesnikov, I.E.; Kalinichev, A.A.; Kurochkin, M.A.; Mamonova, D.V.; Kolesnikov, E.Y.; Kurochkin, A.V.; Lähderanta, E.; Mikhailov, M.D. Y2O3:Nd3+ Nanocrystals as Ratiometric Luminescence Thermal Sensors Operating in the Optical Windows of Biological Tissues. J. Lumin. 2018, 204, 506–512. [Google Scholar] [CrossRef]
- Orlova, A.V.; Kozhevnikova, V.Y.; Goloveshkin, A.S.; Lepnev, L.S.; Utochnikova, V.V. NIR Luminescence Thermometers Based on Yb–Nd Coordination Compounds for the 83–393 K Temperature Range. Dalton Trans. 2022, 51, 5419–5425. [Google Scholar] [CrossRef] [PubMed]
- Gschwend, P.M.; Starsich, F.H.L.; Keitel, R.C.; Pratsinis, S.E. Nd3+-Doped BiVO4 Luminescent Nanothermometers of High Sensitivity. Chem. Commun. 2019, 55, 7147–7150. [Google Scholar] [CrossRef]
- Saruwatari, M.; Kimura, T. LED Pumped Lithium Neodymium Tetraphosphate Lasers. IEEE J. Quantum Electron. 1976, 12, 584–591. [Google Scholar] [CrossRef]
- Grattan, K.T.V.; Palmer, A.W. Infrared Fluorescence “Decay-Time” Temperature Sensor. Rev. Sci. Instrum. 1985, 56, 1784–1787. [Google Scholar] [CrossRef]
- Grattan, K.T.V.; Palmer, A.W.; Wilson, C.A. A Miniaturised Microcomputer-Based Neodymium “decay-Time” Temperature Sensor. J. Phys. E 1987, 20, 1201–1205. [Google Scholar] [CrossRef]
- Gomes, M.A.; Brandão-Silva, A.C.; Avila, J.F.M.; Alencar, M.A.R.C.; Rodrigues, J.J.; Macedo, Z.S. Particle Size Effect on Structural and Optical Properties of Y2O3:Nd3+ Nanoparticles Prepared by Coconut Water-Assisted Sol-Gel Route. J. Lumin. 2018, 200, 43–49. [Google Scholar] [CrossRef]
- de Andrade Gomes, M.; Valerio, M.E.G.; Macedo, Z.S. Particle Size Control of Y2O3:Eu3+ Prepared via a Coconut Water-Assisted Sol-Gel Method. J. Nanomater. 2011, 2011, 469685. [Google Scholar] [CrossRef]
- Dantas, N.O.; Silva, V.A.; Neto, O.O.D.; Nascimento, M.L.F. Control of Crystallization Kinetics and Study of the Thermal, Structural and Morphological Properties of an Li2O-B2O3-Al2O3 Vitreous System. Braz. J. Phys. 2012, 42, 347–354. [Google Scholar] [CrossRef]
- Laia, A.S.; Maciel, G.S.; Rodrigues, J.J.; Dos Santos, M.A.C.; Machado, R.; Dantas, N.O.; Silva, A.C.A.; Rodrigues, R.B.; Alencar, M.A.R.C. Lithium-Boron-Aluminum Glasses and Glass-Ceramics Doped with Eu3+: A Potential Optical Thermometer for Operation over a Wide Range of Temperatures with Uniform Sensitivity. J. Alloys Compd. 2022, 907, 164402. [Google Scholar] [CrossRef]
- Allison, S.W. A Brief History of Phosphor Thermometry. Meas. Sci. Technol. 2019, 30, ab1d02. [Google Scholar] [CrossRef]
- Skrzypczak, U.; Pfau, C.; Seifert, G.; Schweizer, S. Comprehensive Rate Equation Analysis of Upconversion Luminescence Enhancement Due to BaCl2 Nanocrystals in Neodymium-Doped Fluorozirconate-Based Glass Ceramics. J. Phys. Chem. C 2014, 118, 13087–13098. [Google Scholar] [CrossRef]
- Brandão-Silva, A.C.; Gomes, M.A.; Novais, S.M.V.; Macedo, Z.S.; Avila, J.F.M.; Rodrigues, J.J.; Alencar, M.A.R.C. Size Influence on Temperature Sensing of Erbium-Doped Yttrium Oxide Nanocrystals Exploiting Thermally Coupled and Uncoupled Levels’ Pairs. J. Alloys Compd. 2018, 731, 478–488. [Google Scholar] [CrossRef]
- Kusama, H.; Sovers, O.J.; Yoshioka, T. Line Shift Method for Phosphor Temperature Measurements. Jpn. J. Appl. Phys. 1976, 15, 2349–2358. [Google Scholar] [CrossRef]
- Laia, A.S.; Hora, D.A.; Rezende, M.V.d.S.; Xing, Y.; Rodrigues, J.J., Jr.; Maciel, G.S.; Alencar, M.A.R.C. Nd3+-Doped LiBaPO4 Phosphors for Optical Temperature Sensing within the First Biological Window: A New Strategy to Increase the Sensitivity. Chem. Eng. J. 2020, 399, 125742. [Google Scholar] [CrossRef]
- Laia, A.S.; Felix, N., J.; Brandão-Silva, A.C.; Rodrigues, J.J.; dos Santos, M.A.C.; Dantas, N.O.; Silva, A.C.A.; Alencar, M.A.R.C. Obtaining the Spectroscopic Quality Factor through the Luminescent Thermometry in 50Li2O·45B2O3·5Al2O3 Glasses Doped with Nd3+ and Fluorides. Appl. Opt. 2023, 62, C21. [Google Scholar] [CrossRef]


Disclaimer/Publisher’s Note: The statements, opinions and data contained in all publications are solely those of the individual author(s) and contributor(s) and not of MDPI and/or the editor(s). MDPI and/or the editor(s) disclaim responsibility for any injury to people or property resulting from any ideas, methods, instructions or products referred to in the content. |
© 2023 by the authors. Licensee MDPI, Basel, Switzerland. This article is an open access article distributed under the terms and conditions of the Creative Commons Attribution (CC BY) license (https://creativecommons.org/licenses/by/4.0/).