Communication

Interpretation of Localized Surface Plasmonic Resonances of Gold Nanoparticles Covered by Polymeric Coatings

by
Alkeos Stamatelatos
1,†,
Maria Tsarmpopoulou
1,
Dimitrios Geralis
1,
Alexandros G. Chronis
1,
Vagelis Karoutsos
1,
Dimitrios Ntemogiannis
1,
Dionysios M. Maratos
1,
Spyridon Grammatikopoulos
2,*,
Mihail Sigalas
1 and
Panagiotis Poulopoulos
1,*
1
Materials Science Department, University of Patras, 26504 Patras, Greece
2
Department of Mechanical Engineering, University of Peloponnese, M. Alexandrou 1, 26334 Patras, Greece
*
Authors to whom correspondence should be addressed.
Present address: Department of Physics, University of Warwick, Coventry CV4 7AL, UK.
Photonics 2023, 10(4), 408; https://doi.org/10.3390/photonics10040408
Submission received: 18 March 2023 / Revised: 2 April 2023 / Accepted: 3 April 2023 / Published: 5 April 2023
(This article belongs to the Special Issue Integrated Plasmonic Devices)

Abstract

:
Plasmonic materials currently have a plethora of applications. How would a dielectric matrix, such as diblock copolymers, tune plasmonic properties? In this work, self-assembled gold nanoparticles were fabricated in medium vacuum conditions on heated Corning glass substrates (kept at 440 °C) under the coexistence of argon and air by means of DC magnetron sputtering. These samples were compared structurally and optically to samples deposited at room temperature and post annealed. Subsequently, the better of the two preparations, those deposited on heated glass, were covered with three different polymers, namely: Polystyrene-block-polybutadiene-block-polystyrene (PS-b-PBD-b-PS); Polystyrene-co-methyl methacrylate (PS-co-PMMA); and Polystyrene-block-polyisoprene-block-polystyrene (PS-b-PI-b-PS), by means of spin coating. Localized surface plasmon resonances were recorded and analyzed, respectively, for polymer-covered gold nanoparticles, with the width, intensity, and position of the resonances changing according to multiple factors, such as the nanoparticles size and the refractive index of each polymer. Lastly, for purposes of justification and comparison with the experimental results, rigorous theoretical calculations have been carried out.

1. Introduction

Noble metal nanoparticles (NPs), situated either on solid state substrates [1,2] or in colloidal suspensions [2,3], having been developed by various growth techniques [4,5], have been extensively studied and implemented for a plethora of applications because of their interesting optical properties. As such, localized surface plasmon resonances (LSPRs) are known to be collective charge density oscillations excited on the NPs surface under the incidence of an electromagnetic field (light), resulting in multiple enhancements. LSPRs promote the advancement of existing applications and give space for the creation of new ones. Specifically, the implementation of LSPRs spans from sensors such as biosensors [3] and electrochemical sensors [6], photovoltaics [1,2,7,8,9], and field-enhanced spectroscopies [10] to nonlinear effects [10], nano-optical devices for environmental purposes [11], and others [12].
Recently, researchers have shown that the optoelectronic properties of various devices can be enhanced by embedding plasmonic NPs into polymeric matrices [13,14,15,16]. The interest for such studies derives from the fact that an excessive amount of optically transparent polymers is being used to photovoltaics [17,18], sensors [19,20,21], interconnects [22], and other devices [23]. Depending on the polymeric matrix [24], and by changing the size [13], concentration [25], shape [26], and material [13] of the NPs, it is shown that the enhancement of LSPRs alters accordingly [14]. Therefore, these nanocomposite systems become attractive candidates for applications because of the way their properties can be manipulated. For that purpose, different fabrication techniques are being implemented, with some of the most distinguished ones so far being the vapor phase deposition and the wet chemical technique [13]. Even though these studies have paved the way for new plasmonic systems to be designed, most of them examine polymer-embedded NPs which are situated in liquid solutions, with the solid-state ones to follow.
In this work, we present a study of self-assembled Au NPs fabricated in situ by depositing them at an elevated substrate temperature of 440 °C on Corning glass. We compare these structures with identical samples fabricated firstly as continuous films at room temperature and subsequently annealed at 430 and 530 °C in air, respectively. We observe significant enhancement of the LSPRs for the NPs being annealed under medium vacuum during deposition compared to the ones being post annealed under air. The NPs were then covered by three different polymers via spin coating. The majority of the literature deals with the coating of noble metal NPs with single polymers. We elected to perform an investigation using diblock copolymers. Copolymers, or heteropolymers, are polymers derived from two or more monomeric species. Block copolymers are made up of blocks of different polymerized monomers. Such materials under certain conditions can exhibit a phase separation, leading to lamellae structures with sub-micrometer periodicity, leading to various applications, see, for example, Ref. [27] and references therein. The polymer-coated NPs show further LSPR enhancement. This enhancement has different features, depending on the type of polymers, along with the different NPs size. Theoretical calculations, using the Rigorous Coupled Wave Analysis (RCWA) method, have been performed in order to support, apprehend, and justify the experimental results [28,29].

2. Materials and Methods

2.1. Experimental Details

Ultrathin Au films with thickness th below 15 nm were deposited by a modified Balzers Union model SCD 040 direct current (DC) magnetron sputtering on Corning glass at 440 °C and at room temperature (RT), respectively. The films prepared at RT were then annealed in a muffle furnace (model Linn 63 Elektronik VMK 22) in air. The base pressure of the sputter coater device was 2 × 10⁻² mbar and achieved by a dual stage rotation pump. During the deposition, argon was inserted in the chamber through a leak valve and the total pressure was kept stable at 5 × 10⁻² mbar. The deposition rate was 0.35 nm/s. For the fabrication of the polymeric matrices, we used solid solutions of three different polymers: Polystyrene-block-polybutadiene-block-polystyrene (PS-b-PBD-b-PS); Polystyrene-co-methyl methacrylate (PS-co-PMMA); and Polystyrene-block-polyisoprene-block-polystyrene (PS-b-PI-b-PS), respectively. Afterwards, we dissolved each of the polymers into toluene solution, thus creating a 1.5% w/w solution. More specifically, 0.092 gr of PS-b-PBD, 0.096 gr of PMMA, and 0.065 gr of PS-b-Pi were dissolved in 6.143, 6.432, and 4.371 gr of toluene solution, respectively. The deposition of the polymers on the NPs was performed by a Chemat Technology KW-4A spin-coating device.
The thickness of polymer-films deposited on a Corning glass substrate was then measured at 54, 35, and 300 nm for PS-b-PBD-b-PS, PS-co-PMMA, and PS-b-PI-b-PS, respectively. Film and polymer thickness evaluation was performed with the help of Atomic Force Microscopy (AFM) images of the profile of a narrow scratch intentionally made on the film surface [30,31]. Films deposited at 440 °C are directly self-organized in the form of NPs. On the contrary, at RT Au films grow as continuous. Then, ‘‘nominal thickness’’ th for a self-organized film indicates the thickness of a smooth Au film, which would grow in the same deposition time at RT. The AFM device was a Multimode Microscope with a Nanoscope IIIa controller and a 120 × 120 μm2 magnet-free scanner (Model AS-130VMF) developed by Digital Instruments (Chapel Hill, NC, USA). The microscope operated in the non-contact (tapping) mode [32].
The ultraviolet-visible UV-Vis spectra were recorded at RT in the transmission geometry with the help of a Shimadzu UV-Vis Spectrophotometer, Model UV 1800 (Shimadzu, Kyoto, Japan) at wavelengths 200–1100 nm. The monochromator of the Spectrophotometer was calibrated with the help of prototype materials; therefore, the error bar in the measurements is of the order of 1 nm only.

2.2. Theoretical Model

The modeling of the Rigorous Coupled-Wave Analysis (RCWA Method) basically attempts to study of the propagation of electromagnetic waves into a periodic arrangement. It is a less time-consuming method for the calculation of the electric field of the region, when the incident wave enters the investigated region as the discretization of the latest into layers, in which the refractive indices are considered stable, enabling the solution of the eigenvalues of the refractive indices in the form of a matrix, by applying Fourier expansions. The relative permittivity for each layer is described accordingly:
ε   x , y , z = ε x + Λ , y + Λ , z = p , q ε p q z e i ( p K x x + q K y y )
where Λ is the grating period, εpq the Fourier component of grating permittivity Κx = Κy = 2π/Λ, and i = (−1)1/2
The mathematical formula of the electric field of Region I, the income region, is the following:
E I = e i ( k x i x + k y i y + k z i z ) + nm R n m e i ( k x n x + k y m y + k z n m i z )
where kxn = kx0 + nKx, kyn = ky0 + mKy, kznmi = √(k2εi − k2xn − k2ym), kx0 and ky0 are the x and y components of the incident plane wave, and k = 2π/λ, Rnm is the n, m order backward diffracted wave.
The mathematical formula of the electric field of Region II, the electric field for each layer, is the following:
E I I = n m S n m z e i ( k x n x + k y m y + k z n m i z )
where Snm(z) are the space harmonics field amplitudes, and as for Region III, the outcoming region, the electric field is described by the next formula:
E I I I = n m T n m e i ( k x n x + k y m y + k z n m o z d )
where kznmo = √(k2εo− k2xn − k2ym), Tnm is the n, m order forward diffracted wave. This analysis also applies for the magnetic field.
The resolution of the electric field formulas is based upon the assumption that n = N and m = M at the boundary conditions z = 0 and z = d, resulting in the solution of Rnm and Tnm values of a 4 × 4 system with four unknown variables.

3. Results

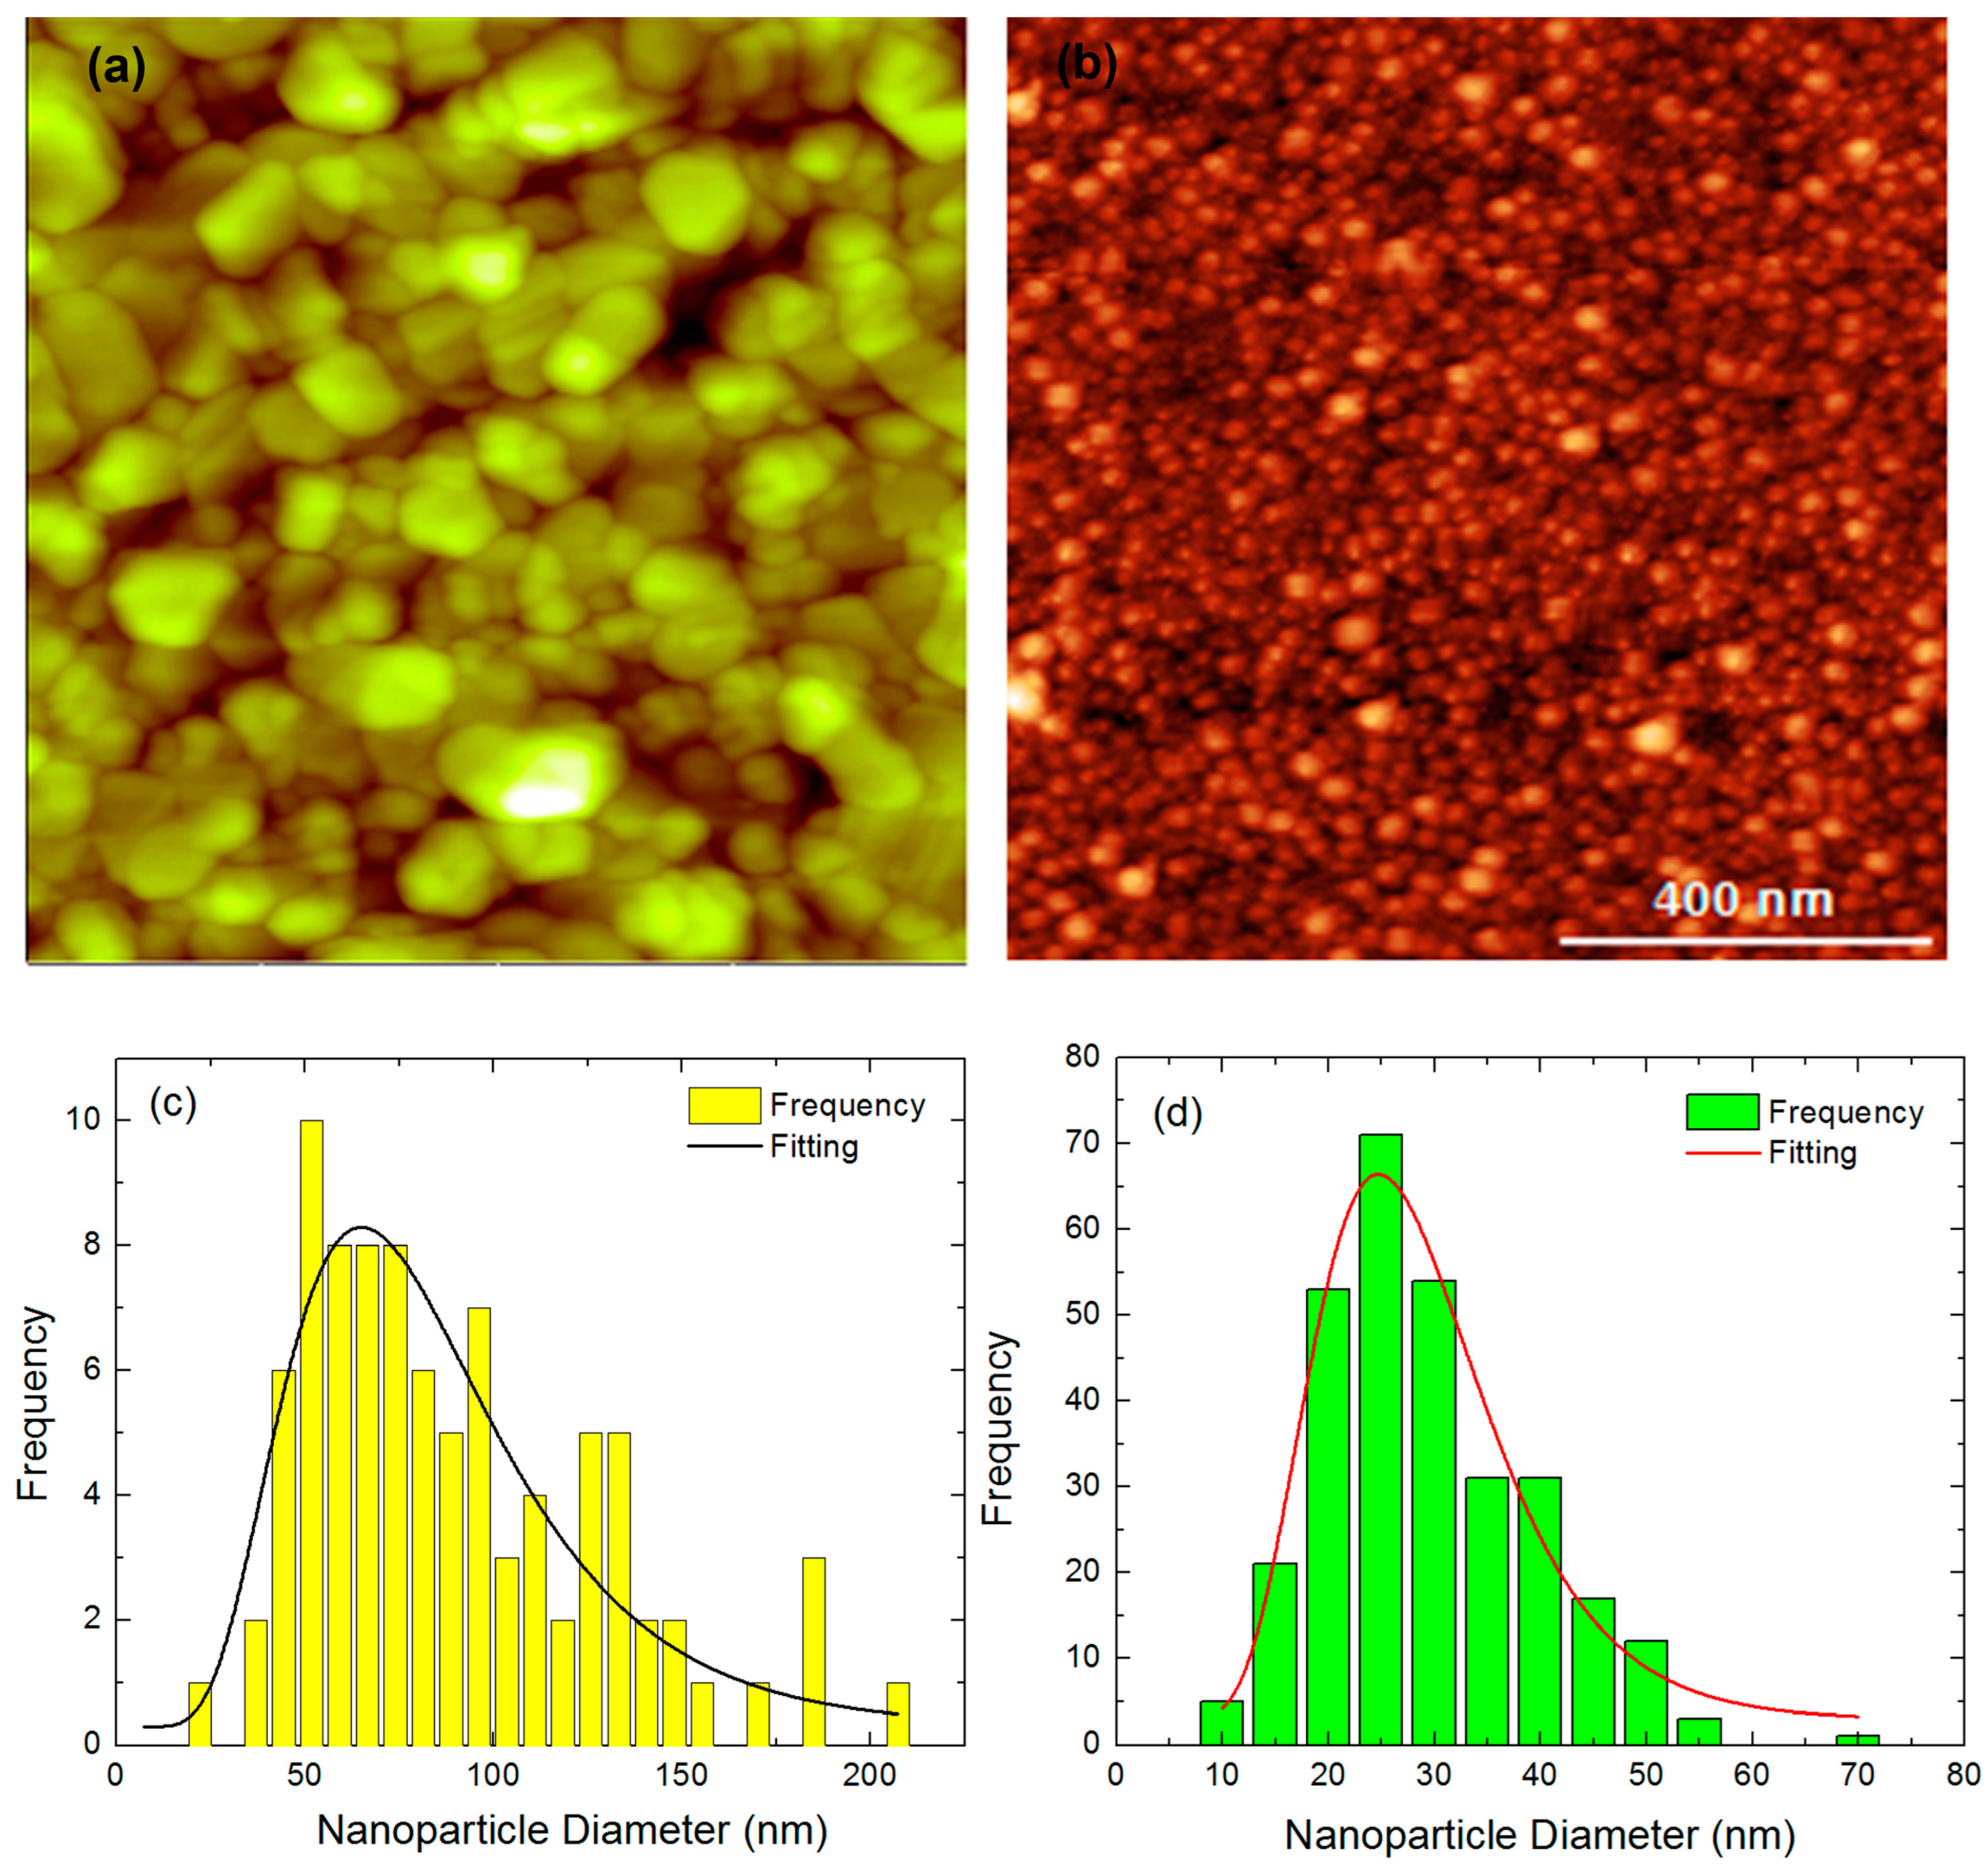
The deposition of two Au films with th = 10 nm was first conducted in order to select the optimum deposition conditions of the LSPRs formed prior to the covering of the films with polymers. The first film was fabricated at RT and post annealing was performed in air at either 430 °C or 530 °C for about 20 min. The second film was deposited on the substrate at a temperature of 440 °C. In Figure 1, we compare their UV-vis. spectra. One may see that, for the RT sample, annealing at higher temperature results in a narrower LSPR. However, the as-deposited film at 440 °C substrate temperature presents the most intense and best-shaped LSPR. This observation agrees with the results of a previous work for films with smaller th [5]. The difference in the LSPR shape originates from a narrower distribution of the self-assembled nanoparticles. In Figure 2a,b, we show AFM images of the surfaces of the first sample annealed at 430 °C and the second sample deposited at a 440 °C, respectively. The NPs of the second sample are small and homogeneous.
This can be better concluded from Figure 2c,d, where we show the corresponding particle-size distributions. Fitting was attempted following the logarithmic-normal distribution function [33]. For the first sample, the NPs mean diameter D is 65 nm and the full width at half maximum of the distribution (FWHM) is about 67 nm. For the second sample, D is 25 nm and FWHM is about 20 nm. The fact that, for the second sample, the temperature of the substrate was maintained at 440 °C allowed for the NPs to more easily take their final nearly spherical equilibrium shape [34]. The deposition temperature is more effective than the same temperature of annealing continuous films; even a relatively high deposition temperature allows the sample to obtain the equilibrium shape immediately during deposition, without the need to overcome thermodynamic diffusion barriers that may be introduced when a continuous or semi-continuous film is formed at low deposition temperatures. We think that the uniformity in shape of Au nanoparticles prepared at 440 °C resulted in better quality LSPRs.
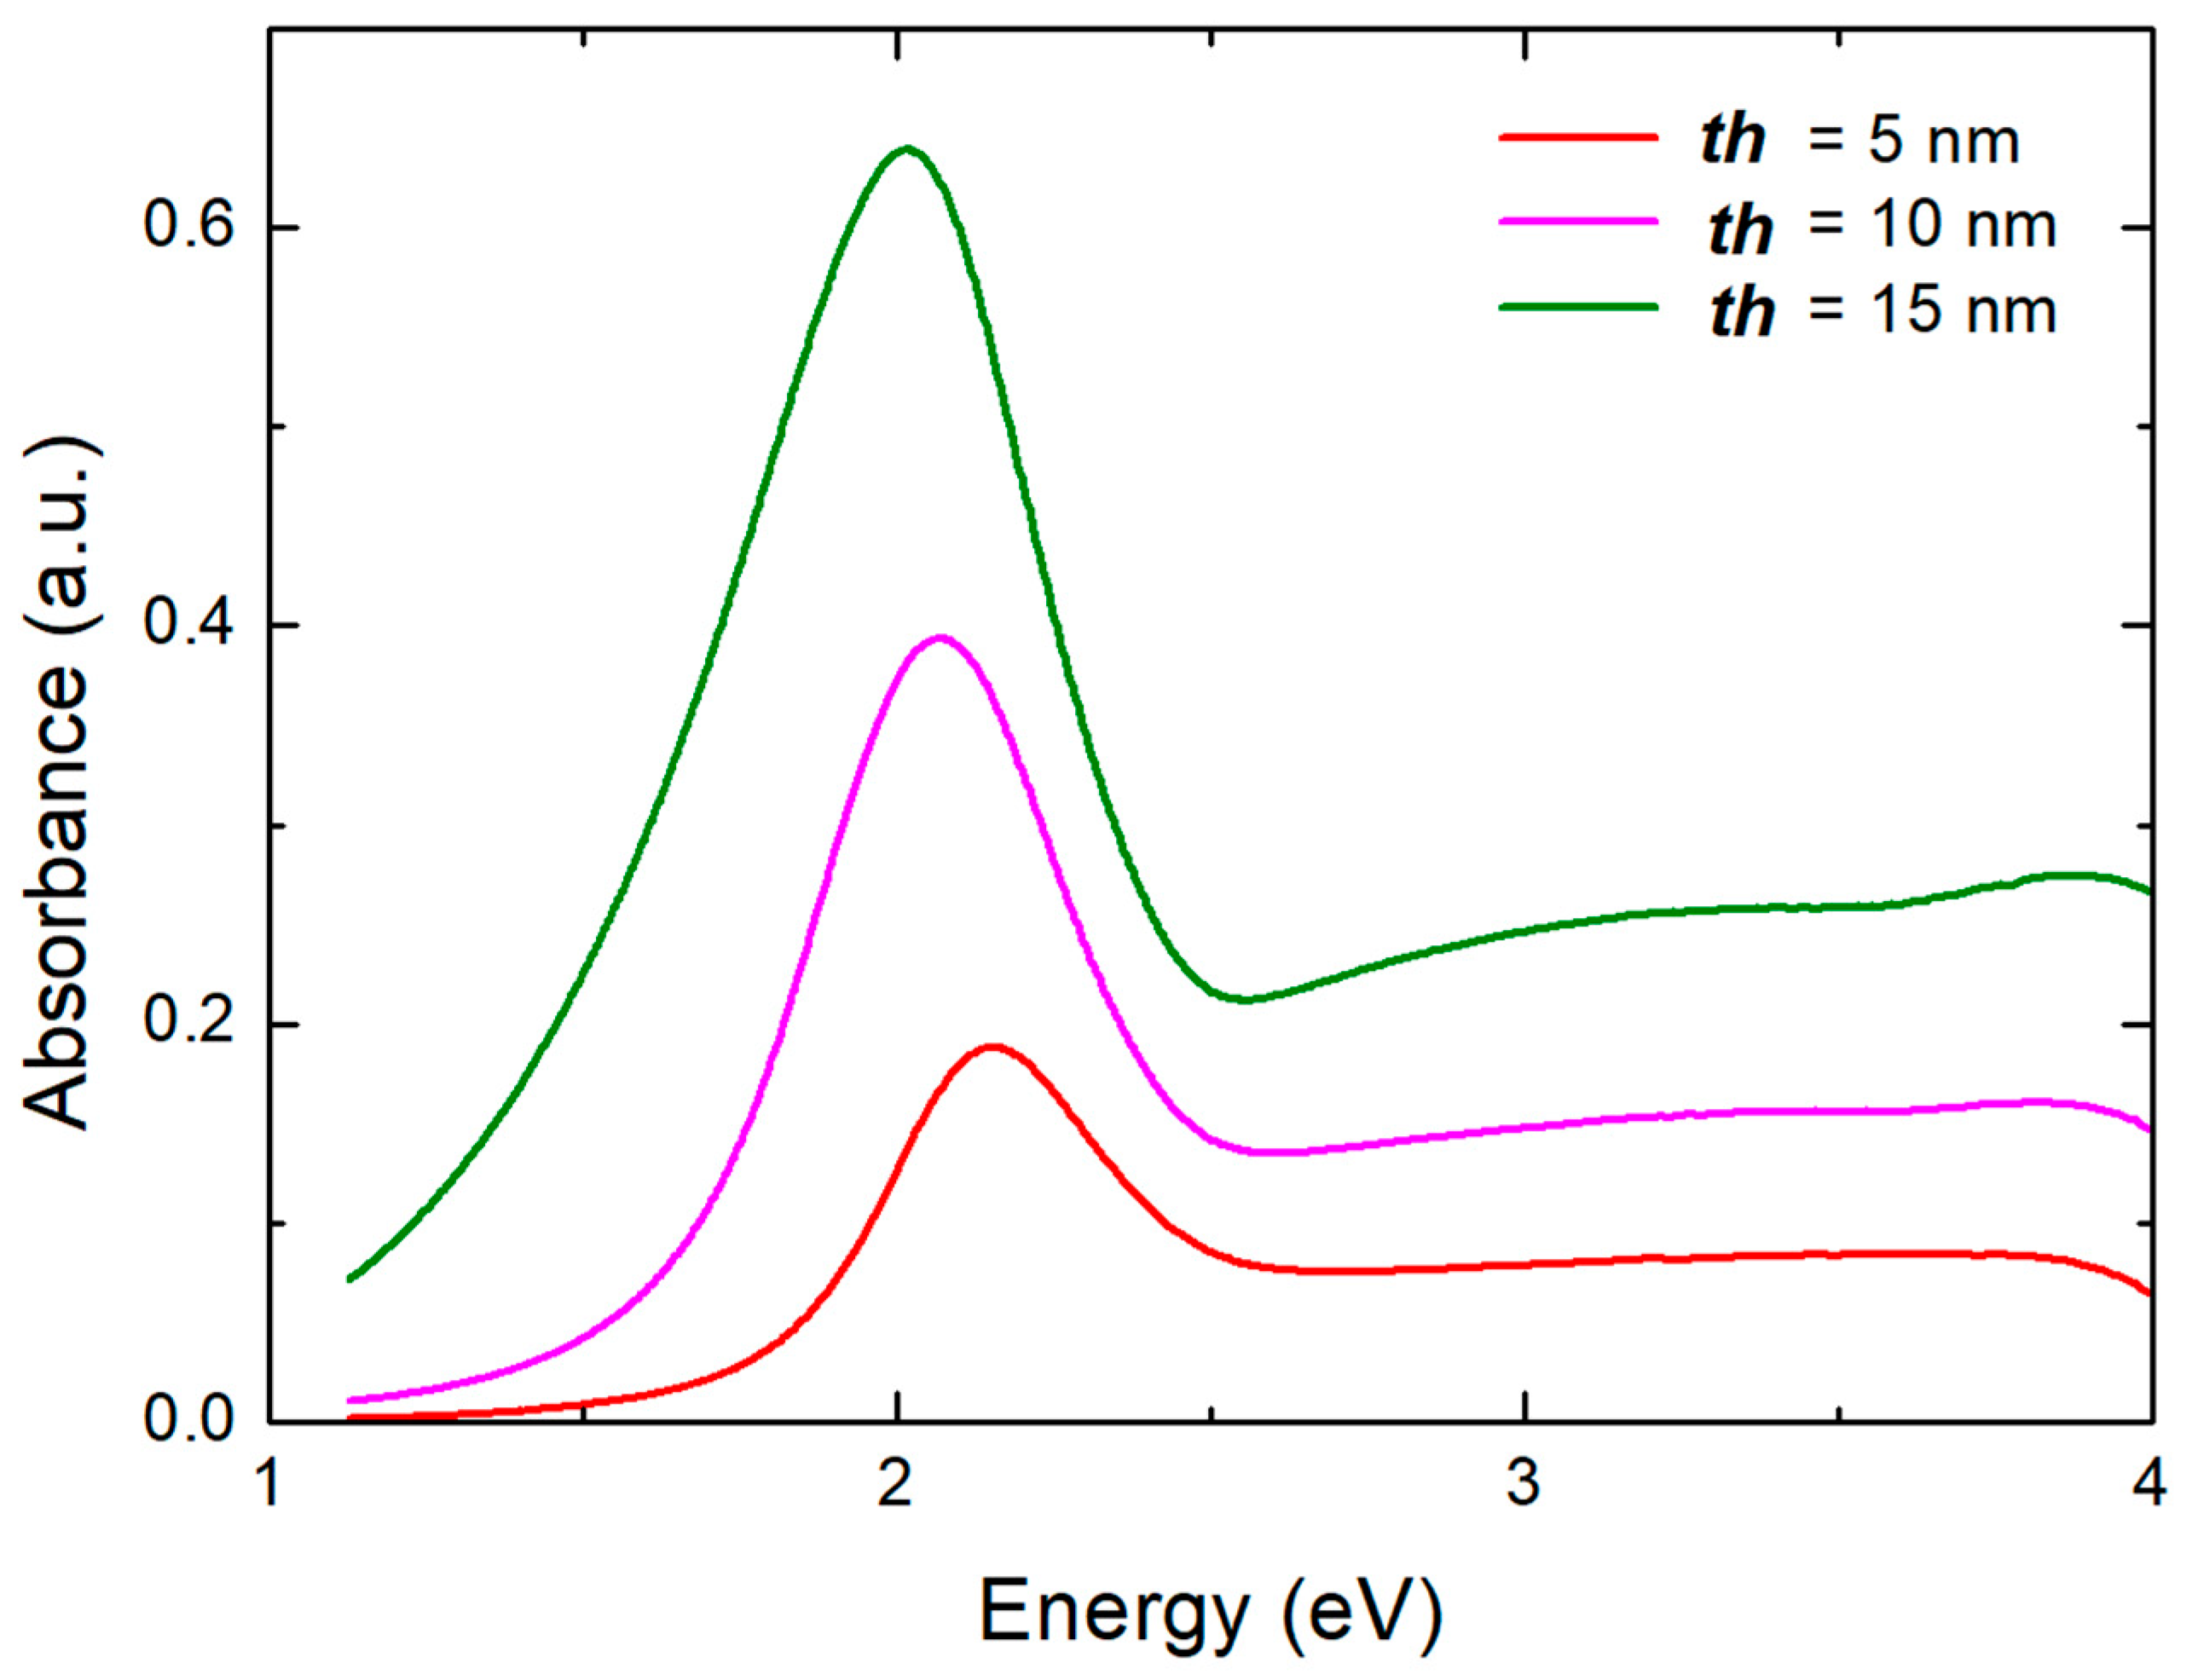
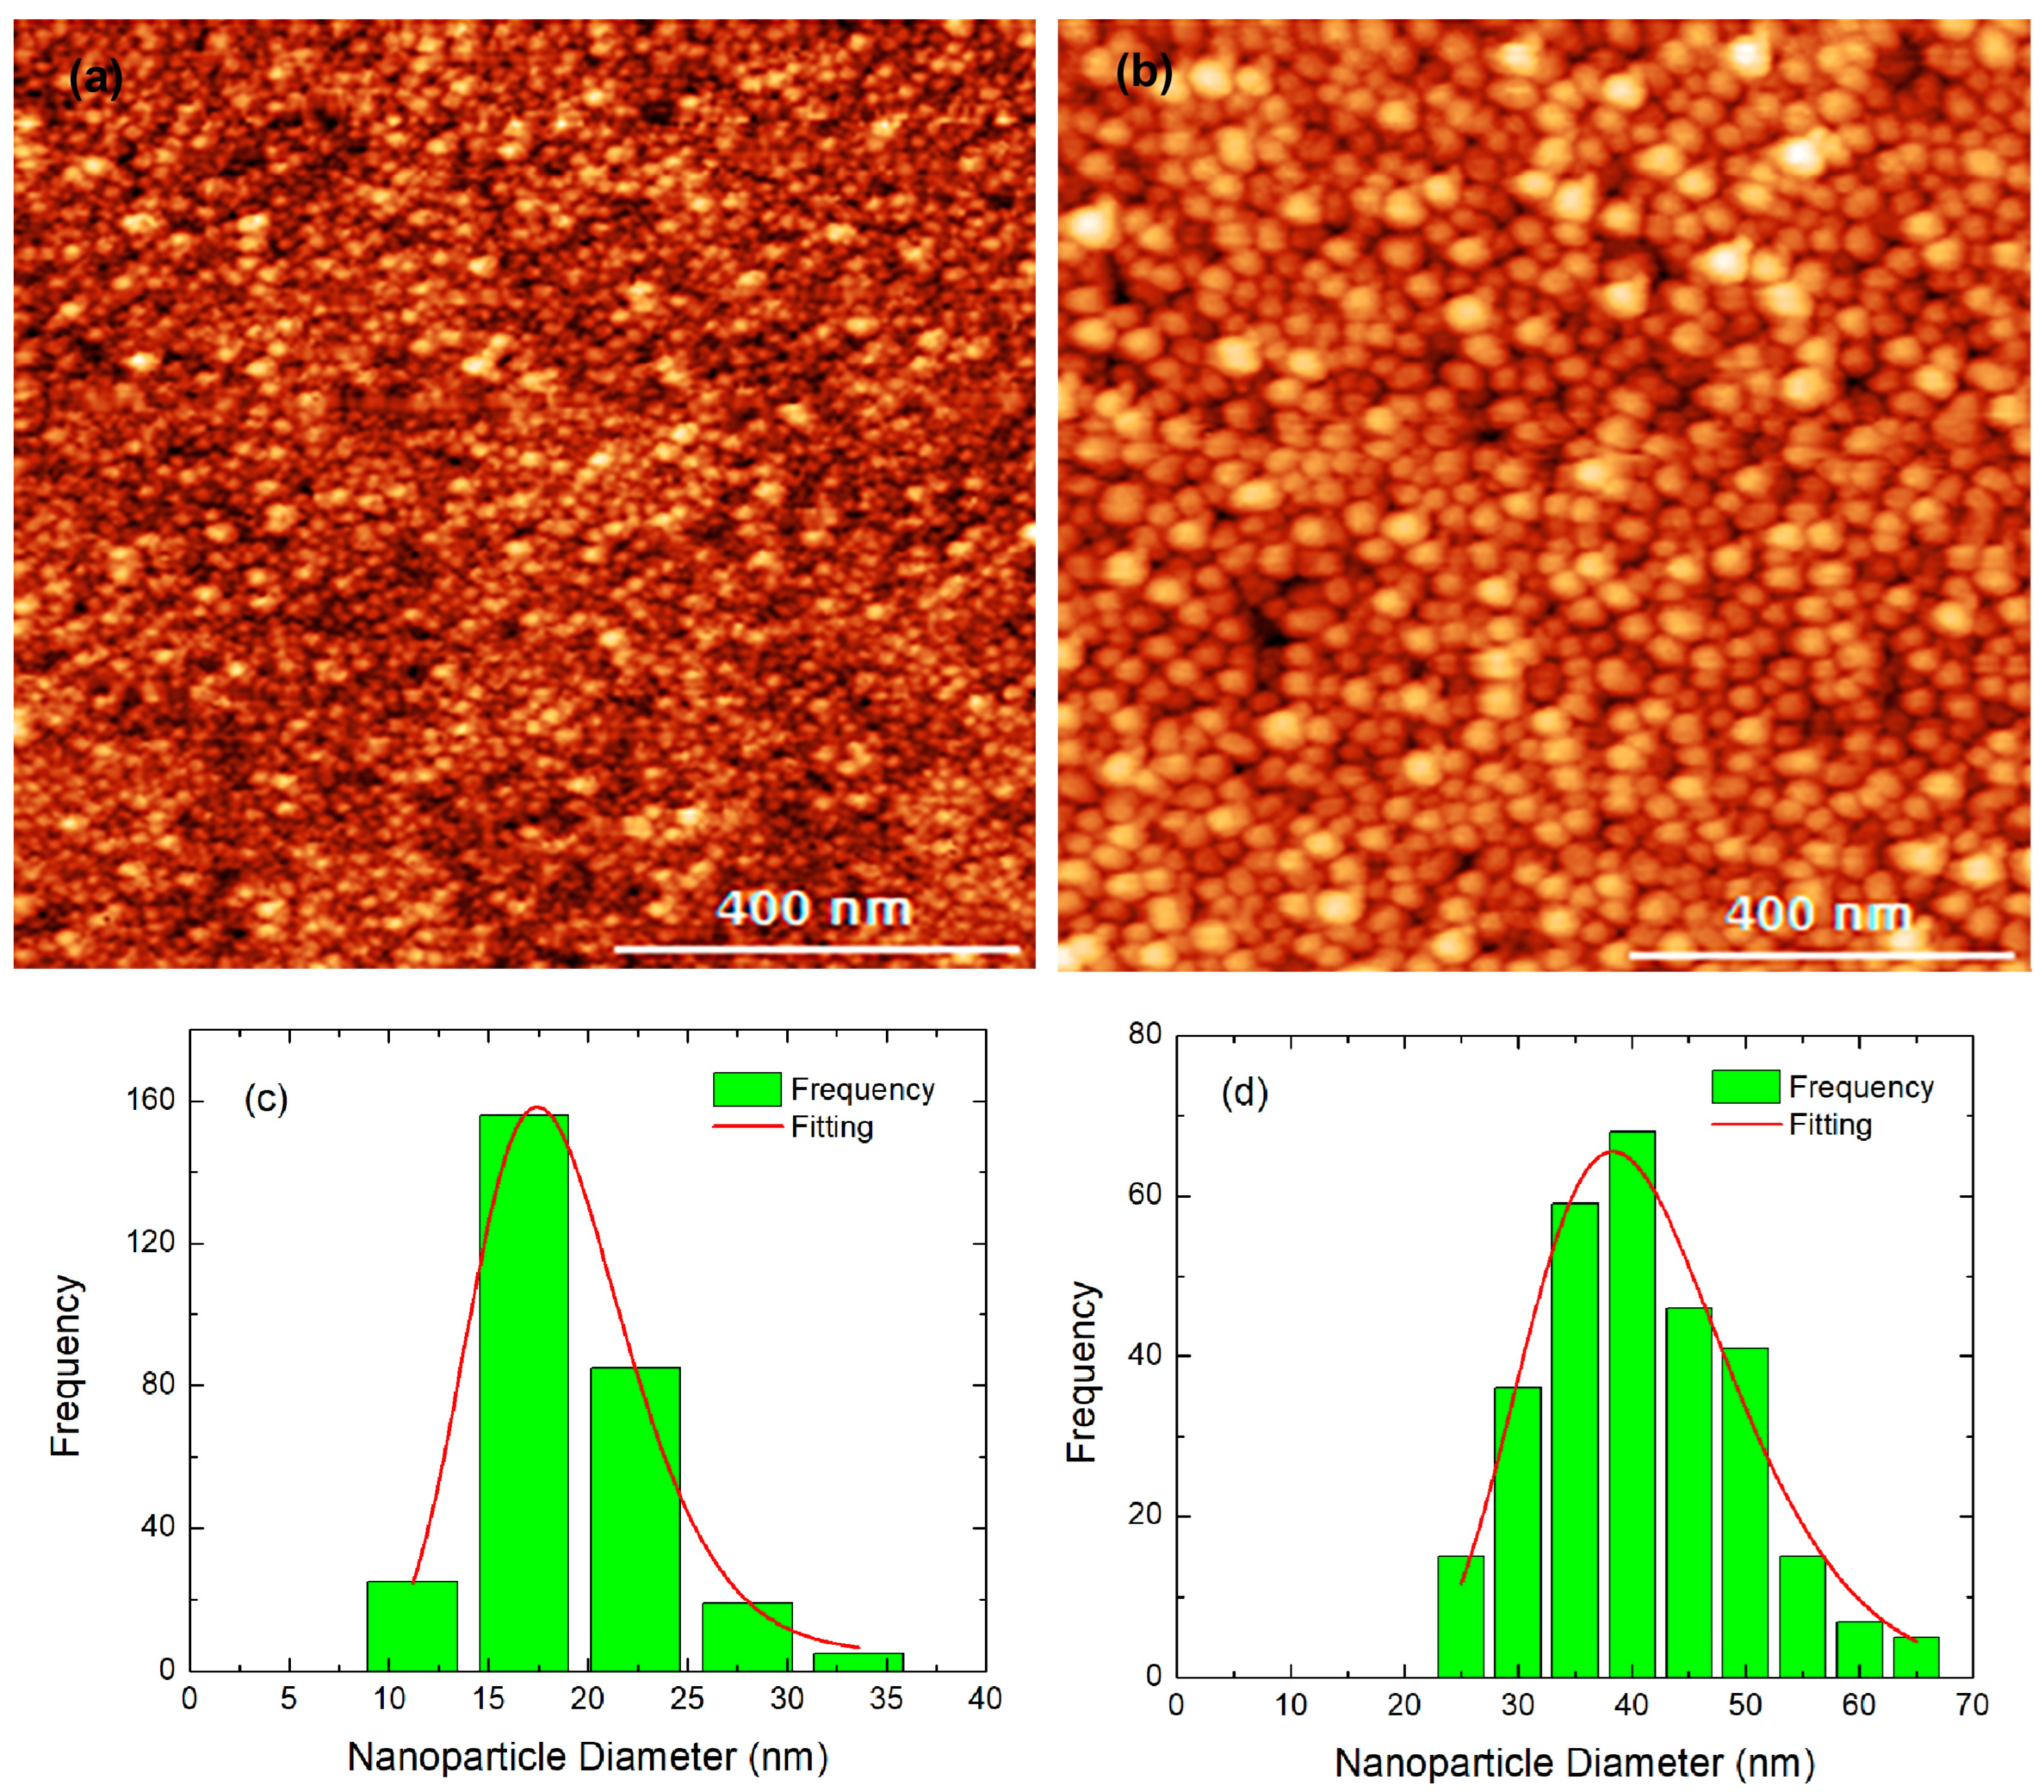
We decided to elaborate with films deposited at 440 °C. In Figure 3, we present LSPRs from three films with ‘‘nominal thickness’’ th equal to 5, 10, and 15 nm, as indicated. One may see that the LSPR amplitude increases with th or, equivalently, the mass (number of atoms) of Au. The LSPR position, on the other hand, is much less sensitive. To interpret these trends, one has again to perform AFM experiments for the th = 5 and 15 nm films, as data for the th = 10 nm film were already presented in Figure 2. The results are presented in Figure 4. One may observe well-formed and comparable, in terms of size, nanograins. The nanoparticle diameter D is of about 17.5 and 38 nm for th = 5 and 15 nm, respectively. The size distribution of the NPs is relatively narrow, compared to post annealed samples, and the FWHM has the values of 9.4 and 21 nm for th = 5 and 15 nm, respectively.
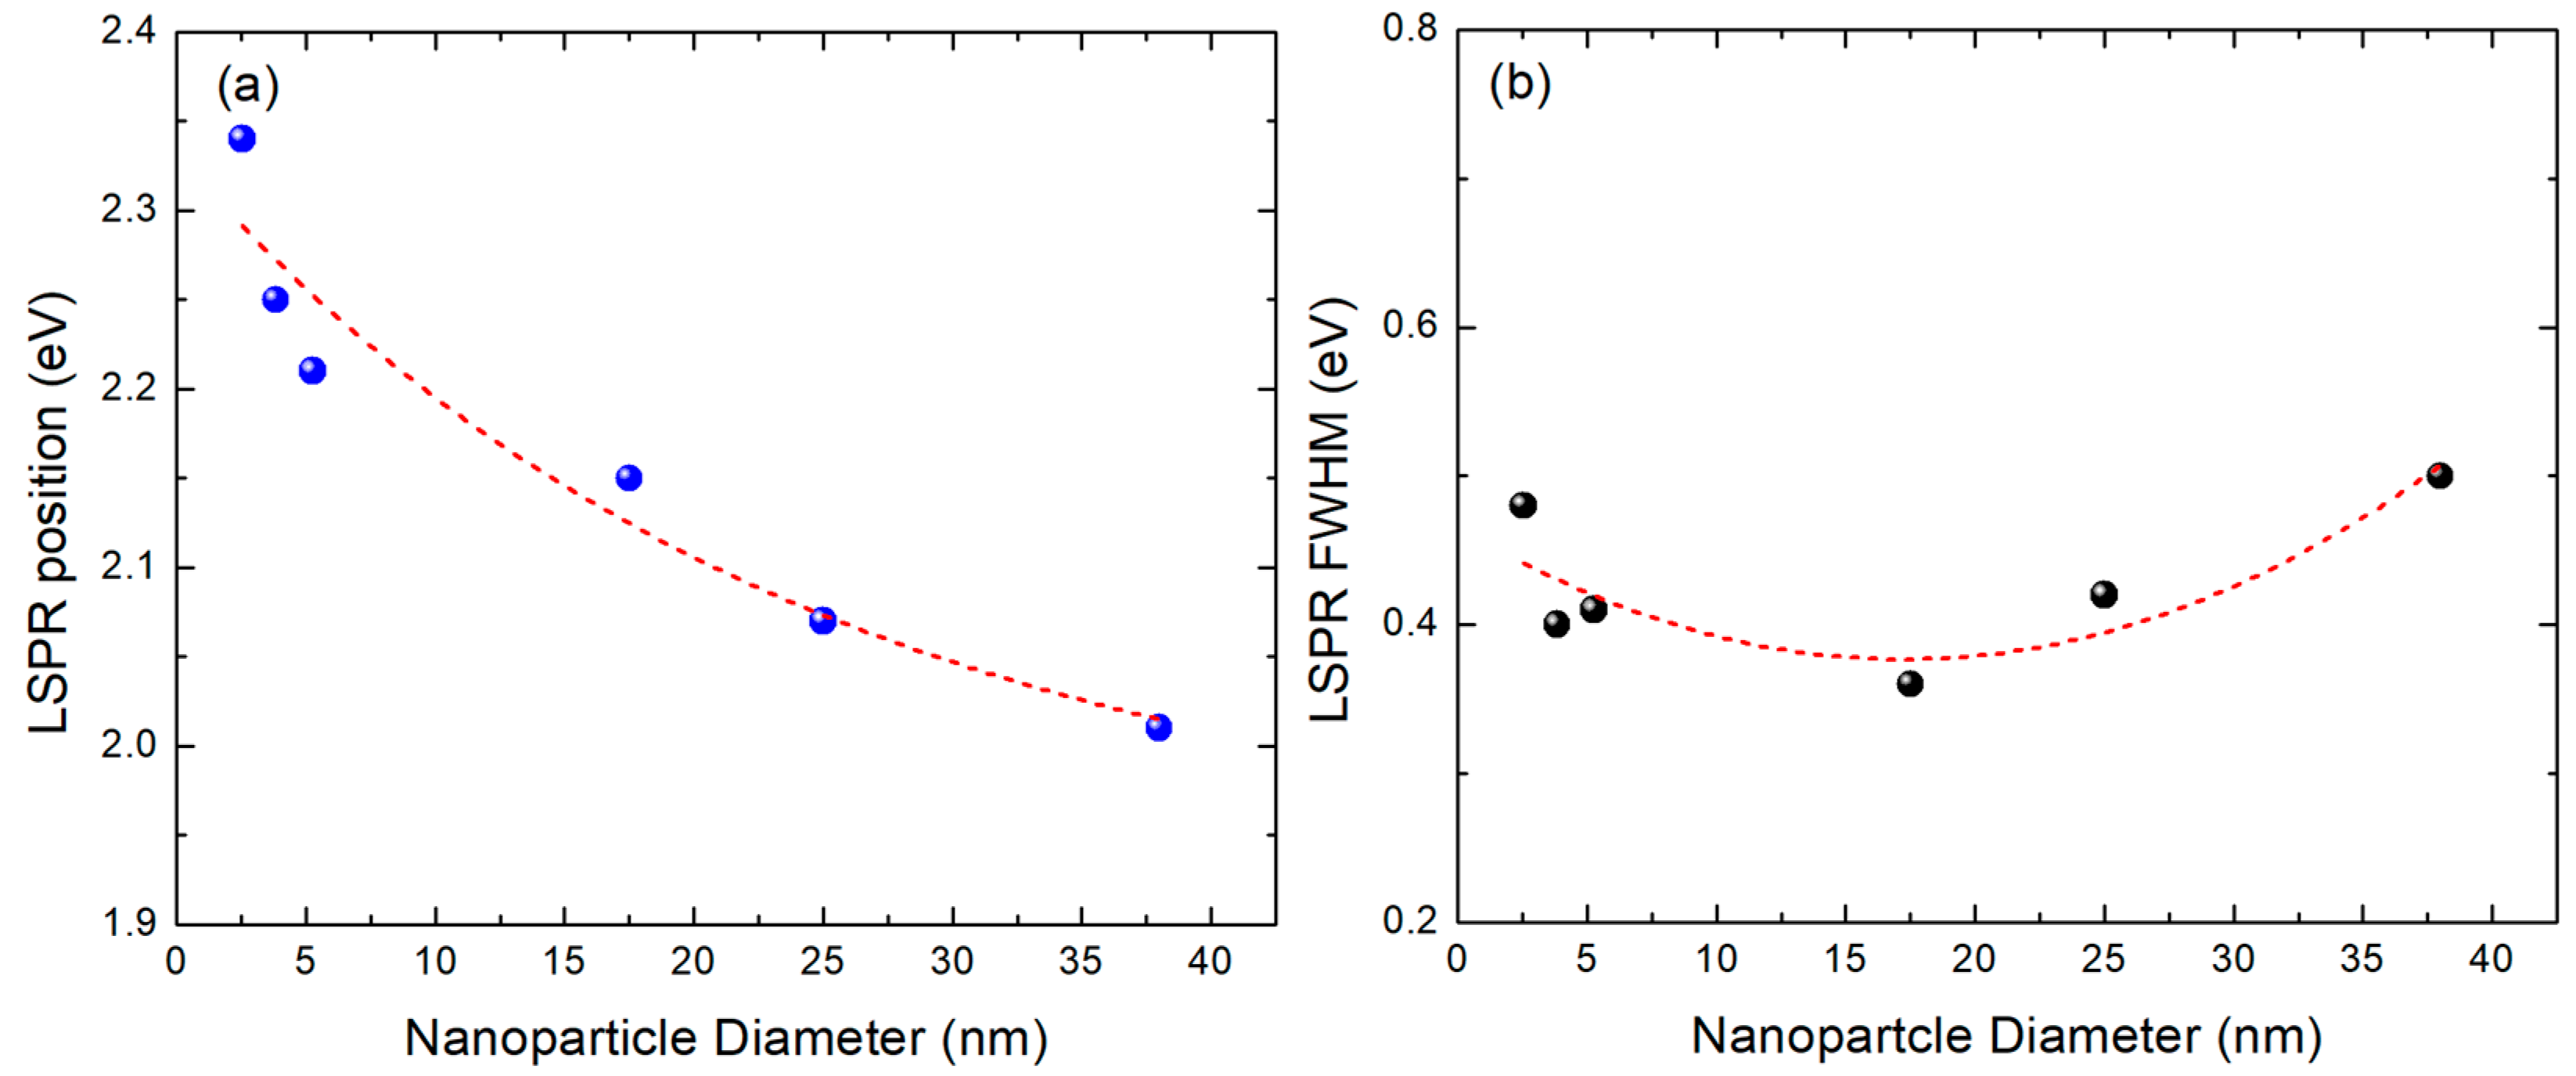
In Figure 5, we present (a) the position and (b) the FWHM of the LSPRs for six Au films fabricated under the same experimental conditions. The LSPR position seems to show an almost exponential decay leading to a saturation in the LSPR position for D over 40 nm. This red shift with the increase in NPs diameter has been discussed in detail in Refs. [35,36,37]. On the other hand, the LSPR FWHM does not seem to alter much with D. One may interpret these data points as scattered around a mean value. We think that this behavior originates from the fact that these samples are prepared in a very similar manner, while samples that are post annealed are more difficult to control and, consequently, exhibit broader LSPRs. If the small curvature in the middle of the diagram of Figure 5b has some meaning, then the best result in terms of narrow LSPR has to be attributed to NPs with a mean diameter D of about 15 nm, reflecting the best film quality.
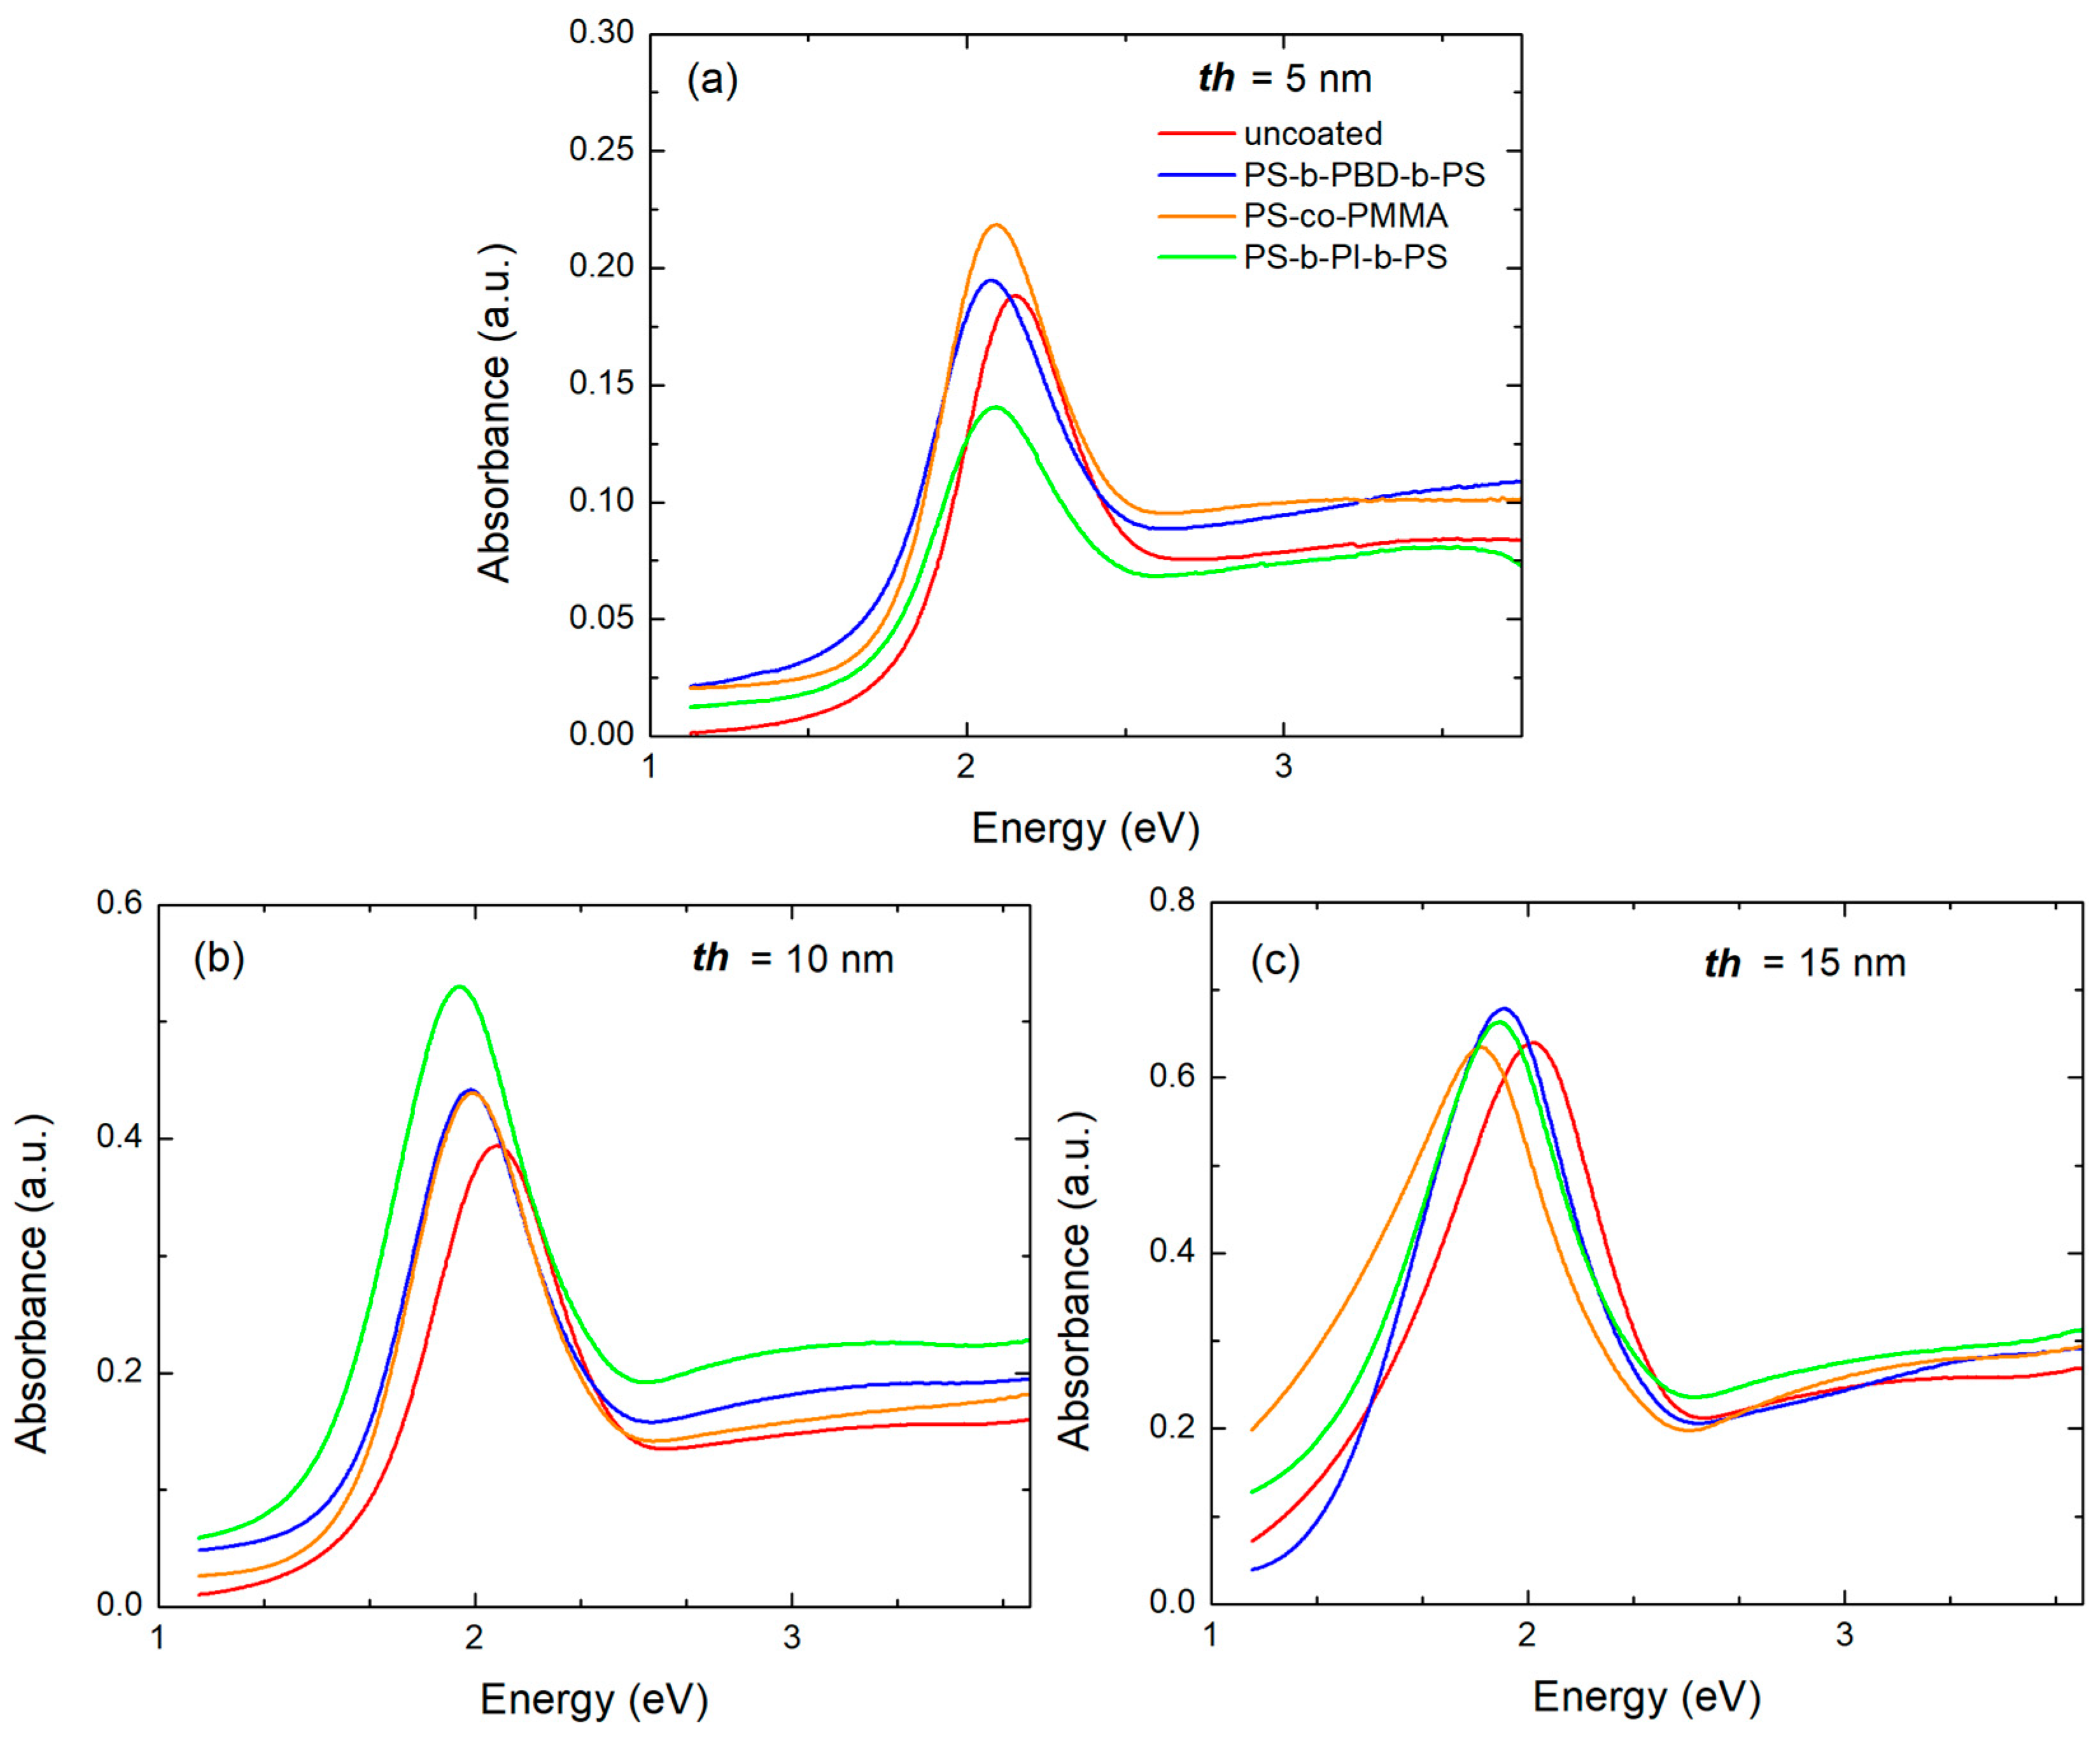
In Figure 6, we show UV-vis. spectra of films with th equal to 5, 10, and 15 nm for uncoated and coated with various polymers. Table 1 summarizes the main optical parameters such as LSPR position, FWHM, and ratio of intensities LSPRcoat/LSPRuncoat of coated to uncoated NPs as derived from Figure 6a–c. The main observation, which is systematic for all films, is that the coated films have a red shift, in other words, a shift to lower energies of the LSPR position. This may be understood by the fact that, before coating, the NPs were covered by air with a dielectric constant of 1. The polymers, on the other hand, have a dielectric constant of about 1.5. Exact values are provided in the next section where theoretical calculations are performed. Considering that the dielectric constant of glass (SiO2) is about 3.9, the average dielectric function of the material, which surrounds the Au NPs, increases by replacing air with polymers. This effect has also been observed, for example, in Au and Ag NPs embedded in NiO matrices, as NiO possesses quite a large dielectric constant. The LSPR FWHM slightly increases by coating as evidence of slight increase in inhomogeneity, in terms of no structural perfection of the coatings. However, this effect is too small to be seriously considered. Interestingly, in most cases the polymeric coating results in a small enhancement of the LSPR amplitude.

4. Discussion

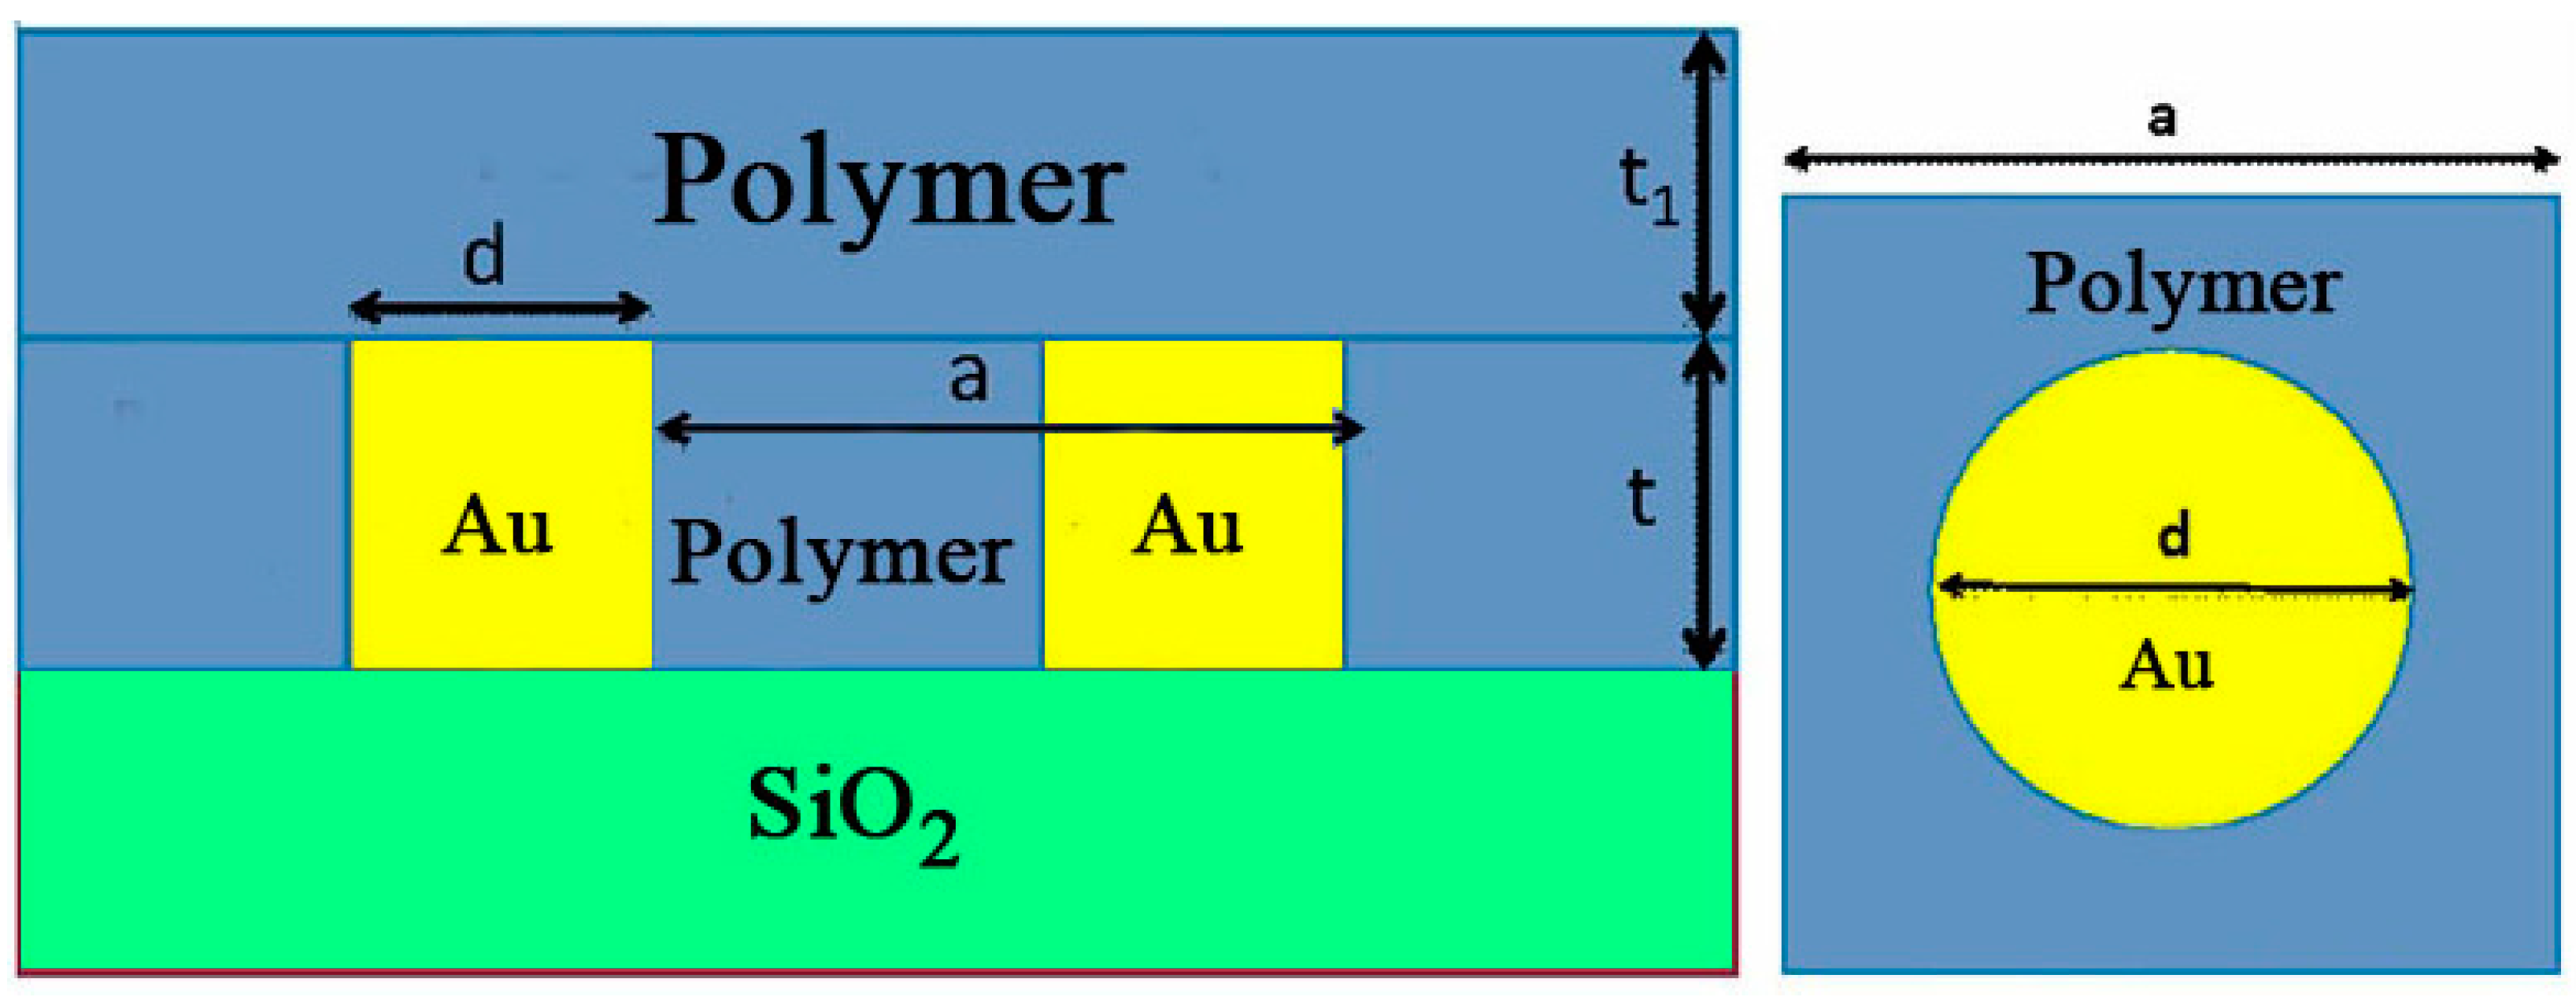
Hereby, calculations have been carried out in order to evaluate and capitalize the experimental results produced and described in the previous paragraph of the present study. Figure 7 illustrates the modeled system. NPs are represented as cubes and cylinders, as RCWA better handles objects having their cross-section into z axis, see, for example, Refs. [37,38]. The NPs are placed on top of SiO2. They are surrounded by polymers, with the latest serving as a matrix. It is previously mentioned that the calculation of the disorder structure probed by AFM is a tedious task, requiring supercell, and consuming time and memory. On the other hand, calculating one individual metal nanoparticle is not reliable because, experimentally, NPs are in the vicinity. For that reason and to get concrete calculations, periodic array between nanoparticles was applied. However, the calculated absorbance amplitude value is expected to be greater than the corresponding experimental [39].
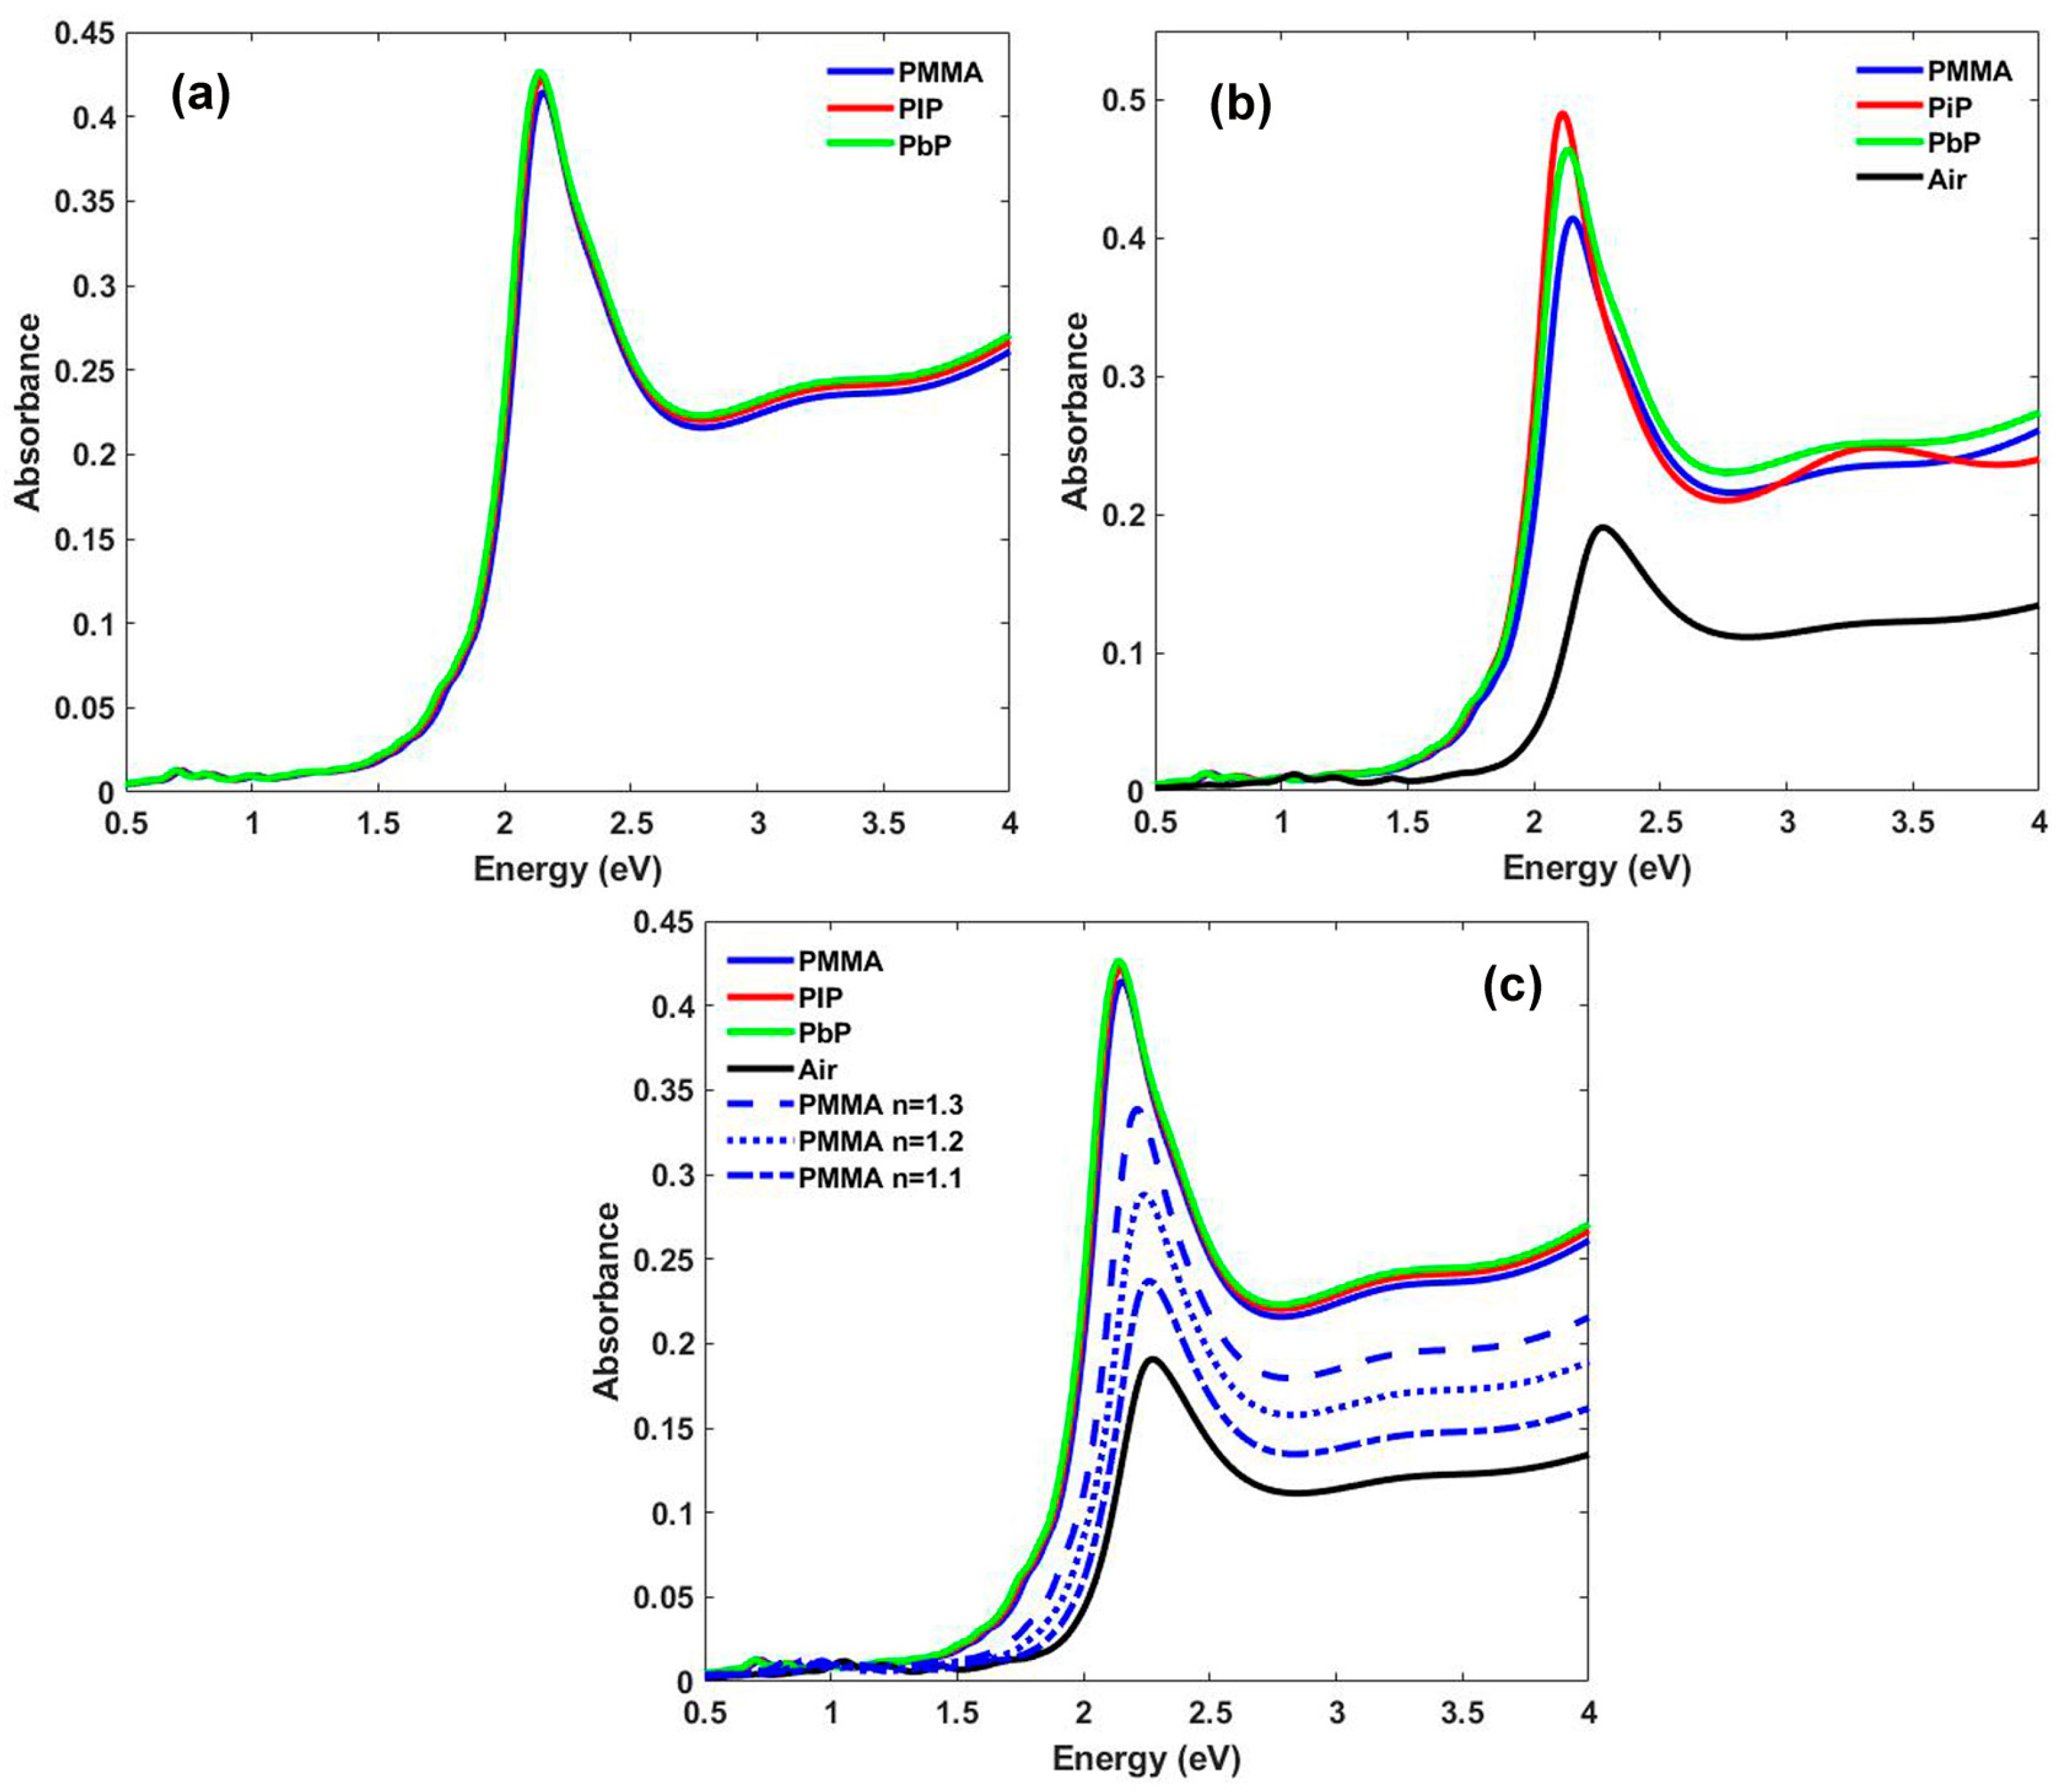
In our calculations, d varies between 15–40 nm to simulate the experimentally recorded values. Refractive indices have close numeric values which are 1.491 for PMMA, 1.521 for PiP, and 1.539 for PbP [40]. Copolymers’ refractive index values are estimated as mean values of the refractive index values of the component polymers. Calculations regarding the impact of these values on LSPRs have been carried out for several scenarios and the differences are greatly reduced, as shown in next paragraphs, concluding to perform the primary values of [40]. Initially, we did calculations for d = 25 nm (film with “nominal thickness” th = 10 nm), a = 2d, t = d, and t1 = 35 nm. Figure 8a emphasizes the difference of LSPRs positions due to different polymer values is practically negligible. On the contrary, when altering t1 values to simulate the experimental values of substrate thickness, small differences regarding the intensity of LSPRs and not the position occur, according to Figure 8b. The LSPRs of the coated NPs are more intense than the ones of uncoated NPs (Figure 8b). The LSPRs position of the coated particles shows some red shift. This shift varies between 2.12 eV- 2.16 eV for the covered NPs and, as for the NPs surrounded by air, the LSPR position is located at 2.27 eV. The intensity reduction for the uncovered NPs, 0.19, is significant compared to the LSPR intensity for the covered NPs, which is between 0.41–0.49, respectively. These shifts are caused by the increase in the refractive index n from 1 (air for uncoated NPs) to about 1.5 (polymers for coated NPs). Indeed, Figure 8c nicely demonstrates the change in the LSPR spectra because of the progressive hypothetical increase in the refractive index of PMMA from 1 to 1.5. On the other hand, the limited difference of refractive index values, 1.493 for PMMA, 1.521 for PiP, and 1.539 for PbP is responsible for the reduced resonance shift.
Figure 8 supports the interpretation of the LSPRs intensity for both uncoated and coated NPs. From the comparison of the experimental and theoretical data, it is evident that the experimental results mostly display the plasmonic characteristics of the enhanced intensity after coating, see Figure 6b. However, analysis of the calculation data reveals neither LSPR position nor intensity shifts are significant compared to the experimental data. The simulated NPs are considered to be perfect objects, characterized by monodisperse distribution, with no imperfections or inhomogeneities, unlike the ordinary NPs produced through the experimental methods. Therefore, the calculation represents the ideal conditions of the experiment. Moreover, we have to notice that our RCWA calculations show a red shift of the resonance frequency with an increase in the absorbance as the refractive index of the polymer increases. A potential presence of charge groups in the polymer would mostly affect the imaginary part of the refractive index of the polymer (which is zero in our calculations) and it would likely increase the overall absorbance.
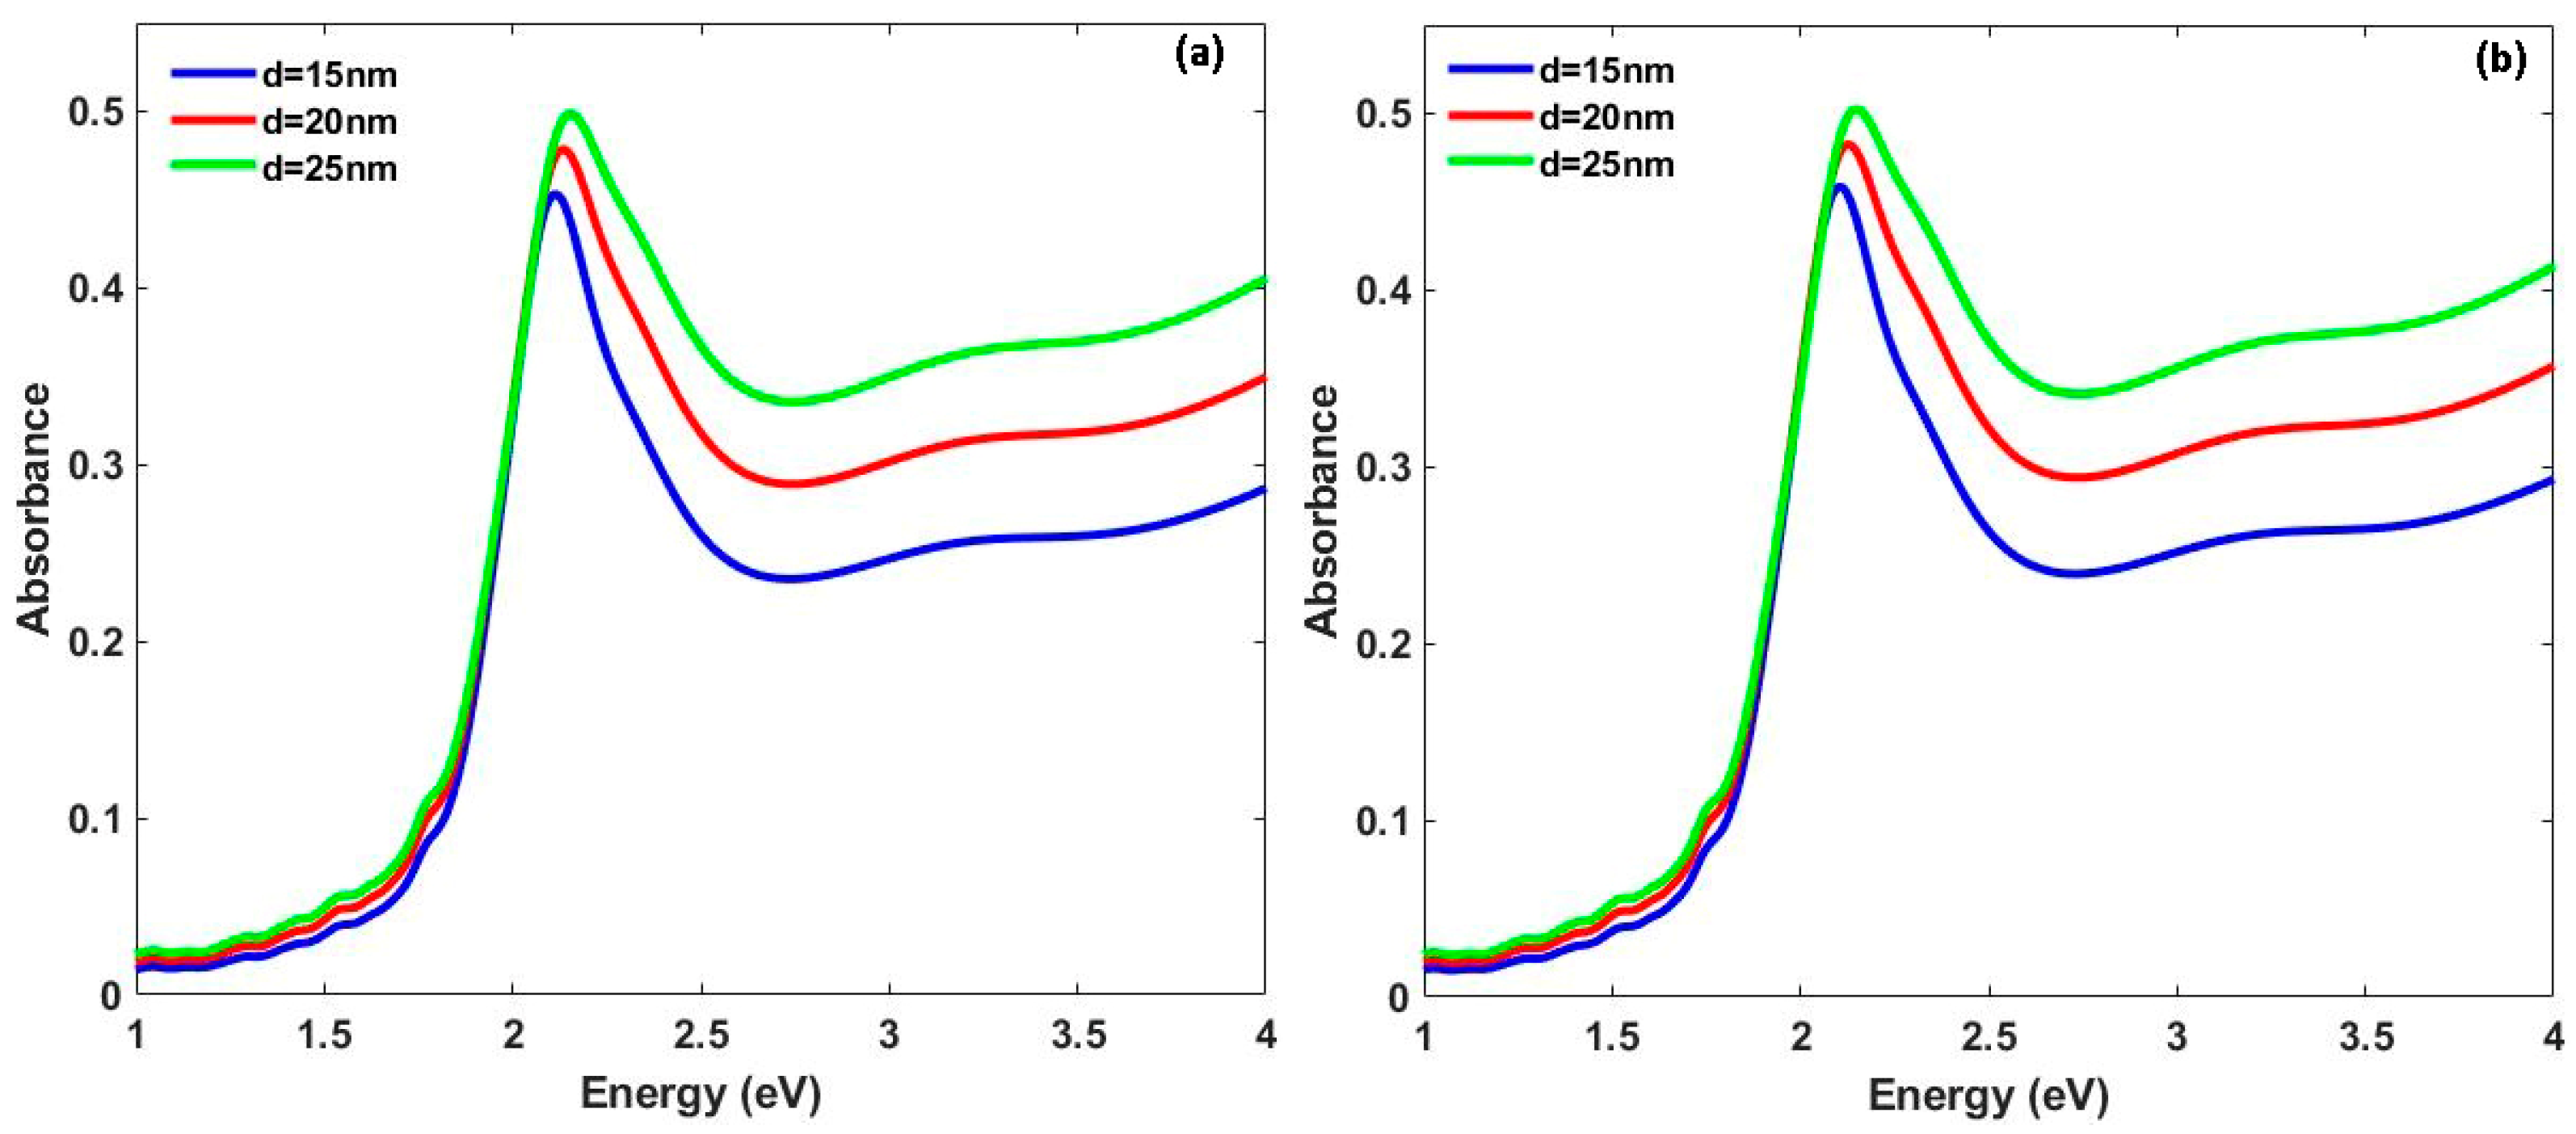
Finally, Figure 9 represents the theoretical effort to interpret the increase in the LSRP intensity with the increase in the NPs diameter following the experimental trends. Two different plots of Figure 9, depending on different polymeric matrix, are introduced. Figure 9a reflects the LSPR position and absorbance changes for three different diameter values, d = 15, 20, and 25 nm when NPs are embedded in PMMA environment and Figure 9b reflects the LSPR alterations when PiP is the surrounding material. For each diagram, all graphs are depicted into common axis system. For the smaller diameter value, d = 15 nm (blue graph) the LSPR is located at 2.11 eV for PMMA and at 2.10 eV for PiP. For the next diameter value, d = 20 nm (red graph) an increase in values for both the position and intensity is monitored regardless of the type of dielectric. In particular, the LSPR position values are located at 2.14 eV for PMMA and at 2.13 eV for PiP, while the increase in the intensity values is from 0.45–0.48 and 0.46–0.48, respectively, with a blue shift being observed and further noticed for d = 25 nm (green graph). With this increased diameter value, the blue shift of LSPRs is maintained for both types of dielectric, and the LSPRs are positioned at 2.15 eV and 0.50 either it is PMMA or PiP. The comparative study of these last figures points out that the type of coating scarcely affects the position and intensity changes, probably attributed to the fact that the refractive index value of the two different coatings is very similar. The experimental results are also verified as the increase in NPs diameter results in the increase in the LSPR intensity.
To summarize, depending on the dielectric environment in which the metallic NPs are embedded, their LSPR enhancement may, respectively, differ dramatically. A variety of polymers are used in applications where LSPRs play a pivotal role in the enhancement of their optoelectronic properties and, therefore, towards their overall performance. Here, we present the case of gold NPs of different sizes covered by three separate polymer coatings, and consequently examine their LSPR enhancement. We show that by altering the size of gold NPs, we tune their LSPR to its optimal enhancement within each of the polymer coatings. The theoretical calculations of the present work support the experimental findings and promote the importance of tuning of LSPRs, accordingly. We foresee that these systems can potentially be implemented in the future towards many applications, such as solar cells, sensors, and many others.

5. Conclusions

Au NPs were fabricated either by depositing Au thin films on substrates, with the deposition taking place at an elevated temperature or at room temperature and then post annealing. The first experimental technique produced better shaped LSPRs, and those NPs were afterwards coated by a series of polymers. The systematic study of the samples highlighted a statistically small increase in the LSPR intensity and a small red shift in the LSPR position compared to the NPs surrounded by air. The implementation of the RCWA method facilitated the understanding of these trends, delivering sufficient interpretation of the localized surface plasmonic resonance behavior regarding gold nanoparticles covered by polymeric coatings.

Author Contributions

Conceptualization, S.G.; methodology, A.S. and P.P.; software, M.T.; validation, A.G.C. and M.S.; formal analysis, D.G.; investigation, V.K., D.N. and D.M.M.; writing—original draft preparation, A.S. and P.P.; writing—review and editing, P.P.; visualization, M.T and M.S.; supervision, M.S.; project administration, S.G. and A.S. All authors have read and agreed to the published version of the manuscript.

Funding

This research received no external funding.

Institutional Review Board Statement

Not applicable.

Informed Consent Statement

Not applicable.

Data Availability Statement

Data sharing not applicable.

Conflicts of Interest

The authors declare no conflict of interest.

References

  1. Barbillon, G. Latest Advances in Nanoplasmonics and Use of New Tools for Plasmonic Characterization. Photonics 2022, 9, 112. [Google Scholar] [CrossRef]
  2. Hutter, E.; Fendler, J.H. Exploitation of localized surface plasmon resonance. Adv. Mater. 2004, 16, 1685–1706. [Google Scholar] [CrossRef]
  3. Loiseau, A.; Zhang, L.; Hu, D.; Salmain, M.; Mazouzi, Y.; Flack, R.; Liedberg, B.; Boujday, S. Core−Shell Gold/Silver Nanoparticles for Localized Surface Plasmon Resonance-Based Naked-Eye Toxin Biosensing. ACS Appl. Mater. Interfaces 2019, 11, 46462–46471. [Google Scholar] [CrossRef] [PubMed]
  4. Haes, A.J.; Hall, W.P.; Chang, L.; Klein, W.L.; Van Duyne, R.P. A localized surface plasmon resonance biosensor: First steps toward an assay for Alzheimer’s disease. Nano Lett. 2004, 4, 1029–1034. [Google Scholar] [CrossRef]
  5. Grammatikopoulos, S.; Pappas, S.D.; Dracopoulos, V.; Poulopoulos, P.; Fumagalli, P.; Velgakis, M.J.; Politis, C. Self-assembled au nanoparticles on heated corning glass by dc magnetron sputtering: Size-dependent surface plasmon resonance tuning. J. Nanoparticle Res. 2013, 15, 1446. [Google Scholar] [CrossRef] [Green Version]
  6. Xiao, T.; Huang, J.; Wang, D.; Meng, T.; Yang, X. Au and Au-Based nanomaterials: Synthesis and recent progress in electrochemical sensor applications. Talanta 2020, 206, 120210. [Google Scholar] [CrossRef]
  7. Guo, F.C.; Sun, T.; Cao, F.; Liu, Q.; Ren, Z. Metallic nanostructures for light trapping in energy-harvesting devices. Light Sci. Appl. 2014, 3, e161. [Google Scholar]
  8. Yang, Q.; Guo, X.; Wang, W.; Zhang, Y.; Xu, S.; Lien, D.H.; Wang, Z.L. Enhancing sensitivity of a single ZnO micro-/nanowire photodetector by piezo-phototronic effect. ACS Nano 2010, 4, 6285–6291. [Google Scholar] [CrossRef]
  9. Pallavicini, P.; Chirico, G.; Taglietti, A. Harvesting light to produce heat: Photothermal nanoparticles for technological applications and biomedical devices. Chem. Eur. J. 2021, 27, 15361–15374. [Google Scholar] [CrossRef] [PubMed]
  10. Zhu, W.; Esteban, R.; Borisov, A.G.; Baumberg, J.J.; Nordlander, P.; Lezec, H.J.; Aizpurua, J.; Crozier, K.B. Quantum mechanical effects in plasmonic structures with subnanometre gaps. Nat. Commun. 2016, 7, 11495. [Google Scholar] [CrossRef] [Green Version]
  11. Beni, A.A.; Jabbari, H. Nanomaterials for Environmental Applications. Results Eng. 2022, 15, 100467. [Google Scholar] [CrossRef]
  12. Sarychev, A.K.; Ivanov, A.; Lagarkov, A.; Barbillon, G. Light Concentration by Metal-Dilectric Micro-Resonators for SERS Sensing. Materials 2019, 12, 103. [Google Scholar] [CrossRef] [Green Version]
  13. Faupel, F.; Zaporojtchenko, V.; Strunskus, T.; Elbahri, M. Metal-Polymer Nanocomposites for Functional Applications. Adv. Eng. Mater. 2010, 12, 1177–1190. [Google Scholar] [CrossRef]
  14. Tokarev, I.; Minko, S. Tunable plasmonic nanostructures from noble metal nanoparticles and stimuli-responsive polymers. Soft Matter 2012, 8, 5980–5987. [Google Scholar] [CrossRef]
  15. Burtch, N.C.; Heinen, J.; Bennett, T.D.; Dubbeldam, D.; Allendorf, M.D. Mechanical properties in metal–organic frameworks: Emerging opportunities and challenges for device functionality and technological applications. Adv. Mater. 2018, 30, 1704124. [Google Scholar] [CrossRef]
  16. Heilmann, A. Polymer Films with Embedded Metal Nanoparticles; Springer: Berlin/Heidelberg, Germany, 2003. [Google Scholar]
  17. Yao, M.; Shen, P.; Liu, Y.; Chen, B.; Guo, W.; Ruan, S.; Shen, L. Performance improvement of polymer solar cells by surface-energyinduced dual plasmon resonance. ACS Appl. Mater. Interfaces 2016, 8, 6183–6189. [Google Scholar] [CrossRef] [PubMed]
  18. Bernardi, M.; Palummo, M.; Grossman, J.C. Extraordinary Sunlight absorption and one nanometer thick photovoltaics using two-dimensional monolayer materials. Nano Lett. 2013, 13, 3664–3670. [Google Scholar] [CrossRef] [PubMed]
  19. Venditti, I.; Fratoddi, I.; Russo, M.V.; Bearzotti, A. A nanostructured composite based on polyaniline and gold nanoparticles: Synthesis and gas sensing properties. Nanotechnology 2013, 24, 155503. [Google Scholar] [CrossRef]
  20. Pan, C.; Dong, L.; Zhu, G.; Niu, S.; Yu, R.; Yang, Q.; Liu, Y.; Wang, Z.L. High-resolution electroluminescent imaging of pressure distribution using a piezoelectric nanowire LED array. Nat. Photonics 2013, 7, 752–758. [Google Scholar] [CrossRef]
  21. Daniyal, W.M.E.M.M.; Fen, Y.W.; Abdullah, J.; Sadrolhosseini, A.R.; Mahdi, M.A. Design and Optimization of Surface Plasmon Resonance Spectroscopy for Optical Constant Characterization and Potential Sensing Application: Theoretical and Experimental Approaches. Photonics 2021, 8, 361. [Google Scholar] [CrossRef]
  22. Blattmann, C.O.; Sotiriou, G.A.; Pratsinis, S.E. Rapid synthesis of flexible conductive polymer nanocomposite films. Nanotechnology 2015, 26, 125601. [Google Scholar] [CrossRef]
  23. Dunklin, J.R.; Forcherio, G.T.; Berry, K.R., Jr.; Roper, D.K. Asymmetric Reduction of Gold Nanoparticles into Thermoplasmonic Polydimethylsiloxane Thin Films. ACS Appl. Mater. Interfaces 2013, 5, 8457–8466. [Google Scholar] [CrossRef] [PubMed]
  24. Andam, N.; Refki, S.; Ishitobi, H.; Inouye, Y.; Sekkat, Z. Optical Characterization of Ultra-Thin Films of Azo-Dye-Doped Polymers Using Ellipsometry and Surface Plasmon Resonance Spectroscopy. Photonics 2021, 8, 41. [Google Scholar] [CrossRef]
  25. Dunklin, J.R.; Bodinger, C.; Forcherio, G.T.; Roper, D.K. Plasmonic extinction in gold nanoparticle-polymer films as film thickness and nanoparticle separation decrease below resonant wavelength. J. Nanophotonics 2017, 11, 016002. [Google Scholar] [CrossRef]
  26. Ye, J.; Verellen, N.; Roy, W.V.; Lagae, L.; Maes, G.; Borghs, G.; Dorpe, P.V. Plasmonic Modes of Metallic Semishells in a Polymer Film. ACS Nano 2010, 4, 1457–1464. [Google Scholar] [CrossRef]
  27. Kapaklis, V.; Grammatikopoulos, S.; Sordan, R.; Miranda, A.; Traversi, F.; von Känel, H.; Trachylis, D.; Poulopoulos, P.; Politis, C. Nanolithographic Templates Using Diblock Copolymer Films on Chemically Heterogeneous Substrates. J. Nanosci. Nanotechnol. 2010, 10, 6056–6061. [Google Scholar] [CrossRef] [PubMed] [Green Version]
  28. Gaylord, T.K.; Moharam, M.G. Rigorous coupled-wave analysis of antireflective surface-relief gratings. J. Opt. Soc. Am. A 1986, 3, 1780–1787. [Google Scholar]
  29. Lee, M.S.L.; Lalanne, P.; Rodier, J.C.; Chavel, P.; Cambril, E.; Chen, Y. Imaging with blazed-binary diffractive elements. J. Opt. A Pure Appl. Opt. 2002, 4, 358. [Google Scholar] [CrossRef]
  30. Kapaklis, V.; Poulopoulos, P.; Karoutsos, V.; Manouras, T.; Politis, C. Growth of thin Ag films produced by radio frequency magnetron sputtering. Thin Solid Film. 2006, 510, 138–142. [Google Scholar] [CrossRef]
  31. Garoufalis, C.; Poulopoulos, P.; Bouropoulos, N.; Barnasas, A.; Baskoutas, S. Growth and optical properties of Fe2O3 thin films: A study of quantum confinement effects by experiment and theory. Phys. E Low-Dimens. Syst. Nanostruct. 2017, 89, 67–71. [Google Scholar] [CrossRef]
  32. Karoutsos, V. Scanning probe microscopy: Instrumentation and applications on thin films and magnetic multilayers. J. Nanosci. Nanotechnol. 2009, 9, 6783–6798. [Google Scholar] [CrossRef]
  33. Escobar, M.A.; Magana, L.F.; Valenzuela, R. Effect of the grain size distribution on the magnetization curve. J. Appl. Phys. 1985, 57, 2142–2147. [Google Scholar] [CrossRef]
  34. Vasisht, S.; Shirokoff, J. Preferred orientations in nano nanogold/silica/silicon interfaces. Appl. Surf. Sci. 2010, 256, 4915–4923. [Google Scholar] [CrossRef]
  35. Scaffardi, L.B.; Pellegri, N.; Sanctis, O.; Tocho, J.O. Sizing gold nanoparticles by optical extinction spectroscopy. Nanotechnology 2005, 16, 158–163. [Google Scholar] [CrossRef]
  36. Chronis, A.G.; Stamatelatos, A.; Grammatikopoulos, S.; Sigalas, M.M.; Karoutsos, V.; Maratos, D.M.; Lysandrou, S.P.; Trachylis, D.; Politis, C.; Poulopoulos, P. Microstructure and plasmonic behavior of self-assembled silver nanoparticles and nanorings. J. Appl. Phys. 2019, 125, 23106. [Google Scholar] [CrossRef]
  37. Tsarmpopoulou, M.; Chronis, A.G.; Sigalas, M.; Stamatelatos, A.; Poulopoulos, P.; Grammatikopoulos, S. Calculation of the Localized Surface Plasmon Resonances of Au Nanoparticles Embedded in NiO. Solids 2022, 4, 55–65. [Google Scholar] [CrossRef]
  38. Stamatelatos, A.; Tsarmpopoulou, M.; Chronis, A.G.; Kanistras, N.; Anyfantis, D.I.; Violagi, E.; Geralis, D.; Sigalas, M.; Poulopoulos, P. Optical interpretation for plasmonic adjustment of nanostructured Ag-NiO thin films. Int. J. Mod. Phys. B 2021, 35, 2150093. [Google Scholar] [CrossRef]
  39. Stamatelatos, A.; Sousanis, A.; Chronis, D.; Sigalas, M.; Grammatikopoulos, S.; Poulopoulos, P. Analysis of localized surface plasmon resonances in gold nanoparticles surrounded by copper oxides. J. Appl. Phys. 2018, 123, 083103. [Google Scholar] [CrossRef]
  40. Available online: https://polymerdatabase.com/polymer%20physics/Ref%20Index%20Table%20.html (accessed on 12 February 2022).
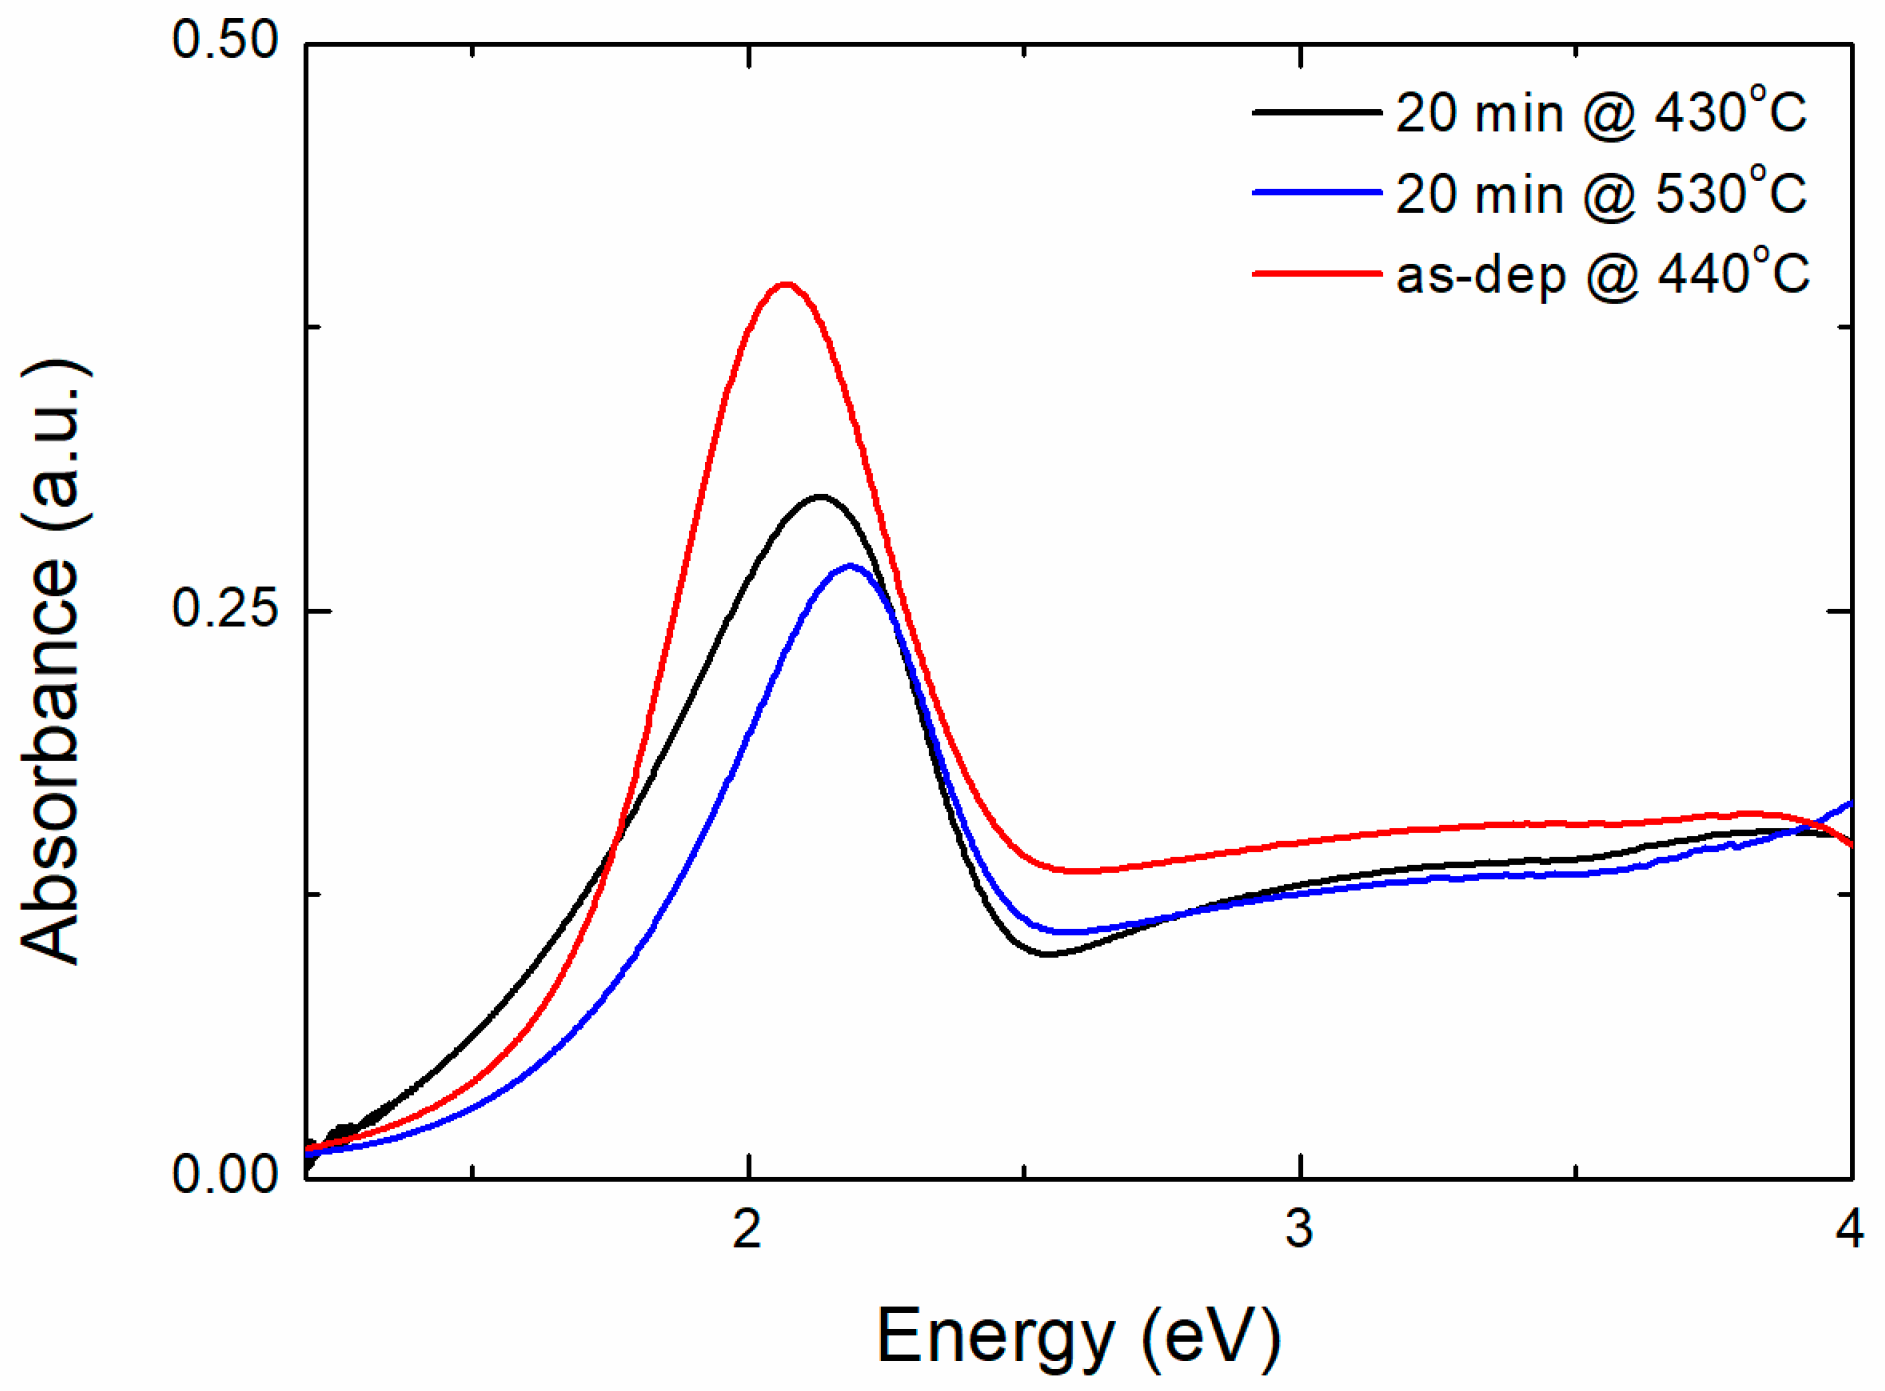
Figure 1. UV-vis. spectra for three Au films self-organized as NPs. The preparation conditions are indicated. Nominal film thickness th = 10 nm.
Photonics 10 00408 g001
Figure 2. (a,b) AFM images for 10 nm Au thin film after annealing at 430 °C and deposited at 440 °C, respectively. The scale is the same for both images and appears at the down right corner of (b). (c,d) show the size distribution of the NPs diameter of (a) and (b), respectively.
Photonics 10 00408 g002
Figure 3. UV-vis. spectra for three Au films self-organized in situ as NPs. The nominal film thickness th is indicated.
Photonics 10 00408 g003
Figure 4. (a,b) AFM images for th = 5 and 15 nm, respectively. (c,d) show the size distribution of the NPs diameter of (a,b), respectively.
Photonics 10 00408 g004
Figure 5. (a) LSPR position and (b) LSPR FWHM for six self-organized Au-films as a function of the Au nanoparticle diameter. The lines serve as a guide to the eye.
Photonics 10 00408 g005
Figure 6. UV-vis. spectra for three Au films self-organized in situ as NPs. The “nominal film thickness” th is (a) 5 nm, (b) 10 nm and (c) 15 nm. The films are uncoated or covered by various polymers, as indicated by colors in (a).
Photonics 10 00408 g006
Figure 7. The studied system Au NPs (side view (left) and top view (right)), where a is the lattice constant, d the diameter and t the height of the nanoparticles.
Photonics 10 00408 g007
Figure 8. LSPRs of Au NPs with diameter of 25 nm coated by various polymeric materials (a) t1 = 35 nm. (b) t1 varying by one order of magnitude exactly as in the experimental data; the LSPR for the uncoated case is also included. (c) The effect of increasing gradually the refractive index of the coating between the one of air (n = 1) and the real ones of the polymers (n~1.5).
Photonics 10 00408 g008
Figure 9. LSPRs of Au NPs in various polymeric matrices (a) PMMA, (b) PiP. NPs d is indicated.
Photonics 10 00408 g009
Table 1. Nominal thickness th, coating type, LSPR position, FWHM, and ratio of intensities LSPRcoat/LSPRuncoat of coated to uncoated NPs. For the 15 nm case, the FWHM and ratio of LSPRs may have larger errors in their determination as the onset of the LSPRs seems to be located below 1.1 eV, which is the minimum energy of the measurements.
th (nm)CoatingLSPR
Position (eV)
FWHM (eV) LSPRcoat/LSPRuncoat
5-2.150.361.0
PS-b-PBD-b-PS2.070.37 0.93
PS-co-PMMA2.080.371.06
PS-b-PI-b-PS2.080.380.68
10-2.070.421.0
PS-b-PBD-b-PS1.980.411.03
PS-co-PMMA1.980.441.08
PS-b-PI-b-PS1.940.451.23
15-2.010.501.0
PS-b-PBD-b-PS1.910.531.13
PS-co-PMMA1.850.550.77
PS-b-PI-b-PS1.900.500.94
Disclaimer/Publisher’s Note: The statements, opinions and data contained in all publications are solely those of the individual author(s) and contributor(s) and not of MDPI and/or the editor(s). MDPI and/or the editor(s) disclaim responsibility for any injury to people or property resulting from any ideas, methods, instructions or products referred to in the content.